Embed Size (px)
Citation preview
U.S. rural adults’ consumption of fruits and vegetables: Who is consuming at
least five servings daily?
M. Nawal Lutfiyya, PhD; 1 Linda Chang, PharmD, MPH; 2 and
Martin S. Lipsky, MD, MS2
1 Essentia Institute of Rural Health, Division of Research, 502 East 2nd Street,
Duluth, MN 55805
2 Department of Community and Family Medicine, University of Illinois-Chicago College
of Medicine at Rockford, 1601 Parkview Avenue, Rockford, Il 61107
Corresponding Author: M. Nawal Lutfiyya, PhD
Address: Essentia Institute of Rural Health, Division of Research, 503 East Third
Street, Duluth, MN 55805
Voice: 218-786-8118
E-mail: [email protected]
Key Words: rural health, fruit and vegetable consumption, adult nutrition, BRFSS
Running Title: rural adults’ fruit and vegetable consumption
Manuscript Word Count: 3670
Abstract Word Count: 240
Tables: 5
Figures: 1
An earlier draft of this paper was presented to the annual meeting of the National Rural
Health Association, 3–6 May 2011, Austin Texas

rural adults’ fruit and vegetable consumption
2
Abstract
Objective: Adequate fruit and vegetable consumption reduces the risk for several major
causes of morbidity and mortality. We examined differences in fruit and vegetable
consumption between U.S. rural and non-rural adults and identified associated
characteristics.
Methods: Bivariate and multivariate techniques were used to analyze 2009 Behavioral
Risk Factor Surveillance Survey (BRFSS) data. Prevalence differences were mapped
by U.S. state using GIS software.
Results: Logistic regression analysis revealed that U.S. rural adults consuming at least
five daily servings of fruits and vegetables were more likely to be: female; African
American, Hispanic or racially other; married or living with a partner; living in a
household without children; living in a household whose annual income was at least
$35,000; and getting at least moderate physical activity. They were also more likely to
have: a BMI of <30; have a personal physician; have had a routine medical exam in the
past 12 months; self-define their health as good to excellent and to have deferred
medical care because of cost. When comparing the standardized percent differences
between rural and non-rural U.S. adults by state, 37 States had smaller proportions of
rural adults consuming five or more daily servings of fruits and vegetables and 11
States a higher proportion of rural adults consuming five or more daily servings of fruits
and vegetables.
Conclusions: Findings should be helpful to those interested in developing interventions
aimed at increased consumption of recommended daily servings of fruits and
vegetables.

rural adults’ fruit and vegetable consumption
3
Introduction
Similar to U.S. Healthy People objectives (e.g., HP 2000 and HP 2010), Healthy
People 2020 (HP2020) [1] also contains nutrition related objectives that include
increasing the consumption of both fruits and vegetables by Americans. The HP 2020
objectives for fruit and vegetable consumption echo the 2010 Dietary Guidelines for
Americans that recommend an increase in vegetable and fruit intake for all aged 2 years
and older. [2]Furthermore, the newly released guidelines emphasize the importance of
consuming a variety of vegetables (i.e. dark-green, red, orange vegetables) and beans
and peas.[2] Increasing the consumption of fruits and vegetables is deemed an
important public health issue since adequate fruit and vegetable consumption may
reduce the risk for several major causes of morbidity and mortality in the U.S. including:
type 2 diabetes, [3] heart disease,[4–5] stroke [6] and obesity. [3–6] In addition,
research also suggests that diets rich in fruits and vegetables are associated with a
lower incidence of epithelial cancers of the alimentary and respiratory tracks.[7-8]
In addition to reducing the risk of developing many chronic diseases, there is an
increasing and compelling body of clinical evidence supporting the benefit of diet and
physical activity in not only health maintenance and disease prevention but also for
disease treatment, a process referred to as Medical Nutrition Therapy (MNT). [9] MNT is
an essential component in the management of conditions such as type 2 diabetes, heart
disease, hyperlipidemia, stroke and obesity. [10-12] Several widely disseminated clinical
practice guidelines advise eating diets high in whole foods such as fruit, vegetables, and
whole grains along with limiting animal protein and avoiding high energy low nutrient
foods as an important component of disease management. There is also a growing

rural adults’ fruit and vegetable consumption
4
body of medical research demonstrating that diets rich in fruits and vegetables reduce
the risk of cancer, suggesting that dietary choice can be an important cancer prevention
measure. [13–15]
Another key HP2020 objective is to identify and track health inequities with the
goal of eradicating disparities among segments of the population. Individuals living in
rural settings are one population identified as being at risk for health disparities.[1–17]
While researchers have identified fruit and vegetable intake differences by race and
ethnicity, [18-20] age, [21-22] socioeconomic factors [23-24] and sex, [21, 25] there is
little research about the consumption of fruits and vegetables by rural populations.
Those published studies examining fruit and vegetable intake by populations living in
rural areas either focused on regional or narrowly defined U.S. populations (e.g.,
seniors or only Hispanic and African American groups) or populations in developing
countries (e.g., India) or other settings outside the U.S. (e.g., France).[26-28]
This study examined the differences in daily fruit and vegetable consumption
between U.S. rural and non-rural adults and explored what characteristics were
associated with rural adults consuming at least five daily servings of combined fruits and
vegetables.
Methods
We examined data from the 2009 Behavioral Risk Factor Surveillance Survey
(BRFSS), to determine if there were disparities and/or differences between rural and
non-rural adults in regard to the daily consumption of at least five daily servings of
combined fruits and vegetables. The study used 2009 BRFSS data, the most recent

rural adults’ fruit and vegetable consumption
5
year of data collected and available for analysis. BRFSS is a cross-sectional, random
digit telephone survey that is a collaborative project of the Centers for Disease Control
and Prevention (CDC) and all U.S. states and territories. The survey measures several
behavioral risk factors in the adult population aged 18 years and older. Its objective is to
collect uniform, state-specific data on preventive health practices and risk behaviors
linked to chronic diseases, injuries and preventable infectious diseases in the non-
institutionalized adult U.S. population.
In this survey, data are collected from a random sample of adults (one per
household). A more detailed description of the sampling methodology of BRFSS is
available elsewhere. [29] All BRFSS data are self-reported responses to mostly forced-
choice questions. No additional data are generated to corroborate or substantiate the
self-reported responses. As recommended by the Center for Disease Control, all
analyses were performed on weighted data. The weighting provides a stratified
representation of the US adult non-institutionalized population.
For our study, a single year of data for the year 2009 of non-institutionalized U.S.
adults (n=405,556) were analyzed, and these data were weighted to represent
219,479,823 U.S. adults. From the 2009 dataset, 99,207 U.S. adults were identified as
consuming at least 5 servings of fruits and vegetables daily and were then weighted to
represent 52,259,789 U.S. adults of which 8,983,840 were identified as living in rural
locales.
The Metropolitan Statistical Area (MSA) variable included in BRFSS was used to
define place of residence as either rural or non-rural. Rural residents were defined as
persons living either within an MSA that had no city center or outside an MSA. Non-rural

rural adults’ fruit and vegetable consumption
6
residents included all respondents living in a city center of an MSA, outside the city
center of an MSA but inside the county containing the city center, or inside a suburban
county of the MSA.
The dependent variable for this analysis was: consumption of at least 5 daily
servings of fruits and vegetables. This was a calculated variable derived from survey
participant responses to several questions asked by the interviewer administering the
survey. In addition, a number of independent variables were included in the analysis.
These were: sex, race and ethnicity, age, education, marital status, children in
household, household income, body mass index (BMI), health insurance status, having
a personal physician, timing of last routine medical check-up, deferment of medical care
because of cost, self-defined health status, and physical activity. A number of these
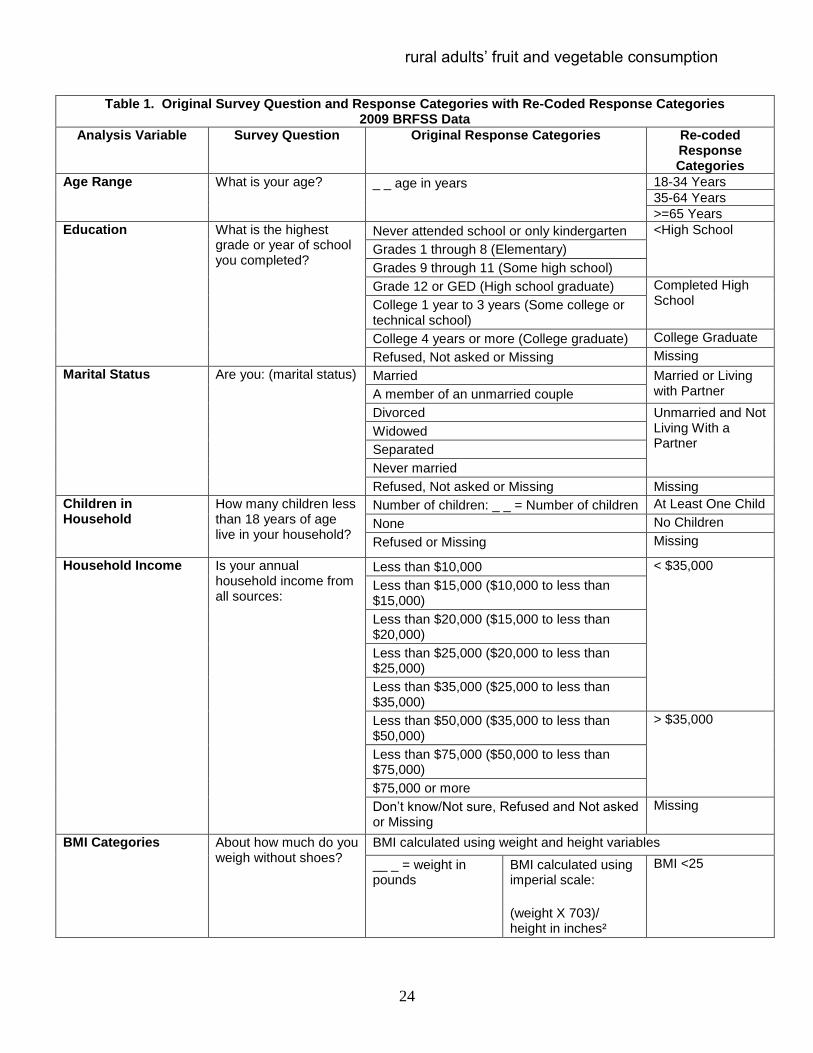
covariates were re-coded from their original formulation for use in this analysis. Table 1
summarizes the original survey questions and response categories with the re-coded
response categories.
For all variables included in the analyses reported on here, the categories of
refused or don’t know or missing were re-coded as missing and not included in the data
analysis. Age and number of children in the household were the only continuous
variables re-coded as categorical ones. The variables education, marital status,
household income, have a personal physician, timing of last routine medical check-up,
and self-defined health status all had multiple categories that were collapsed into fewer
categories for analysis. Race and ethnicity, BMI categories, and physical activity were
all calculated variables derived from the responses to several survey questions.

rural adults’ fruit and vegetable consumption
7
Race and ethnicity was calculated from participant responses to two separate
survey questions---one regarding race and the other regarding Latino/Hispanic ethnicity.
Combining the responses to these two questions allowed for the derivation of the race
and ethnicity variable used in theses analyses. All race/ethnicity categories were
computed as mutually exclusive entities. For example all respondents coded as
Caucasian chose White as their racial classification, likewise black for African American,
etc. If a respondent identified themselves as Hispanic, they were classified by that
ethnic category regardless of any additional racial classification.
BMI was calculated from two survey questions, the first asking the respondents
height in feet and inches and the second their weight in pounds. The BMI formula for
imperial measurement (BMI=weight in pounds X 703/height in inches2) was then used
to calculate BMI and code the resultant number into one of three categories: BMI less
than 25 (neither overweight nor obese), BMI equal to or greater than 25 - less than 30
(overweight), and BMI equal to or greater than 30 (obese).
Level of physical activity was calculated by combining other variables assessing
physical activity level by: 1) whether or not a person was getting recommended levels of
moderate physical activity, and 2) whether or not a person was getting recommended
levels of vigorous physical activity. People who reported getting recommended levels of
either moderate or vigorous physical activity were coded as getting at least
recommended levels of moderate physical activity. Recommended levels of moderate
physical activity were defined as: moderate-intensity activities such as brisk walking for
at least 30 minutes per day, at least five days a week.

rural adults’ fruit and vegetable consumption
8
Multivariate logistic regression was performed to characterize U.S. adults
consuming at least five daily servings of combined fruits and vegetables. Two models
were performed – one that included only rural adults, and one including only non-rural
adults. Additionally, ArcView version 10.0 (ESRI, Redlands, CA) was used to map the
percent differences by State between rural and non-rural adults consuming five or more
daily servings of fruits and vegetables. For this calculation and mapping effort the
percent of non-rural adults consuming at least five daily servings of fruits and
vegetables by state was compared to the percent of their rural counterparts in the same
state. Displayed on the map are both states where the percentage of rural adults
consuming five or more daily servings of fruits and vegetables was either greater than
or lesser than their non-rural counterparts doing the same.
For all statistical analyses, alpha was set at p< 0.05. Statistical Package for
Social Scientists (SPSS, IBM, Chicago, IL) version 19.0 was used to complete all
statistical analyses performed for this study. Human subject approval was sought and
received from Essentia Health’s IRB as well as the University of Illinois, College of
Medicine at Rockford’s IRB.
Results
Bivariate analysis revealed that in comparison to U.S. non-rural adults U.S. rural
adults were less likely to consume five or more servings of fruits and vegetables. Table
2 also displays additional comparative data for U.S. non-rural and rural adults
regardless of daily consumption of fruits and vegetables. Most notably higher
proportions of rural adults when compared to non-rural ones were: Caucasian, older (>

rural adults’ fruit and vegetable consumption
9
65 years of age), heavier (BMI > 30), less educated (college graduation), poorer
(household income <$35,000), married or living with a partner, and without health
insurance. Further, a higher proportion of rural vs. non-rural adults: did not have
children living at home, had not had a routine medical check-up in the past 12 months,
and self-defined their health as fair to poor rather than good to excellent.
Table 3 displays the results of a comparative bivariate analysis of non-rural and
rural U.S. adults consuming at least five servings of fruits and vegetables daily. This
analysis revealed similar patterns of consumption for both non-rural and rural adults.
For instance, a greater proportion of women from both populations consumed at least
five servings of fruits and vegetables daily. Similarly, a greater proportion of both rural
and non-rural adults who had at least moderate levels of physical activity, who were
married or living with a partner, who had no children living at home, and who defined
their health as good to excellent consumed at least five servings of fruits and
vegetables daily. Of interest were the difference in the racial/ethnicity composition
among adults consuming at least five daily servings of fruits and vegetables.
Specifically, there was a 42.4% difference between the percentage of non-Caucasian
rural adults (18.8%) and non-Caucasian non-rural adults (32.7%) consuming at least
five daily servings of fruits and vegetables.
Table 4 displays the results of the two multivariate models. Consumption of at
least 5 daily servings of fruits and vegetables was the dependent variable for both
models. The first model included only rural adults and the second only non-rural ones.
The logistic regression analysis revealed that rural adults whose daily consumption of
fruits and vegetables included at least five servings were more likely to be: female

rural adults’ fruit and vegetable consumption
10
(OR=1.666; 95% CI 1.663, 1.669) rather than male; African American (OR=1.127; 95%
CI 1.123, 1.131), Hispanic (OR=1.474; 95% CI 1.469, 1.479) or racially other
(OR=1.251; 95% CI 1.246, 1.255) rather than Caucasian; married or living with a
partner (OR=1.071; 95% CI 1.069, 1.073) rather than single; living in a household
without children (OR=1.052; 95% CI 1.050, 1.054); living in a household whose annual
income is at least $35,000 (OR=1.111; 95% CI 1.108, 1.113) compared to an income
than less than $35,000; and getting at least moderate physical activity (OR=1.881; 95%
CI 1.878, 1.885) rather than being inactive. Rural adults consuming five or more
servings of vegetables daily were also more likely to have: a BMI of <25 (OR=1.126;
95% CI 1.124, 1.129) or a BMI of 25 to <30 (OR=1.066; 95% CI 1.064, 1.068) rather
than > 30; have a personal physician (OR=1.045; 95% CI 1.042, 1.047); have had a
routine medical exam in the past 12 months (OR=1.224; 95% CI 1.222, 1.226); and
self-define their health as good to excellent (OR=1.148; 95% CI 1.145, 1.151) rather
than fair to poor. Rural adults consuming at least 5 daily servings of fruits and
vegetables were also more likely to have deferred medical care because of cost.
Rural adults consuming at least 5 daily servings of fruits and vegetables were
approximately 33% less likely to be younger (18-34 years or 35-64 years) than older (65
or older). They also were 35.3% to 47.3% less likely of being educated beyond high
school (have less than a high school education or being a high school graduate) than
being a college graduate. With only slight variations in degree or magnitude of the odds
ratios these patterns were the same for non-rural adults.
Table 5 displays the percentage of rural and non-rural adults consuming 5 or
more daily servings of fruits and vegetables by State. Also displayed in Table 5 are the

rural adults’ fruit and vegetable consumption
11
standardized percent differences between the proportion of rural and non-rural adults
consuming 5 or more daily servings of fruits and vegetables. The proportions for rural
adults ranged from a low of 13.88% in Oklahoma to a high of 28.74 % in Vermont. For
non-rural adults the proportions ranged from a low of 14.44% in Oklahoma to a high of
28.27% in Maine.
The percent differences are presented in Figure 1 according to states with either
smaller or larger proportions of the rural adult population consuming 5 or more daily
servings of fruits and vegetables in comparison to their non-rural counterparts. When
comparing the standardized percent differences between the two populations (rural and
non-rural) 37 States had smaller proportions of rural adults consuming 5 or more daily
servings of fruits and vegetables and 11 States a higher proportion of rural adults
consuming 5 or more daily servings of fruits and vegetables. In two States (New Jersey
and Rhode Island) no data on the fruit and vegetable consumption of rural adults was
available.
Of the 11 states where a higher proportion of rural adults consumed at least 5
daily servings of fruits and vegetables when compared to the non-rural adult population,
only one State, Hawaii, was ranked in the top 10 states for fruit and vegetable
production. An additional state, Arizona, ranked in the top 20 of fruit and vegetable
producing States.
Discussion
Chronic disease accounts for about 75% of the health care costs in the United
Sates and several studies document the benefits of a healthy diet for weight control,
rural adults’ fruit and vegetable consumption
12
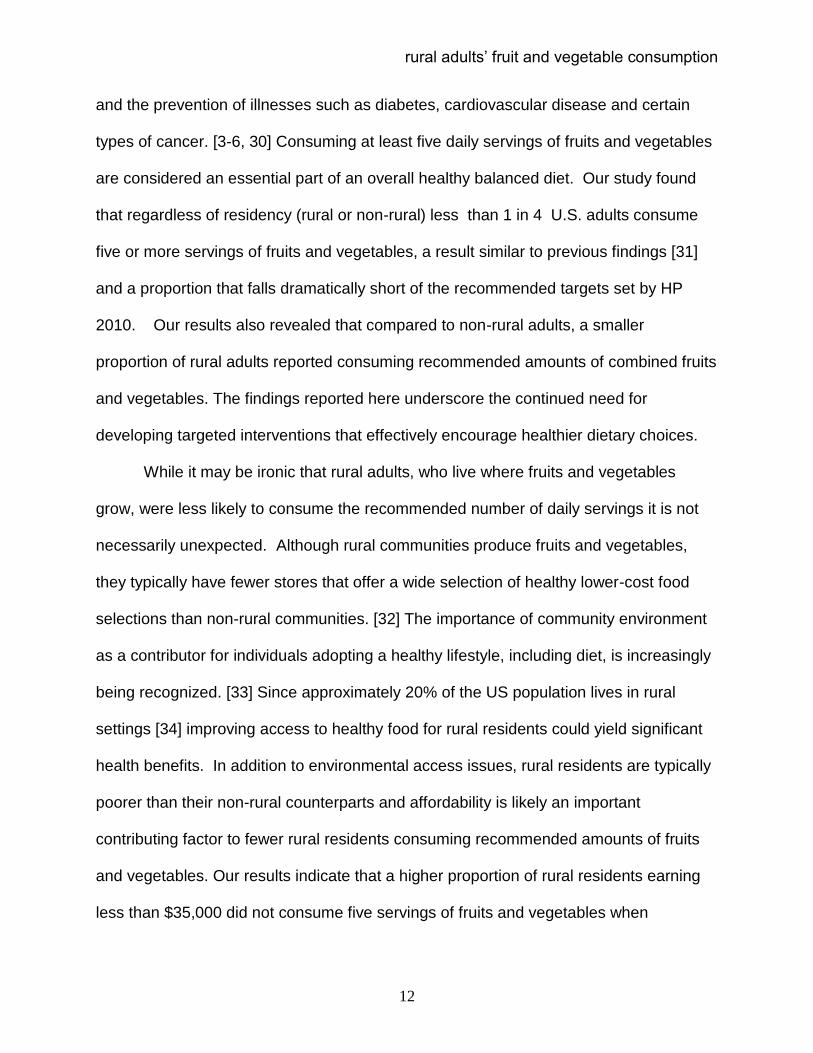
and the prevention of illnesses such as diabetes, cardiovascular disease and certain
types of cancer. [3-6, 30] Consuming at least five daily servings of fruits and vegetables
are considered an essential part of an overall healthy balanced diet. Our study found
that regardless of residency (rural or non-rural) less than 1 in 4 U.S. adults consume
five or more servings of fruits and vegetables, a result similar to previous findings [31]
and a proportion that falls dramatically short of the recommended targets set by HP
2010. Our results also revealed that compared to non-rural adults, a smaller
proportion of rural adults reported consuming recommended amounts of combined fruits
and vegetables. The findings reported here underscore the continued need for
developing targeted interventions that effectively encourage healthier dietary choices.
While it may be ironic that rural adults, who live where fruits and vegetables
grow, were less likely to consume the recommended number of daily servings it is not
necessarily unexpected. Although rural communities produce fruits and vegetables,
they typically have fewer stores that offer a wide selection of healthy lower-cost food
selections than non-rural communities. [32] The importance of community environment
as a contributor for individuals adopting a healthy lifestyle, including diet, is increasingly
being recognized. [33] Since approximately 20% of the US population lives in rural
settings [34] improving access to healthy food for rural residents could yield significant
health benefits. In addition to environmental access issues, rural residents are typically
poorer than their non-rural counterparts and affordability is likely an important
contributing factor to fewer rural residents consuming recommended amounts of fruits
and vegetables. Our results indicate that a higher proportion of rural residents earning
less than $35,000 did not consume five servings of fruits and vegetables when

rural adults’ fruit and vegetable consumption
13
compared to their non-rural counterparts. Food costs correlate to store type and food
tends to be less expensive in larger supermarkets than smaller markets or convenience
stores. These higher priced food outlets may be the only local and convenient food
source for some rural communities. In addition to a convenience factor, transportation
costs may be a barrier to purchasing less expensive healthier food that might be
available in a nearby community.
Our findings also reveal several differences in the consumption of fruits and
vegetables by characteristics such as gender, age, education, race/ethnicity, physical
activity and reported health status. Similar to other studies, [18-25] this study found that
women and those with more education were more likely to consume the recommended
number of daily servings of fruits and vegetables. Likewise rural adults over age 65
were more likely to eat at least five servings of fruits and vegetables daily. Data
regarding race and ethnicity from previous studies are mixed. In some studies,
Caucasians consumed more fruits and vegetables than African Americans while other
studies using national data demonstrated the converse. [35-38] Our study found that
Caucasians were less likely to consume five servings of fruits and vegetables and that
the difference was greater for Caucasians living in rural settings, even though they
tended to be better educated and have higher income levels than rural non-Caucasians.
The reasons for this difference are not clear and further study to confirm this finding and
to understand the reasons why may be helpful in tailoring interventions to improve
dietary choices among rural residents. Those engaging in regular physical activity and
with a lower BMI were also more likely to consume five servings of fruits and
vegetables. While physical activity and weight does not directly affect diet choices, our

rural adults’ fruit and vegetable consumption
14
findings add to the body of knowledge that unhealthy lifestyles choices tend to coexist
or cluster among individuals. [35]
Finally, of interest is the distribution of fruit and vegetable consumption by rural
and non-rural adults by state. This distribution indicated that in only 11 states did a
higher proportion of rural adults consume five or more daily servings of fruits and
vegetables than non-rural adults. The reason for this distribution is unclear especially
since of those 11 states only one, Hawaii, ranked as a top ten U.S. State for fruit and
vegetable production. This finding does suggest the need for further investigation---
specifically, are there differences between the rural populations in the states where
adults are consuming five or more daily servings of fruits and vegetables and those
states where such is not occurring? This might provide insight into the role that
community environment plays in diets and for what strategies for improving diets might
be best suited to a rural settings
Several potential limitations to this study should be noted. First, the survey is
based on telephone derived data and may be skewed because those who could not be
reached by phone could not participate in the survey. For example, persons of lower
socioeconomic status may have been excluded because of poorer phone access.
However, the fact that the vast majority of US residents live in households with
telephones minimizes this bias. Furthermore, U.S. cell phone numbers are now
included in the pool of phones contacted for the survey. In addition, study strength is the
use of a large multi-state database that includes a robust sample of rural residents
weighted to reflect the demographics of rural vs. non-rural US populations.
rural adults’ fruit and vegetable consumption
15
A second limitation is that the survey used close-ended questions, which limit a
responder’s options to fully explain response choices. However, while a different
question format may have yielded different results, the survey questions were worded
so that the answer choices covered a wide range of response possibilities. A third and
related limitation is that the answers are self-reported, which introduces the possibility of
recall bias on the part of the survey participants.
Fourthly, the question asking respondents about the number of servings of
vegetables is somewhat ambiguous and may have led to an under-reporting of the
number of servings of vegetables consumed. For instance no refined measure
consumption was included hence eating vegetables at both lunch and dinner may in
actuality constitute more than 2 servings depending upon the amount of vegetables
consumed. Furthermore, the questions did not include vegetable prepared in meals
such as stews or soups.
A fifth potential bias resulted from the languages of the survey – English and
Spanish. Individuals who did not speak English or Spanish were excluded from this
survey. Not all U.S. residents speak the two languages of this survey as a result those
adults from other cultures who do not speak either English or Spanish and who have
vegetable rich (e.g., Chinese) or fruit and vegetable rich (e.g., Mediterranean) diets may
have been excluded and as a result the aggregated data on the consumption of fruits
and vegetables may not be representative of actual consumption by all adults who are
residing in the United States.

rural adults’ fruit and vegetable consumption
16
Conclusion
In conclusion, most Americans do not eat the recommended amounts of fruits
and vegetables. However, rural residents appear at greater risk for not making healthy
dietary choices. In addition to rural populations---men, younger individuals and those
with less education and those living in poorer income households---are at even greater
risk. Successfully improving the dietary patterns of Americans will need to incorporate
the environmental context in which people live and the results of this study. These
findings should be helpful for public health practitioners interested in developing
interventions aimed at improving the diets and health of Americans.

rural adults’ fruit and vegetable consumption
17
References
1. Centers for Disease Control and Prevention. (2011). Healthy People 2020.
http://www.healthypeople.gov/2020 (accessed 11 April 2011).
2. Centers for Disease Control and Prevention. (2011). Dietary Guidelines for
Americans. http://www.cnpp.usda.gov/dietaryguidelines.htm (accessed 11 April 2011).
3. Troughton, J., Khunti, K., Melanie, J., and Davies, M.J. (2010). Fruit and vegetable
intake and incidence of type 2 diabetes mellitus: systematic review and meta-analysis.
BMJ, 18;341:c4229.
4. Aatola, H., Koivistoinen, T., Hutri-Kähönen, N., Juonala, M., Mikkilä, V., Lehtimäki, T.,
et al. (2010). Lifetime fruit and vegetable consumption and arterial pulse wave velocity
in adulthood: The Cardiovascular Risk in Young Finns Study. Circulation, 122(4):2521-
2528.
5. Dauchet, L., Amouyel, P., Hercberg, S., and Dallongeville, J. (2006). Fruit and
vegetable consumption and risk of coronary heart disease: a meta-analysis of cohort
studies. J Nutr, 136(10): 2588-2593.
6. He, F.J., Nowson, C.A., and MacGregor, G.A. (2006). Fruit and vegetable
consumption and stroke: meta-analysis of cohort studies. Lancet, 367(9507):320-326.
7. Dubowitz, T., Heron, M., Bird, C.E., Lurie, N., Finch, B.K., Basurto-Da´vila, R., Hale,
L., and Escarce, J.J. (2008). Neighborhood socioeconomic status and fruit and
vegetable intake among whites, blacks, and Mexican Americans in the United States.
Am J Clin Nutr, 87(6):1883–91.
8. Fernández, E., Gallus, S., and La Vecchia, C. (2006). Nutrition and cancer risk: an
overview. J Br Menopause Soc, 12(4):139-142.

rural adults’ fruit and vegetable consumption
18
9. Wood OB. Nutrition in Pharmacy Practice. Chapter 100.
10. Chobanian, A.V., Bakris, G.L., Black, H.R., Cushman, W.C., Green, L.A., Izzo, J.L.
Jr, et al. (2003). The Seventh Report of the Joint National Committee on Prevention,
Detection, Evaluation, and Treatment of High Blood Pressure: the JNC 7 report. JAMA,
289(19):2560-2571.
11. Sacks, F.M., Svetkey, L.P., Vollmer, W.M., Appel, L.J., Bray, G.A., Harsha, D., et al.
(2001). The Effects on Blood Pressure of Reduced Dietary Sodium and the Dietary
Approaches to Stop Hypertension (DASH) Diet. NEJM, 344(1):3-10.
12. Expert Panel on Detection, Evaluation, and Treatment of High Blood Cholesterol in
Adults. (2001). NCEP III Guideline. JAMA, 285(19):2486-2497.
13. Lee, J.E., Männistö, S., Spiegelman, D., Hunter, D.J., Bernstein, L., Van Den
Brandt, P.A., et al. (2009). Intakes of fruit, vegetables, and carotenoids and renal cell
cancer risk: a pooled analysis of 13 prospective studies. Cancer Epidemiol Biomarkers
Prev, 18 (6):1730-9.
14. Büchner, F.L., Bueno-de-Mesquita, H.B., Ros, M.M., Overvad, K., Dahm, C.C.,
Hansen, L., et al. (2010). Variety of fruit and vegetable consumption and the risk of lung
cancer in the European prospective investigation into cancer and nutrition. Cancer
Epidemiol Biomarkers Prev,19(9): 2278-86.
15. Benetou, V., Orfanos, P., et al. (2008). Vegetables and fruits in relation to cancer
risk: evidence from the Greek EPIC cohort study. Cancer Epidemiol Biomarkers Prev,
17(2):387-92.
16. Wallace RB, Kohatsu N. (2008). Public Health and Preventive Medicine. (15th
Edition). New York: McGraw Hill Professional.

rural adults’ fruit and vegetable consumption
19
17. Lovasi, G.S., Hutson, M.A., Guerra, M., Neckerman, K.M. (2009). Built
Environments and Obesity in Disadvantaged Populations. Epidemiol Rev, 31:7–20.
18. Campbell, M. K., Demark-Wahnefried, W., Symons, M., Kalsbeek, W.D., Dodds, J.,
Cowan, A., Jackson, B., Motsinger, B., Hoben, K., Lashley, J., Demissie, S.,
McClelland, J.W. (1999). Fruit and Vegetable Consumption and Prevention of Cancer:
The Black Churches United for Better Health Project. Am J Public Health, 89(9):1390-
1396.
19. Devine, C.M., Wolfe, W.S., Frongillo, E.A., and Bisogni,C.A. (1999). Life-course
events and experiences: Association with fruit and vegetable consumption in 3 ethnic
groups. J Am Diet Assoc, 99(3): 309-314.
20. Yeh, M., Ickes, S.B., Lowenstein, L.M., Shuval, K., Ammerman, A.S., Farris, R., and
Katz, D.L. (2008). Understanding barriers and facilitators of fruit and vegetable
consumption among a diverse multi-ethnic population in the USA. Health Promotion
International, 23(1): 42-51.
21. Baker, A.H., and Wardle, J. (2003). Sex differences in fruit and vegetable intake in
older adults. Appetite, 40(3):269-275.
22. McCabe-Sellers, B.J., Bowman, S., Stuff, J.E., Champagne, C.M., Simpson, P.M.,
and Bogle, M.L. (2007). Assessment of the diet quality of US adults in the Lower
Mississippi Delta. Am J Clin Nutr, 86(3):697–706.
23. Eikenberry, N., and Smith, C. (2004). Healthful eating: perceptions, motivations,
Barriers, and promoters in low-income Minnesota communities. J Am Diet Assoc,
104(7):1158-1161.

rural adults’ fruit and vegetable consumption
20
24. Sisson, A. (2002). Fruit and Vegetable Consumption by Low-Income Americans.
Nutrition Noteworthy, Department of Biological Chemistry, UCLA, David Geffen School
of Medicine, UC Los Angeles. http://escholarship.org/uc/item/4kc331x6 (accessed 11
April 2011).
25. Montez, J.K., and Eschbach, K. (2008). Country of Birth and Language Are
Uniquely Associated with Intakes of Fat, Fiber, and Fruits and Vegetables among
Mexican-American Women in the United States. J Am Diet Assoc, 108(3): 473-480.
26. Hosler, A,S., Rajulu, D.T., Fredrick, B.L., and Ronsani, A.E. (2005). Assessing retail
fruit and vegetable availability in urban and rural underserved communities. Prev
Chronic Dis, 5(4):A123.
27. Sharkey, J.R., Johnson, C.M., and Dean, W.R. (2010). Food Access and
Perceptions of the Community and Household Food Environment as Correlates of Fruit
and Vegetable Intake among Rural Seniors. BMC Geriatrics, 10:32.
28. Kanungsukkasem, U., Ng, N., Minh, H.V., Razzaque, A., Ashraf, A., Juvekar, S.,
Ahmed, S.M., and Bich, T.H. (1988). Fruit and vegetable consumption in rural adults
population in INDEPTH HDSS sites in Asia. Global Health Action Supplement 1. DOI:
10.3402/gha.v2i0.
29. Mokdad, A.H., Stroup, D.F., and Giles, W.H. (2003). Public health surveillance for
behavioral risk factors in a changing environment: recommendations from the
Behavioral Risk Factor Surveillance Team. Morbidity and Mortality Weekly Report 52,
RR09.
30. Terry, P., Terry, J.B., and Wolk, A. (2001). Fruit and vegetable consumption in the
prevention of cancer: an update. J Intern Med, 250(4):280-290.

rural adults’ fruit and vegetable consumption
21
31. Blanck, H.M., Gillespie, C., Kimmons, J.E., Seymour, J.D., Serdula, M.K. (2008).
Trends in fruit and vegetable consumption among U.S. men and women, 1994–2005.
Prev Chronic Dis, 5(2):A35.
32. Liese, A.D., Weis, K.E., Pluto, D., Smith, E., and Lawson, A. (2007). Food store
types, availability, and cost of foods in a rural environment. J Am Diet
Assoc,107(11):1916-1923.
33. Glanz, K., Sallis, J.F., Saelens, B.E., and Frank, L.D. (2005). Healthy nutrition
environments: concepts and measures. Am J Health Promot,19(5):330-333.
34. Central Intelligence Agency World Factbook. 2011.
https://www.cia.gov/library/publications/the-world-factbook/geos/us.html (accessed 17
April 2011).
35. Deshmukh-Taskar, P., Nicklas, T.A., Yang, S.J., and Berenson, G.S. (2007). Does
food group consumption vary by differences in socioeconomic, demographic, and
lifestyle factors in young adults? The Bogalusa Heart Study. J Am Diet Assoc,
107(2):223-234.
36. Patterson, B.H., Harlan, L.C., Block, G., and Kahle, L. (1995). Food choices of
whites, blacks, and Hispanics: Data from the 1987 National Health Interview Survey.
Nutr Cancer, 23(2):105-119.
37. Gans, K.M., Burkholder, G.J., Risica, P.M., and Lasater, T.M. (2003). Baseline fat-
related dietary behaviors of white, Hispanic, and black participants in a cholesterol
screening and education project in New England. J Am Diet Assoc,103(6):699-706.
38. Champagne, C.M., Bogle, M.L., McGee, B.B., Yadrick, K., Allen, H.R., Kramer, T.R.,
Simpson, P., Gossett, J., and Weber, J. (2004). Dietary intake in the lower Mississippi

rural adults’ fruit and vegetable consumption
22
delta region: Results from the Foods of our Delta Study. J Am Diet Assoc, 104(2):199-
207.

rural adults’ fruit and vegetable consumption
23
Table 1. Original Survey Question and Response Categories with Re-Coded Response Categories 2009 BRFSS Data
Analysis Variable Survey Question Original Response Categories Re-coded Response Categories
Fruit and Vegetable Consumption
Not counting juice, how often do you eat fruit?
Calculated variable for consumed five or more servings of fruits or vegetables per day derived from the servings per day variables.
Respondents that reported they never consumed fruits and vegetables or consumed less than 5 servings per day
less than 5 servings per day
How often do you eat green salad?
Respondents that reported they consumed 5 or more servings of fruits and vegetables per day
5 or more servings of fruits and vegetables per day
Not counting carrots, potatoes, or salad, how many servings of vegetables do you usually eat? (Example: A serving of vegetables at both lunch and dinner would be two servings.)
Respondents who reported they didn’t know the servings consumed per day, those who refused to answer, and those with missing responses
Missing
Sex Indicate sex of respondent.
Male Male
Female Female
Race and Ethnicity Which one of these groups would you say best represents your race?
Race responses were combined with Hispanic variable to create the second column categories
White White, non-Hispanic Caucasian
Black or African American
Black non-Hispanic African American
Asian
Asian non-Hispanic
Other/multiracial
Native Hawaiian or Other Pacific Islander
Native Hawaiian or Other Pacific Islander non-Hispanic
American Indian, Alaska Native
American Indian, Alaska Native non-Hispanic
Other Other non-Hispanic
Multiracial but preferred race not asked
Multiracial non-Hispanic
Don’t know/Not sure, Refused
Don’t know/Not sure, Refused
Missing
Are you Hispanic or Latino?
Yes Hispanic Hispanic
No Non-Hispanic
Don’t know/Not Sure, Refused
Don’t know/Not Sure, Refused
Missing
rural adults’ fruit and vegetable consumption
24
Table 1. Original Survey Question and Response Categories with Re-Coded Response Categories 2009 BRFSS Data
Analysis Variable Survey Question Original Response Categories Re-coded Response Categories
Age Range What is your age?
_ _ age in years 18-34 Years
35-64 Years
>=65 Years
Education What is the highest grade or year of school you completed?
Never attended school or only kindergarten <High School Grades 1 through 8 (Elementary)
Grades 9 through 11 (Some high school)
Grade 12 or GED (High school graduate) Completed High School
College 1 year to 3 years (Some college or technical school)
College 4 years or more (College graduate) College Graduate
Refused, Not asked or Missing Missing
Marital Status Are you: (marital status)
Married Married or Living with Partner A member of an unmarried couple
Divorced Unmarried and Not Living With a Partner
Widowed
Separated
Never married
Refused, Not asked or Missing Missing
Children in Household
How many children less than 18 years of age live in your household?
Number of children: _ _ = Number of children At Least One Child
None No Children
Refused or Missing Missing
Household Income Is your annual household income from all sources:
Less than $10,000 < $35,000
Less than $15,000 ($10,000 to less than $15,000)
Less than $20,000 ($15,000 to less than $20,000)
Less than $25,000 ($20,000 to less than $25,000)
Less than $35,000 ($25,000 to less than $35,000)
Less than $50,000 ($35,000 to less than $50,000)
> $35,000
Less than $75,000 ($50,000 to less than $75,000)
$75,000 or more
Don’t know/Not sure, Refused and Not asked or Missing
Missing
BMI Categories About how much do you weigh without shoes?
BMI calculated using weight and height variables
__ _ = weight in pounds
BMI calculated using imperial scale:
(weight X 703)/ height in inches²
BMI <25

rural adults’ fruit and vegetable consumption
25
Table 1. Original Survey Question and Response Categories with Re-Coded Response Categories 2009 BRFSS Data
Analysis Variable Survey Question Original Response Categories Re-coded Response Categories
About how tall are you without shoes?
_ / _ _ = height in feet / inches
BMI 25-<30
BMI >=30
Don’t know/Not sure, Refused, Not asked or Missing
Don’t know/Not sure, Refused, Not asked or Missing
Missing
Physical Activity Now, thinking about the moderate activities you do in a usual week, do you do moderate activities for at least 10 minutes at a time, such as brisk walking, bicycling, vacuuming, gardening, or anything else that causes some increase in breathing or heart rate?
Calculated variable for adults that have reported participating in either moderate physical activity defined as 30 or more minutes per day for 5 or more days per week, or vigorous activity for 20 or more minutes per day on 3 or more days.
Respondents who reported doing enough moderate or vigorous physical activity to meet the recommendations
Getting at least moderate physical activity
How many days per week do you do these moderate activities for at least 10 minutes at a time?
On days when you do moderate activities for at least 10 minutes at a time, how much total time per day do you spend doing these activities?
Respondents who reported doing insufficient moderate or vigorous physical activity to meet recommendations, or respondents that reported doing no moderate or vigorous physical activity
Inactive
Now, thinking about the vigorous activities you do in a usual week, do you do vigorous activities for at least 10 minutes at a time, such as running, aerobics, heavy yard work, or anything else that causes large increases in breathing or heart rate?
Respondents who reported they didn’t know whether they did moderate or vigorous physical activity or didn’t know how many days or didn’t know how much time they did the activity, those who refused to
Missing

rural adults’ fruit and vegetable consumption
26
Table 1. Original Survey Question and Response Categories with Re-Coded Response Categories 2009 BRFSS Data
Analysis Variable Survey Question Original Response Categories Re-coded Response Categories
How many days per week do you do these vigorous activities for at least 10 minutes at a time?
answer, and those with missing responses
On days when you do vigorous activities for at least 10 minutes at a time, how much total time per day do you spend doing these activities?
Have Health Insurance
Do you have any kind of health care coverage, including health insurance, prepaid plans such as HMOs, or government plans such as Medicare?
Yes Yes
No No
Don’t know/Not Sure, Refused Missing
Have a Personal Physician
Do you have one person you think of as your personal doctor or health care provider? (If "No" ask "Is there more than one or is there no person who you think of as your personal doctor or health care provider?".)
Yes, only one Yes More than one
No No
Don’t know/Not Sure, Refused, Not asked or Missing
Missing
Timing of Last Routine Medical Check-up
About how long has it been since you last visited a doctor for a routine checkup? A routine checkup is a general physical exam, not an exam for a specific injury, illness, or condition.
Within past year (anytime less than 12 months ago)
Within the Past 12 Months
Within past 2 years (1 year but less than 2 years ago)
More than 12 Months Ago
Within past 5 years (2 years but less than 5 years ago)
5 or more years ago
Never
Don’t know/Not sure or Refused Missing
Deferment of Medical Care Because of Cost
Was there a time in the past 12 months when you needed to see a doctor but could not because of cost?
Yes Yes
No No
Don’t know/Not sure, Refused Missing
Self-Defined Health Status
Would you say that in general your health is:
Excellent Good to Excellent
Very good
Good
Fair Fair to Poor
Poor

rural adults’ fruit and vegetable consumption
27
Table 1. Original Survey Question and Response Categories with Re-Coded Response Categories 2009 BRFSS Data
Analysis Variable Survey Question Original Response Categories Re-coded Response Categories
Don’t know/Not Sure, Refused, Not asked or Missing
Missing
Residency by Geographic Locale
Metropolitan Status Code
In the center city of an MSA Non-rural
Outside the center city of an MSA but inside the county containing the center city
Inside a suburban county of the MSA
In an MSA that has no center city Rural
Not in an MSA

rural adults’ fruit and vegetable consumption
28
Table 2. Characteristics of U.S. Adults by Geographic Locale (Non-rural or Rural) 2009 BRFSS (weighted n=219,479,823)
Variables and Factors % Rural* (weighted
n=42,365,517)
% Non-rural* (weighted
n=177,114,306)
Fruit and Vegetable Consumption
<5 Servings Daily 78.8 75.6
At Least 5 Servings Daily 21.2 24.4
Sex Male 48.2 48.8
Female 51.8 51.2
Race And Ethnicity Caucasian 81.3 65.6
African American 6.2 10.9
Hispanic 6.6 15.2
Other 5.8 8.2
Age Ranges 18-34 Years 28.4 30.4
35-64 Years 51.8 53.0
>=65 Years 19.8 16.6
Education <High School 11.8 10.4
Completed High School 63.5 52.7
College Graduate 24.6 36.9
Marital Status Married Or Living With Partner
66.4 63.9
Unmarried/Not Living With A Partner
33.6 36.1
Children In Household No Children In Household 60.0 56.0
At Least 1 Child In Household
40.0 44.0
Household Income <$35,000 43.6 35.1
>=$35,000 56.4 64.9
BMI Categories BMI<25 32.8 37.2
BMI 25-<30 36.6 36.2
BMI >=30 30.6 26.6
Physical Activity Getting At Least Moderate Physical Activity
48.9 49.7
Inactive 51.1 50.3
Have Health Insurance Yes 83.0 85.0
No 17.0 15.0
Have A Personal Physician
Yes 81.9 80.5
No 18.1 19.5
Timing Of Last Routine Medical Checkup
Within Last 12 Months 65.8 68.2
Longer Than 12 Months Ago
34.2 31.8
Deferment Of Medical Care Because Of Cost
Deferred Medical Care Because Of Cost
15.5 14.7
Did Not Defer Medical Care Because Of Cost
84.5 85.3
Self Defined Health Status
Good To Excellent 81.7 84.7
Fair To Poor 18.3 15.3
*Cell percentages by row significantly different by z-test measure p< .05

rural adults’ fruit and vegetable consumption
29
Table 3. Bivariate Predictor Variables for of U.S. Rural Adults Consuming at Least 5 Fruits and Vegetables Daily by Geographic Locale (Non-rural or Rural)
2009 BRFSS (weighted n=52,259,789)
Variables and Factors % Rural* (weighted n=8,983,840)
% Non-rural * (weighted
n=43,275,949)
Sex Male 38.8 39.9
Female 61.2 60.1
Race And Ethnicity Caucasian 81.3 67.3
African American 5.3 10.3
Hispanic 6.9 13.3
Other 6.6 9.1
Age Ranges 18-34 Years 26.9 28.3
35-64 Years 49.4 52.7
>=65 Years 23.7 19.0
Education <High School 8.6 8.3
Completed High School 58.2 47.0
College Graduate 33.3 44.7
Marital Status Married Or Living With Partner
68.8 65.6
Unmarried/ Not Living With A Partner
31.2 34.4
Children In Household No Children In Household 61.2 57.3
At Least 1 Child In Household
38.8 42.7
Household Income <$35,000 38.6 31.4
>=$35,000 61.4 68.6
BMI Categories BMI<25 36.8 42.0
BMI 25-<30 35.9 35.0
BMI >=30 27.3 23.0
Physical Activity Getting At Least Moderate Physical Activity
60.9 61.0
Inactive 39.1 39.0
Have Health Insurance Yes 85.8 87.5
No 14.2 12.5
Have A Personal Physician
Yes 85.0 83.8
No 15.0 16.2
Timing Of Last Routine Medical Checkup
Within Last 12 Months 70.7 73.2
Longer Than 12 Months Ago
29.3 26.8
Deferment Of Medical Care Because Of Cost
Deferred Medical Care Because Of Cost
14.3 13.4
Did Not Defer Medical Care Because Of Cost
85.7 86.6
Self Defined Health Status
Good To Excellent 84.9 87.0
Fair To Poor 15.1 13.0
*Cell percentages by row significantly different by z-test measure p< .05

rural adults’ fruit and vegetable consumption
30
Table 4. Characteristics of U.S. Rural Adults Consuming at Least 5 Fruits and Vegetables Daily 2009 BRFSS
Predictor Variables and Factors Rural Adults Adjusted
Odds Ratio (95% CI)
Non-rural Adults Adjusted Odds Ratio
(95% CI) Sex Male --*** --***
Female 1.666 (1.663, 1.669) 1.632 (1.631, 1.633) Race And Ethnicity Caucasian --*** --***
African American 1.127 (1.123, 1.131) 1.056 (1.054, 1.057)
Hispanic 1.474 (1.469, 1.479) 1.086 (1.085, 1.087)
Other 1.251 (1.246, 1.255) 1.276 (1.275, 1.278) Age Ranges 18-34 Years .673 (.671, .675) .740 (.739, .741)
35-64 Years .675 (.673, .676) .769 (.768, .770)
>=65 Years --*** --*** Education <High School .527 (.525, .529) .722 (.721, .723)
Completed High School .647 (.646, .648) .707 (.707, .708) College Graduate --*** --***
Marital Status Married Or Living With Partner 1.071 (1.069, 1.073) 1.039(1.038, 1.040)
Unmarried /Not Living With A Partner
--*** --***
Children In Household
No Children In Household 1.052 (1.050, 1.054) 1.038 (1.037, 1.039)
At Least 1 Child In Household --*** --*** Household Income <$35,000 --*** --***
>=$35,000 1.111 (1.108, 1.113) 1.044 (1.042, 1.045) BMI Categories BMI<25 1.126 (1.124, 1.129) 1.201 (1.200, 1.202)
BMI 25-<30 1.066 (1.064, 1.068) 1.096 (1.095, 1.098) BMI >=30 --*** --***
Physical Activity Getting At Least Moderate Physical Activity
1.881 (1.878, 1.885) 1.884 (1.883, 1.886)
Inactive --*** --*** Have Health Insurance
Yes .962 (.959, .964) .950 (.949, .951)
No --*** --*** Have A Personal Physician
Yes 1.045 (1.042, 1.047) 1.022 (1.020, 1.023)
No --*** --*** Timing Of Last Routine Medical Checkup
Within Last 12 Months 1.224 (1.222, 1.226) 1.254 (1.253, 1.255)
Longer Than 12 Months Ago --*** --***
Deferment Of Medical Care Because Of Cost
Deferred Medical Care Because Of Cost
--*** --***
Did Not Defer Medical Care Because Of Cost
.897 (.895, .899) .951 (.949, .952)
Self Defined Health Status
Good To Excellent 1.148 (1.145, 1.151) 1.030 (1.029, 1.032)
Fair To Poor --*** --*** --*** reference group

rural adults’ fruit and vegetable consumption
31
Table 5. Percentage of Rural and Non-Rural Adults Consuming 5 or More Daily Servings of
Fruits and Vegetables 2009 BRFSS Data and 2007 USDA Census Data
State % Rural Adults
%Non-Rural Adults
% Difference Between Rural and Non-Rural
Adults
National Ranking for Fruit and Vegetable Production*
Alabama 17.01 20.63 -21.27 17
Alaska 19.79 23.76 -20.04 48
Arizona 25.39 23.13 8.90 12
Arkansas 19.01 19.74 -3.87 35
California 22.90 24.28 -6.01 1
Colorado 21.84 22.58 -3.37 26
Connecticut 25.76 27.57 -7.00 37
Delaware 23.45 22.75 2.96 46
Florida 21.64 23.32 -7.77 11
Georgia 21.94 23.58 -7.50 19
Hawaii 25.79 21.40 17.05 7
Idaho 21.55 25.03 -16.19 34
Illinois 22.63 21.65 4.34 24
Indiana 17.17 20.34 -18.42 25
Iowa 17.82 17.96 -0.78 29
Kansas 17.24 18.48 -7.20 41
Kentucky 17.30 21.96 -26.91 14
Louisiana 14.48 17.25 -19.16 38
Maine 25.93 28.27 -9.04 33
Maryland 21.24 26.99 -27.05 32
Massachusetts 19.66 24.27 -23.47 27
Michigan 21.39 22.05 -3.06 5
Minnesota 19.53 22.70 -16.25 22
Mississippi 14.26 19.02 -33.36 28
Missouri 18.14 18.80 -3.64 23
Montana 24.35 25.88 -6.28 40
Nebraska 21.23 19.45 8.35 43
Nevada 23.19 22.48 3.03 49
New Hampshire 28.45 24.71 13.17 42
New Jersey N/A 24.83 N/A 20
New Mexico 21.34 22.59 -5.86 15
New York 24.50 25.65 -4.69 4
North Carolina 17.34 21.04 -21.37 6
North Dakota 21.75 21.68 0.30 47
Ohio 18.26 20.94 -14.67 9
Oklahoma 13.88 14.44 -4.07 31
Oregon 23.62 25.41 -7.59 8
Pennsylvania 20.34 24.01 -18.04 3
Rhode Island N/A 25.53 N/A 44
South Carolina 15.33 17.31 -12.88 21
South Dakota 15.71 14.29 9.04 45

rural adults’ fruit and vegetable consumption
32
Table 5. Percentage of Rural and Non-Rural Adults Consuming 5 or More Daily Servings of Fruits and Vegetables
2009 BRFSS Data and 2007 USDA Census Data
State % Rural Adults
%Non-Rural Adults
% Difference Between Rural and Non-Rural
Adults
National Ranking for Fruit and Vegetable Production*
Tennessee 19.73 23.26 -17.90 18
Texas 22.70 22.75 -0.22 10
Utah 19.10 23.25 -21.73 30
Vermont 28.74 27.81 3.26 39
Virginia 22.60 26.89 -19.00 16
Washington 22.60 24.90 -10.17 2
West Virginia 15.90 16.18 -1.81 36
Wisconsin 20.04 21.95 -9.53 13
Wyoming 23.14 21.25 8.20 50
U.S. 20.38 23.07 -13.19
* USDA Census 2007 Data on Number of Farms and Acreage Dedicated to Fruit and Vegetable Production by State were used to compute ranking

rural adults’ fruit and vegetable consumption
33
Figure 1. States With Either Smaller Or Larger Proportions Of The Rural Adult Population Consuming 5 Or More Daily Servings Of Fruits And Vegetables In
Comparison To Non-Rural Counterparts 2009 BRFSS Data