Embed Size (px)
Citation preview
US SEC Filing Announcement for the Vanguard® Exchange Traded Funds
28 March 2014 Vanguard Investments Australia Ltd announces the following:
FUND ASX CODE
ANNOUNCEMENT
Vanguard® All-World ex-US Shares Index ETF VEU US SEC Filing of Form N-Q
The Vanguard Group, Inc. in the US has completed and filed Form N-Q (quarterly schedule of portfolio holdings) for Registered Investment Companies with the Securities and Exchange Commission (SEC) in the US as part of the regulatory requirements of the SEC. VEU is a share class of the Vanguard® FTSE All-World ex-US Index Fund (US Fund), which is traded in the form of CDIs* in Australia. As the filing in the US covers multiple funds, only the information relevant to the US Fund is included. The completed form can be viewed online at the SEC website at: http://www.sec.gov/Archives/edgar/data/857489/000093247114005061/0000932471-14-005061-index.htm Further details of the SEC requirements for this filing are available at: www.sec.gov/about/forms/formn-q.pdf * Clearing House Electronic Subregister System (CHESS) Depositary Interests (CDIs)
Further Information If you have any queries on Vanguard ETFs, please visit vanguard.com.au/etf © 2014 Vanguard Investments Australia Ltd (ABN 72 072 881 086 / AFS Licence 227263) (Vanguard) is the issuer of the Prospectus on behalf of the US listed ETFs described in the Prospectus. Vanguard has arranged for the interests in the US ETFs to be made available to Australian investors via CHESS Depositary Interests (CDIs) that are quoted on the AQUA market of the ASX. Vanguard is a wholly owned subsidiary of The Vanguard Group, Inc. based in the US. All rights reserved. All rights in the FTSE All-World ex US Index (the “Index”) vest in FTSE International Limited (“FTSE”). “FTSE®” is a trademark of London Stock Exchange Group companies and is used by FTSE under licence. The Vanguard All-World ex-US Shares Index ETF (the “Product”) has been developed solely by Vanguard. The Index is calculated by FTSE or its agent. FTSE and its licensors are not connected to and do not sponsor, advise, recommend, endorse or promote the Product and do not accept any liability whatsoever to any person arising out of (a) the use of, reliance on or any error in the Index or (b )investment in or operation of the Product. FTSE makes no claim, prediction, warranty or representation either as to the results to be obtained from the Product or the suitability of the Index for the purpose to which it is being put by Vanguard. Vanguard Investments Australia Ltd, Level 34, Freshwater Place, 2 Southbank Boulevard, Southbank VIC 3006 vanguard.com.au 1300 655 888
UNITED STATES SECURITIES AND EXCHANGE COMMISSION
Washington, D.C. 20549
FORM N-Q
QUARTERLY SCHEDULE OF PORTFOLIO HOLDINGS OF REGISTERED MANAGEMENT COMPANY
Investment Company Act File number: 811-05972 Name of Registrant: Vanguard International Equity Index Funds Address of Registrant: P.O. Box 2600 Valley Forge, PA 19482 Name and address of agent for service: Heidi Stam, Esquire P.O. Box 876 Valley Forge, PA 19482 Date of fiscal year end: October 31
Date of reporting period: January 31, 2014 Item 1: Schedule of Investments
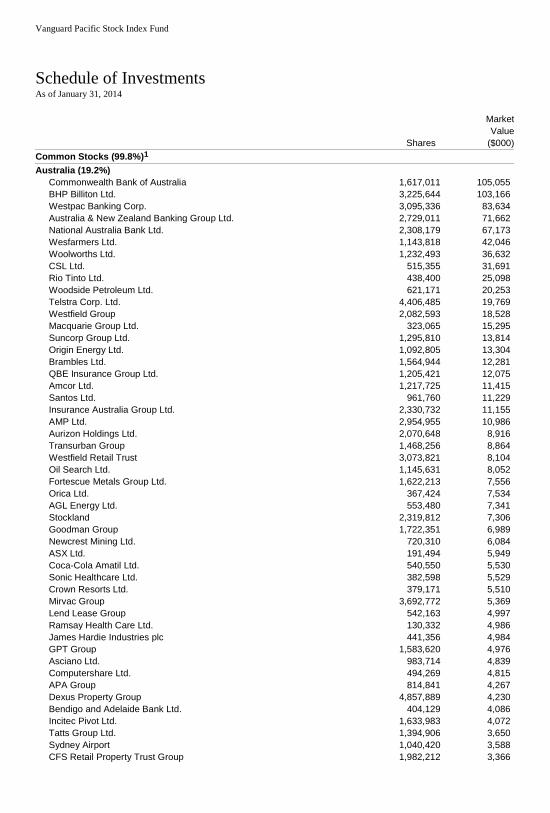
Vanguard Pacific Stock Index Fund
Schedule of Investments As of January 31, 2014
Shares
Market
Value
($000)
Common Stocks (99.8%)1
Australia (19.2%)
Commonwealth Bank of Australia 1,617,011 105,055 BHP Billiton Ltd. 3,225,644 103,166 Westpac Banking Corp. 3,095,336 83,634 Australia & New Zealand Banking Group Ltd. 2,729,011 71,662 National Australia Bank Ltd. 2,308,179 67,173 Wesfarmers Ltd. 1,143,818 42,046 Woolworths Ltd. 1,232,493 36,632 CSL Ltd. 515,355 31,691 Rio Tinto Ltd. 438,400 25,098 Woodside Petroleum Ltd. 621,171 20,253 Telstra Corp. Ltd. 4,406,485 19,769 Westfield Group 2,082,593 18,528 Macquarie Group Ltd. 323,065 15,295 Suncorp Group Ltd. 1,295,810 13,814 Origin Energy Ltd. 1,092,805 13,304 Brambles Ltd. 1,564,944 12,281 QBE Insurance Group Ltd. 1,205,421 12,075 Amcor Ltd. 1,217,725 11,415 Santos Ltd. 961,760 11,229 Insurance Australia Group Ltd. 2,330,732 11,155 AMP Ltd. 2,954,955 10,986 Aurizon Holdings Ltd. 2,070,648 8,916 Transurban Group 1,468,256 8,864 Westfield Retail Trust 3,073,821 8,104 Oil Search Ltd. 1,145,631 8,052 Fortescue Metals Group Ltd. 1,622,213 7,556 Orica Ltd. 367,424 7,534 AGL Energy Ltd. 553,480 7,341 Stockland 2,319,812 7,306 Goodman Group 1,722,351 6,989 Newcrest Mining Ltd. 720,310 6,084 ASX Ltd. 191,494 5,949 Coca-Cola Amatil Ltd. 540,550 5,530 Sonic Healthcare Ltd. 382,598 5,529 Crown Resorts Ltd. 379,171 5,510 Mirvac Group 3,692,772 5,369 Lend Lease Group 542,163 4,997 Ramsay Health Care Ltd. 130,332 4,986 James Hardie Industries plc 441,356 4,984 GPT Group 1,583,620 4,976 Asciano Ltd. 983,714 4,839 Computershare Ltd. 494,269 4,815 APA Group 814,841 4,267 Dexus Property Group 4,857,889 4,230 Bendigo and Adelaide Bank Ltd. 404,129 4,086 Incitec Pivot Ltd. 1,633,983 4,072 Tatts Group Ltd. 1,394,906 3,650 Sydney Airport 1,040,420 3,588 CFS Retail Property Trust Group 1,982,212 3,366
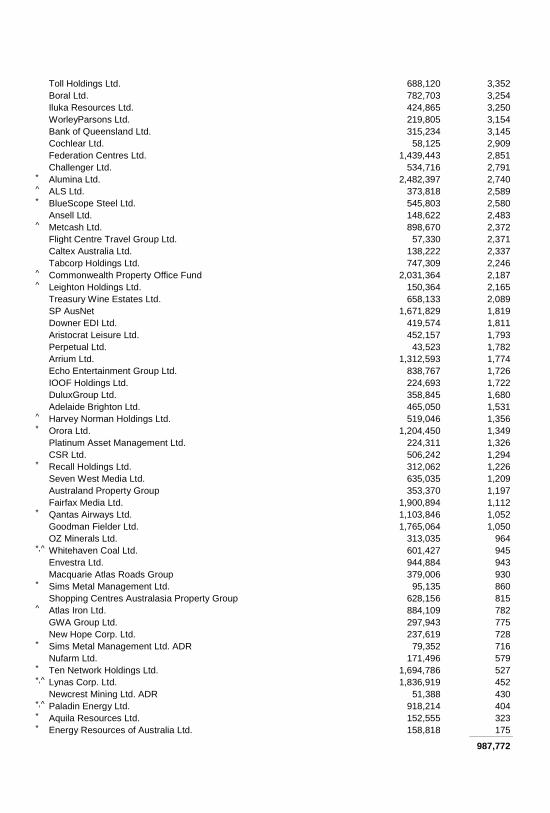
Toll Holdings Ltd. 688,120 3,352 Boral Ltd. 782,703 3,254 Iluka Resources Ltd. 424,865 3,250 WorleyParsons Ltd. 219,805 3,154 Bank of Queensland Ltd. 315,234 3,145 Cochlear Ltd. 58,125 2,909 Federation Centres Ltd. 1,439,443 2,851 Challenger Ltd. 534,716 2,791 * Alumina Ltd. 2,482,397 2,740 ^ ALS Ltd. 373,818 2,589 * BlueScope Steel Ltd. 545,803 2,580 Ansell Ltd. 148,622 2,483 ^ Metcash Ltd. 898,670 2,372 Flight Centre Travel Group Ltd. 57,330 2,371 Caltex Australia Ltd. 138,222 2,337 Tabcorp Holdings Ltd. 747,309 2,246 ^ Commonwealth Property Office Fund 2,031,364 2,187 ^ Leighton Holdings Ltd. 150,364 2,165 Treasury Wine Estates Ltd. 658,133 2,089 SP AusNet 1,671,829 1,819 Downer EDI Ltd. 419,574 1,811 Aristocrat Leisure Ltd. 452,157 1,793 Perpetual Ltd. 43,523 1,782 Arrium Ltd. 1,312,593 1,774 Echo Entertainment Group Ltd. 838,767 1,726 IOOF Holdings Ltd. 224,693 1,722 DuluxGroup Ltd. 358,845 1,680 Adelaide Brighton Ltd. 465,050 1,531 ^ Harvey Norman Holdings Ltd. 519,046 1,356 * Orora Ltd. 1,204,450 1,349 Platinum Asset Management Ltd. 224,311 1,326 CSR Ltd. 506,242 1,294 * Recall Holdings Ltd. 312,062 1,226 Seven West Media Ltd. 635,035 1,209 Australand Property Group 353,370 1,197 Fairfax Media Ltd. 1,900,894 1,112 * Qantas Airways Ltd. 1,103,846 1,052 Goodman Fielder Ltd. 1,765,064 1,050 OZ Minerals Ltd. 313,035 964 *,^ Whitehaven Coal Ltd. 601,427 945 Envestra Ltd. 944,884 943 Macquarie Atlas Roads Group 379,006 930 * Sims Metal Management Ltd. 95,135 860 Shopping Centres Australasia Property Group 628,156 815 ^ Atlas Iron Ltd. 884,109 782 GWA Group Ltd. 297,943 775 New Hope Corp. Ltd. 237,619 728 * Sims Metal Management Ltd. ADR 79,352 716 Nufarm Ltd. 171,496 579 * Ten Network Holdings Ltd. 1,694,786 527 *,^ Lynas Corp. Ltd. 1,836,919 452 Newcrest Mining Ltd. ADR 51,388 430 *,^ Paladin Energy Ltd. 918,214 404 * Aquila Resources Ltd. 152,555 323 * Energy Resources of Australia Ltd. 158,818 175 _____________
987,772
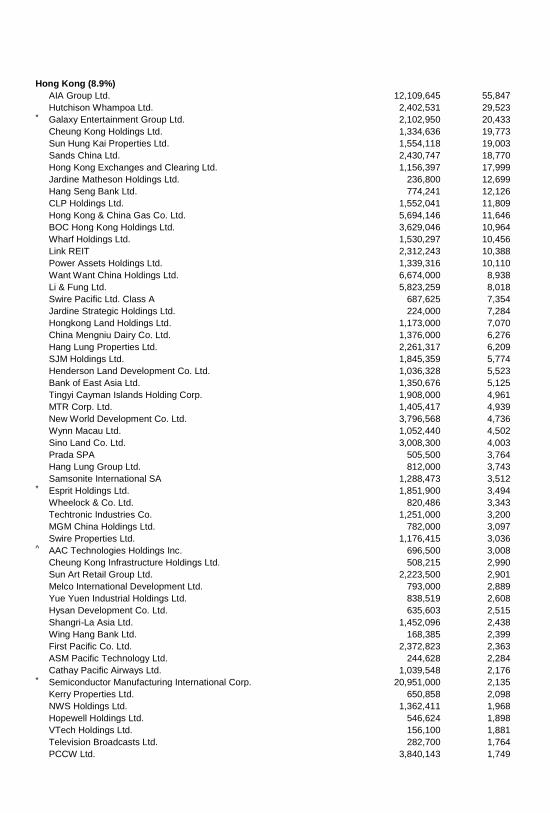
Hong Kong (8.9%)
AIA Group Ltd. 12,109,645 55,847 Hutchison Whampoa Ltd. 2,402,531 29,523 * Galaxy Entertainment Group Ltd. 2,102,950 20,433 Cheung Kong Holdings Ltd. 1,334,636 19,773 Sun Hung Kai Properties Ltd. 1,554,118 19,003 Sands China Ltd. 2,430,747 18,770 Hong Kong Exchanges and Clearing Ltd. 1,156,397 17,999 Jardine Matheson Holdings Ltd. 236,800 12,699 Hang Seng Bank Ltd. 774,241 12,126 CLP Holdings Ltd. 1,552,041 11,809 Hong Kong & China Gas Co. Ltd. 5,694,146 11,646 BOC Hong Kong Holdings Ltd. 3,629,046 10,964 Wharf Holdings Ltd. 1,530,297 10,456 Link REIT 2,312,243 10,388 Power Assets Holdings Ltd. 1,339,316 10,110 Want Want China Holdings Ltd. 6,674,000 8,938 Li & Fung Ltd. 5,823,259 8,018 Swire Pacific Ltd. Class A 687,625 7,354 Jardine Strategic Holdings Ltd. 224,000 7,284 Hongkong Land Holdings Ltd. 1,173,000 7,070 China Mengniu Dairy Co. Ltd. 1,376,000 6,276 Hang Lung Properties Ltd. 2,261,317 6,209 SJM Holdings Ltd. 1,845,359 5,774 Henderson Land Development Co. Ltd. 1,036,328 5,523 Bank of East Asia Ltd. 1,350,676 5,125 Tingyi Cayman Islands Holding Corp. 1,908,000 4,961 MTR Corp. Ltd. 1,405,417 4,939 New World Development Co. Ltd. 3,796,568 4,736 Wynn Macau Ltd. 1,052,440 4,502 Sino Land Co. Ltd. 3,008,300 4,003 Prada SPA 505,500 3,764 Hang Lung Group Ltd. 812,000 3,743 Samsonite International SA 1,288,473 3,512 * Esprit Holdings Ltd. 1,851,900 3,494 Wheelock & Co. Ltd. 820,486 3,343 Techtronic Industries Co. 1,251,000 3,200 MGM China Holdings Ltd. 782,000 3,097 Swire Properties Ltd. 1,176,415 3,036 ^ AAC Technologies Holdings Inc. 696,500 3,008 Cheung Kong Infrastructure Holdings Ltd. 508,215 2,990 Sun Art Retail Group Ltd. 2,223,500 2,901 Melco International Development Ltd. 793,000 2,889 Yue Yuen Industrial Holdings Ltd. 838,519 2,608 Hysan Development Co. Ltd. 635,603 2,515 Shangri-La Asia Ltd. 1,452,096 2,438 Wing Hang Bank Ltd. 168,385 2,399 First Pacific Co. Ltd. 2,372,823 2,363 ASM Pacific Technology Ltd. 244,628 2,284 Cathay Pacific Airways Ltd. 1,039,548 2,176 * Semiconductor Manufacturing International Corp. 20,951,000 2,135 Kerry Properties Ltd. 650,858 2,098 NWS Holdings Ltd. 1,362,411 1,968 Hopewell Holdings Ltd. 546,624 1,898 VTech Holdings Ltd. 156,100 1,881 Television Broadcasts Ltd. 282,700 1,764 PCCW Ltd. 3,840,143 1,749
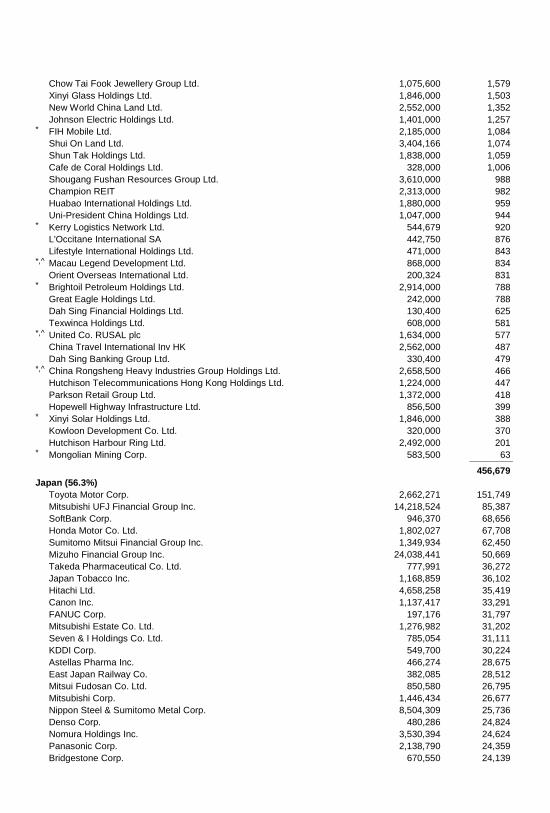
Chow Tai Fook Jewellery Group Ltd. 1,075,600 1,579 Xinyi Glass Holdings Ltd. 1,846,000 1,503 New World China Land Ltd. 2,552,000 1,352 Johnson Electric Holdings Ltd. 1,401,000 1,257 * FIH Mobile Ltd. 2,185,000 1,084 Shui On Land Ltd. 3,404,166 1,074 Shun Tak Holdings Ltd. 1,838,000 1,059 Cafe de Coral Holdings Ltd. 328,000 1,006 Shougang Fushan Resources Group Ltd. 3,610,000 988 Champion REIT 2,313,000 982 Huabao International Holdings Ltd. 1,880,000 959 Uni-President China Holdings Ltd. 1,047,000 944 * Kerry Logistics Network Ltd. 544,679 920 L'Occitane International SA 442,750 876 Lifestyle International Holdings Ltd. 471,000 843 *,^ Macau Legend Development Ltd. 868,000 834 Orient Overseas International Ltd. 200,324 831 * Brightoil Petroleum Holdings Ltd. 2,914,000 788 Great Eagle Holdings Ltd. 242,000 788 Dah Sing Financial Holdings Ltd. 130,400 625 Texwinca Holdings Ltd. 608,000 581 *,^ United Co. RUSAL plc 1,634,000 577 China Travel International Inv HK 2,562,000 487 Dah Sing Banking Group Ltd. 330,400 479 *,^ China Rongsheng Heavy Industries Group Holdings Ltd. 2,658,500 466 Hutchison Telecommunications Hong Kong Holdings Ltd. 1,224,000 447 Parkson Retail Group Ltd. 1,372,000 418 Hopewell Highway Infrastructure Ltd. 856,500 399 * Xinyi Solar Holdings Ltd. 1,846,000 388 Kowloon Development Co. Ltd. 320,000 370 Hutchison Harbour Ring Ltd. 2,492,000 201 * Mongolian Mining Corp. 583,500 63 _____________
456,679
Japan (56.3%)
Toyota Motor Corp. 2,662,271 151,749 Mitsubishi UFJ Financial Group Inc. 14,218,524 85,387 SoftBank Corp. 946,370 68,656 Honda Motor Co. Ltd. 1,802,027 67,708 Sumitomo Mitsui Financial Group Inc. 1,349,934 62,450 Mizuho Financial Group Inc. 24,038,441 50,669 Takeda Pharmaceutical Co. Ltd. 777,991 36,272 Japan Tobacco Inc. 1,168,859 36,102 Hitachi Ltd. 4,658,258 35,419 Canon Inc. 1,137,417 33,291 FANUC Corp. 197,176 31,797 Mitsubishi Estate Co. Ltd. 1,276,982 31,202 Seven & I Holdings Co. Ltd. 785,054 31,111 KDDI Corp. 549,700 30,224 Astellas Pharma Inc. 466,274 28,675 East Japan Railway Co. 382,085 28,512 Mitsui Fudosan Co. Ltd. 850,580 26,795 Mitsubishi Corp. 1,446,434 26,677 Nippon Steel & Sumitomo Metal Corp. 8,504,309 25,736 Denso Corp. 480,286 24,824 Nomura Holdings Inc. 3,530,394 24,624 Panasonic Corp. 2,138,790 24,359 Bridgestone Corp. 670,550 24,139
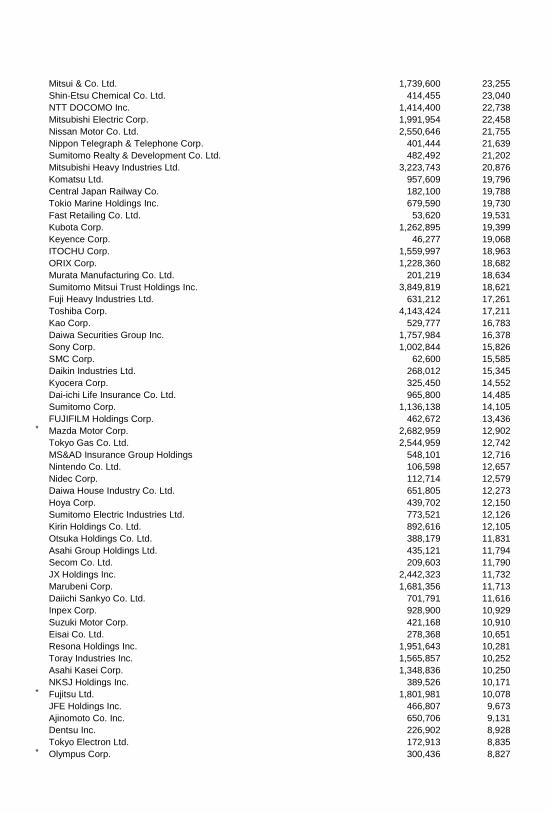
Mitsui & Co. Ltd. 1,739,600 23,255 Shin-Etsu Chemical Co. Ltd. 414,455 23,040 NTT DOCOMO Inc. 1,414,400 22,738 Mitsubishi Electric Corp. 1,991,954 22,458 Nissan Motor Co. Ltd. 2,550,646 21,755 Nippon Telegraph & Telephone Corp. 401,444 21,639 Sumitomo Realty & Development Co. Ltd. 482,492 21,202 Mitsubishi Heavy Industries Ltd. 3,223,743 20,876 Komatsu Ltd. 957,609 19,796 Central Japan Railway Co. 182,100 19,788 Tokio Marine Holdings Inc. 679,590 19,730 Fast Retailing Co. Ltd. 53,620 19,531 Kubota Corp. 1,262,895 19,399 Keyence Corp. 46,277 19,068 ITOCHU Corp. 1,559,997 18,963 ORIX Corp. 1,228,360 18,682 Murata Manufacturing Co. Ltd. 201,219 18,634 Sumitomo Mitsui Trust Holdings Inc. 3,849,819 18,621 Fuji Heavy Industries Ltd. 631,212 17,261 Toshiba Corp. 4,143,424 17,211 Kao Corp. 529,777 16,783 Daiwa Securities Group Inc. 1,757,984 16,378 Sony Corp. 1,002,844 15,826 SMC Corp. 62,600 15,585 Daikin Industries Ltd. 268,012 15,345 Kyocera Corp. 325,450 14,552 Dai-ichi Life Insurance Co. Ltd. 965,800 14,485 Sumitomo Corp. 1,136,138 14,105 FUJIFILM Holdings Corp. 462,672 13,436 * Mazda Motor Corp. 2,682,959 12,902 Tokyo Gas Co. Ltd. 2,544,959 12,742 MS&AD Insurance Group Holdings 548,101 12,716 Nintendo Co. Ltd. 106,598 12,657 Nidec Corp. 112,714 12,579 Daiwa House Industry Co. Ltd. 651,805 12,273 Hoya Corp. 439,702 12,150 Sumitomo Electric Industries Ltd. 773,521 12,126 Kirin Holdings Co. Ltd. 892,616 12,105 Otsuka Holdings Co. Ltd. 388,179 11,831 Asahi Group Holdings Ltd. 435,121 11,794 Secom Co. Ltd. 209,603 11,790 JX Holdings Inc. 2,442,323 11,732 Marubeni Corp. 1,681,356 11,713 Daiichi Sankyo Co. Ltd. 701,791 11,616 Inpex Corp. 928,900 10,929 Suzuki Motor Corp. 421,168 10,910 Eisai Co. Ltd. 278,368 10,651 Resona Holdings Inc. 1,951,643 10,281 Toray Industries Inc. 1,565,857 10,252 Asahi Kasei Corp. 1,348,836 10,250 NKSJ Holdings Inc. 389,526 10,171 * Fujitsu Ltd. 1,801,981 10,078 JFE Holdings Inc. 466,807 9,673 Ajinomoto Co. Inc. 650,706 9,131 Dentsu Inc. 226,902 8,928 Tokyo Electron Ltd. 172,913 8,835 * Olympus Corp. 300,436 8,827
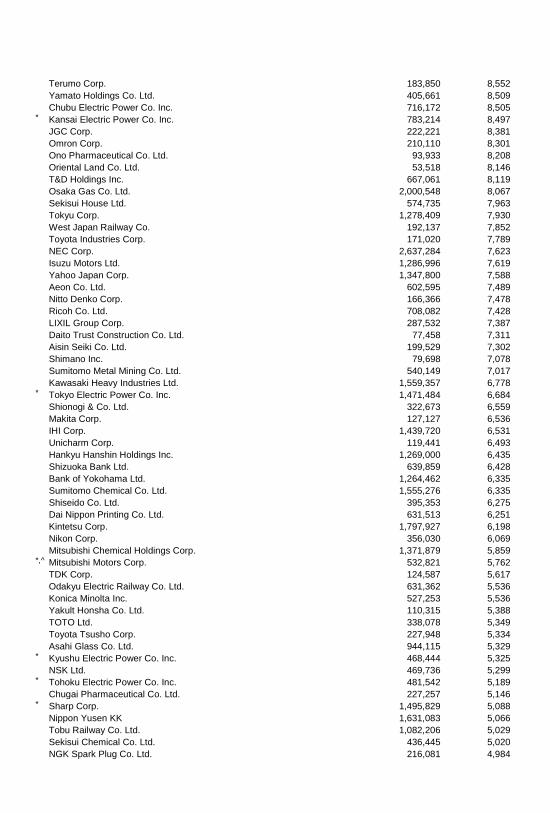
Terumo Corp. 183,850 8,552 Yamato Holdings Co. Ltd. 405,661 8,509 Chubu Electric Power Co. Inc. 716,172 8,505 * Kansai Electric Power Co. Inc. 783,214 8,497 JGC Corp. 222,221 8,381 Omron Corp. 210,110 8,301 Ono Pharmaceutical Co. Ltd. 93,933 8,208 Oriental Land Co. Ltd. 53,518 8,146 T&D Holdings Inc. 667,061 8,119 Osaka Gas Co. Ltd. 2,000,548 8,067 Sekisui House Ltd. 574,735 7,963 Tokyu Corp. 1,278,409 7,930 West Japan Railway Co. 192,137 7,852 Toyota Industries Corp. 171,020 7,789 NEC Corp. 2,637,284 7,623 Isuzu Motors Ltd. 1,286,996 7,619 Yahoo Japan Corp. 1,347,800 7,588 Aeon Co. Ltd. 602,595 7,489 Nitto Denko Corp. 166,366 7,478 Ricoh Co. Ltd. 708,082 7,428 LIXIL Group Corp. 287,532 7,387 Daito Trust Construction Co. Ltd. 77,458 7,311 Aisin Seiki Co. Ltd. 199,529 7,302 Shimano Inc. 79,698 7,078 Sumitomo Metal Mining Co. Ltd. 540,149 7,017 Kawasaki Heavy Industries Ltd. 1,559,357 6,778 * Tokyo Electric Power Co. Inc. 1,471,484 6,684 Shionogi & Co. Ltd. 322,673 6,559 Makita Corp. 127,127 6,536 IHI Corp. 1,439,720 6,531 Unicharm Corp. 119,441 6,493 Hankyu Hanshin Holdings Inc. 1,269,000 6,435 Shizuoka Bank Ltd. 639,859 6,428 Bank of Yokohama Ltd. 1,264,462 6,335 Sumitomo Chemical Co. Ltd. 1,555,276 6,335 Shiseido Co. Ltd. 395,353 6,275 Dai Nippon Printing Co. Ltd. 631,513 6,251 Kintetsu Corp. 1,797,927 6,198 Nikon Corp. 356,030 6,069 Mitsubishi Chemical Holdings Corp. 1,371,879 5,859 *,^ Mitsubishi Motors Corp. 532,821 5,762 TDK Corp. 124,587 5,617 Odakyu Electric Railway Co. Ltd. 631,362 5,536 Konica Minolta Inc. 527,253 5,536 Yakult Honsha Co. Ltd. 110,315 5,388 TOTO Ltd. 338,078 5,349 Toyota Tsusho Corp. 227,948 5,334 Asahi Glass Co. Ltd. 944,115 5,329 * Kyushu Electric Power Co. Inc. 468,444 5,325 NSK Ltd. 469,736 5,299 * Tohoku Electric Power Co. Inc. 481,542 5,189 Chugai Pharmaceutical Co. Ltd. 227,257 5,146 * Sharp Corp. 1,495,829 5,088 Nippon Yusen KK 1,631,083 5,066 Tobu Railway Co. Ltd. 1,082,206 5,029 Sekisui Chemical Co. Ltd. 436,445 5,020 NGK Spark Plug Co. Ltd. 216,081 4,984
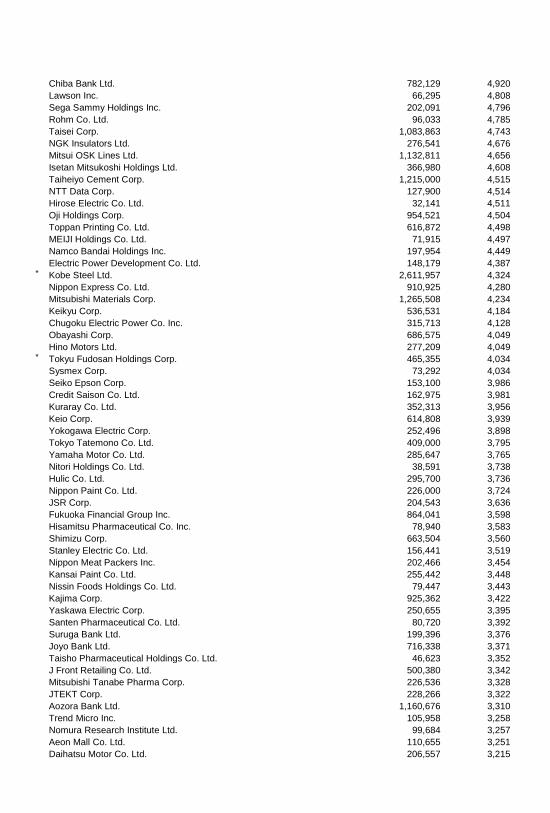
Chiba Bank Ltd. 782,129 4,920 Lawson Inc. 66,295 4,808 Sega Sammy Holdings Inc. 202,091 4,796 Rohm Co. Ltd. 96,033 4,785 Taisei Corp. 1,083,863 4,743 NGK Insulators Ltd. 276,541 4,676 Mitsui OSK Lines Ltd. 1,132,811 4,656 Isetan Mitsukoshi Holdings Ltd. 366,980 4,608 Taiheiyo Cement Corp. 1,215,000 4,515 NTT Data Corp. 127,900 4,514 Hirose Electric Co. Ltd. 32,141 4,511 Oji Holdings Corp. 954,521 4,504 Toppan Printing Co. Ltd. 616,872 4,498 MEIJI Holdings Co. Ltd. 71,915 4,497 Namco Bandai Holdings Inc. 197,954 4,449 Electric Power Development Co. Ltd. 148,179 4,387 * Kobe Steel Ltd. 2,611,957 4,324 Nippon Express Co. Ltd. 910,925 4,280 Mitsubishi Materials Corp. 1,265,508 4,234 Keikyu Corp. 536,531 4,184 Chugoku Electric Power Co. Inc. 315,713 4,128 Obayashi Corp. 686,575 4,049 Hino Motors Ltd. 277,209 4,049 * Tokyu Fudosan Holdings Corp. 465,355 4,034 Sysmex Corp. 73,292 4,034 Seiko Epson Corp. 153,100 3,986 Credit Saison Co. Ltd. 162,975 3,981 Kuraray Co. Ltd. 352,313 3,956 Keio Corp. 614,808 3,939 Yokogawa Electric Corp. 252,496 3,898 Tokyo Tatemono Co. Ltd. 409,000 3,795 Yamaha Motor Co. Ltd. 285,647 3,765 Nitori Holdings Co. Ltd. 38,591 3,738 Hulic Co. Ltd. 295,700 3,736 Nippon Paint Co. Ltd. 226,000 3,724 JSR Corp. 204,543 3,636 Fukuoka Financial Group Inc. 864,041 3,598 Hisamitsu Pharmaceutical Co. Inc. 78,940 3,583 Shimizu Corp. 663,504 3,560 Stanley Electric Co. Ltd. 156,441 3,519 Nippon Meat Packers Inc. 202,466 3,454 Kansai Paint Co. Ltd. 255,442 3,448 Nissin Foods Holdings Co. Ltd. 79,447 3,443 Kajima Corp. 925,362 3,422 Yaskawa Electric Corp. 250,655 3,395 Santen Pharmaceutical Co. Ltd. 80,720 3,392 Suruga Bank Ltd. 199,396 3,376 Joyo Bank Ltd. 716,338 3,371 Taisho Pharmaceutical Holdings Co. Ltd. 46,623 3,352 J Front Retailing Co. Ltd. 500,380 3,342 Mitsubishi Tanabe Pharma Corp. 226,536 3,328 JTEKT Corp. 228,266 3,322 Aozora Bank Ltd. 1,160,676 3,310 Trend Micro Inc. 105,958 3,258 Nomura Research Institute Ltd. 99,684 3,257 Aeon Mall Co. Ltd. 110,655 3,251 Daihatsu Motor Co. Ltd. 206,557 3,215
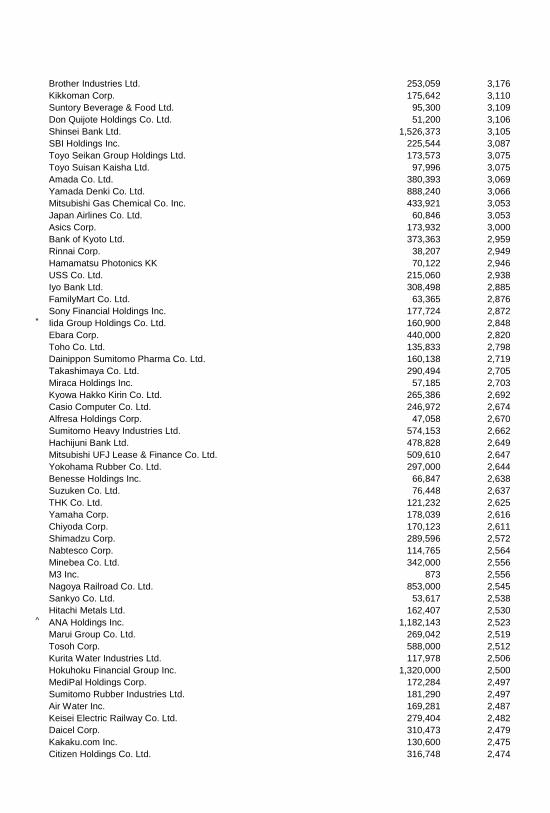
Brother Industries Ltd. 253,059 3,176 Kikkoman Corp. 175,642 3,110 Suntory Beverage & Food Ltd. 95,300 3,109 Don Quijote Holdings Co. Ltd. 51,200 3,106 Shinsei Bank Ltd. 1,526,373 3,105 SBI Holdings Inc. 225,544 3,087 Toyo Seikan Group Holdings Ltd. 173,573 3,075 Toyo Suisan Kaisha Ltd. 97,996 3,075 Amada Co. Ltd. 380,393 3,069 Yamada Denki Co. Ltd. 888,240 3,066 Mitsubishi Gas Chemical Co. Inc. 433,921 3,053 Japan Airlines Co. Ltd. 60,846 3,053 Asics Corp. 173,932 3,000 Bank of Kyoto Ltd. 373,363 2,959 Rinnai Corp. 38,207 2,949 Hamamatsu Photonics KK 70,122 2,946 USS Co. Ltd. 215,060 2,938 Iyo Bank Ltd. 308,498 2,885 FamilyMart Co. Ltd. 63,365 2,876 Sony Financial Holdings Inc. 177,724 2,872 * Iida Group Holdings Co. Ltd. 160,900 2,848 Ebara Corp. 440,000 2,820 Toho Co. Ltd. 135,833 2,798 Dainippon Sumitomo Pharma Co. Ltd. 160,138 2,719 Takashimaya Co. Ltd. 290,494 2,705 Miraca Holdings Inc. 57,185 2,703 Kyowa Hakko Kirin Co. Ltd. 265,386 2,692 Casio Computer Co. Ltd. 246,972 2,674 Alfresa Holdings Corp. 47,058 2,670 Sumitomo Heavy Industries Ltd. 574,153 2,662 Hachijuni Bank Ltd. 478,828 2,649 Mitsubishi UFJ Lease & Finance Co. Ltd. 509,610 2,647 Yokohama Rubber Co. Ltd. 297,000 2,644 Benesse Holdings Inc. 66,847 2,638 Suzuken Co. Ltd. 76,448 2,637 THK Co. Ltd. 121,232 2,625 Yamaha Corp. 178,039 2,616 Chiyoda Corp. 170,123 2,611 Shimadzu Corp. 289,596 2,572 Nabtesco Corp. 114,765 2,564 Minebea Co. Ltd. 342,000 2,556 M3 Inc. 873 2,556 Nagoya Railroad Co. Ltd. 853,000 2,545 Sankyo Co. Ltd. 53,617 2,538 Hitachi Metals Ltd. 162,407 2,530 ^ ANA Holdings Inc. 1,182,143 2,523 Marui Group Co. Ltd. 269,042 2,519 Tosoh Corp. 588,000 2,512 Kurita Water Industries Ltd. 117,978 2,506 Hokuhoku Financial Group Inc. 1,320,000 2,500 MediPal Holdings Corp. 172,284 2,497 Sumitomo Rubber Industries Ltd. 181,290 2,497 Air Water Inc. 169,281 2,487 Keisei Electric Railway Co. Ltd. 279,404 2,482 Daicel Corp. 310,473 2,479 Kakaku.com Inc. 130,600 2,475 Citizen Holdings Co. Ltd. 316,748 2,474
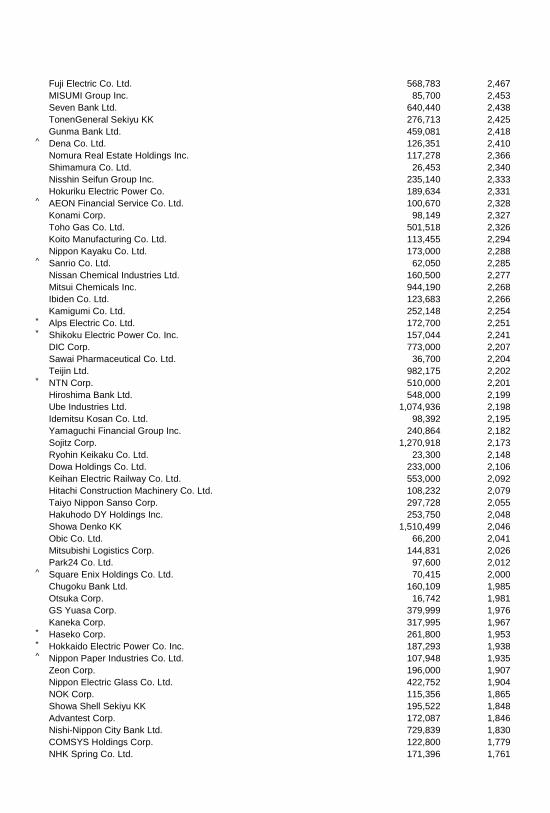
Fuji Electric Co. Ltd. 568,783 2,467 MISUMI Group Inc. 85,700 2,453 Seven Bank Ltd. 640,440 2,438 TonenGeneral Sekiyu KK 276,713 2,425 Gunma Bank Ltd. 459,081 2,418 ^ Dena Co. Ltd. 126,351 2,410 Nomura Real Estate Holdings Inc. 117,278 2,366 Shimamura Co. Ltd. 26,453 2,340 Nisshin Seifun Group Inc. 235,140 2,333 Hokuriku Electric Power Co. 189,634 2,331 ^ AEON Financial Service Co. Ltd. 100,670 2,328 Konami Corp. 98,149 2,327 Toho Gas Co. Ltd. 501,518 2,326 Koito Manufacturing Co. Ltd. 113,455 2,294 Nippon Kayaku Co. Ltd. 173,000 2,288 ^ Sanrio Co. Ltd. 62,050 2,285 Nissan Chemical Industries Ltd. 160,500 2,277 Mitsui Chemicals Inc. 944,190 2,268 Ibiden Co. Ltd. 123,683 2,266 Kamigumi Co. Ltd. 252,148 2,254 * Alps Electric Co. Ltd. 172,700 2,251 * Shikoku Electric Power Co. Inc. 157,044 2,241 DIC Corp. 773,000 2,207 Sawai Pharmaceutical Co. Ltd. 36,700 2,204 Teijin Ltd. 982,175 2,202 * NTN Corp. 510,000 2,201 Hiroshima Bank Ltd. 548,000 2,199 Ube Industries Ltd. 1,074,936 2,198 Idemitsu Kosan Co. Ltd. 98,392 2,195 Yamaguchi Financial Group Inc. 240,864 2,182 Sojitz Corp. 1,270,918 2,173 Ryohin Keikaku Co. Ltd. 23,300 2,148 Dowa Holdings Co. Ltd. 233,000 2,106 Keihan Electric Railway Co. Ltd. 553,000 2,092 Hitachi Construction Machinery Co. Ltd. 108,232 2,079 Taiyo Nippon Sanso Corp. 297,728 2,055 Hakuhodo DY Holdings Inc. 253,750 2,048 Showa Denko KK 1,510,499 2,046 Obic Co. Ltd. 66,200 2,041 Mitsubishi Logistics Corp. 144,831 2,026 Park24 Co. Ltd. 97,600 2,012 ^ Square Enix Holdings Co. Ltd. 70,415 2,000 Chugoku Bank Ltd. 160,109 1,985 Otsuka Corp. 16,742 1,981 GS Yuasa Corp. 379,999 1,976 Kaneka Corp. 317,995 1,967 * Haseko Corp. 261,800 1,953 * Hokkaido Electric Power Co. Inc. 187,293 1,938 ^ Nippon Paper Industries Co. Ltd. 107,948 1,935 Zeon Corp. 196,000 1,907 Nippon Electric Glass Co. Ltd. 422,752 1,904 NOK Corp. 115,356 1,865 Showa Shell Sekiyu KK 195,522 1,848 Advantest Corp. 172,087 1,846 Nishi-Nippon City Bank Ltd. 729,839 1,830 COMSYS Holdings Corp. 122,800 1,779 NHK Spring Co. Ltd. 171,396 1,761
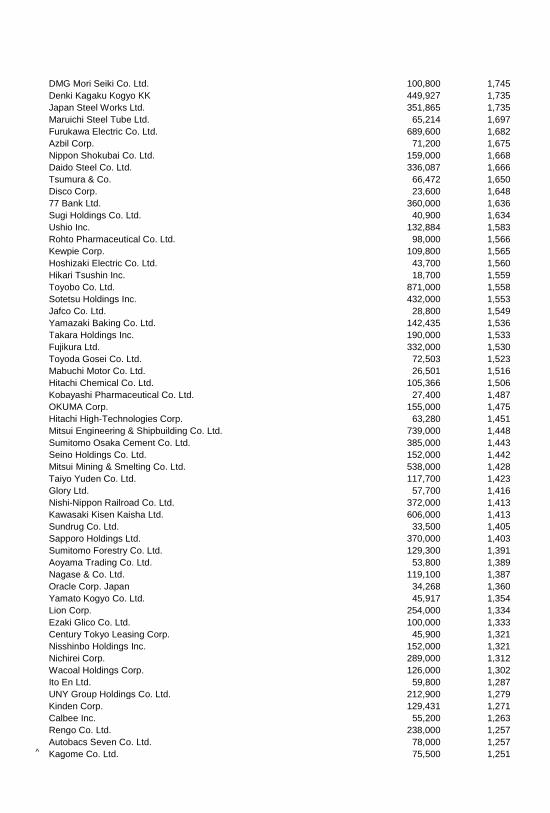
DMG Mori Seiki Co. Ltd. 100,800 1,745 Denki Kagaku Kogyo KK 449,927 1,735 Japan Steel Works Ltd. 351,865 1,735 Maruichi Steel Tube Ltd. 65,214 1,697 Furukawa Electric Co. Ltd. 689,600 1,682 Azbil Corp. 71,200 1,675 Nippon Shokubai Co. Ltd. 159,000 1,668 Daido Steel Co. Ltd. 336,087 1,666 Tsumura & Co. 66,472 1,650 Disco Corp. 23,600 1,648 77 Bank Ltd. 360,000 1,636 Sugi Holdings Co. Ltd. 40,900 1,634 Ushio Inc. 132,884 1,583 Rohto Pharmaceutical Co. Ltd. 98,000 1,566 Kewpie Corp. 109,800 1,565 Hoshizaki Electric Co. Ltd. 43,700 1,560 Hikari Tsushin Inc. 18,700 1,559 Toyobo Co. Ltd. 871,000 1,558 Sotetsu Holdings Inc. 432,000 1,553 Jafco Co. Ltd. 28,800 1,549 Yamazaki Baking Co. Ltd. 142,435 1,536 Takara Holdings Inc. 190,000 1,533 Fujikura Ltd. 332,000 1,530 Toyoda Gosei Co. Ltd. 72,503 1,523 Mabuchi Motor Co. Ltd. 26,501 1,516 Hitachi Chemical Co. Ltd. 105,366 1,506 Kobayashi Pharmaceutical Co. Ltd. 27,400 1,487 OKUMA Corp. 155,000 1,475 Hitachi High-Technologies Corp. 63,280 1,451 Mitsui Engineering & Shipbuilding Co. Ltd. 739,000 1,448 Sumitomo Osaka Cement Co. Ltd. 385,000 1,443 Seino Holdings Co. Ltd. 152,000 1,442 Mitsui Mining & Smelting Co. Ltd. 538,000 1,428 Taiyo Yuden Co. Ltd. 117,700 1,423 Glory Ltd. 57,700 1,416 Nishi-Nippon Railroad Co. Ltd. 372,000 1,413 Kawasaki Kisen Kaisha Ltd. 606,000 1,413 Sundrug Co. Ltd. 33,500 1,405 Sapporo Holdings Ltd. 370,000 1,403 Sumitomo Forestry Co. Ltd. 129,300 1,391 Aoyama Trading Co. Ltd. 53,800 1,389 Nagase & Co. Ltd. 119,100 1,387 Oracle Corp. Japan 34,268 1,360 Yamato Kogyo Co. Ltd. 45,917 1,354 Lion Corp. 254,000 1,334 Ezaki Glico Co. Ltd. 100,000 1,333 Century Tokyo Leasing Corp. 45,900 1,321 Nisshinbo Holdings Inc. 152,000 1,321 Nichirei Corp. 289,000 1,312 Wacoal Holdings Corp. 126,000 1,302 Ito En Ltd. 59,800 1,287 UNY Group Holdings Co. Ltd. 212,900 1,279 Kinden Corp. 129,431 1,271 Calbee Inc. 55,200 1,263 Rengo Co. Ltd. 238,000 1,257 Autobacs Seven Co. Ltd. 78,000 1,257 ^ Kagome Co. Ltd. 75,500 1,251
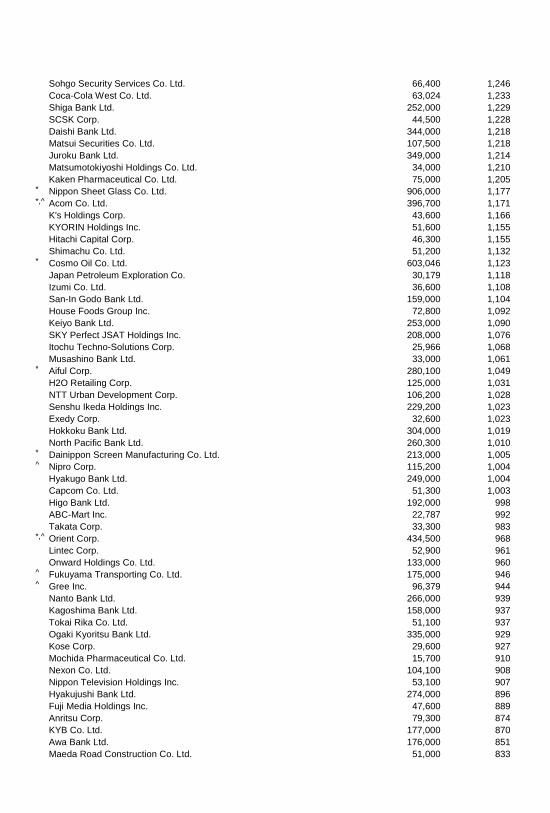
Sohgo Security Services Co. Ltd. 66,400 1,246 Coca-Cola West Co. Ltd. 63,024 1,233 Shiga Bank Ltd. 252,000 1,229 SCSK Corp. 44,500 1,228 Daishi Bank Ltd. 344,000 1,218 Matsui Securities Co. Ltd. 107,500 1,218 Juroku Bank Ltd. 349,000 1,214 Matsumotokiyoshi Holdings Co. Ltd. 34,000 1,210 Kaken Pharmaceutical Co. Ltd. 75,000 1,205 * Nippon Sheet Glass Co. Ltd. 906,000 1,177 *,^ Acom Co. Ltd. 396,700 1,171 K's Holdings Corp. 43,600 1,166 KYORIN Holdings Inc. 51,600 1,155 Hitachi Capital Corp. 46,300 1,155 Shimachu Co. Ltd. 51,200 1,132 * Cosmo Oil Co. Ltd. 603,046 1,123 Japan Petroleum Exploration Co. 30,179 1,118 Izumi Co. Ltd. 36,600 1,108 San-In Godo Bank Ltd. 159,000 1,104 House Foods Group Inc. 72,800 1,092 Keiyo Bank Ltd. 253,000 1,090 SKY Perfect JSAT Holdings Inc. 208,000 1,076 Itochu Techno-Solutions Corp. 25,966 1,068 Musashino Bank Ltd. 33,000 1,061 * Aiful Corp. 280,100 1,049 H2O Retailing Corp. 125,000 1,031 NTT Urban Development Corp. 106,200 1,028 Senshu Ikeda Holdings Inc. 229,200 1,023 Exedy Corp. 32,600 1,023 Hokkoku Bank Ltd. 304,000 1,019 North Pacific Bank Ltd. 260,300 1,010 * Dainippon Screen Manufacturing Co. Ltd. 213,000 1,005 ^ Nipro Corp. 115,200 1,004 Hyakugo Bank Ltd. 249,000 1,004 Capcom Co. Ltd. 51,300 1,003 Higo Bank Ltd. 192,000 998 ABC-Mart Inc. 22,787 992 Takata Corp. 33,300 983 *,^ Orient Corp. 434,500 968 Lintec Corp. 52,900 961 Onward Holdings Co. Ltd. 133,000 960 ^ Fukuyama Transporting Co. Ltd. 175,000 946 ^ Gree Inc. 96,379 944 Nanto Bank Ltd. 266,000 939 Kagoshima Bank Ltd. 158,000 937 Tokai Rika Co. Ltd. 51,100 937 Ogaki Kyoritsu Bank Ltd. 335,000 929 Kose Corp. 29,600 927 Mochida Pharmaceutical Co. Ltd. 15,700 910 Nexon Co. Ltd. 104,100 908 Nippon Television Holdings Inc. 53,100 907 Hyakujushi Bank Ltd. 274,000 896 Fuji Media Holdings Inc. 47,600 889 Anritsu Corp. 79,300 874 KYB Co. Ltd. 177,000 870 Awa Bank Ltd. 176,000 851 Maeda Road Construction Co. Ltd. 51,000 833
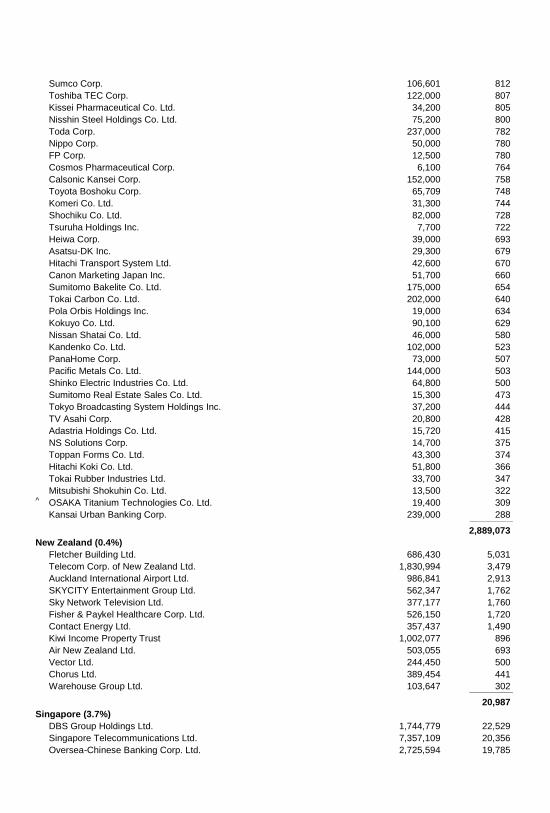
Sumco Corp. 106,601 812 Toshiba TEC Corp. 122,000 807 Kissei Pharmaceutical Co. Ltd. 34,200 805 Nisshin Steel Holdings Co. Ltd. 75,200 800 Toda Corp. 237,000 782 Nippo Corp. 50,000 780 FP Corp. 12,500 780 Cosmos Pharmaceutical Corp. 6,100 764 Calsonic Kansei Corp. 152,000 758 Toyota Boshoku Corp. 65,709 748 Komeri Co. Ltd. 31,300 744 Shochiku Co. Ltd. 82,000 728 Tsuruha Holdings Inc. 7,700 722 Heiwa Corp. 39,000 693 Asatsu-DK Inc. 29,300 679 Hitachi Transport System Ltd. 42,600 670 Canon Marketing Japan Inc. 51,700 660 Sumitomo Bakelite Co. Ltd. 175,000 654 Tokai Carbon Co. Ltd. 202,000 640 Pola Orbis Holdings Inc. 19,000 634 Kokuyo Co. Ltd. 90,100 629 Nissan Shatai Co. Ltd. 46,000 580 Kandenko Co. Ltd. 102,000 523 PanaHome Corp. 73,000 507 Pacific Metals Co. Ltd. 144,000 503 Shinko Electric Industries Co. Ltd. 64,800 500 Sumitomo Real Estate Sales Co. Ltd. 15,300 473 Tokyo Broadcasting System Holdings Inc. 37,200 444 TV Asahi Corp. 20,800 428 Adastria Holdings Co. Ltd. 15,720 415 NS Solutions Corp. 14,700 375 Toppan Forms Co. Ltd. 43,300 374 Hitachi Koki Co. Ltd. 51,800 366 Tokai Rubber Industries Ltd. 33,700 347 Mitsubishi Shokuhin Co. Ltd. 13,500 322 ^ OSAKA Titanium Technologies Co. Ltd. 19,400 309 Kansai Urban Banking Corp. 239,000 288 _____________
2,889,073
New Zealand (0.4%)
Fletcher Building Ltd. 686,430 5,031 Telecom Corp. of New Zealand Ltd. 1,830,994 3,479 Auckland International Airport Ltd. 986,841 2,913 SKYCITY Entertainment Group Ltd. 562,347 1,762 Sky Network Television Ltd. 377,177 1,760 Fisher & Paykel Healthcare Corp. Ltd. 526,150 1,720 Contact Energy Ltd. 357,437 1,490 Kiwi Income Property Trust 1,002,077 896 Air New Zealand Ltd. 503,055 693 Vector Ltd. 244,450 500 Chorus Ltd. 389,454 441 Warehouse Group Ltd. 103,647 302 _____________
20,987
Singapore (3.7%)
DBS Group Holdings Ltd. 1,744,779 22,529 Singapore Telecommunications Ltd. 7,357,109 20,356 Oversea-Chinese Banking Corp. Ltd. 2,725,594 19,785
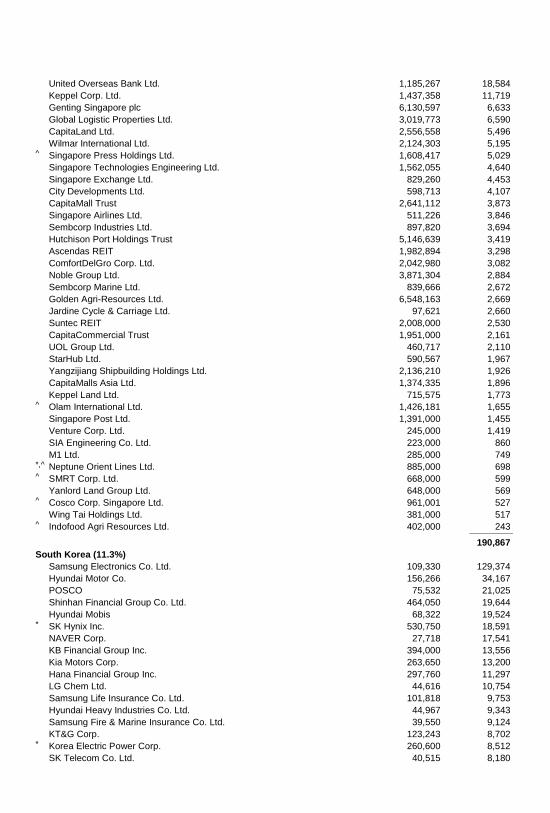
United Overseas Bank Ltd. 1,185,267 18,584 Keppel Corp. Ltd. 1,437,358 11,719 Genting Singapore plc 6,130,597 6,633 Global Logistic Properties Ltd. 3,019,773 6,590 CapitaLand Ltd. 2,556,558 5,496 Wilmar International Ltd. 2,124,303 5,195 ^ Singapore Press Holdings Ltd. 1,608,417 5,029 Singapore Technologies Engineering Ltd. 1,562,055 4,640 Singapore Exchange Ltd. 829,260 4,453 City Developments Ltd. 598,713 4,107 CapitaMall Trust 2,641,112 3,873 Singapore Airlines Ltd. 511,226 3,846 Sembcorp Industries Ltd. 897,820 3,694 Hutchison Port Holdings Trust 5,146,639 3,419 Ascendas REIT 1,982,894 3,298 ComfortDelGro Corp. Ltd. 2,042,980 3,082 Noble Group Ltd. 3,871,304 2,884 Sembcorp Marine Ltd. 839,666 2,672 Golden Agri-Resources Ltd. 6,548,163 2,669 Jardine Cycle & Carriage Ltd. 97,621 2,660 Suntec REIT 2,008,000 2,530 CapitaCommercial Trust 1,951,000 2,161 UOL Group Ltd. 460,717 2,110 StarHub Ltd. 590,567 1,967 Yangzijiang Shipbuilding Holdings Ltd. 2,136,210 1,926 CapitaMalls Asia Ltd. 1,374,335 1,896 Keppel Land Ltd. 715,575 1,773 ^ Olam International Ltd. 1,426,181 1,655 Singapore Post Ltd. 1,391,000 1,455 Venture Corp. Ltd. 245,000 1,419 SIA Engineering Co. Ltd. 223,000 860 M1 Ltd. 285,000 749 *,^ Neptune Orient Lines Ltd. 885,000 698 ^ SMRT Corp. Ltd. 668,000 599 Yanlord Land Group Ltd. 648,000 569 ^ Cosco Corp. Singapore Ltd. 961,001 527 Wing Tai Holdings Ltd. 381,000 517 ^ Indofood Agri Resources Ltd. 402,000 243 _____________
190,867
South Korea (11.3%)
Samsung Electronics Co. Ltd. 109,330 129,374 Hyundai Motor Co. 156,266 34,167 POSCO 75,532 21,025 Shinhan Financial Group Co. Ltd. 464,050 19,644 Hyundai Mobis 68,322 19,524 * SK Hynix Inc. 530,750 18,591 NAVER Corp. 27,718 17,541 KB Financial Group Inc. 394,000 13,556 Kia Motors Corp. 263,650 13,200 Hana Financial Group Inc. 297,760 11,297 LG Chem Ltd. 44,616 10,754 Samsung Life Insurance Co. Ltd. 101,818 9,753 Hyundai Heavy Industries Co. Ltd. 44,967 9,343 Samsung Fire & Marine Insurance Co. Ltd. 39,550 9,124 KT&G Corp. 123,243 8,702 * Korea Electric Power Corp. 260,600 8,512 SK Telecom Co. Ltd. 40,515 8,180
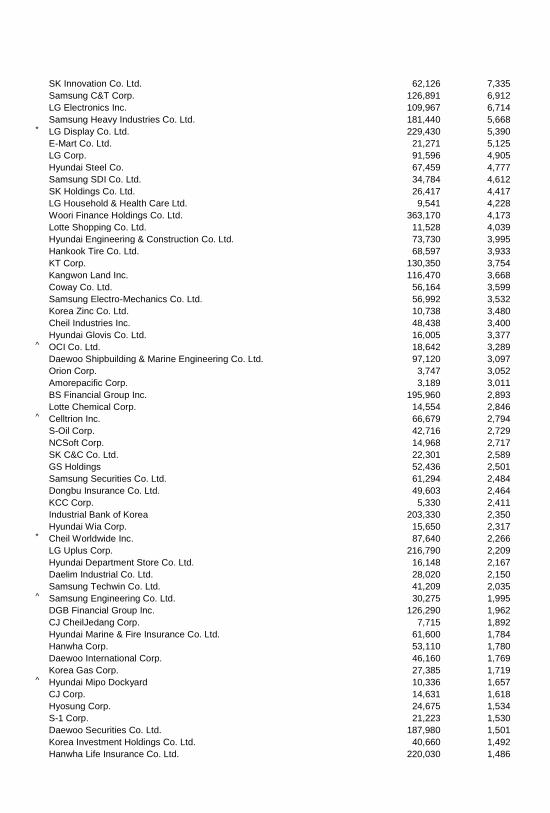
SK Innovation Co. Ltd. 62,126 7,335 Samsung C&T Corp. 126,891 6,912 LG Electronics Inc. 109,967 6,714 Samsung Heavy Industries Co. Ltd. 181,440 5,668 * LG Display Co. Ltd. 229,430 5,390 E-Mart Co. Ltd. 21,271 5,125 LG Corp. 91,596 4,905 Hyundai Steel Co. 67,459 4,777 Samsung SDI Co. Ltd. 34,784 4,612 SK Holdings Co. Ltd. 26,417 4,417 LG Household & Health Care Ltd. 9,541 4,228 Woori Finance Holdings Co. Ltd. 363,170 4,173 Lotte Shopping Co. Ltd. 11,528 4,039 Hyundai Engineering & Construction Co. Ltd. 73,730 3,995 Hankook Tire Co. Ltd. 68,597 3,933 KT Corp. 130,350 3,754 Kangwon Land Inc. 116,470 3,668 Coway Co. Ltd. 56,164 3,599 Samsung Electro-Mechanics Co. Ltd. 56,992 3,532 Korea Zinc Co. Ltd. 10,738 3,480 Cheil Industries Inc. 48,438 3,400 Hyundai Glovis Co. Ltd. 16,005 3,377 ^ OCI Co. Ltd. 18,642 3,289 Daewoo Shipbuilding & Marine Engineering Co. Ltd. 97,120 3,097 Orion Corp. 3,747 3,052 Amorepacific Corp. 3,189 3,011 BS Financial Group Inc. 195,960 2,893 Lotte Chemical Corp. 14,554 2,846 ^ Celltrion Inc. 66,679 2,794 S-Oil Corp. 42,716 2,729 NCSoft Corp. 14,968 2,717 SK C&C Co. Ltd. 22,301 2,589 GS Holdings 52,436 2,501 Samsung Securities Co. Ltd. 61,294 2,484 Dongbu Insurance Co. Ltd. 49,603 2,464 KCC Corp. 5,330 2,411 Industrial Bank of Korea 203,330 2,350 Hyundai Wia Corp. 15,650 2,317 * Cheil Worldwide Inc. 87,640 2,266 LG Uplus Corp. 216,790 2,209 Hyundai Department Store Co. Ltd. 16,148 2,167 Daelim Industrial Co. Ltd. 28,020 2,150 Samsung Techwin Co. Ltd. 41,209 2,035 ^ Samsung Engineering Co. Ltd. 30,275 1,995 DGB Financial Group Inc. 126,290 1,962 CJ CheilJedang Corp. 7,715 1,892 Hyundai Marine & Fire Insurance Co. Ltd. 61,600 1,784 Hanwha Corp. 53,110 1,780 Daewoo International Corp. 46,160 1,769 Korea Gas Corp. 27,385 1,719 ^ Hyundai Mipo Dockyard 10,336 1,657 CJ Corp. 14,631 1,618 Hyosung Corp. 24,675 1,534 S-1 Corp. 21,223 1,530 Daewoo Securities Co. Ltd. 187,980 1,501 Korea Investment Holdings Co. Ltd. 40,660 1,492 Hanwha Life Insurance Co. Ltd. 220,030 1,486
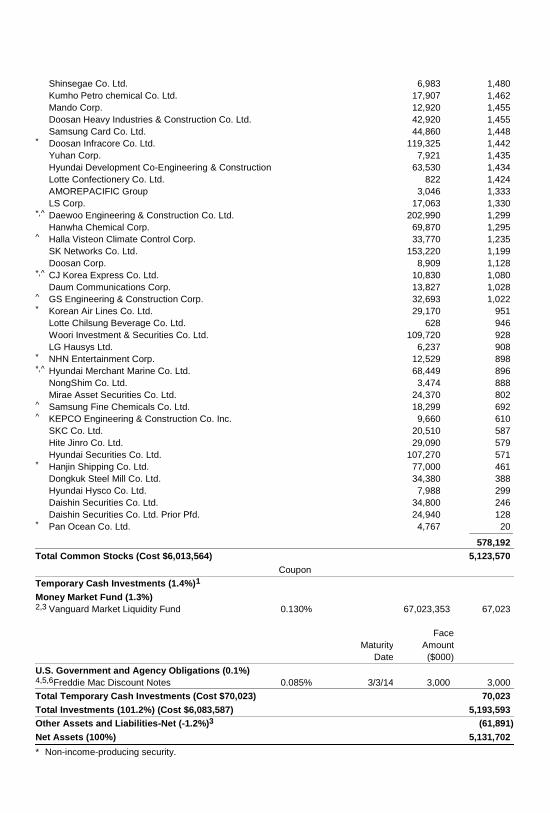
Shinsegae Co. Ltd. 6,983 1,480 Kumho Petro chemical Co. Ltd. 17,907 1,462 Mando Corp. 12,920 1,455 Doosan Heavy Industries & Construction Co. Ltd. 42,920 1,455 Samsung Card Co. Ltd. 44,860 1,448 * Doosan Infracore Co. Ltd. 119,325 1,442 Yuhan Corp. 7,921 1,435 Hyundai Development Co-Engineering & Construction 63,530 1,434 Lotte Confectionery Co. Ltd. 822 1,424 AMOREPACIFIC Group 3,046 1,333 LS Corp. 17,063 1,330 *,^ Daewoo Engineering & Construction Co. Ltd. 202,990 1,299 Hanwha Chemical Corp. 69,870 1,295 ^ Halla Visteon Climate Control Corp. 33,770 1,235 SK Networks Co. Ltd. 153,220 1,199 Doosan Corp. 8,909 1,128 *,^ CJ Korea Express Co. Ltd. 10,830 1,080 Daum Communications Corp. 13,827 1,028 ^ GS Engineering & Construction Corp. 32,693 1,022 * Korean Air Lines Co. Ltd. 29,170 951 Lotte Chilsung Beverage Co. Ltd. 628 946 Woori Investment & Securities Co. Ltd. 109,720 928 LG Hausys Ltd. 6,237 908 * NHN Entertainment Corp. 12,529 898 *,^ Hyundai Merchant Marine Co. Ltd. 68,449 896 NongShim Co. Ltd. 3,474 888 Mirae Asset Securities Co. Ltd. 24,370 802 ^ Samsung Fine Chemicals Co. Ltd. 18,299 692 ^ KEPCO Engineering & Construction Co. Inc. 9,660 610 SKC Co. Ltd. 20,510 587 Hite Jinro Co. Ltd. 29,090 579 Hyundai Securities Co. Ltd. 107,270 571 * Hanjin Shipping Co. Ltd. 77,000 461 Dongkuk Steel Mill Co. Ltd. 34,380 388 Hyundai Hysco Co. Ltd. 7,988 299 Daishin Securities Co. Ltd. 34,800 246 Daishin Securities Co. Ltd. Prior Pfd. 24,940 128 * Pan Ocean Co. Ltd. 4,767 20 _____________
578,192
Total Common Stocks (Cost $6,013,564) 5,123,570
Coupon
Temporary Cash Investments (1.4%)1
Money Market Fund (1.3%) 2,3 Vanguard Market Liquidity Fund 0.130% 67,023,353 67,023
Maturity
Date
Face
Amount
($000)
U.S. Government and Agency Obligations (0.1%)
4,5,6 Freddie Mac Discount Notes 0.085% 3/3/14 3,000 3,000
Total Temporary Cash Investments (Cost $70,023) 70,023
Total Investments (101.2%) (Cost $6,083,587) 5,193,593
Other Assets and Liabilities-Net (-1.2%)3 (61,891)
Net Assets (100%) 5,131,702
* Non-income-producing security.
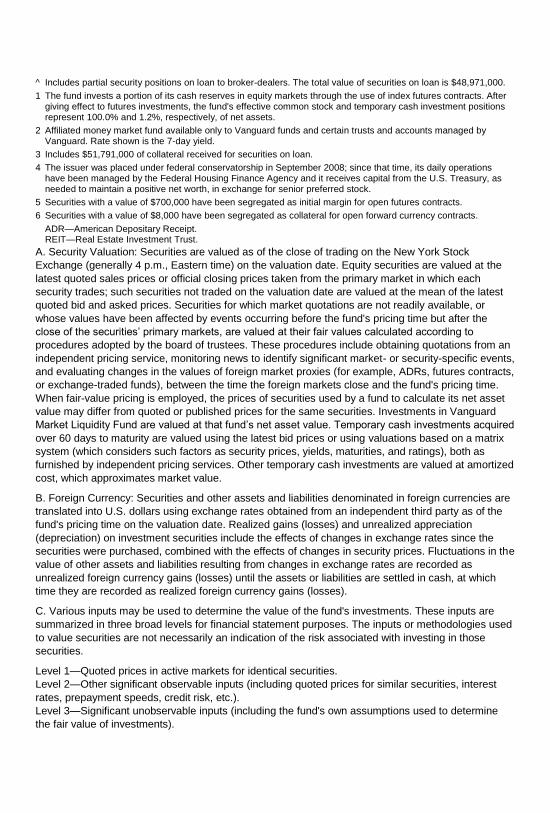
^ Includes partial security positions on loan to broker-dealers. The total value of securities on loan is $48,971,000.
1 The fund invests a portion of its cash reserves in equity markets through the use of index futures contracts. After giving effect to futures investments, the fund's effective common stock and temporary cash investment positions represent 100.0% and 1.2%, respectively, of net assets.
2 Affiliated money market fund available only to Vanguard funds and certain trusts and accounts managed by Vanguard. Rate shown is the 7-day yield.
3 Includes $51,791,000 of collateral received for securities on loan.
4 The issuer was placed under federal conservatorship in September 2008; since that time, its daily operations have been managed by the Federal Housing Finance Agency and it receives capital from the U.S. Treasury, as needed to maintain a positive net worth, in exchange for senior preferred stock.
5 Securities with a value of $700,000 have been segregated as initial margin for open futures contracts.
6 Securities with a value of $8,000 have been segregated as collateral for open forward currency contracts.
ADR—American Depositary Receipt. REIT—Real Estate Investment Trust.
A. Security Valuation: Securities are valued as of the close of trading on the New York Stock
Exchange (generally 4 p.m., Eastern time) on the valuation date. Equity securities are valued at the
latest quoted sales prices or official closing prices taken from the primary market in which each
security trades; such securities not traded on the valuation date are valued at the mean of the latest
quoted bid and asked prices. Securities for which market quotations are not readily available, or
whose values have been affected by events occurring before the fund's pricing time but after the
close of the securities’ primary markets, are valued at their fair values calculated according to
procedures adopted by the board of trustees. These procedures include obtaining quotations from an
independent pricing service, monitoring news to identify significant market- or security-specific events,
and evaluating changes in the values of foreign market proxies (for example, ADRs, futures contracts,
or exchange-traded funds), between the time the foreign markets close and the fund's pricing time.
When fair-value pricing is employed, the prices of securities used by a fund to calculate its net asset
value may differ from quoted or published prices for the same securities. Investments in Vanguard
Market Liquidity Fund are valued at that fund’s net asset value. Temporary cash investments acquired
over 60 days to maturity are valued using the latest bid prices or using valuations based on a matrix
system (which considers such factors as security prices, yields, maturities, and ratings), both as
furnished by independent pricing services. Other temporary cash investments are valued at amortized
cost, which approximates market value.
B. Foreign Currency: Securities and other assets and liabilities denominated in foreign currencies are
translated into U.S. dollars using exchange rates obtained from an independent third party as of the
fund's pricing time on the valuation date. Realized gains (losses) and unrealized appreciation
(depreciation) on investment securities include the effects of changes in exchange rates since the
securities were purchased, combined with the effects of changes in security prices. Fluctuations in the
value of other assets and liabilities resulting from changes in exchange rates are recorded as
unrealized foreign currency gains (losses) until the assets or liabilities are settled in cash, at which
time they are recorded as realized foreign currency gains (losses).
C. Various inputs may be used to determine the value of the fund's investments. These inputs are
summarized in three broad levels for financial statement purposes. The inputs or methodologies used
to value securities are not necessarily an indication of the risk associated with investing in those
securities.
Level 1—Quoted prices in active markets for identical securities.
Level 2—Other significant observable inputs (including quoted prices for similar securities, interest
rates, prepayment speeds, credit risk, etc.).
Level 3—Significant unobservable inputs (including the fund's own assumptions used to determine
the fair value of investments).
Pacific Stock Index Fund
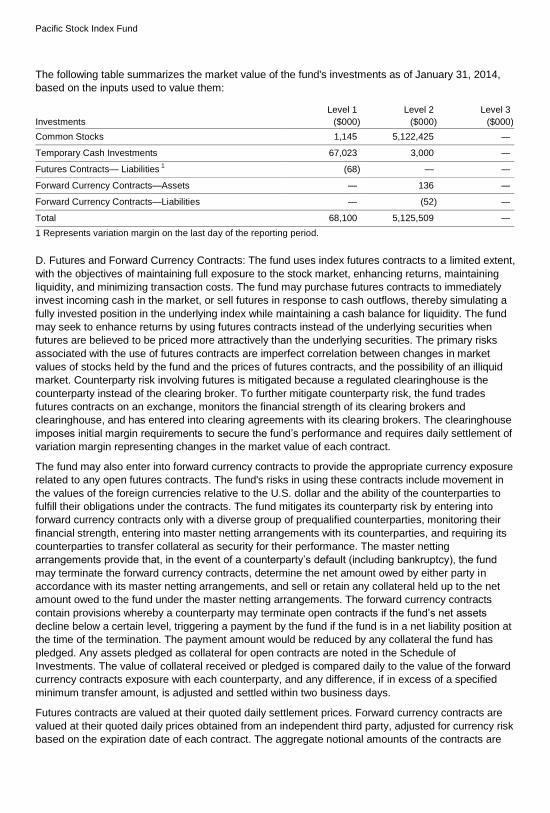
The following table summarizes the market value of the fund's investments as of January 31, 2014,
based on the inputs used to value them:
Investments
Level 1
($000 )
Level 2
($000 )
Level 3
($000 )
Common Stocks 1,145 5,122,425 —
Temporary Cash Investments 67,023 3,000 —
Futures Contracts— Liabilities 1 (68 ) — —
Forward Currency Contracts—Assets — 136 —
Forward Currency Contracts—Liabilities — (52 ) —
Total 68,100 5,125,509 —
1 Represents variation margin on the last day of the reporting period.
D. Futures and Forward Currency Contracts: The fund uses index futures contracts to a limited extent,
with the objectives of maintaining full exposure to the stock market, enhancing returns, maintaining
liquidity, and minimizing transaction costs. The fund may purchase futures contracts to immediately
invest incoming cash in the market, or sell futures in response to cash outflows, thereby simulating a
fully invested position in the underlying index while maintaining a cash balance for liquidity. The fund
may seek to enhance returns by using futures contracts instead of the underlying securities when
futures are believed to be priced more attractively than the underlying securities. The primary risks
associated with the use of futures contracts are imperfect correlation between changes in market
values of stocks held by the fund and the prices of futures contracts, and the possibility of an illiquid
market. Counterparty risk involving futures is mitigated because a regulated clearinghouse is the
counterparty instead of the clearing broker. To further mitigate counterparty risk, the fund trades
futures contracts on an exchange, monitors the financial strength of its clearing brokers and
clearinghouse, and has entered into clearing agreements with its clearing brokers. The clearinghouse
imposes initial margin requirements to secure the fund’s performance and requires daily settlement of
variation margin representing changes in the market value of each contract.
The fund may also enter into forward currency contracts to provide the appropriate currency exposure
related to any open futures contracts. The fund's risks in using these contracts include movement in
the values of the foreign currencies relative to the U.S. dollar and the ability of the counterparties to
fulfill their obligations under the contracts. The fund mitigates its counterparty risk by entering into
forward currency contracts only with a diverse group of prequalified counterparties, monitoring their
financial strength, entering into master netting arrangements with its counterparties, and requiring its
counterparties to transfer collateral as security for their performance. The master netting
arrangements provide that, in the event of a counterparty’s default (including bankruptcy), the fund
may terminate the forward currency contracts, determine the net amount owed by either party in
accordance with its master netting arrangements, and sell or retain any collateral held up to the net
amount owed to the fund under the master netting arrangements. The forward currency contracts
contain provisions whereby a counterparty may terminate open contracts if the fund’s net assets
decline below a certain level, triggering a payment by the fund if the fund is in a net liability position at
the time of the termination. The payment amount would be reduced by any collateral the fund has
pledged. Any assets pledged as collateral for open contracts are noted in the Schedule of
Investments. The value of collateral received or pledged is compared daily to the value of the forward
currency contracts exposure with each counterparty, and any difference, if in excess of a specified
minimum transfer amount, is adjusted and settled within two business days.
Futures contracts are valued at their quoted daily settlement prices. Forward currency contracts are
valued at their quoted daily prices obtained from an independent third party, adjusted for currency risk
based on the expiration date of each contract. The aggregate notional amounts of the contracts are
Pacific Stock Index Fund
not recorded in the Schedule of Investments. Fluctuations in the value of the contracts are recorded in
the Schedule of Investments as an asset (liability).
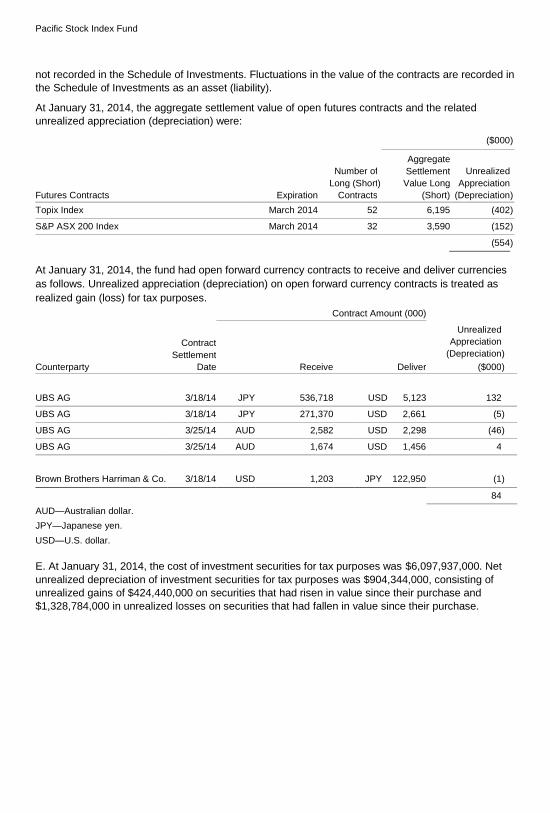
At January 31, 2014, the aggregate settlement value of open futures contracts and the related
unrealized appreciation (depreciation) were:
($000 )
Futures Contracts Expiration
Number of
Long (Short
Contracts
)
Aggregate
Settlement
Value Long
(Short)
Unrealized
Appreciation
(Depreciation )
Topix Index March 2014 52 6,195 (402 )
S&P ASX 200 Index March 2014 32 3,590 (152 )
(554 )
At January 31, 2014, the fund had open forward currency contracts to receive and deliver currencies
as follows. Unrealized appreciation (depreciation) on open forward currency contracts is treated as
realized gain (loss) for tax purposes. Contract Amount (000)
Counterparty
Contract
Settlement
Date Receive Deliver
Unrealized
Appreciation
(Depreciation
($000
)
)
UBS AG 3/18/14 JPY
536,718 USD 5,123 132
UBS AG 3/18/14 JPY 271,370 USD 2,661 (5 )
UBS AG 3/25/14 AUD 2,582 USD 2,298 (46 )
UBS AG 3/25/14 AUD 1,674 USD 1,456 4
Brown Brothers Harriman & Co. 3/18/14 USD
1,203 JPY 122,950 (1 )
84
AUD—Australian dollar.
JPY—Japanese yen.
USD—U.S. dollar.
E. At January 31, 2014, the cost of investment securities for tax purposes was $6,097,937,000. Net
unrealized depreciation of investment securities for tax purposes was $904,344,000, consisting of
unrealized gains of $424,440,000 on securities that had risen in value since their purchase and
$1,328,784,000 in unrealized losses on securities that had fallen in value since their purchase.
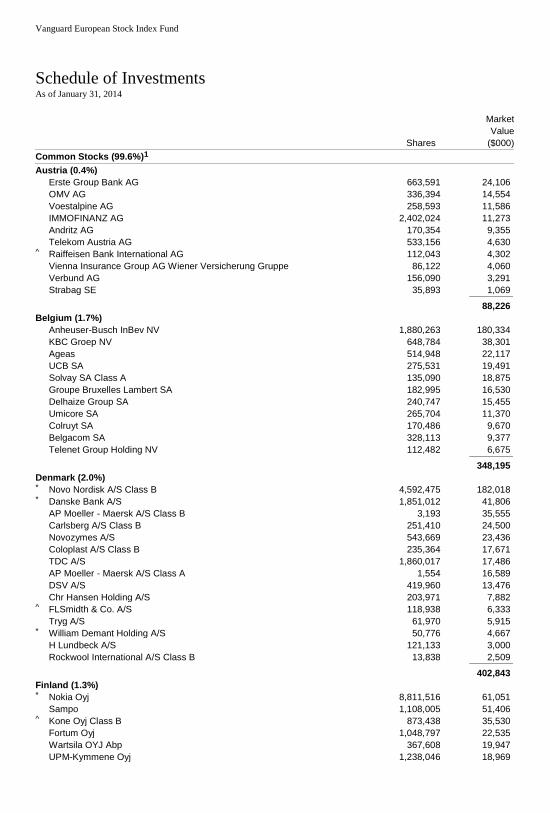
Vanguard European Stock Index Fund
Schedule of Investments As of January 31, 2014
Shares
Market
Value
($000)
Common Stocks (99.6%)1
Austria (0.4%)
Erste Group Bank AG 663,591 24,106 OMV AG 336,394 14,554 Voestalpine AG 258,593 11,586 IMMOFINANZ AG 2,402,024 11,273 Andritz AG 170,354 9,355 Telekom Austria AG 533,156 4,630 ^ Raiffeisen Bank International AG 112,043 4,302 Vienna Insurance Group AG Wiener Versicherung Gruppe 86,122 4,060 Verbund AG 156,090 3,291 Strabag SE 35,893 1,069 _____________
88,226
Belgium (1.7%)
Anheuser-Busch InBev NV 1,880,263 180,334 KBC Groep NV 648,784 38,301 Ageas 514,948 22,117 UCB SA 275,531 19,491 Solvay SA Class A 135,090 18,875 Groupe Bruxelles Lambert SA 182,995 16,530 Delhaize Group SA 240,747 15,455 Umicore SA 265,704 11,370 Colruyt SA 170,486 9,670 Belgacom SA 328,113 9,377 Telenet Group Holding NV 112,482 6,675 _____________
348,195
Denmark (2.0%)
* Novo Nordisk A/S Class B 4,592,475 182,018 * Danske Bank A/S 1,851,012 41,806 AP Moeller - Maersk A/S Class B 3,193 35,555 Carlsberg A/S Class B 251,410 24,500 Novozymes A/S 543,669 23,436 Coloplast A/S Class B 235,364 17,671 TDC A/S 1,860,017 17,486 AP Moeller - Maersk A/S Class A 1,554 16,589 DSV A/S 419,960 13,476 Chr Hansen Holding A/S 203,971 7,882 ^ FLSmidth & Co. A/S 118,938 6,333 Tryg A/S 61,970 5,915 * William Demant Holding A/S 50,776 4,667 H Lundbeck A/S 121,133 3,000 Rockwool International A/S Class B 13,838 2,509 _____________
402,843
Finland (1.3%)
* Nokia Oyj 8,811,516 61,051 Sampo 1,108,005 51,406 ^ Kone Oyj Class B 873,438 35,530 Fortum Oyj 1,048,797 22,535 Wartsila OYJ Abp 367,608 19,947 UPM-Kymmene Oyj 1,238,046 18,969
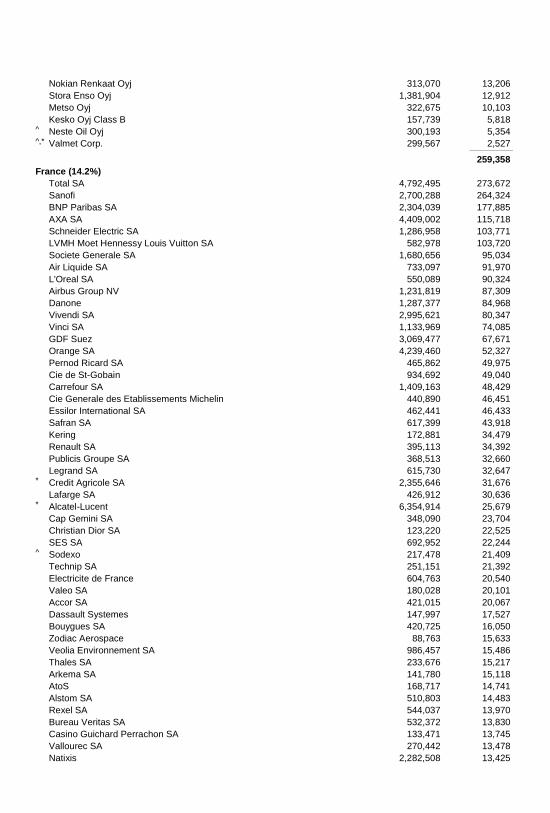
Nokian Renkaat Oyj 313,070 13,206 Stora Enso Oyj 1,381,904 12,912 Metso Oyj 322,675 10,103 Kesko Oyj Class B 157,739 5,818 ^ Neste Oil Oyj 300,193 5,354 ^,* Valmet Corp. 299,567 2,527 _____________
259,358
France (14.2%)
Total SA 4,792,495 273,672 Sanofi 2,700,288 264,324 BNP Paribas SA 2,304,039 177,885 AXA SA 4,409,002 115,718 Schneider Electric SA 1,286,958 103,771 LVMH Moet Hennessy Louis Vuitton SA 582,978 103,720 Societe Generale SA 1,680,656 95,034 Air Liquide SA 733,097 91,970 L'Oreal SA 550,089 90,324 Airbus Group NV 1,231,819 87,309 Danone 1,287,377 84,968 Vivendi SA 2,995,621 80,347 Vinci SA 1,133,969 74,085 GDF Suez 3,069,477 67,671 Orange SA 4,239,460 52,327 Pernod Ricard SA 465,862 49,975 Cie de St-Gobain 934,692 49,040 Carrefour SA 1,409,163 48,429 Cie Generale des Etablissements Michelin 440,890 46,451 Essilor International SA 462,441 46,433 Safran SA 617,399 43,918 Kering 172,881 34,479 Renault SA 395,113 34,392 Publicis Groupe SA 368,513 32,660 Legrand SA 615,730 32,647 * Credit Agricole SA 2,355,646 31,676 Lafarge SA 426,912 30,636 * Alcatel-Lucent 6,354,914 25,679 Cap Gemini SA 348,090 23,704 Christian Dior SA 123,220 22,525 SES SA 692,952 22,244 ^ Sodexo 217,478 21,409 Technip SA 251,151 21,392 Electricite de France 604,763 20,540 Valeo SA 180,028 20,101 Accor SA 421,015 20,067 Dassault Systemes 147,997 17,527 Bouygues SA 420,725 16,050 Zodiac Aerospace 88,763 15,633 Veolia Environnement SA 986,457 15,486 Thales SA 233,676 15,217 Arkema SA 141,780 15,118 AtoS 168,717 14,741 Alstom SA 510,803 14,483 Rexel SA 544,037 13,970 Bureau Veritas SA 532,372 13,830 Casino Guichard Perrachon SA 133,471 13,745 Vallourec SA 270,442 13,478 Natixis 2,282,508 13,425
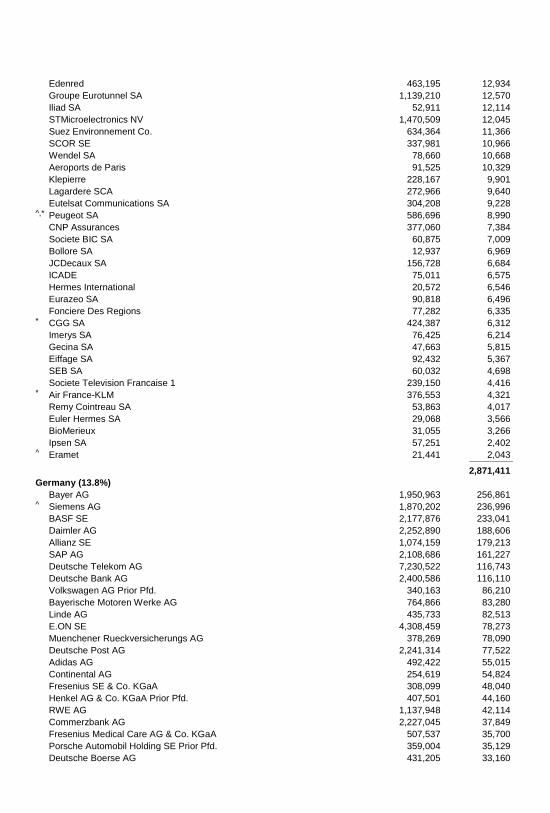
Edenred 463,195 12,934 Groupe Eurotunnel SA 1,139,210 12,570 Iliad SA 52,911 12,114 STMicroelectronics NV 1,470,509 12,045 Suez Environnement Co. 634,364 11,366 SCOR SE 337,981 10,966 Wendel SA 78,660 10,668 Aeroports de Paris 91,525 10,329 Klepierre 228,167 9,901 Lagardere SCA 272,966 9,640 Eutelsat Communications SA 304,208 9,228 ^,* Peugeot SA 586,696 8,990 CNP Assurances 377,060 7,384 Societe BIC SA 60,875 7,009 Bollore SA 12,937 6,969 JCDecaux SA 156,728 6,684 ICADE 75,011 6,575 Hermes International 20,572 6,546 Eurazeo SA 90,818 6,496 Fonciere Des Regions 77,282 6,335 * CGG SA 424,387 6,312 Imerys SA 76,425 6,214 Gecina SA 47,663 5,815 Eiffage SA 92,432 5,367 SEB SA 60,032 4,698 Societe Television Francaise 1 239,150 4,416 * Air France-KLM 376,553 4,321 Remy Cointreau SA 53,863 4,017 Euler Hermes SA 29,068 3,566 BioMerieux 31,055 3,266 Ipsen SA 57,251 2,402 ^ Eramet 21,441 2,043 _____________
2,871,411
Germany (13.8%)
Bayer AG 1,950,963 256,861 ^ Siemens AG 1,870,202 236,996 BASF SE 2,177,876 233,041 Daimler AG 2,252,890 188,606 Allianz SE 1,074,159 179,213 SAP AG 2,108,686 161,227 Deutsche Telekom AG 7,230,522 116,743 Deutsche Bank AG 2,400,586 116,110 Volkswagen AG Prior Pfd. 340,163 86,210 Bayerische Motoren Werke AG 764,866 83,280 Linde AG 435,733 82,513 E.ON SE 4,308,459 78,273 Muenchener Rueckversicherungs AG 378,269 78,090 Deutsche Post AG 2,241,314 77,522 Adidas AG 492,422 55,015 Continental AG 254,619 54,824 Fresenius SE & Co. KGaA 308,099 48,040 Henkel AG & Co. KGaA Prior Pfd. 407,501 44,160 RWE AG 1,137,948 42,114 Commerzbank AG 2,227,045 37,849 Fresenius Medical Care AG & Co. KGaA 507,537 35,700 Porsche Automobil Holding SE Prior Pfd. 359,004 35,129 Deutsche Boerse AG 431,205 33,160
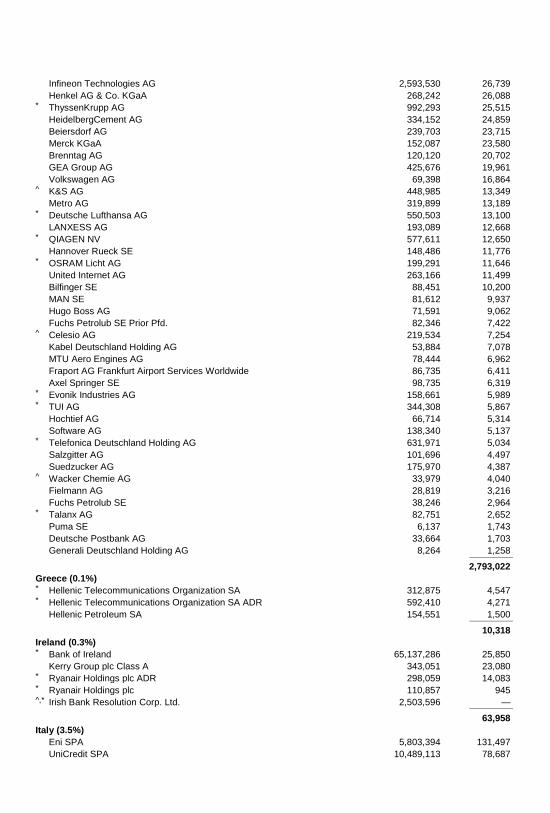
Infineon Technologies AG 2,593,530 26,739 Henkel AG & Co. KGaA 268,242 26,088 * ThyssenKrupp AG 992,293 25,515 HeidelbergCement AG 334,152 24,859 Beiersdorf AG 239,703 23,715 Merck KGaA 152,087 23,580 Brenntag AG 120,120 20,702 GEA Group AG 425,676 19,961 Volkswagen AG 69,398 16,864 ^ K&S AG 448,985 13,349 Metro AG 319,899 13,189 * Deutsche Lufthansa AG 550,503 13,100 LANXESS AG 193,089 12,668 * QIAGEN NV 577,611 12,650 Hannover Rueck SE 148,486 11,776 * OSRAM Licht AG 199,291 11,646 United Internet AG 263,166 11,499 Bilfinger SE 88,451 10,200 MAN SE 81,612 9,937 Hugo Boss AG 71,591 9,062 Fuchs Petrolub SE Prior Pfd. 82,346 7,422 ^ Celesio AG 219,534 7,254 Kabel Deutschland Holding AG 53,884 7,078 MTU Aero Engines AG 78,444 6,962 Fraport AG Frankfurt Airport Services Worldwide 86,735 6,411 Axel Springer SE 98,735 6,319 * Evonik Industries AG 158,661 5,989 * TUI AG 344,308 5,867 Hochtief AG 66,714 5,314 Software AG 138,340 5,137 * Telefonica Deutschland Holding AG 631,971 5,034 Salzgitter AG 101,696 4,497 Suedzucker AG 175,970 4,387 ^ Wacker Chemie AG 33,979 4,040 Fielmann AG 28,819 3,216 Fuchs Petrolub SE 38,246 2,964 * Talanx AG 82,751 2,652 Puma SE 6,137 1,743 Deutsche Postbank AG 33,664 1,703 Generali Deutschland Holding AG 8,264 1,258 _____________
2,793,022
Greece (0.1%)
* Hellenic Telecommunications Organization SA 312,875 4,547 * Hellenic Telecommunications Organization SA ADR 592,410 4,271 Hellenic Petroleum SA 154,551 1,500 _____________
10,318
Ireland (0.3%)
* Bank of Ireland 65,137,286 25,850 Kerry Group plc Class A 343,051 23,080 * Ryanair Holdings plc ADR 298,059 14,083 * Ryanair Holdings plc 110,857 945 ^,* Irish Bank Resolution Corp. Ltd. 2,503,596 — _____________
63,958
Italy (3.5%)
Eni SPA 5,803,394 131,497 UniCredit SPA 10,489,113 78,687
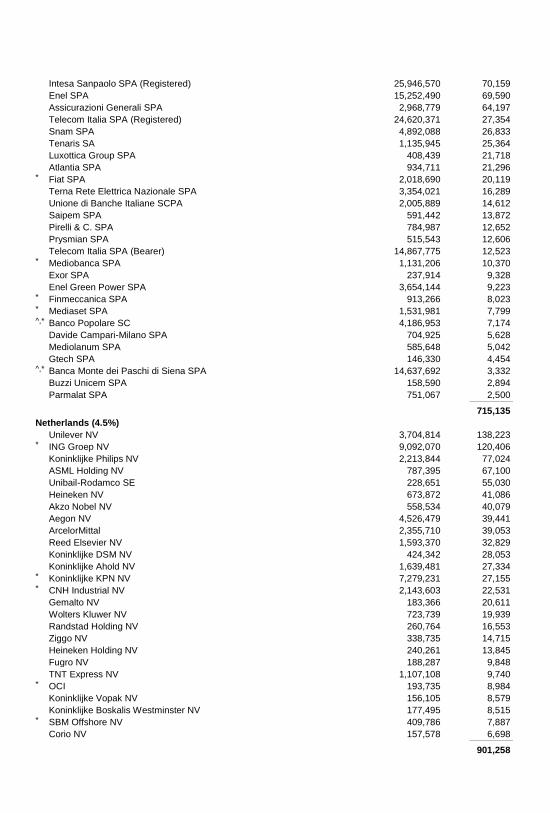
Intesa Sanpaolo SPA (Registered) 25,946,570 70,159 Enel SPA 15,252,490 69,590 Assicurazioni Generali SPA 2,968,779 64,197 Telecom Italia SPA (Registered) 24,620,371 27,354 Snam SPA 4,892,088 26,833 Tenaris SA 1,135,945 25,364 Luxottica Group SPA 408,439 21,718 Atlantia SPA 934,711 21,296 * Fiat SPA 2,018,690 20,119 Terna Rete Elettrica Nazionale SPA 3,354,021 16,289 Unione di Banche Italiane SCPA 2,005,889 14,612 Saipem SPA 591,442 13,872 Pirelli & C. SPA 784,987 12,652 Prysmian SPA 515,543 12,606 Telecom Italia SPA (Bearer) 14,867,775 12,523 * Mediobanca SPA 1,131,206 10,370 Exor SPA 237,914 9,328 Enel Green Power SPA 3,654,144 9,223 * Finmeccanica SPA 913,266 8,023 * Mediaset SPA 1,531,981 7,799 ^,* Banco Popolare SC 4,186,953 7,174 Davide Campari-Milano SPA 704,925 5,628 Mediolanum SPA 585,648 5,042 Gtech SPA 146,330 4,454 ^,* Banca Monte dei Paschi di Siena SPA 14,637,692 3,332 Buzzi Unicem SPA 158,590 2,894 Parmalat SPA 751,067 2,500 _____________
715,135
Netherlands (4.5%)
Unilever NV 3,704,814 138,223 * ING Groep NV 9,092,070 120,406 Koninklijke Philips NV 2,213,844 77,024 ASML Holding NV 787,395 67,100 Unibail-Rodamco SE 228,651 55,030 Heineken NV 673,872 41,086 Akzo Nobel NV 558,534 40,079 Aegon NV 4,526,479 39,441 ArcelorMittal 2,355,710 39,053 Reed Elsevier NV 1,593,370 32,829 Koninklijke DSM NV 424,342 28,053 Koninklijke Ahold NV 1,639,481 27,334 * Koninklijke KPN NV 7,279,231 27,155 * CNH Industrial NV 2,143,603 22,531 Gemalto NV 183,366 20,611 Wolters Kluwer NV 723,739 19,939 Randstad Holding NV 260,764 16,553 Ziggo NV 338,735 14,715 Heineken Holding NV 240,261 13,845 Fugro NV 188,287 9,848 TNT Express NV 1,107,108 9,740 * OCI 193,735 8,984 Koninklijke Vopak NV 156,105 8,579 Koninklijke Boskalis Westminster NV 177,495 8,515 * SBM Offshore NV 409,786 7,887 Corio NV 157,578 6,698 _____________
901,258
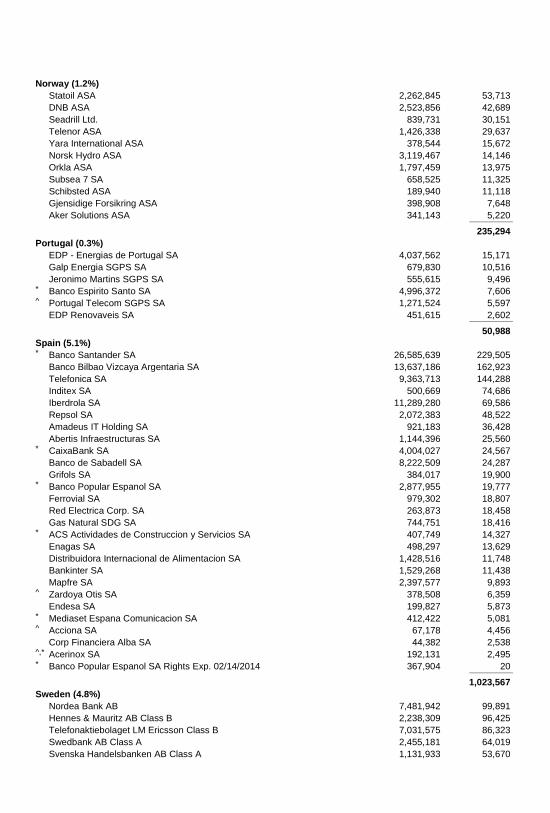
Norway (1.2%)
Statoil ASA 2,262,845 53,713 DNB ASA 2,523,856 42,689 Seadrill Ltd. 839,731 30,151 Telenor ASA 1,426,338 29,637 Yara International ASA 378,544 15,672 Norsk Hydro ASA 3,119,467 14,146 Orkla ASA 1,797,459 13,975 Subsea 7 SA 658,525 11,325 Schibsted ASA 189,940 11,118 Gjensidige Forsikring ASA 398,908 7,648 Aker Solutions ASA 341,143 5,220 _____________
235,294
Portugal (0.3%)
EDP - Energias de Portugal SA 4,037,562 15,171 Galp Energia SGPS SA 679,830 10,516 Jeronimo Martins SGPS SA 555,615 9,496 * Banco Espirito Santo SA 4,996,372 7,606 ^ Portugal Telecom SGPS SA 1,271,524 5,597 EDP Renovaveis SA 451,615 2,602 _____________
50,988
Spain (5.1%)
* Banco Santander SA 26,585,639 229,505 Banco Bilbao Vizcaya Argentaria SA 13,637,186 162,923 Telefonica SA 9,363,713 144,288 Inditex SA 500,669 74,686 Iberdrola SA 11,289,280 69,586 Repsol SA 2,072,383 48,522 Amadeus IT Holding SA 921,183 36,428 Abertis Infraestructuras SA 1,144,396 25,560 * CaixaBank SA 4,004,027 24,567 Banco de Sabadell SA 8,222,509 24,287 Grifols SA 384,017 19,900 * Banco Popular Espanol SA 2,877,955 19,777 Ferrovial SA 979,302 18,807 Red Electrica Corp. SA 263,873 18,458 Gas Natural SDG SA 744,751 18,416 * ACS Actividades de Construccion y Servicios SA 407,749 14,327 Enagas SA 498,297 13,629 Distribuidora Internacional de Alimentacion SA 1,428,516 11,748 Bankinter SA 1,529,268 11,438 Mapfre SA 2,397,577 9,893 ^ Zardoya Otis SA 378,508 6,359 Endesa SA 199,827 5,873 * Mediaset Espana Comunicacion SA 412,422 5,081 ^ Acciona SA 67,178 4,456 Corp Financiera Alba SA 44,382 2,538 ^,* Acerinox SA 192,131 2,495 * Banco Popular Espanol SA Rights Exp. 02/14/2014 367,904 20 _____________
1,023,567
Sweden (4.8%)
Nordea Bank AB 7,481,942 99,891 Hennes & Mauritz AB Class B 2,238,309 96,425 Telefonaktiebolaget LM Ericsson Class B 7,031,575 86,323 Swedbank AB Class A 2,455,181 64,019 Svenska Handelsbanken AB Class A 1,131,933 53,670
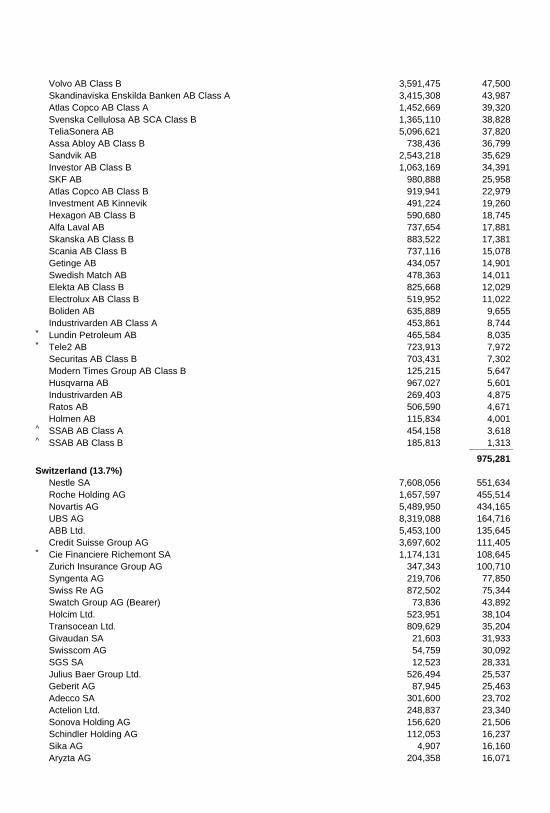
Volvo AB Class B 3,591,475 47,500 Skandinaviska Enskilda Banken AB Class A 3,415,308 43,987 Atlas Copco AB Class A 1,452,669 39,320 Svenska Cellulosa AB SCA Class B 1,365,110 38,828 TeliaSonera AB 5,096,621 37,820 Assa Abloy AB Class B 738,436 36,799 Sandvik AB 2,543,218 35,629 Investor AB Class B 1,063,169 34,391 SKF AB 980,888 25,958 Atlas Copco AB Class B 919,941 22,979 Investment AB Kinnevik 491,224 19,260 Hexagon AB Class B 590,680 18,745 Alfa Laval AB 737,654 17,881 Skanska AB Class B 883,522 17,381 Scania AB Class B 737,116 15,078 Getinge AB 434,057 14,901 Swedish Match AB 478,363 14,011 Elekta AB Class B 825,668 12,029 Electrolux AB Class B 519,952 11,022 Boliden AB 635,889 9,655 Industrivarden AB Class A 453,861 8,744 * Lundin Petroleum AB 465,584 8,035 * Tele2 AB 723,913 7,972 Securitas AB Class B 703,431 7,302 Modern Times Group AB Class B 125,215 5,647 Husqvarna AB 967,027 5,601 Industrivarden AB 269,403 4,875 Ratos AB 506,590 4,671 Holmen AB 115,834 4,001 ^ SSAB AB Class A 454,158 3,618 ^ SSAB AB Class B 185,813 1,313 _____________
975,281
Switzerland (13.7%)
Nestle SA 7,608,056 551,634 Roche Holding AG 1,657,597 455,514 Novartis AG 5,489,950 434,165 UBS AG 8,319,088 164,716 ABB Ltd. 5,453,100 135,645 Credit Suisse Group AG 3,697,602 111,405 * Cie Financiere Richemont SA 1,174,131 108,645 Zurich Insurance Group AG 347,343 100,710 Syngenta AG 219,706 77,850 Swiss Re AG 872,502 75,344 Swatch Group AG (Bearer) 73,836 43,892 Holcim Ltd. 523,951 38,104 Transocean Ltd. 809,629 35,204 Givaudan SA 21,603 31,933 Swisscom AG 54,759 30,092 SGS SA 12,523 28,331 Julius Baer Group Ltd. 526,494 25,537 Geberit AG 87,945 25,463 Adecco SA 301,600 23,702 Actelion Ltd. 248,837 23,340 Sonova Holding AG 156,620 21,506 Schindler Holding AG 112,053 16,237 Sika AG 4,907 16,160 Aryzta AG 204,358 16,071
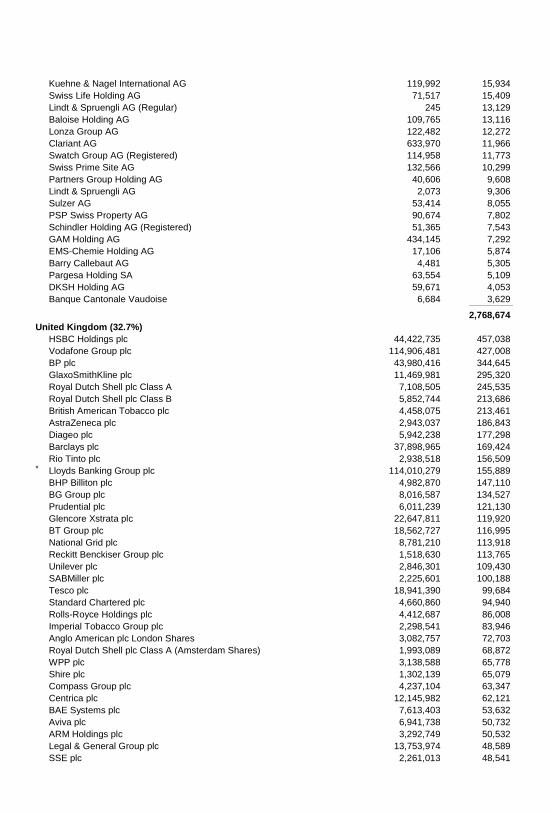
Kuehne & Nagel International AG 119,992 15,934 Swiss Life Holding AG 71,517 15,409 Lindt & Spruengli AG (Regular) 245 13,129 Baloise Holding AG 109,765 13,116 Lonza Group AG 122,482 12,272 Clariant AG 633,970 11,966 Swatch Group AG (Registered) 114,958 11,773 Swiss Prime Site AG 132,566 10,299 Partners Group Holding AG 40,606 9,608 Lindt & Spruengli AG 2,073 9,306 Sulzer AG 53,414 8,055 PSP Swiss Property AG 90,674 7,802 Schindler Holding AG (Registered) 51,365 7,543 GAM Holding AG 434,145 7,292 EMS-Chemie Holding AG 17,106 5,874 Barry Callebaut AG 4,481 5,305 Pargesa Holding SA 63,554 5,109 DKSH Holding AG 59,671 4,053 Banque Cantonale Vaudoise 6,684 3,629 _____________
2,768,674
United Kingdom (32.7%)
HSBC Holdings plc 44,422,735 457,038 Vodafone Group plc 114,906,481 427,008 BP plc 43,980,416 344,645 GlaxoSmithKline plc 11,469,981 295,320 Royal Dutch Shell plc Class A 7,108,505 245,535 Royal Dutch Shell plc Class B 5,852,744 213,686 British American Tobacco plc 4,458,075 213,461 AstraZeneca plc 2,943,037 186,843 Diageo plc 5,942,238 177,298 Barclays plc 37,898,965 169,424 Rio Tinto plc 2,938,518 156,509 * Lloyds Banking Group plc 114,010,279 155,889 BHP Billiton plc 4,982,870 147,110 BG Group plc 8,016,587 134,527 Prudential plc 6,011,239 121,130 Glencore Xstrata plc 22,647,811 119,920 BT Group plc 18,562,727 116,995 National Grid plc 8,781,210 113,918 Reckitt Benckiser Group plc 1,518,630 113,765 Unilever plc 2,846,301 109,430 SABMiller plc 2,225,601 100,188 Tesco plc 18,941,390 99,684 Standard Chartered plc 4,660,860 94,940 Rolls-Royce Holdings plc 4,412,687 86,008 Imperial Tobacco Group plc 2,298,541 83,946 Anglo American plc London Shares 3,082,757 72,703 Royal Dutch Shell plc Class A (Amsterdam Shares) 1,993,089 68,872 WPP plc 3,138,588 65,778 Shire plc 1,302,139 65,079 Compass Group plc 4,237,104 63,347 Centrica plc 12,145,982 62,121 BAE Systems plc 7,613,403 53,632 Aviva plc 6,941,738 50,732 ARM Holdings plc 3,292,749 50,532 Legal & General Group plc 13,753,974 48,589 SSE plc 2,261,013 48,541
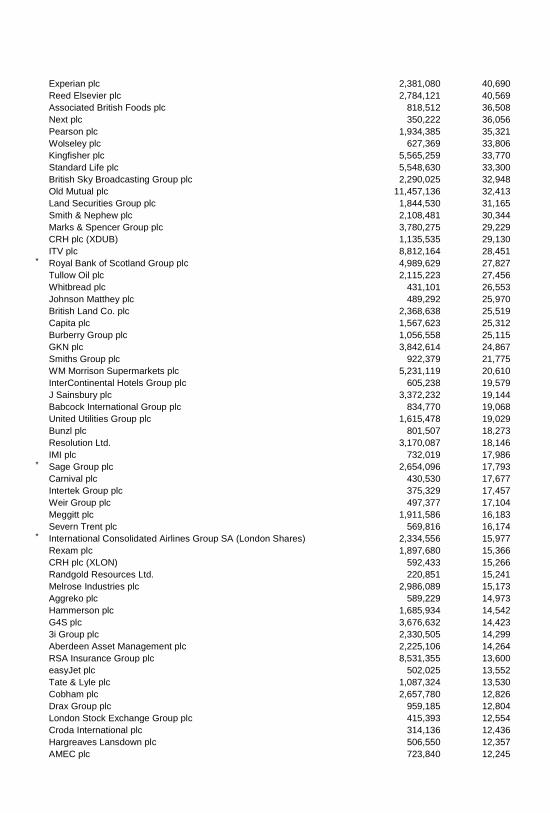
Experian plc 2,381,080 40,690 Reed Elsevier plc 2,784,121 40,569 Associated British Foods plc 818,512 36,508 Next plc 350,222 36,056 Pearson plc 1,934,385 35,321 Wolseley plc 627,369 33,806 Kingfisher plc 5,565,259 33,770 Standard Life plc 5,548,630 33,300 British Sky Broadcasting Group plc 2,290,025 32,948 Old Mutual plc 11,457,136 32,413 Land Securities Group plc 1,844,530 31,165 Smith & Nephew plc 2,108,481 30,344 Marks & Spencer Group plc 3,780,275 29,229 CRH plc (XDUB) 1,135,535 29,130 ITV plc 8,812,164 28,451 * Royal Bank of Scotland Group plc 4,989,629 27,827 Tullow Oil plc 2,115,223 27,456 Whitbread plc 431,101 26,553 Johnson Matthey plc 489,292 25,970 British Land Co. plc 2,368,638 25,519 Capita plc 1,567,623 25,312 Burberry Group plc 1,056,558 25,115 GKN plc 3,842,614 24,867 Smiths Group plc 922,379 21,775 WM Morrison Supermarkets plc 5,231,119 20,610 InterContinental Hotels Group plc 605,238 19,579 J Sainsbury plc 3,372,232 19,144 Babcock International Group plc 834,770 19,068 United Utilities Group plc 1,615,478 19,029 Bunzl plc 801,507 18,273 Resolution Ltd. 3,170,087 18,146 IMI plc 732,019 17,986 * Sage Group plc 2,654,096 17,793 Carnival plc 430,530 17,677 Intertek Group plc 375,329 17,457 Weir Group plc 497,377 17,104 Meggitt plc 1,911,586 16,183 Severn Trent plc 569,816 16,174 * International Consolidated Airlines Group SA (London Shares) 2,334,556 15,977 Rexam plc 1,897,680 15,366 CRH plc (XLON) 592,433 15,266 Randgold Resources Ltd. 220,851 15,241 Melrose Industries plc 2,986,089 15,173 Aggreko plc 589,229 14,973 Hammerson plc 1,685,934 14,542 G4S plc 3,676,632 14,423 3i Group plc 2,330,505 14,299 Aberdeen Asset Management plc 2,225,106 14,264 RSA Insurance Group plc 8,531,355 13,600 easyJet plc 502,025 13,552 Tate & Lyle plc 1,087,324 13,530 Cobham plc 2,657,780 12,826 Drax Group plc 959,185 12,804 London Stock Exchange Group plc 415,393 12,554 Croda International plc 314,136 12,436 Hargreaves Lansdown plc 506,550 12,357 AMEC plc 723,840 12,245
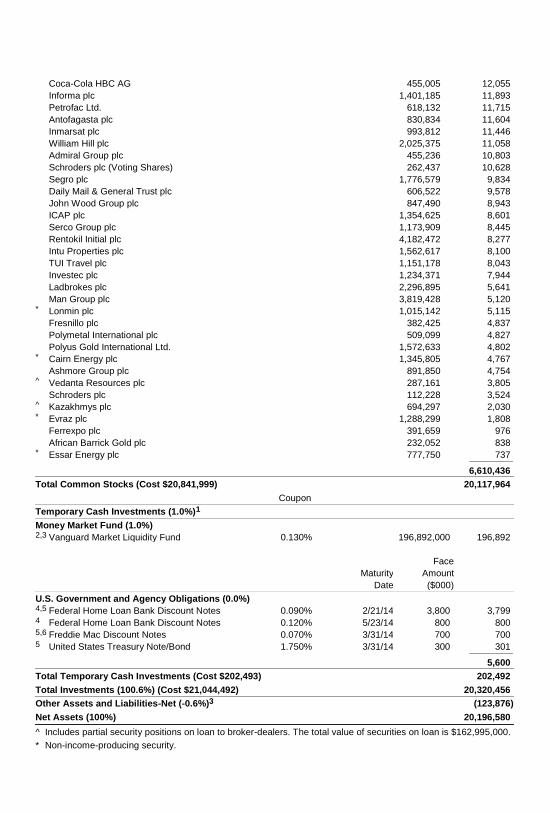
Coca-Cola HBC AG 455,005 12,055 Informa plc 1,401,185 11,893 Petrofac Ltd. 618,132 11,715 Antofagasta plc 830,834 11,604 Inmarsat plc 993,812 11,446 William Hill plc 2,025,375 11,058 Admiral Group plc 455,236 10,803 Schroders plc (Voting Shares) 262,437 10,628 Segro plc 1,776,579 9,834 Daily Mail & General Trust plc 606,522 9,578 John Wood Group plc 847,490 8,943 ICAP plc 1,354,625 8,601 Serco Group plc 1,173,909 8,445 Rentokil Initial plc 4,182,472 8,277 Intu Properties plc 1,562,617 8,100 TUI Travel plc 1,151,178 8,043 Investec plc 1,234,371 7,944 Ladbrokes plc 2,296,895 5,641 Man Group plc 3,819,428 5,120 * Lonmin plc 1,015,142 5,115 Fresnillo plc 382,425 4,837 Polymetal International plc 509,099 4,827 Polyus Gold International Ltd. 1,572,633 4,802 * Cairn Energy plc 1,345,805 4,767 Ashmore Group plc 891,850 4,754 ^ Vedanta Resources plc 287,161 3,805 Schroders plc 112,228 3,524 ^ Kazakhmys plc 694,297 2,030 * Evraz plc 1,288,299 1,808 Ferrexpo plc 391,659 976 African Barrick Gold plc 232,052 838 * Essar Energy plc 777,750 737 _____________
6,610,436
Total Common Stocks (Cost $20,841,999) 20,117,964
Coupon
Temporary Cash Investments (1.0%)1
Money Market Fund (1.0%) 2,3 Vanguard Market Liquidity Fund 0.130% 196,892,000 196,892
Maturity
Date
Face
Amount
($000)
U.S. Government and Agency Obligations (0.0%)
4,5 Federal Home Loan Bank Discount Notes 0.090% 2/21/14 3,800 3,799 4 Federal Home Loan Bank Discount Notes 0.120% 5/23/14 800 800 5,6 Freddie Mac Discount Notes 0.070% 3/31/14 700 700 5 United States Treasury Note/Bond 1.750% 3/31/14 300 301 _____________
5,600
Total Temporary Cash Investments (Cost $202,493) 202,492
Total Investments (100.6%) (Cost $21,044,492) 20,320,456
Other Assets and Liabilities-Net (-0.6%)3 (123,876)
Net Assets (100%) 20,196,580
^ Includes partial security positions on loan to broker-dealers. The total value of securities on loan is $162,995,000.
* Non-income-producing security.
1 The fund invests a portion of its cash reserves in equity markets through the use of index futures contracts. After giving effect to futures investments, the fund's effective common stock and temporary cash investment positions represent 99.8% and 0.8%, respectively, of net assets.
2 Affiliated money market fund available only to Vanguard funds and certain trusts and accounts managed by Vanguard. Rate shown is the 7-day yield.
3 Includes $173,541,000 of collateral received for securities on loan.
4 The issuer operates under a congressional charter; its securities are generally neither guaranteed by the U.S. Treasury nor backed by the full faith and credit of the U.S. government.
5 Securities with a value of $2,801,000 have been segregated as initial margin for open futures contracts.
6 The issuer was placed under federal conservatorship in September 2008; since that time, its daily operations have been managed by the Federal Housing Finance Agency and it receives capital from the U.S. Treasury, as needed to maintain a positive net worth, in exchange for senior preferred stock.
ADR—American Depositary Receipt.
A. Security Valuation: Securities are valued as of the close of trading on the New York Stock
Exchange (generally 4 p.m., Eastern time) on the valuation date. Equity securities are valued at the
latest quoted sales prices or official closing prices taken from the primary market in which each
security trades; such securities not traded on the valuation date are valued at the mean of the latest
quoted bid and asked prices. Securities for which market quotations are not readily available, or
whose values have been affected by events occurring before the fund's pricing time but after the
close of the securities’ primary markets, are valued at their fair values calculated according to
procedures adopted by the board of trustees. These procedures include obtaining quotations from an
independent pricing service, monitoring news to identify significant market- or security-specific events,
and evaluating changes in the values of foreign market proxies (for example, ADRs, futures contracts,
or exchange-traded funds), between the time the foreign markets close and the fund's pricing time.
When fair-value pricing is employed, the prices of securities used by a fund to calculate its net asset
value may differ from quoted or published prices for the same securities. Investments in Vanguard
Market Liquidity Fund are valued at that fund’s net asset value. Temporary cash investments acquired
over 60 days to maturity are valued using the latest bid prices or using valuations based on a matrix
system (which considers such factors as security prices, yields, maturities, and ratings), both as
furnished by independent pricing services. Other temporary cash investments are valued at amortized
cost, which approximates market value.
B. Foreign Currency: Securities and other assets and liabilities denominated in foreign currencies are
translated into U.S. dollars using exchange rates obtained from an independent third party as of the
fund's pricing time on the valuation date. Realized gains (losses) and unrealized appreciation
(depreciation) on investment securities include the effects of changes in exchange rates since the
securities were purchased, combined with the effects of changes in security prices. Fluctuations in the
value of other assets and liabilities resulting from changes in exchange rates are recorded as
unrealized foreign currency gains (losses) until the assets or liabilities are settled in cash, at which
time they are recorded as realized foreign currency gains (losses).
C. Various inputs may be used to determine the value of the fund's investments. These inputs are
summarized in three broad levels for financial statement purposes. The inputs or methodologies used
to value securities are not necessarily an indication of the risk associated with investing in those
securities.
Level 1—Quoted prices in active markets for identical securities.
Level 2—Other significant observable inputs (including quoted prices for similar securities, interest
rates, prepayment speeds, credit risk, etc.).
Level 3—Significant unobservable inputs (including the fund's own assumptions used to determine
the fair value of investments).
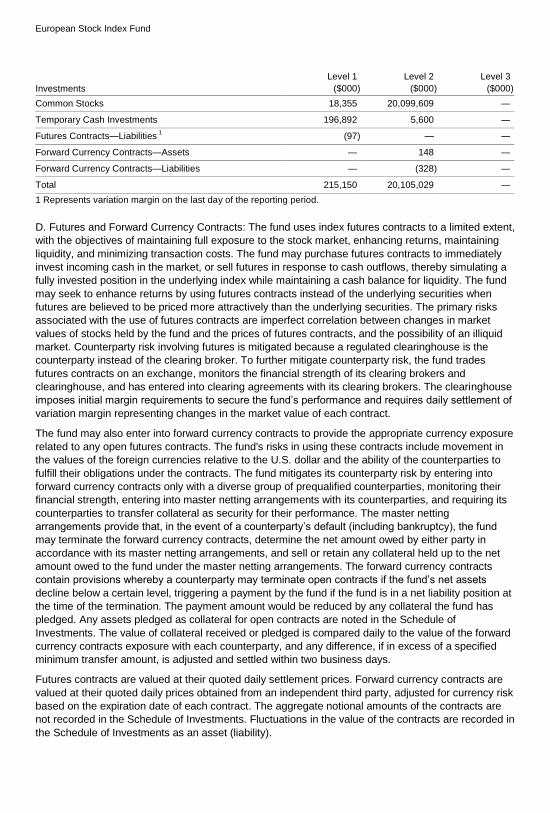
The following table summarizes the market value of the fund's investments as of January 31, 2014,
based on the inputs used to value them:
European Stock Index Fund
Investments
Level 1
($000 )
Level 2
($000 )
Level 3
($000 )
Common Stocks 18,355 20,099,609 —
Temporary Cash Investments 196,892 5,600 —
Futures Contracts—Liabilities 1 (97 ) — —
Forward Currency Contracts—Assets — 148 —
Forward Currency Contracts—Liabilities — (328 ) —
Total 215,150 20,105,029 —
1 Represents variation margin on the last day of the reporting period.
D. Futures and Forward Currency Contracts: The fund uses index futures contracts to a limited extent,
with the objectives of maintaining full exposure to the stock market, enhancing returns, maintaining
liquidity, and minimizing transaction costs. The fund may purchase futures contracts to immediately
invest incoming cash in the market, or sell futures in response to cash outflows, thereby simulating a
fully invested position in the underlying index while maintaining a cash balance for liquidity. The fund
may seek to enhance returns by using futures contracts instead of the underlying securities when
futures are believed to be priced more attractively than the underlying securities. The primary risks
associated with the use of futures contracts are imperfect correlation between changes in market
values of stocks held by the fund and the prices of futures contracts, and the possibility of an illiquid
market. Counterparty risk involving futures is mitigated because a regulated clearinghouse is the
counterparty instead of the clearing broker. To further mitigate counterparty risk, the fund trades
futures contracts on an exchange, monitors the financial strength of its clearing brokers and
clearinghouse, and has entered into clearing agreements with its clearing brokers. The clearinghouse
imposes initial margin requirements to secure the fund’s performance and requires daily settlement of
variation margin representing changes in the market value of each contract.
The fund may also enter into forward currency contracts to provide the appropriate currency exposure
related to any open futures contracts. The fund's risks in using these contracts include movement in
the values of the foreign currencies relative to the U.S. dollar and the ability of the counterparties to
fulfill their obligations under the contracts. The fund mitigates its counterparty risk by entering into
forward currency contracts only with a diverse group of prequalified counterparties, monitoring their
financial strength, entering into master netting arrangements with its counterparties, and requiring its
counterparties to transfer collateral as security for their performance. The master netting
arrangements provide that, in the event of a counterparty’s default (including bankruptcy), the fund
may terminate the forward currency contracts, determine the net amount owed by either party in
accordance with its master netting arrangements, and sell or retain any collateral held up to the net
amount owed to the fund under the master netting arrangements. The forward currency contracts
contain provisions whereby a counterparty may terminate open contracts if the fund’s net assets
decline below a certain level, triggering a payment by the fund if the fund is in a net liability position at
the time of the termination. The payment amount would be reduced by any collateral the fund has
pledged. Any assets pledged as collateral for open contracts are noted in the Schedule of
Investments. The value of collateral received or pledged is compared daily to the value of the forward
currency contracts exposure with each counterparty, and any difference, if in excess of a specified
minimum transfer amount, is adjusted and settled within two business days.
Futures contracts are valued at their quoted daily settlement prices. Forward currency contracts are
valued at their quoted daily prices obtained from an independent third party, adjusted for currency risk
based on the expiration date of each contract. The aggregate notional amounts of the contracts are
not recorded in the Schedule of Investments. Fluctuations in the value of the contracts are recorded in
the Schedule of Investments as an asset (liability).
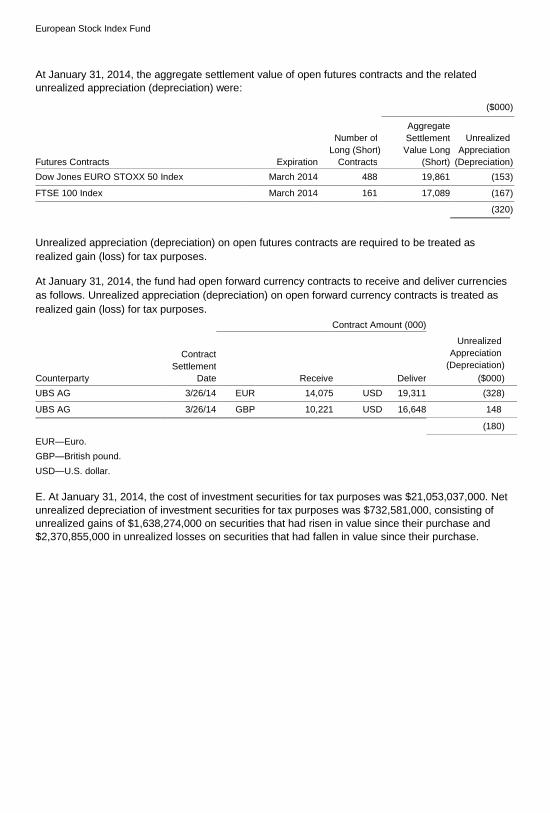
European Stock Index Fund
At January 31, 2014, the aggregate settlement value of open futures contracts and the related
unrealized appreciation (depreciation) were:
($000 )
Futures Contracts Expiration
Number of
Long (Short
Contracts
)
Aggregate
Settlement
Value Long
(Short)
Unrealized
Appreciation
(Depreciation )
Dow Jones EURO STOXX 50 Index March 2014 488 19,861 (153 )
FTSE 100 Index March 2014 161 17,089 (167 )
(320 )
Unrealized appreciation (depreciation) on open futures contracts are required to be treated as
realized gain (loss) for tax purposes.
At January 31, 2014, the fund had open forward currency contracts to receive and deliver currencies
as follows. Unrealized appreciation (depreciation) on open forward currency contracts is treated as
realized gain (loss) for tax purposes. Contract Amount (000)
Counterparty
Contract
Settlement
Date Receive Deliver
Unrealized
Appreciation
(Depreciation
($000
)
)
UBS AG 3/26/14 EUR 14,075 USD 19,311 (328 )
UBS AG 3/26/14 GBP 10,221 USD 16,648 148
(180 )
EUR—Euro.
GBP—British pound.
USD—U.S. dollar.
E. At January 31, 2014, the cost of investment securities for tax purposes was $21,053,037,000. Net
unrealized depreciation of investment securities for tax purposes was $732,581,000, consisting of
unrealized gains of $1,638,274,000 on securities that had risen in value since their purchase and
$2,370,855,000 in unrealized losses on securities that had fallen in value since their purchase.
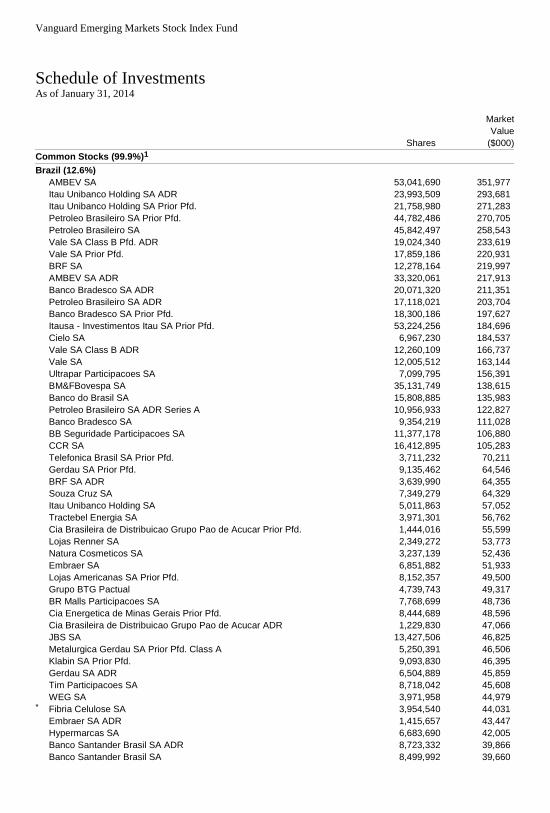
Vanguard Emerging Markets Stock Index Fund
Schedule of Investments As of January 31, 2014
Shares
Market
Value
($000)
Common Stocks (99.9%)1
Brazil (12.6%)
AMBEV SA 53,041,690 351,977 Itau Unibanco Holding SA ADR 23,993,509 293,681 Itau Unibanco Holding SA Prior Pfd. 21,758,980 271,283 Petroleo Brasileiro SA Prior Pfd. 44,782,486 270,705 Petroleo Brasileiro SA 45,842,497 258,543 Vale SA Class B Pfd. ADR 19,024,340 233,619 Vale SA Prior Pfd. 17,859,186 220,931 BRF SA 12,278,164 219,997 AMBEV SA ADR 33,320,061 217,913 Banco Bradesco SA ADR 20,071,320 211,351 Petroleo Brasileiro SA ADR 17,118,021 203,704 Banco Bradesco SA Prior Pfd. 18,300,186 197,627 Itausa - Investimentos Itau SA Prior Pfd. 53,224,256 184,696 Cielo SA 6,967,230 184,537 Vale SA Class B ADR 12,260,109 166,737 Vale SA 12,005,512 163,144 Ultrapar Participacoes SA 7,099,795 156,391 BM&FBovespa SA 35,131,749 138,615 Banco do Brasil SA 15,808,885 135,983 Petroleo Brasileiro SA ADR Series A 10,956,933 122,827 Banco Bradesco SA 9,354,219 111,028 BB Seguridade Participacoes SA 11,377,178 106,880 CCR SA 16,412,895 105,283 Telefonica Brasil SA Prior Pfd. 3,711,232 70,211 Gerdau SA Prior Pfd. 9,135,462 64,546 BRF SA ADR 3,639,990 64,355 Souza Cruz SA 7,349,279 64,329 Itau Unibanco Holding SA 5,011,863 57,052 Tractebel Energia SA 3,971,301 56,762 Cia Brasileira de Distribuicao Grupo Pao de Acucar Prior Pfd. 1,444,016 55,599 Lojas Renner SA 2,349,272 53,773 Natura Cosmeticos SA 3,237,139 52,436 Embraer SA 6,851,882 51,933 Lojas Americanas SA Prior Pfd. 8,152,357 49,500 Grupo BTG Pactual 4,739,743 49,317 BR Malls Participacoes SA 7,768,699 48,736 Cia Energetica de Minas Gerais Prior Pfd. 8,444,689 48,596 Cia Brasileira de Distribuicao Grupo Pao de Acucar ADR 1,229,830 47,066 JBS SA 13,427,506 46,825 Metalurgica Gerdau SA Prior Pfd. Class A 5,250,391 46,506 Klabin SA Prior Pfd. 9,093,830 46,395 Gerdau SA ADR 6,504,889 45,859 Tim Participacoes SA 8,718,042 45,608 WEG SA 3,971,958 44,979 * Fibria Celulose SA 3,954,540 44,031 Embraer SA ADR 1,415,657 43,447 Hypermarcas SA 6,683,690 42,005 Banco Santander Brasil SA ADR 8,723,332 39,866 Banco Santander Brasil SA 8,499,992 39,660
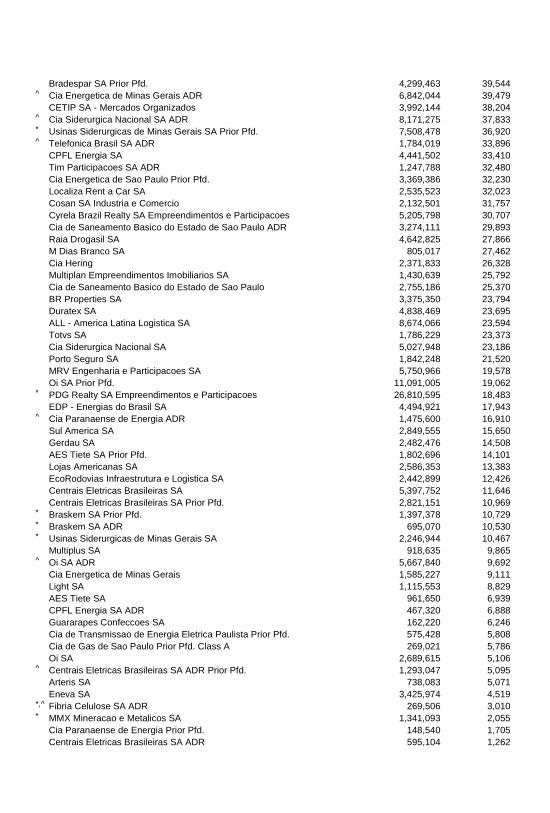
Bradespar SA Prior Pfd. 4,299,463 39,544 ^ Cia Energetica de Minas Gerais ADR 6,842,044 39,479 CETIP SA - Mercados Organizados 3,992,144 38,204 ^ Cia Siderurgica Nacional SA ADR 8,171,275 37,833 * Usinas Siderurgicas de Minas Gerais SA Prior Pfd. 7,508,478 36,920 ^ Telefonica Brasil SA ADR 1,784,019 33,896 CPFL Energia SA 4,441,502 33,410 Tim Participacoes SA ADR 1,247,788 32,480 Cia Energetica de Sao Paulo Prior Pfd. 3,369,386 32,230 Localiza Rent a Car SA 2,535,523 32,023 Cosan SA Industria e Comercio 2,132,501 31,757 Cyrela Brazil Realty SA Empreendimentos e Participacoes 5,205,798 30,707 Cia de Saneamento Basico do Estado de Sao Paulo ADR 3,274,111 29,893 Raia Drogasil SA 4,642,825 27,866 M Dias Branco SA 805,017 27,462 Cia Hering 2,371,833 26,328 Multiplan Empreendimentos Imobiliarios SA 1,430,639 25,792 Cia de Saneamento Basico do Estado de Sao Paulo 2,755,186 25,370 BR Properties SA 3,375,350 23,794 Duratex SA 4,838,469 23,695 ALL - America Latina Logistica SA 8,674,066 23,594 Totvs SA 1,786,229 23,373 Cia Siderurgica Nacional SA 5,027,948 23,186 Porto Seguro SA 1,842,248 21,520 MRV Engenharia e Participacoes SA 5,750,966 19,578 Oi SA Prior Pfd. 11,091,005 19,062 * PDG Realty SA Empreendimentos e Participacoes 26,810,595 18,483 EDP - Energias do Brasil SA 4,494,921 17,943 ^ Cia Paranaense de Energia ADR 1,475,600 16,910 Sul America SA 2,849,555 15,650 Gerdau SA 2,482,476 14,508 AES Tiete SA Prior Pfd. 1,802,696 14,101 Lojas Americanas SA 2,586,353 13,383 EcoRodovias Infraestrutura e Logistica SA 2,442,899 12,426 Centrais Eletricas Brasileiras SA 5,397,752 11,646 Centrais Eletricas Brasileiras SA Prior Pfd. 2,821,151 10,969 * Braskem SA Prior Pfd. 1,397,378 10,729 * Braskem SA ADR 695,070 10,530 * Usinas Siderurgicas de Minas Gerais SA 2,246,944 10,467 Multiplus SA 918,635 9,865 ^ Oi SA ADR 5,667,840 9,692 Cia Energetica de Minas Gerais 1,585,227 9,111 Light SA 1,115,553 8,829 AES Tiete SA 961,650 6,939 CPFL Energia SA ADR 467,320 6,888 Guararapes Confeccoes SA 162,220 6,246 Cia de Transmissao de Energia Eletrica Paulista Prior Pfd. 575,428 5,808 Cia de Gas de Sao Paulo Prior Pfd. Class A 269,021 5,786 Oi SA 2,689,615 5,106 ^ Centrais Eletricas Brasileiras SA ADR Prior Pfd. 1,293,047 5,095 Arteris SA 738,083 5,071 Eneva SA 3,425,974 4,519 *,^ Fibria Celulose SA ADR 269,506 3,010 * MMX Mineracao e Metalicos SA 1,341,093 2,055 Cia Paranaense de Energia Prior Pfd. 148,540 1,705 Centrais Eletricas Brasileiras SA ADR 595,104 1,262
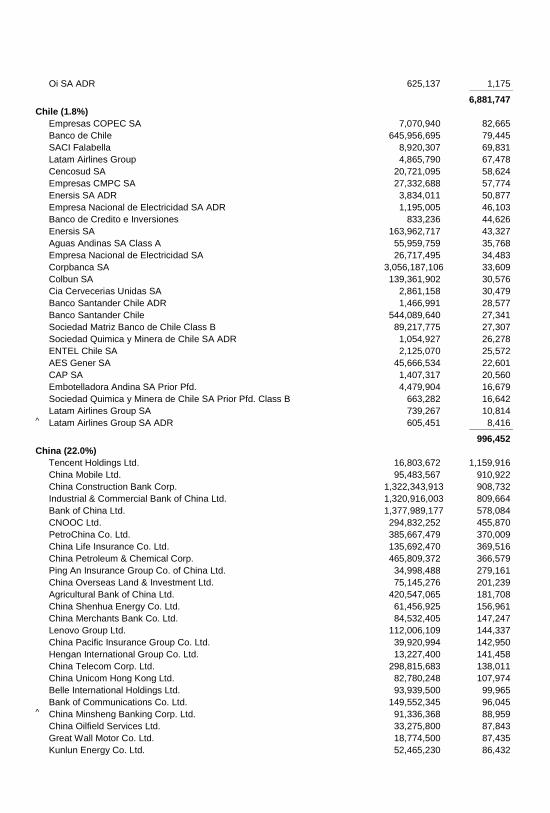
Oi SA ADR 625,137 1,175 _____________
6,881,747
Chile (1.8%)
Empresas COPEC SA 7,070,940 82,665 Banco de Chile 645,956,695 79,445 SACI Falabella 8,920,307 69,831 Latam Airlines Group 4,865,790 67,478 Cencosud SA 20,721,095 58,624 Empresas CMPC SA 27,332,688 57,774 Enersis SA ADR 3,834,011 50,877 Empresa Nacional de Electricidad SA ADR 1,195,005 46,103 Banco de Credito e Inversiones 833,236 44,626 Enersis SA 163,962,717 43,327 Aguas Andinas SA Class A 55,959,759 35,768 Empresa Nacional de Electricidad SA 26,717,495 34,483 Corpbanca SA 3,056,187,106 33,609 Colbun SA 139,361,902 30,576 Cia Cervecerias Unidas SA 2,861,158 30,479 Banco Santander Chile ADR 1,466,991 28,577 Banco Santander Chile 544,089,640 27,341 Sociedad Matriz Banco de Chile Class B 89,217,775 27,307 Sociedad Quimica y Minera de Chile SA ADR 1,054,927 26,278 ENTEL Chile SA 2,125,070 25,572 AES Gener SA 45,666,534 22,601 CAP SA 1,407,317 20,560 Embotelladora Andina SA Prior Pfd. 4,479,904 16,679 Sociedad Quimica y Minera de Chile SA Prior Pfd. Class B 663,282 16,642 Latam Airlines Group SA 739,267 10,814 ^ Latam Airlines Group SA ADR 605,451 8,416 _____________
996,452
China (22.0%)
Tencent Holdings Ltd. 16,803,672 1,159,916 China Mobile Ltd. 95,483,567 910,922 China Construction Bank Corp. 1,322,343,913 908,732 Industrial & Commercial Bank of China Ltd. 1,320,916,003 809,664 Bank of China Ltd. 1,377,989,177 578,084 CNOOC Ltd. 294,832,252 455,870 PetroChina Co. Ltd. 385,667,479 370,009 China Life Insurance Co. Ltd. 135,692,470 369,516 China Petroleum & Chemical Corp. 465,809,372 366,579 Ping An Insurance Group Co. of China Ltd. 34,998,488 279,161 China Overseas Land & Investment Ltd. 75,145,276 201,239 Agricultural Bank of China Ltd. 420,547,065 181,708 China Shenhua Energy Co. Ltd. 61,456,925 156,961 China Merchants Bank Co. Ltd. 84,532,405 147,247 Lenovo Group Ltd. 112,006,109 144,337 China Pacific Insurance Group Co. Ltd. 39,920,994 142,950 Hengan International Group Co. Ltd. 13,227,400 141,458 China Telecom Corp. Ltd. 298,815,683 138,011 China Unicom Hong Kong Ltd. 82,780,248 107,974 Belle International Holdings Ltd. 93,939,500 99,965 Bank of Communications Co. Ltd. 149,552,345 96,045 ^ China Minsheng Banking Corp. Ltd. 91,336,368 88,959 China Oilfield Services Ltd. 33,275,800 87,843 Great Wall Motor Co. Ltd. 18,774,500 87,435 Kunlun Energy Co. Ltd. 52,465,230 86,432
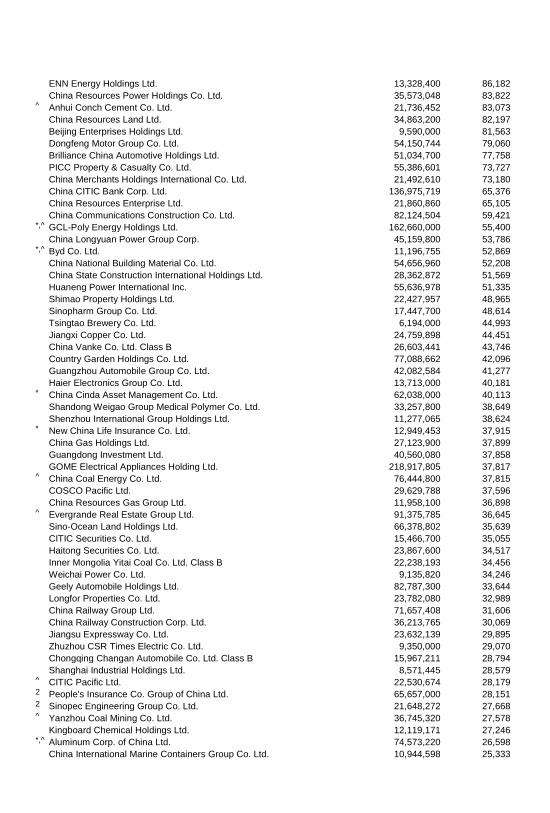
ENN Energy Holdings Ltd. 13,328,400 86,182 China Resources Power Holdings Co. Ltd. 35,573,048 83,822 ^ Anhui Conch Cement Co. Ltd. 21,736,452 83,073 China Resources Land Ltd. 34,863,200 82,197 Beijing Enterprises Holdings Ltd. 9,590,000 81,563 Dongfeng Motor Group Co. Ltd. 54,150,744 79,060 Brilliance China Automotive Holdings Ltd. 51,034,700 77,758 PICC Property & Casualty Co. Ltd. 55,386,601 73,727 China Merchants Holdings International Co. Ltd. 21,492,610 73,180 China CITIC Bank Corp. Ltd. 136,975,719 65,376 China Resources Enterprise Ltd. 21,860,860 65,105 China Communications Construction Co. Ltd. 82,124,504 59,421 *,^ GCL-Poly Energy Holdings Ltd. 162,660,000 55,400 China Longyuan Power Group Corp. 45,159,800 53,786 *,^ Byd Co. Ltd. 11,196,755 52,869 China National Building Material Co. Ltd. 54,656,960 52,208 China State Construction International Holdings Ltd. 28,362,872 51,569 Huaneng Power International Inc. 55,636,978 51,335 Shimao Property Holdings Ltd. 22,427,957 48,965 Sinopharm Group Co. Ltd. 17,447,700 48,614 Tsingtao Brewery Co. Ltd. 6,194,000 44,993 Jiangxi Copper Co. Ltd. 24,759,898 44,451 China Vanke Co. Ltd. Class B 26,603,441 43,746 Country Garden Holdings Co. Ltd. 77,088,662 42,096 Guangzhou Automobile Group Co. Ltd. 42,082,584 41,277 Haier Electronics Group Co. Ltd. 13,713,000 40,181 * China Cinda Asset Management Co. Ltd. 62,038,000 40,113 Shandong Weigao Group Medical Polymer Co. Ltd. 33,257,800 38,649 Shenzhou International Group Holdings Ltd. 11,277,065 38,624 * New China Life Insurance Co. Ltd. 12,949,453 37,915 China Gas Holdings Ltd. 27,123,900 37,899 Guangdong Investment Ltd. 40,560,080 37,858 GOME Electrical Appliances Holding Ltd. 218,917,805 37,817 ^ China Coal Energy Co. Ltd. 76,444,800 37,815 COSCO Pacific Ltd. 29,629,788 37,596 China Resources Gas Group Ltd. 11,958,100 36,898 ^ Evergrande Real Estate Group Ltd. 91,375,785 36,645 Sino-Ocean Land Holdings Ltd. 66,378,802 35,639 CITIC Securities Co. Ltd. 15,466,700 35,055 Haitong Securities Co. Ltd. 23,867,600 34,517 Inner Mongolia Yitai Coal Co. Ltd. Class B 22,238,193 34,456 Weichai Power Co. Ltd. 9,135,820 34,246 Geely Automobile Holdings Ltd. 82,787,300 33,644 Longfor Properties Co. Ltd. 23,782,080 32,989 China Railway Group Ltd. 71,657,408 31,606 China Railway Construction Corp. Ltd. 36,213,765 30,069 Jiangsu Expressway Co. Ltd. 23,632,139 29,895 Zhuzhou CSR Times Electric Co. Ltd. 9,350,000 29,070 Chongqing Changan Automobile Co. Ltd. Class B 15,967,211 28,794 Shanghai Industrial Holdings Ltd. 8,571,445 28,579 ^ CITIC Pacific Ltd. 22,530,674 28,179 2 People's Insurance Co. Group of China Ltd. 65,657,000 28,151 2 Sinopec Engineering Group Co. Ltd. 21,648,272 27,668 ^ Yanzhou Coal Mining Co. Ltd. 36,745,320 27,578 Kingboard Chemical Holdings Ltd. 12,119,171 27,246 *,^ Aluminum Corp. of China Ltd. 74,573,220 26,598 China International Marine Containers Group Co. Ltd. 10,944,598 25,333
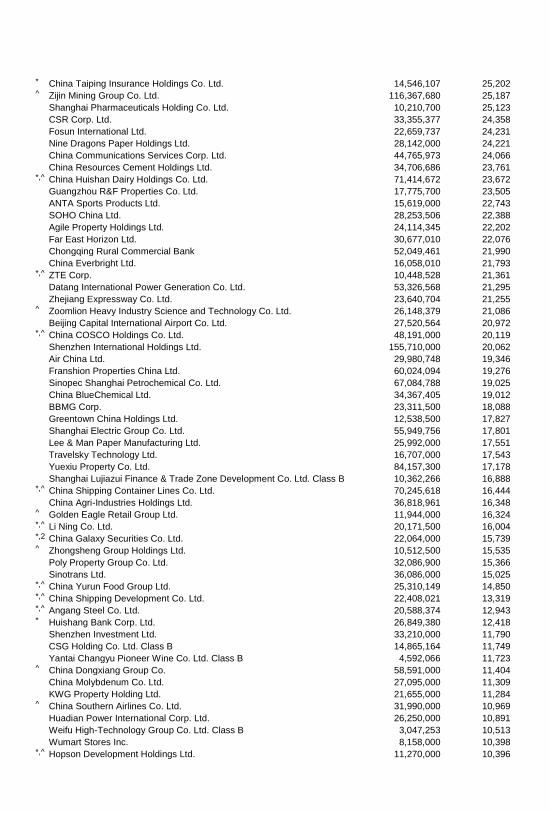
* China Taiping Insurance Holdings Co. Ltd. 14,546,107 25,202 ^ Zijin Mining Group Co. Ltd. 116,367,680 25,187 Shanghai Pharmaceuticals Holding Co. Ltd. 10,210,700 25,123 CSR Corp. Ltd. 33,355,377 24,358 Fosun International Ltd. 22,659,737 24,231 Nine Dragons Paper Holdings Ltd. 28,142,000 24,221 China Communications Services Corp. Ltd. 44,765,973 24,066 China Resources Cement Holdings Ltd. 34,706,686 23,761 *,^ China Huishan Dairy Holdings Co. Ltd. 71,414,672 23,672 Guangzhou R&F Properties Co. Ltd. 17,775,700 23,505 ANTA Sports Products Ltd. 15,619,000 22,743 SOHO China Ltd. 28,253,506 22,388 Agile Property Holdings Ltd. 24,114,345 22,202 Far East Horizon Ltd. 30,677,010 22,076 Chongqing Rural Commercial Bank 52,049,461 21,990 China Everbright Ltd. 16,058,010 21,793 *,^ ZTE Corp. 10,448,528 21,361 Datang International Power Generation Co. Ltd. 53,326,568 21,295 Zhejiang Expressway Co. Ltd. 23,640,704 21,255 ^ Zoomlion Heavy Industry Science and Technology Co. Ltd. 26,148,379 21,086 Beijing Capital International Airport Co. Ltd. 27,520,564 20,972 *,^ China COSCO Holdings Co. Ltd. 48,191,000 20,119 Shenzhen International Holdings Ltd. 155,710,000 20,062 Air China Ltd. 29,980,748 19,346 Franshion Properties China Ltd. 60,024,094 19,276 Sinopec Shanghai Petrochemical Co. Ltd. 67,084,788 19,025 China BlueChemical Ltd. 34,367,405 19,012 BBMG Corp. 23,311,500 18,088 Greentown China Holdings Ltd. 12,538,500 17,827 Shanghai Electric Group Co. Ltd. 55,949,756 17,801 Lee & Man Paper Manufacturing Ltd. 25,992,000 17,551 Travelsky Technology Ltd. 16,707,000 17,543 Yuexiu Property Co. Ltd. 84,157,300 17,178 Shanghai Lujiazui Finance & Trade Zone Development Co. Ltd. Class B 10,362,266 16,888 *,^ China Shipping Container Lines Co. Ltd. 70,245,618 16,444 China Agri-Industries Holdings Ltd. 36,818,961 16,348 ^ Golden Eagle Retail Group Ltd. 11,944,000 16,324 *,^ Li Ning Co. Ltd. 20,171,500 16,004 *,2 China Galaxy Securities Co. Ltd. 22,064,000 15,739 ^ Zhongsheng Group Holdings Ltd. 10,512,500 15,535 Poly Property Group Co. Ltd. 32,086,900 15,366 Sinotrans Ltd. 36,086,000 15,025 *,^ China Yurun Food Group Ltd. 25,310,149 14,850 *,^ China Shipping Development Co. Ltd. 22,408,021 13,319 *,^ Angang Steel Co. Ltd. 20,588,374 12,943 * Huishang Bank Corp. Ltd. 26,849,380 12,418 Shenzhen Investment Ltd. 33,210,000 11,790 CSG Holding Co. Ltd. Class B 14,865,164 11,749 Yantai Changyu Pioneer Wine Co. Ltd. Class B 4,592,066 11,723 ^ China Dongxiang Group Co. 58,591,000 11,404 China Molybdenum Co. Ltd. 27,095,000 11,309 KWG Property Holding Ltd. 21,655,000 11,284 ^ China Southern Airlines Co. Ltd. 31,990,000 10,969 Huadian Power International Corp. Ltd. 26,250,000 10,891 Weifu High-Technology Group Co. Ltd. Class B 3,047,253 10,513 Wumart Stores Inc. 8,158,000 10,398 *,^ Hopson Development Holdings Ltd. 11,270,000 10,396
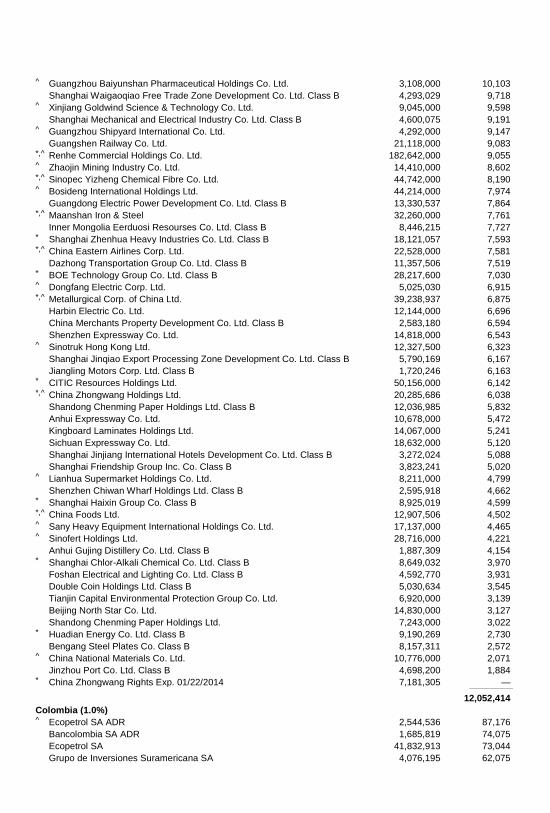
^ Guangzhou Baiyunshan Pharmaceutical Holdings Co. Ltd. 3,108,000 10,103 Shanghai Waigaoqiao Free Trade Zone Development Co. Ltd. Class B 4,293,029 9,718 ^ Xinjiang Goldwind Science & Technology Co. Ltd. 9,045,000 9,598 Shanghai Mechanical and Electrical Industry Co. Ltd. Class B 4,600,075 9,191 ^ Guangzhou Shipyard International Co. Ltd. 4,292,000 9,147 Guangshen Railway Co. Ltd. 21,118,000 9,083 *,^ Renhe Commercial Holdings Co. Ltd. 182,642,000 9,055 ^ Zhaojin Mining Industry Co. Ltd. 14,410,000 8,602 *,^ Sinopec Yizheng Chemical Fibre Co. Ltd. 44,742,000 8,190 ^ Bosideng International Holdings Ltd. 44,214,000 7,974 Guangdong Electric Power Development Co. Ltd. Class B 13,330,537 7,864 *,^ Maanshan Iron & Steel 32,260,000 7,761 Inner Mongolia Eerduosi Resourses Co. Ltd. Class B 8,446,215 7,727 * Shanghai Zhenhua Heavy Industries Co. Ltd. Class B 18,121,057 7,593 *,^ China Eastern Airlines Corp. Ltd. 22,528,000 7,581 Dazhong Transportation Group Co. Ltd. Class B 11,357,506 7,519 * BOE Technology Group Co. Ltd. Class B 28,217,600 7,030 ^ Dongfang Electric Corp. Ltd. 5,025,030 6,915 *,^ Metallurgical Corp. of China Ltd. 39,238,937 6,875 Harbin Electric Co. Ltd. 12,144,000 6,696 China Merchants Property Development Co. Ltd. Class B 2,583,180 6,594 Shenzhen Expressway Co. Ltd. 14,818,000 6,543 ^ Sinotruk Hong Kong Ltd. 12,327,500 6,323 Shanghai Jinqiao Export Processing Zone Development Co. Ltd. Class B 5,790,169 6,167 Jiangling Motors Corp. Ltd. Class B 1,720,246 6,163 * CITIC Resources Holdings Ltd. 50,156,000 6,142 *,^ China Zhongwang Holdings Ltd. 20,285,686 6,038 Shandong Chenming Paper Holdings Ltd. Class B 12,036,985 5,832 Anhui Expressway Co. Ltd. 10,678,000 5,472 Kingboard Laminates Holdings Ltd. 14,067,000 5,241 Sichuan Expressway Co. Ltd. 18,632,000 5,120 Shanghai Jinjiang International Hotels Development Co. Ltd. Class B 3,272,024 5,088 Shanghai Friendship Group Inc. Co. Class B 3,823,241 5,020 ^ Lianhua Supermarket Holdings Co. Ltd. 8,211,000 4,799 Shenzhen Chiwan Wharf Holdings Ltd. Class B 2,595,918 4,662 * Shanghai Haixin Group Co. Class B 8,925,019 4,599 *,^ China Foods Ltd. 12,907,506 4,502 ^ Sany Heavy Equipment International Holdings Co. Ltd. 17,137,000 4,465 ^ Sinofert Holdings Ltd. 28,716,000 4,221 Anhui Gujing Distillery Co. Ltd. Class B 1,887,309 4,154 * Shanghai Chlor-Alkali Chemical Co. Ltd. Class B 8,649,032 3,970 Foshan Electrical and Lighting Co. Ltd. Class B 4,592,770 3,931 Double Coin Holdings Ltd. Class B 5,030,634 3,545 Tianjin Capital Environmental Protection Group Co. Ltd. 6,920,000 3,139 Beijing North Star Co. Ltd. 14,830,000 3,127 Shandong Chenming Paper Holdings Ltd. 7,243,000 3,022 * Huadian Energy Co. Ltd. Class B 9,190,269 2,730 Bengang Steel Plates Co. Class B 8,157,311 2,572 ^ China National Materials Co. Ltd. 10,776,000 2,071 Jinzhou Port Co. Ltd. Class B 4,698,200 1,884 * China Zhongwang Rights Exp. 01/22/2014 7,181,305 — _____________
12,052,414
Colombia (1.0%)
^ Ecopetrol SA ADR 2,544,536 87,176 Bancolombia SA ADR 1,685,819 74,075 Ecopetrol SA 41,832,913 73,044 Grupo de Inversiones Suramericana SA 4,076,195 62,075
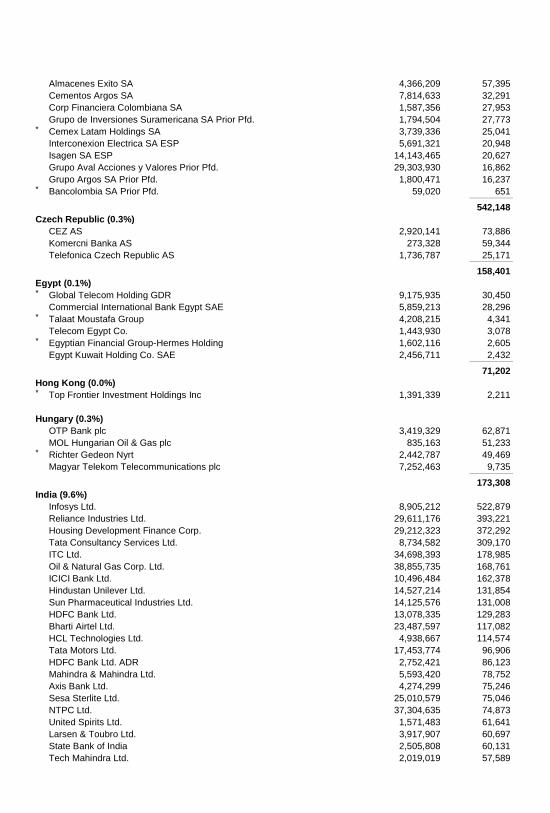
Almacenes Exito SA 4,366,209 57,395 Cementos Argos SA 7,814,633 32,291 Corp Financiera Colombiana SA 1,587,356 27,953 Grupo de Inversiones Suramericana SA Prior Pfd. 1,794,504 27,773 * Cemex Latam Holdings SA 3,739,336 25,041 Interconexion Electrica SA ESP 5,691,321 20,948 Isagen SA ESP 14,143,465 20,627 Grupo Aval Acciones y Valores Prior Pfd. 29,303,930 16,862 Grupo Argos SA Prior Pfd. 1,800,471 16,237 * Bancolombia SA Prior Pfd. 59,020 651 _____________
542,148
Czech Republic (0.3%)
CEZ AS 2,920,141 73,886 Komercni Banka AS 273,328 59,344 Telefonica Czech Republic AS 1,736,787 25,171 _____________
158,401
Egypt (0.1%)
* Global Telecom Holding GDR 9,175,935 30,450 Commercial International Bank Egypt SAE 5,859,213 28,296 * Talaat Moustafa Group 4,208,215 4,341 Telecom Egypt Co. 1,443,930 3,078 * Egyptian Financial Group-Hermes Holding 1,602,116 2,605 Egypt Kuwait Holding Co. SAE 2,456,711 2,432 _____________
71,202
Hong Kong (0.0%)
* Top Frontier Investment Holdings Inc 1,391,339 2,211
Hungary (0.3%)
OTP Bank plc 3,419,329 62,871 MOL Hungarian Oil & Gas plc 835,163 51,233 * Richter Gedeon Nyrt 2,442,787 49,469 Magyar Telekom Telecommunications plc 7,252,463 9,735 _____________
173,308
India (9.6%)
Infosys Ltd. 8,905,212 522,879 Reliance Industries Ltd. 29,611,176 393,221 Housing Development Finance Corp. 29,212,323 372,292 Tata Consultancy Services Ltd. 8,734,582 309,170 ITC Ltd. 34,698,393 178,985 Oil & Natural Gas Corp. Ltd. 38,855,735 168,761 ICICI Bank Ltd. 10,496,484 162,378 Hindustan Unilever Ltd. 14,527,214 131,854 Sun Pharmaceutical Industries Ltd. 14,125,576 131,008 HDFC Bank Ltd. 13,078,335 129,283 Bharti Airtel Ltd. 23,487,597 117,082 HCL Technologies Ltd. 4,938,667 114,574 Tata Motors Ltd. 17,453,774 96,906 HDFC Bank Ltd. ADR 2,752,421 86,123 Mahindra & Mahindra Ltd. 5,593,420 78,752 Axis Bank Ltd. 4,274,299 75,246 Sesa Sterlite Ltd. 25,010,579 75,046 NTPC Ltd. 37,304,635 74,873 United Spirits Ltd. 1,571,483 61,641 Larsen & Toubro Ltd. 3,917,907 60,697 State Bank of India 2,505,808 60,131 Tech Mahindra Ltd. 2,019,019 57,589
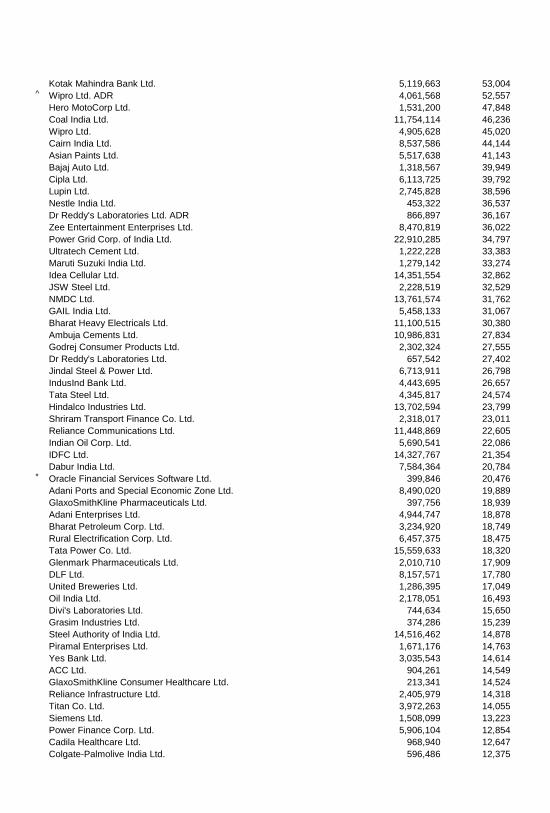
Kotak Mahindra Bank Ltd. 5,119,663 53,004 ^ Wipro Ltd. ADR 4,061,568 52,557 Hero MotoCorp Ltd. 1,531,200 47,848 Coal India Ltd. 11,754,114 46,236 Wipro Ltd. 4,905,628 45,020 Cairn India Ltd. 8,537,586 44,144 Asian Paints Ltd. 5,517,638 41,143 Bajaj Auto Ltd. 1,318,567 39,949 Cipla Ltd. 6,113,725 39,792 Lupin Ltd. 2,745,828 38,596 Nestle India Ltd. 453,322 36,537 Dr Reddy's Laboratories Ltd. ADR 866,897 36,167 Zee Entertainment Enterprises Ltd. 8,470,819 36,022 Power Grid Corp. of India Ltd. 22,910,285 34,797 Ultratech Cement Ltd. 1,222,228 33,383 Maruti Suzuki India Ltd. 1,279,142 33,274 Idea Cellular Ltd. 14,351,554 32,862 JSW Steel Ltd. 2,228,519 32,529 NMDC Ltd. 13,761,574 31,762 GAIL India Ltd. 5,458,133 31,067 Bharat Heavy Electricals Ltd. 11,100,515 30,380 Ambuja Cements Ltd. 10,986,831 27,834 Godrej Consumer Products Ltd. 2,302,324 27,555 Dr Reddy's Laboratories Ltd. 657,542 27,402 Jindal Steel & Power Ltd. 6,713,911 26,798 IndusInd Bank Ltd. 4,443,695 26,657 Tata Steel Ltd. 4,345,817 24,574 Hindalco Industries Ltd. 13,702,594 23,799 Shriram Transport Finance Co. Ltd. 2,318,017 23,011 Reliance Communications Ltd. 11,448,869 22,605 Indian Oil Corp. Ltd. 5,690,541 22,086 IDFC Ltd. 14,327,767 21,354 Dabur India Ltd. 7,584,364 20,784 * Oracle Financial Services Software Ltd. 399,846 20,476 Adani Ports and Special Economic Zone Ltd. 8,490,020 19,889 GlaxoSmithKline Pharmaceuticals Ltd. 397,756 18,939 Adani Enterprises Ltd. 4,944,747 18,878 Bharat Petroleum Corp. Ltd. 3,234,920 18,749 Rural Electrification Corp. Ltd. 6,457,375 18,475 Tata Power Co. Ltd. 15,559,633 18,320 Glenmark Pharmaceuticals Ltd. 2,010,710 17,909 DLF Ltd. 8,157,571 17,780 United Breweries Ltd. 1,286,395 17,049 Oil India Ltd. 2,178,051 16,493 Divi's Laboratories Ltd. 744,634 15,650 Grasim Industries Ltd. 374,286 15,239 Steel Authority of India Ltd. 14,516,462 14,878 Piramal Enterprises Ltd. 1,671,176 14,763 Yes Bank Ltd. 3,035,543 14,614 ACC Ltd. 904,261 14,549 GlaxoSmithKline Consumer Healthcare Ltd. 213,341 14,524 Reliance Infrastructure Ltd. 2,405,979 14,318 Titan Co. Ltd. 3,972,263 14,055 Siemens Ltd. 1,508,099 13,223 Power Finance Corp. Ltd. 5,906,104 12,854 Cadila Healthcare Ltd. 968,940 12,647 Colgate-Palmolive India Ltd. 596,486 12,375
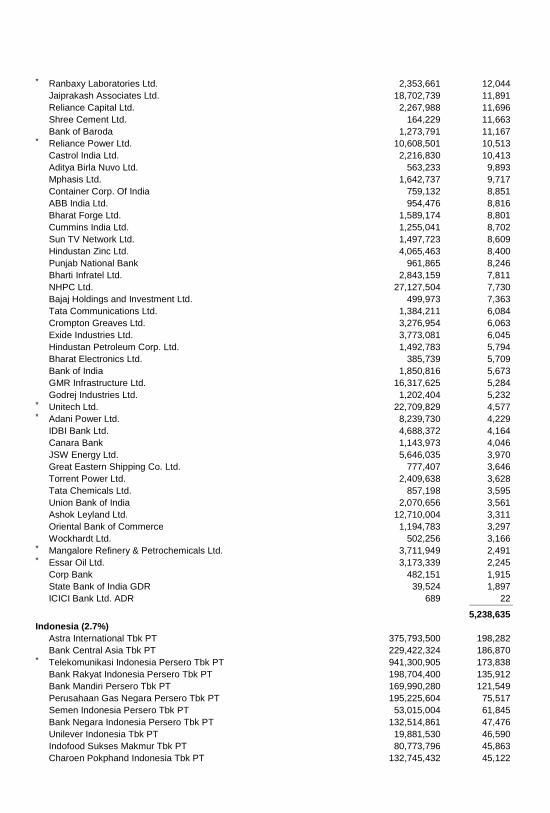
* Ranbaxy Laboratories Ltd. 2,353,661 12,044 Jaiprakash Associates Ltd. 18,702,739 11,891 Reliance Capital Ltd. 2,267,988 11,696 Shree Cement Ltd. 164,229 11,663 Bank of Baroda 1,273,791 11,167 * Reliance Power Ltd. 10,608,501 10,513 Castrol India Ltd. 2,216,830 10,413 Aditya Birla Nuvo Ltd. 563,233 9,893 Mphasis Ltd. 1,642,737 9,717 Container Corp. Of India 759,132 8,851 ABB India Ltd. 954,476 8,816 Bharat Forge Ltd. 1,589,174 8,801 Cummins India Ltd. 1,255,041 8,702 Sun TV Network Ltd. 1,497,723 8,609 Hindustan Zinc Ltd. 4,065,463 8,400 Punjab National Bank 961,865 8,246 Bharti Infratel Ltd. 2,843,159 7,811 NHPC Ltd. 27,127,504 7,730 Bajaj Holdings and Investment Ltd. 499,973 7,363 Tata Communications Ltd. 1,384,211 6,084 Crompton Greaves Ltd. 3,276,954 6,063 Exide Industries Ltd. 3,773,081 6,045 Hindustan Petroleum Corp. Ltd. 1,492,783 5,794 Bharat Electronics Ltd. 385,739 5,709 Bank of India 1,850,816 5,673 GMR Infrastructure Ltd. 16,317,625 5,284 Godrej Industries Ltd. 1,202,404 5,232 * Unitech Ltd. 22,709,829 4,577 * Adani Power Ltd. 8,239,730 4,229 IDBI Bank Ltd. 4,688,372 4,164 Canara Bank 1,143,973 4,046 JSW Energy Ltd. 5,646,035 3,970 Great Eastern Shipping Co. Ltd. 777,407 3,646 Torrent Power Ltd. 2,409,638 3,628 Tata Chemicals Ltd. 857,198 3,595 Union Bank of India 2,070,656 3,561 Ashok Leyland Ltd. 12,710,004 3,311 Oriental Bank of Commerce 1,194,783 3,297 Wockhardt Ltd. 502,256 3,166 * Mangalore Refinery & Petrochemicals Ltd. 3,711,949 2,491 * Essar Oil Ltd. 3,173,339 2,245 Corp Bank 482,151 1,915 State Bank of India GDR 39,524 1,897 ICICI Bank Ltd. ADR 689 22 _____________
5,238,635
Indonesia (2.7%)
Astra International Tbk PT 375,793,500 198,282 Bank Central Asia Tbk PT 229,422,324 186,870 * Telekomunikasi Indonesia Persero Tbk PT 941,300,905 173,838 Bank Rakyat Indonesia Persero Tbk PT 198,704,400 135,912 Bank Mandiri Persero Tbk PT 169,990,280 121,549 Perusahaan Gas Negara Persero Tbk PT 195,225,604 75,517 Semen Indonesia Persero Tbk PT 53,015,004 61,845 Bank Negara Indonesia Persero Tbk PT 132,514,861 47,476 Unilever Indonesia Tbk PT 19,881,530 46,590 Indofood Sukses Makmur Tbk PT 80,773,796 45,863 Charoen Pokphand Indonesia Tbk PT 132,745,432 45,122
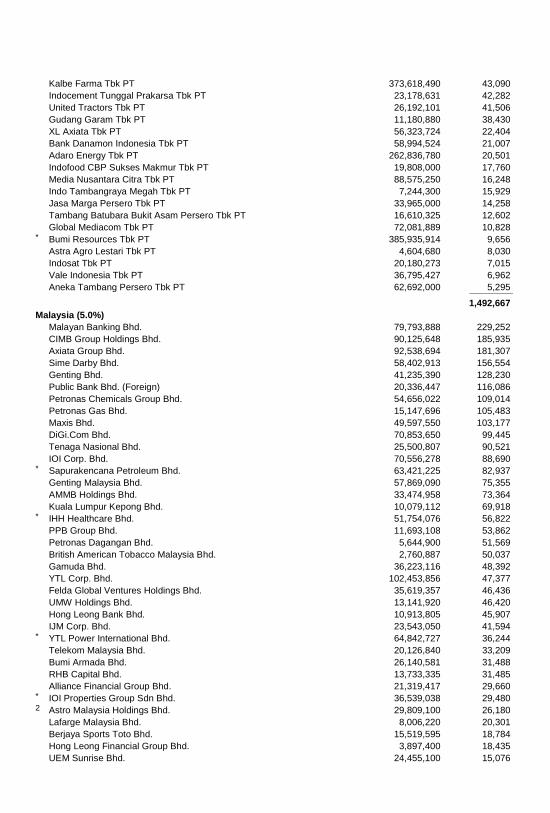
Kalbe Farma Tbk PT 373,618,490 43,090 Indocement Tunggal Prakarsa Tbk PT 23,178,631 42,282 United Tractors Tbk PT 26,192,101 41,506 Gudang Garam Tbk PT 11,180,880 38,430 XL Axiata Tbk PT 56,323,724 22,404 Bank Danamon Indonesia Tbk PT 58,994,524 21,007 Adaro Energy Tbk PT 262,836,780 20,501 Indofood CBP Sukses Makmur Tbk PT 19,808,000 17,760 Media Nusantara Citra Tbk PT 88,575,250 16,248 Indo Tambangraya Megah Tbk PT 7,244,300 15,929 Jasa Marga Persero Tbk PT 33,965,000 14,258 Tambang Batubara Bukit Asam Persero Tbk PT 16,610,325 12,602 Global Mediacom Tbk PT 72,081,889 10,828 * Bumi Resources Tbk PT 385,935,914 9,656 Astra Agro Lestari Tbk PT 4,604,680 8,030 Indosat Tbk PT 20,180,273 7,015 Vale Indonesia Tbk PT 36,795,427 6,962 Aneka Tambang Persero Tbk PT 62,692,000 5,295 _____________
1,492,667
Malaysia (5.0%)
Malayan Banking Bhd. 79,793,888 229,252 CIMB Group Holdings Bhd. 90,125,648 185,935 Axiata Group Bhd. 92,538,694 181,307 Sime Darby Bhd. 58,402,913 156,554 Genting Bhd. 41,235,390 128,230 Public Bank Bhd. (Foreign) 20,336,447 116,086 Petronas Chemicals Group Bhd. 54,656,022 109,014 Petronas Gas Bhd. 15,147,696 105,483 Maxis Bhd. 49,597,550 103,177 DiGi.Com Bhd. 70,853,650 99,445 Tenaga Nasional Bhd. 25,500,807 90,521 IOI Corp. Bhd. 70,556,278 88,690 * Sapurakencana Petroleum Bhd. 63,421,225 82,937 Genting Malaysia Bhd. 57,869,090 75,355 AMMB Holdings Bhd. 33,474,958 73,364 Kuala Lumpur Kepong Bhd. 10,079,112 69,918 * IHH Healthcare Bhd. 51,754,076 56,822 PPB Group Bhd. 11,693,108 53,862 Petronas Dagangan Bhd. 5,644,900 51,569 British American Tobacco Malaysia Bhd. 2,760,887 50,037 Gamuda Bhd. 36,223,116 48,392 YTL Corp. Bhd. 102,453,856 47,377 Felda Global Ventures Holdings Bhd. 35,619,357 46,436 UMW Holdings Bhd. 13,141,920 46,420 Hong Leong Bank Bhd. 10,913,805 45,907 IJM Corp. Bhd. 23,543,050 41,594 * YTL Power International Bhd. 64,842,727 36,244 Telekom Malaysia Bhd. 20,126,840 33,209 Bumi Armada Bhd. 26,140,581 31,488 RHB Capital Bhd. 13,733,335 31,485 Alliance Financial Group Bhd. 21,319,417 29,660 * IOI Properties Group Sdn Bhd. 36,539,038 29,480 2 Astro Malaysia Holdings Bhd. 29,809,100 26,180 Lafarge Malaysia Bhd. 8,006,220 20,301 Berjaya Sports Toto Bhd. 15,519,595 18,784 Hong Leong Financial Group Bhd. 3,897,400 18,435 UEM Sunrise Bhd. 24,455,100 15,076
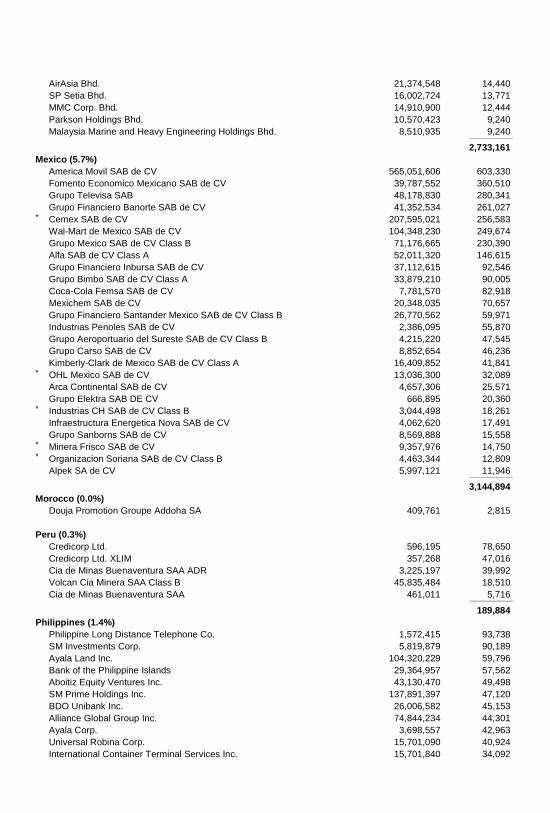
AirAsia Bhd. 21,374,548 14,440 SP Setia Bhd. 16,002,724 13,771 MMC Corp. Bhd. 14,910,900 12,444 Parkson Holdings Bhd. 10,570,423 9,240 Malaysia Marine and Heavy Engineering Holdings Bhd. 8,510,935 9,240 _____________
2,733,161
Mexico (5.7%)
America Movil SAB de CV 565,051,606 603,330 Fomento Economico Mexicano SAB de CV 39,787,552 360,510 Grupo Televisa SAB 48,178,830 280,341 Grupo Financiero Banorte SAB de CV 41,352,534 261,027 * Cemex SAB de CV 207,595,021 256,583 Wal-Mart de Mexico SAB de CV 104,348,230 249,674 Grupo Mexico SAB de CV Class B 71,176,665 230,390 Alfa SAB de CV Class A 52,011,320 146,615 Grupo Financiero Inbursa SAB de CV 37,112,615 92,546 Grupo Bimbo SAB de CV Class A 33,879,210 90,005 Coca-Cola Femsa SAB de CV 7,781,570 82,918 Mexichem SAB de CV 20,348,035 70,657 Grupo Financiero Santander Mexico SAB de CV Class B 26,770,562 59,971 Industrias Penoles SAB de CV 2,386,095 55,870 Grupo Aeroportuario del Sureste SAB de CV Class B 4,215,220 47,545 Grupo Carso SAB de CV 8,852,654 46,236 Kimberly-Clark de Mexico SAB de CV Class A 16,409,852 41,841 * OHL Mexico SAB de CV 13,036,300 32,089 Arca Continental SAB de CV 4,657,306 25,571 Grupo Elektra SAB DE CV 666,895 20,360 * Industrias CH SAB de CV Class B 3,044,498 18,261 Infraestructura Energetica Nova SAB de CV 4,062,620 17,491 Grupo Sanborns SAB de CV 8,569,888 15,558 * Minera Frisco SAB de CV 9,357,976 14,750 * Organizacion Soriana SAB de CV Class B 4,463,344 12,809 Alpek SA de CV 5,997,121 11,946 _____________
3,144,894
Morocco (0.0%)
Douja Promotion Groupe Addoha SA 409,761 2,815
Peru (0.3%)
Credicorp Ltd. 596,195 78,650 Credicorp Ltd. XLIM 357,268 47,016 Cia de Minas Buenaventura SAA ADR 3,225,197 39,992 Volcan Cia Minera SAA Class B 45,835,484 18,510 Cia de Minas Buenaventura SAA 461,011 5,716 _____________
189,884
Philippines (1.4%)
Philippine Long Distance Telephone Co. 1,572,415 93,738 SM Investments Corp. 5,819,879 90,189 Ayala Land Inc. 104,320,229 59,796 Bank of the Philippine Islands 29,364,957 57,562 Aboitiz Equity Ventures Inc. 43,130,470 49,498 SM Prime Holdings Inc. 137,891,397 47,120 BDO Unibank Inc. 26,006,582 45,153 Alliance Global Group Inc. 74,844,234 44,301 Ayala Corp. 3,698,557 42,963 Universal Robina Corp. 15,701,090 40,924 International Container Terminal Services Inc. 15,701,840 34,092
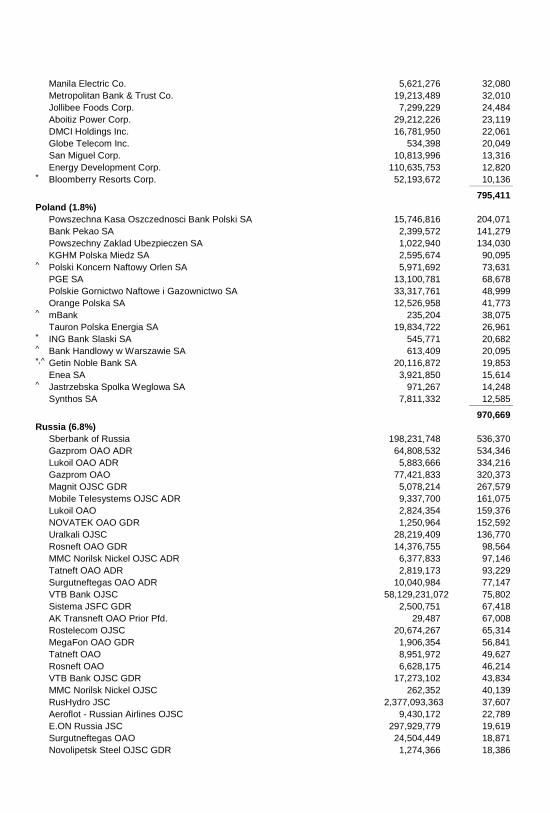
Manila Electric Co. 5,621,276 32,080 Metropolitan Bank & Trust Co. 19,213,489 32,010 Jollibee Foods Corp. 7,299,229 24,484 Aboitiz Power Corp. 29,212,226 23,119 DMCI Holdings Inc. 16,781,950 22,061 Globe Telecom Inc. 534,398 20,049 San Miguel Corp. 10,813,996 13,316 Energy Development Corp. 110,635,753 12,820 * Bloomberry Resorts Corp. 52,193,672 10,136 _____________
795,411
Poland (1.8%)
Powszechna Kasa Oszczednosci Bank Polski SA 15,746,816 204,071 Bank Pekao SA 2,399,572 141,279 Powszechny Zaklad Ubezpieczen SA 1,022,940 134,030 KGHM Polska Miedz SA 2,595,674 90,095 ^ Polski Koncern Naftowy Orlen SA 5,971,692 73,631 PGE SA 13,100,781 68,678 Polskie Gornictwo Naftowe i Gazownictwo SA 33,317,761 48,999 Orange Polska SA 12,526,958 41,773 ^ mBank 235,204 38,075 Tauron Polska Energia SA 19,834,722 26,961 * ING Bank Slaski SA 545,771 20,682 ^ Bank Handlowy w Warszawie SA 613,409 20,095 *,^ Getin Noble Bank SA 20,116,872 19,853 Enea SA 3,921,850 15,614 ^ Jastrzebska Spolka Weglowa SA 971,267 14,248 Synthos SA 7,811,332 12,585 _____________
970,669
Russia (6.8%)
Sberbank of Russia 198,231,748 536,370 Gazprom OAO ADR 64,808,532 534,346 Lukoil OAO ADR 5,883,666 334,216 Gazprom OAO 77,421,833 320,373 Magnit OJSC GDR 5,078,214 267,579 Mobile Telesystems OJSC ADR 9,337,700 161,075 Lukoil OAO 2,824,354 159,376 NOVATEK OAO GDR 1,250,964 152,592 Uralkali OJSC 28,219,409 136,770 Rosneft OAO GDR 14,376,755 98,564 MMC Norilsk Nickel OJSC ADR 6,377,833 97,146 Tatneft OAO ADR 2,819,173 93,229 Surgutneftegas OAO ADR 10,040,984 77,147 VTB Bank OJSC 58,129,231,072 75,802 Sistema JSFC GDR 2,500,751 67,418 AK Transneft OAO Prior Pfd. 29,487 67,008 Rostelecom OJSC 20,674,267 65,314 MegaFon OAO GDR 1,906,354 56,841 Tatneft OAO 8,951,972 49,627 Rosneft OAO 6,628,175 46,214 VTB Bank OJSC GDR 17,273,102 43,834 MMC Norilsk Nickel OJSC 262,352 40,139 RusHydro JSC 2,377,093,363 37,607 Aeroflot - Russian Airlines OJSC 9,430,172 22,789 E.ON Russia JSC 297,929,779 19,619 Surgutneftegas OAO 24,504,449 18,871 Novolipetsk Steel OJSC GDR 1,274,366 18,386
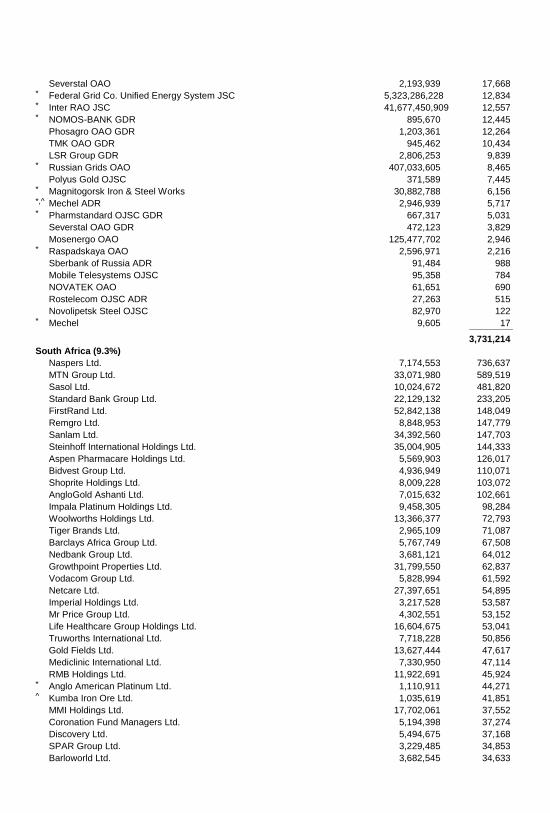
Severstal OAO 2,193,939 17,668 * Federal Grid Co. Unified Energy System JSC 5,323,286,228 12,834 * Inter RAO JSC 41,677,450,909 12,557 * NOMOS-BANK GDR 895,670 12,445 Phosagro OAO GDR 1,203,361 12,264 TMK OAO GDR 945,462 10,434 LSR Group GDR 2,806,253 9,839 * Russian Grids OAO 407,033,605 8,465 Polyus Gold OJSC 371,589 7,445 * Magnitogorsk Iron & Steel Works 30,882,788 6,156 *,^ Mechel ADR 2,946,939 5,717 * Pharmstandard OJSC GDR 667,317 5,031 Severstal OAO GDR 472,123 3,829 Mosenergo OAO 125,477,702 2,946 * Raspadskaya OAO 2,596,971 2,216 Sberbank of Russia ADR 91,484 988 Mobile Telesystems OJSC 95,358 784 NOVATEK OAO 61,651 690 Rostelecom OJSC ADR 27,263 515 Novolipetsk Steel OJSC 82,970 122 * Mechel 9,605 17 _____________
3,731,214
South Africa (9.3%)
Naspers Ltd. 7,174,553 736,637 MTN Group Ltd. 33,071,980 589,519 Sasol Ltd. 10,024,672 481,820 Standard Bank Group Ltd. 22,129,132 233,205 FirstRand Ltd. 52,842,138 148,049 Remgro Ltd. 8,848,953 147,779 Sanlam Ltd. 34,392,560 147,703 Steinhoff International Holdings Ltd. 35,004,905 144,333 Aspen Pharmacare Holdings Ltd. 5,569,903 126,017 Bidvest Group Ltd. 4,936,949 110,071 Shoprite Holdings Ltd. 8,009,228 103,072 AngloGold Ashanti Ltd. 7,015,632 102,661 Impala Platinum Holdings Ltd. 9,458,305 98,284 Woolworths Holdings Ltd. 13,366,377 72,793 Tiger Brands Ltd. 2,965,109 71,087 Barclays Africa Group Ltd. 5,767,749 67,508 Nedbank Group Ltd. 3,681,121 64,012 Growthpoint Properties Ltd. 31,799,550 62,837 Vodacom Group Ltd. 5,828,994 61,592 Netcare Ltd. 27,397,651 54,895 Imperial Holdings Ltd. 3,217,528 53,587 Mr Price Group Ltd. 4,302,551 53,152 Life Healthcare Group Holdings Ltd. 16,604,675 53,041 Truworths International Ltd. 7,718,228 50,856 Gold Fields Ltd. 13,627,444 47,617 Mediclinic International Ltd. 7,330,950 47,114 RMB Holdings Ltd. 11,922,691 45,924 * Anglo American Platinum Ltd. 1,110,911 44,271 ^ Kumba Iron Ore Ltd. 1,035,619 41,851 MMI Holdings Ltd. 17,702,061 37,552 Coronation Fund Managers Ltd. 5,194,398 37,274 Discovery Ltd. 5,494,675 37,168 SPAR Group Ltd. 3,229,485 34,853 Barloworld Ltd. 3,682,545 34,633
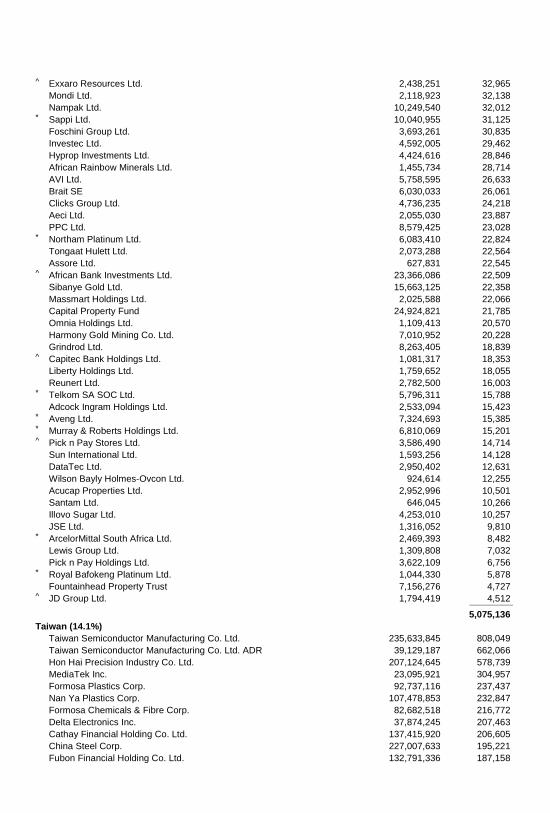
^ Exxaro Resources Ltd. 2,438,251 32,965 Mondi Ltd. 2,118,923 32,138 Nampak Ltd. 10,249,540 32,012 * Sappi Ltd. 10,040,955 31,125 Foschini Group Ltd. 3,693,261 30,835 Investec Ltd. 4,592,005 29,462 Hyprop Investments Ltd. 4,424,616 28,846 African Rainbow Minerals Ltd. 1,455,734 28,714 AVI Ltd. 5,758,595 26,633 Brait SE 6,030,033 26,061 Clicks Group Ltd. 4,736,235 24,218 Aeci Ltd. 2,055,030 23,887 PPC Ltd. 8,579,425 23,028 * Northam Platinum Ltd. 6,083,410 22,824 Tongaat Hulett Ltd. 2,073,288 22,564 Assore Ltd. 627,831 22,545 ^ African Bank Investments Ltd. 23,366,086 22,509 Sibanye Gold Ltd. 15,663,125 22,358 Massmart Holdings Ltd. 2,025,588 22,066 Capital Property Fund 24,924,821 21,785 Omnia Holdings Ltd. 1,109,413 20,570 Harmony Gold Mining Co. Ltd. 7,010,952 20,228 Grindrod Ltd. 8,263,405 18,839 ^ Capitec Bank Holdings Ltd. 1,081,317 18,353 Liberty Holdings Ltd. 1,759,652 18,055 Reunert Ltd. 2,782,500 16,003 * Telkom SA SOC Ltd. 5,796,311 15,788 Adcock Ingram Holdings Ltd. 2,533,094 15,423 * Aveng Ltd. 7,324,693 15,385 * Murray & Roberts Holdings Ltd. 6,810,069 15,201 ^ Pick n Pay Stores Ltd. 3,586,490 14,714 Sun International Ltd. 1,593,256 14,128 DataTec Ltd. 2,950,402 12,631 Wilson Bayly Holmes-Ovcon Ltd. 924,614 12,255 Acucap Properties Ltd. 2,952,996 10,501 Santam Ltd. 646,045 10,266 Illovo Sugar Ltd. 4,253,010 10,257 JSE Ltd. 1,316,052 9,810 * ArcelorMittal South Africa Ltd. 2,469,393 8,482 Lewis Group Ltd. 1,309,808 7,032 Pick n Pay Holdings Ltd. 3,622,109 6,756 * Royal Bafokeng Platinum Ltd. 1,044,330 5,878 Fountainhead Property Trust 7,156,276 4,727 ^ JD Group Ltd. 1,794,419 4,512 _____________
5,075,136
Taiwan (14.1%)
Taiwan Semiconductor Manufacturing Co. Ltd. 235,633,845 808,049 Taiwan Semiconductor Manufacturing Co. Ltd. ADR 39,129,187 662,066 Hon Hai Precision Industry Co. Ltd. 207,124,645 578,739 MediaTek Inc. 23,095,921 304,957 Formosa Plastics Corp. 92,737,116 237,437 Nan Ya Plastics Corp. 107,478,853 232,847 Formosa Chemicals & Fibre Corp. 82,682,518 216,772 Delta Electronics Inc. 37,874,245 207,463 Cathay Financial Holding Co. Ltd. 137,415,920 206,605 China Steel Corp. 227,007,633 195,221 Fubon Financial Holding Co. Ltd. 132,791,336 187,158
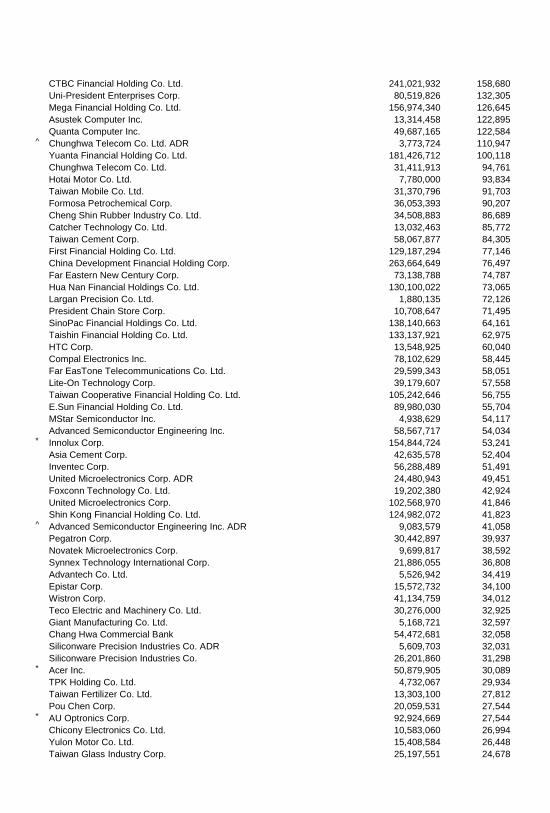
CTBC Financial Holding Co. Ltd. 241,021,932 158,680 Uni-President Enterprises Corp. 80,519,826 132,305 Mega Financial Holding Co. Ltd. 156,974,340 126,645 Asustek Computer Inc. 13,314,458 122,895 Quanta Computer Inc. 49,687,165 122,584 ^ Chunghwa Telecom Co. Ltd. ADR 3,773,724 110,947 Yuanta Financial Holding Co. Ltd. 181,426,712 100,118 Chunghwa Telecom Co. Ltd. 31,411,913 94,761 Hotai Motor Co. Ltd. 7,780,000 93,834 Taiwan Mobile Co. Ltd. 31,370,796 91,703 Formosa Petrochemical Corp. 36,053,393 90,207 Cheng Shin Rubber Industry Co. Ltd. 34,508,883 86,689 Catcher Technology Co. Ltd. 13,032,463 85,772 Taiwan Cement Corp. 58,067,877 84,305 First Financial Holding Co. Ltd. 129,187,294 77,146 China Development Financial Holding Corp. 263,664,649 76,497 Far Eastern New Century Corp. 73,138,788 74,787 Hua Nan Financial Holdings Co. Ltd. 130,100,022 73,065 Largan Precision Co. Ltd. 1,880,135 72,126 President Chain Store Corp. 10,708,647 71,495 SinoPac Financial Holdings Co. Ltd. 138,140,663 64,161 Taishin Financial Holding Co. Ltd. 133,137,921 62,975 HTC Corp. 13,548,925 60,040 Compal Electronics Inc. 78,102,629 58,445 Far EasTone Telecommunications Co. Ltd. 29,599,343 58,051 Lite-On Technology Corp. 39,179,607 57,558 Taiwan Cooperative Financial Holding Co. Ltd. 105,242,646 56,755 E.Sun Financial Holding Co. Ltd. 89,980,030 55,704 MStar Semiconductor Inc. 4,938,629 54,117 Advanced Semiconductor Engineering Inc. 58,567,717 54,034 * Innolux Corp. 154,844,724 53,241 Asia Cement Corp. 42,635,578 52,404 Inventec Corp. 56,288,489 51,491 United Microelectronics Corp. ADR 24,480,943 49,451 Foxconn Technology Co. Ltd. 19,202,380 42,924 United Microelectronics Corp. 102,568,970 41,846 Shin Kong Financial Holding Co. Ltd. 124,982,072 41,823 ^ Advanced Semiconductor Engineering Inc. ADR 9,083,579 41,058 Pegatron Corp. 30,442,897 39,937 Novatek Microelectronics Corp. 9,699,817 38,592 Synnex Technology International Corp. 21,886,055 36,808 Advantech Co. Ltd. 5,526,942 34,419 Epistar Corp. 15,572,732 34,100 Wistron Corp. 41,134,759 34,012 Teco Electric and Machinery Co. Ltd. 30,276,000 32,925 Giant Manufacturing Co. Ltd. 5,168,721 32,597 Chang Hwa Commercial Bank 54,472,681 32,058 Siliconware Precision Industries Co. ADR 5,609,703 32,031 Siliconware Precision Industries Co. 26,201,860 31,298 * Acer Inc. 50,879,905 30,089 TPK Holding Co. Ltd. 4,732,067 29,934 Taiwan Fertilizer Co. Ltd. 13,303,100 27,812 Pou Chen Corp. 20,059,531 27,544 * AU Optronics Corp. 92,924,669 27,544 Chicony Electronics Co. Ltd. 10,583,060 26,994 Yulon Motor Co. Ltd. 15,408,584 26,448 Taiwan Glass Industry Corp. 25,197,551 24,678
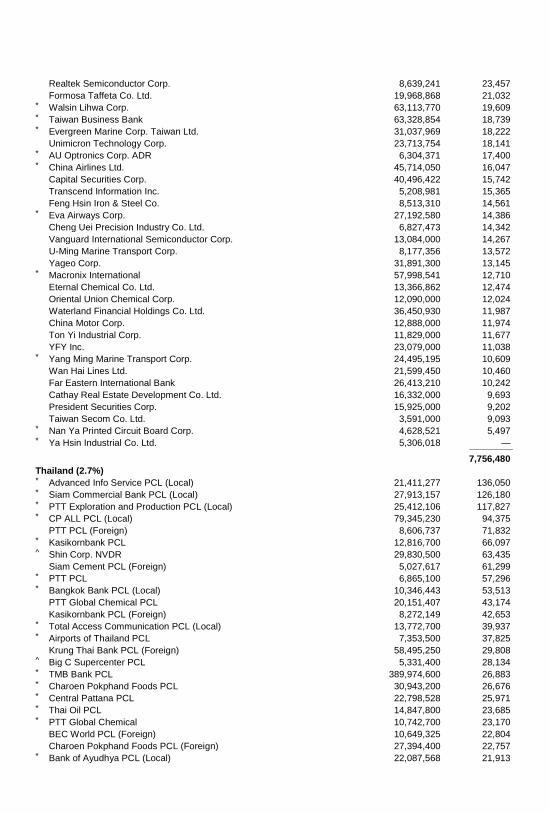
Realtek Semiconductor Corp. 8,639,241 23,457 Formosa Taffeta Co. Ltd. 19,968,868 21,032 * Walsin Lihwa Corp. 63,113,770 19,609 * Taiwan Business Bank 63,328,854 18,739 * Evergreen Marine Corp. Taiwan Ltd. 31,037,969 18,222 Unimicron Technology Corp. 23,713,754 18,141 * AU Optronics Corp. ADR 6,304,371 17,400 * China Airlines Ltd. 45,714,050 16,047 Capital Securities Corp. 40,496,422 15,742 Transcend Information Inc. 5,208,981 15,365 Feng Hsin Iron & Steel Co. 8,513,310 14,561 * Eva Airways Corp. 27,192,580 14,386 Cheng Uei Precision Industry Co. Ltd. 6,827,473 14,342 Vanguard International Semiconductor Corp. 13,084,000 14,267 U-Ming Marine Transport Corp. 8,177,356 13,572 Yageo Corp. 31,891,300 13,145 * Macronix International 57,998,541 12,710 Eternal Chemical Co. Ltd. 13,366,862 12,474 Oriental Union Chemical Corp. 12,090,000 12,024 Waterland Financial Holdings Co. Ltd. 36,450,930 11,987 China Motor Corp. 12,888,000 11,974 Ton Yi Industrial Corp. 11,829,000 11,677 YFY Inc. 23,079,000 11,038 * Yang Ming Marine Transport Corp. 24,495,195 10,609 Wan Hai Lines Ltd. 21,599,450 10,460 Far Eastern International Bank 26,413,210 10,242 Cathay Real Estate Development Co. Ltd. 16,332,000 9,693 President Securities Corp. 15,925,000 9,202 Taiwan Secom Co. Ltd. 3,591,000 9,093 * Nan Ya Printed Circuit Board Corp. 4,628,521 5,497 * Ya Hsin Industrial Co. Ltd. 5,306,018 — _____________
7,756,480
Thailand (2.7%)
* Advanced Info Service PCL (Local) 21,411,277 136,050 * Siam Commercial Bank PCL (Local) 27,913,157 126,180 * PTT Exploration and Production PCL (Local) 25,412,106 117,827 * CP ALL PCL (Local) 79,345,230 94,375 PTT PCL (Foreign) 8,606,737 71,832 * Kasikornbank PCL 12,816,700 66,097 ^ Shin Corp. NVDR 29,830,500 63,435 Siam Cement PCL (Foreign) 5,027,617 61,299 * PTT PCL 6,865,100 57,296 * Bangkok Bank PCL (Local) 10,346,443 53,513 PTT Global Chemical PCL 20,151,407 43,174 Kasikornbank PCL (Foreign) 8,272,149 42,653 * Total Access Communication PCL (Local) 13,772,700 39,937 * Airports of Thailand PCL 7,353,500 37,825 Krung Thai Bank PCL (Foreign) 58,495,250 29,808 ^ Big C Supercenter PCL 5,331,400 28,134 * TMB Bank PCL 389,974,600 26,883 * Charoen Pokphand Foods PCL 30,943,200 26,676 * Central Pattana PCL 22,798,528 25,971 * Thai Oil PCL 14,847,800 23,685 * PTT Global Chemical 10,742,700 23,170 BEC World PCL (Foreign) 10,649,325 22,804 Charoen Pokphand Foods PCL (Foreign) 27,394,400 22,757 * Bank of Ayudhya PCL (Local) 22,087,568 21,913
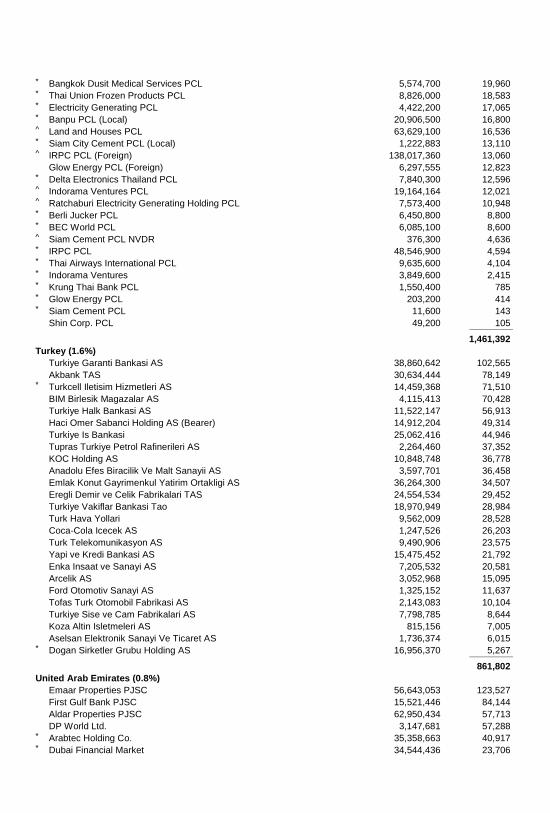
* Bangkok Dusit Medical Services PCL 5,574,700 19,960 * Thai Union Frozen Products PCL 8,826,000 18,583 * Electricity Generating PCL 4,422,200 17,065 * Banpu PCL (Local) 20,906,500 16,800 ^ Land and Houses PCL 63,629,100 16,536 * Siam City Cement PCL (Local) 1,222,883 13,110 ^ IRPC PCL (Foreign) 138,017,360 13,060 Glow Energy PCL (Foreign) 6,297,555 12,823 * Delta Electronics Thailand PCL 7,840,300 12,596 ^ Indorama Ventures PCL 19,164,164 12,021 ^ Ratchaburi Electricity Generating Holding PCL 7,573,400 10,948 * Berli Jucker PCL 6,450,800 8,800 * BEC World PCL 6,085,100 8,600 ^ Siam Cement PCL NVDR 376,300 4,636 * IRPC PCL 48,546,900 4,594 * Thai Airways International PCL 9,635,600 4,104 * Indorama Ventures 3,849,600 2,415 * Krung Thai Bank PCL 1,550,400 785 * Glow Energy PCL 203,200 414 * Siam Cement PCL 11,600 143 Shin Corp. PCL 49,200 105 _____________
1,461,392
Turkey (1.6%)
Turkiye Garanti Bankasi AS 38,860,642 102,565 Akbank TAS 30,634,444 78,149 * Turkcell Iletisim Hizmetleri AS 14,459,368 71,510 BIM Birlesik Magazalar AS 4,115,413 70,428 Turkiye Halk Bankasi AS 11,522,147 56,913 Haci Omer Sabanci Holding AS (Bearer) 14,912,204 49,314 Turkiye Is Bankasi 25,062,416 44,946 Tupras Turkiye Petrol Rafinerileri AS 2,264,460 37,352 KOC Holding AS 10,848,748 36,778 Anadolu Efes Biracilik Ve Malt Sanayii AS 3,597,701 36,458 Emlak Konut Gayrimenkul Yatirim Ortakligi AS 36,264,300 34,507 Eregli Demir ve Celik Fabrikalari TAS 24,554,534 29,452 Turkiye Vakiflar Bankasi Tao 18,970,949 28,984 Turk Hava Yollari 9,562,009 28,528 Coca-Cola Icecek AS 1,247,526 26,203 Turk Telekomunikasyon AS 9,490,906 23,575 Yapi ve Kredi Bankasi AS 15,475,452 21,792 Enka Insaat ve Sanayi AS 7,205,532 20,581 Arcelik AS 3,052,968 15,095 Ford Otomotiv Sanayi AS 1,325,152 11,637 Tofas Turk Otomobil Fabrikasi AS 2,143,083 10,104 Turkiye Sise ve Cam Fabrikalari AS 7,798,785 8,644 Koza Altin Isletmeleri AS 815,156 7,005 Aselsan Elektronik Sanayi Ve Ticaret AS 1,736,374 6,015 * Dogan Sirketler Grubu Holding AS 16,956,370 5,267 _____________
861,802
United Arab Emirates (0.8%)
Emaar Properties PJSC 56,643,053 123,527 First Gulf Bank PJSC 15,521,446 84,144 Aldar Properties PJSC 62,950,434 57,713 DP World Ltd. 3,147,681 57,288 * Arabtec Holding Co. 35,358,663 40,917 * Dubai Financial Market 34,544,436 23,706
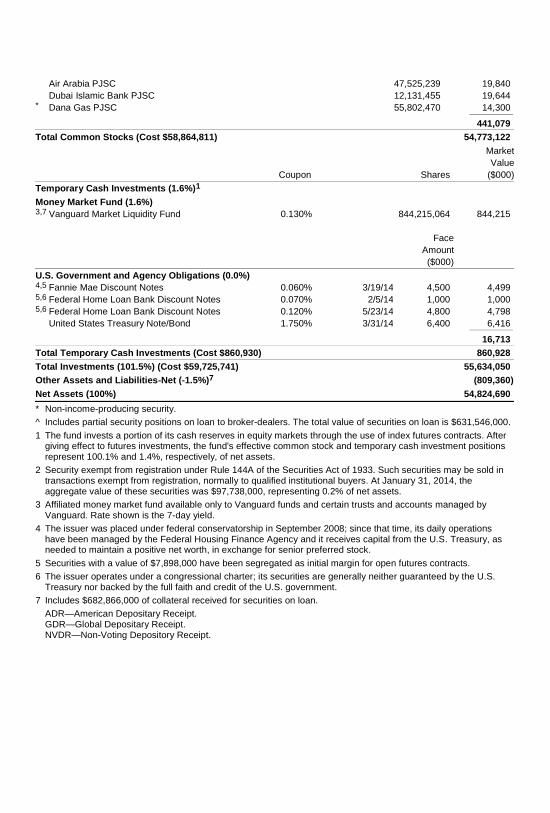
Air Arabia PJSC 47,525,239 19,840 Dubai Islamic Bank PJSC 12,131,455 19,644 * Dana Gas PJSC 55,802,470 14,300 _____________
441,079
Total Common Stocks (Cost $58,864,811) 54,773,122
Coupon Shares
Market
Value
($000)
Temporary Cash Investments (1.6%)1
Money Market Fund (1.6%) 3,7 Vanguard Market Liquidity Fund 0.130% 844,215,064 844,215
Face
Amount
($000)
U.S. Government and Agency Obligations (0.0%)
4,5 Fannie Mae Discount Notes 0.060% 3/19/14 4,500 4,499 5,6 Federal Home Loan Bank Discount Notes 0.070% 2/5/14 1,000 1,000 5,6 Federal Home Loan Bank Discount Notes 0.120% 5/23/14 4,800 4,798 United States Treasury Note/Bond 1.750% 3/31/14 6,400 6,416 _____________
16,713
Total Temporary Cash Investments (Cost $860,930) 860,928
Total Investments (101.5%) (Cost $59,725,741) 55,634,050
Other Assets and Liabilities-Net (-1.5%)7 (809,360)
Net Assets (100%) 54,824,690
* Non-income-producing security.
^ Includes partial security positions on loan to broker-dealers. The total value of securities on loan is $631,546,000.
1 The fund invests a portion of its cash reserves in equity markets through the use of index futures contracts. After giving effect to futures investments, the fund's effective common stock and temporary cash investment positions represent 100.1% and 1.4%, respectively, of net assets.
2 Security exempt from registration under Rule 144A of the Securities Act of 1933. Such securities may be sold in transactions exempt from registration, normally to qualified institutional buyers. At January 31, 2014, the aggregate value of these securities was $97,738,000, representing 0.2% of net assets.
3 Affiliated money market fund available only to Vanguard funds and certain trusts and accounts managed by Vanguard. Rate shown is the 7-day yield.
4 The issuer was placed under federal conservatorship in September 2008; since that time, its daily operations have been managed by the Federal Housing Finance Agency and it receives capital from the U.S. Treasury, as needed to maintain a positive net worth, in exchange for senior preferred stock.
5 Securities with a value of $7,898,000 have been segregated as initial margin for open futures contracts.
6 The issuer operates under a congressional charter; its securities are generally neither guaranteed by the U.S. Treasury nor backed by the full faith and credit of the U.S. government.
7 Includes $682,866,000 of collateral received for securities on loan.
ADR—American Depositary Receipt. GDR—Global Depositary Receipt. NVDR—Non-Voting Depository Receipt.

Investments
Level 1
($000 )
Level 2
($000 )
Level 3
($000 )
Common Stocks—North and South America 5,950,030 5,805,095 —
Common Stocks—Other 1,255,131 41,708,749 54,117
Temporary Cash Investments 844,215 16,713 —
Futures Contracts—Liabilities1 (10) — —
Total 8,049,366 47,530,557 54,117
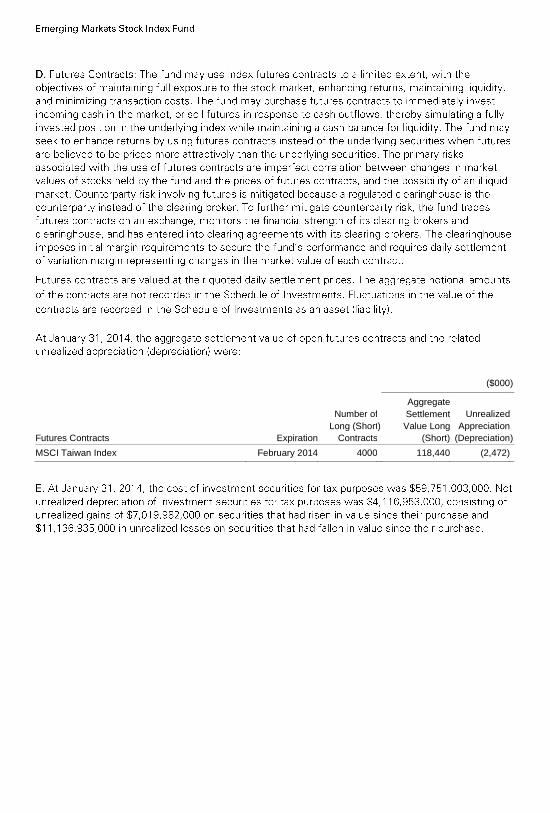
.
($000 )
Futures Contracts Expiration
Number of
Long (Short
Contracts
)
Aggregate
Settlement
Value Long
(Short)
Unrealized
Appreciation
(Depreciation )
MSCI Taiwan Index February 2014 4000 118,440 (2,472)
.
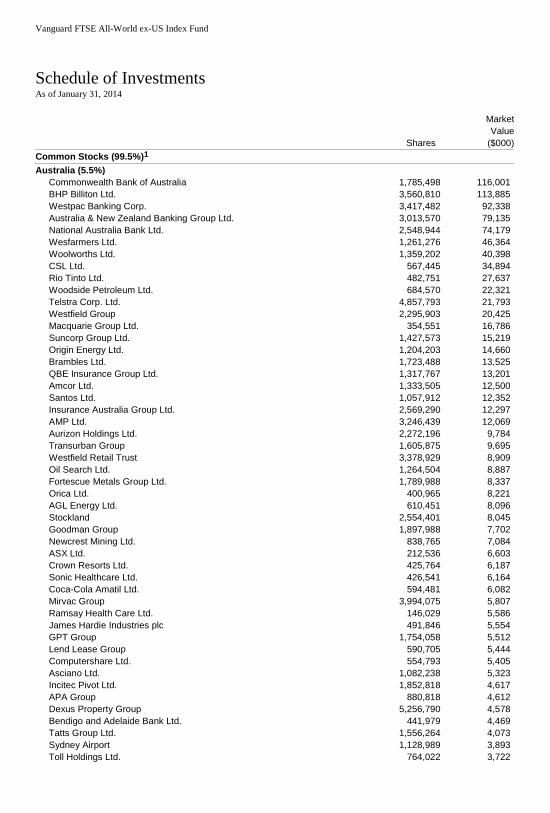
Vanguard FTSE All-World ex-US Index Fund
Schedule of Investments As of January 31, 2014
Shares
Market
Value
($000)
Common Stocks (99.5%)1
Australia (5.5%)
Commonwealth Bank of Australia 1,785,498 116,001 BHP Billiton Ltd. 3,560,810 113,885 Westpac Banking Corp. 3,417,482 92,338 Australia & New Zealand Banking Group Ltd. 3,013,570 79,135 National Australia Bank Ltd. 2,548,944 74,179 Wesfarmers Ltd. 1,261,276 46,364 Woolworths Ltd. 1,359,202 40,398 CSL Ltd. 567,445 34,894 Rio Tinto Ltd. 482,751 27,637 Woodside Petroleum Ltd. 684,570 22,321 Telstra Corp. Ltd. 4,857,793 21,793 Westfield Group 2,295,903 20,425 Macquarie Group Ltd. 354,551 16,786 Suncorp Group Ltd. 1,427,573 15,219 Origin Energy Ltd. 1,204,203 14,660 Brambles Ltd. 1,723,488 13,525 QBE Insurance Group Ltd. 1,317,767 13,201 Amcor Ltd. 1,333,505 12,500 Santos Ltd. 1,057,912 12,352 Insurance Australia Group Ltd. 2,569,290 12,297 AMP Ltd. 3,246,439 12,069 Aurizon Holdings Ltd. 2,272,196 9,784 Transurban Group 1,605,875 9,695 Westfield Retail Trust 3,378,929 8,909 Oil Search Ltd. 1,264,504 8,887 Fortescue Metals Group Ltd. 1,789,988 8,337 Orica Ltd. 400,965 8,221 AGL Energy Ltd. 610,451 8,096 Stockland 2,554,401 8,045 Goodman Group 1,897,988 7,702 Newcrest Mining Ltd. 838,765 7,084 ASX Ltd. 212,536 6,603 Crown Resorts Ltd. 425,764 6,187 Sonic Healthcare Ltd. 426,541 6,164 Coca-Cola Amatil Ltd. 594,481 6,082 Mirvac Group 3,994,075 5,807 Ramsay Health Care Ltd. 146,029 5,586 James Hardie Industries plc 491,846 5,554 GPT Group 1,754,058 5,512 Lend Lease Group 590,705 5,444 Computershare Ltd. 554,793 5,405 Asciano Ltd. 1,082,238 5,323 Incitec Pivot Ltd. 1,852,818 4,617 APA Group 880,818 4,612 Dexus Property Group 5,256,790 4,578 Bendigo and Adelaide Bank Ltd. 441,979 4,469 Tatts Group Ltd. 1,556,264 4,073 Sydney Airport 1,128,989 3,893 Toll Holdings Ltd. 764,022 3,722
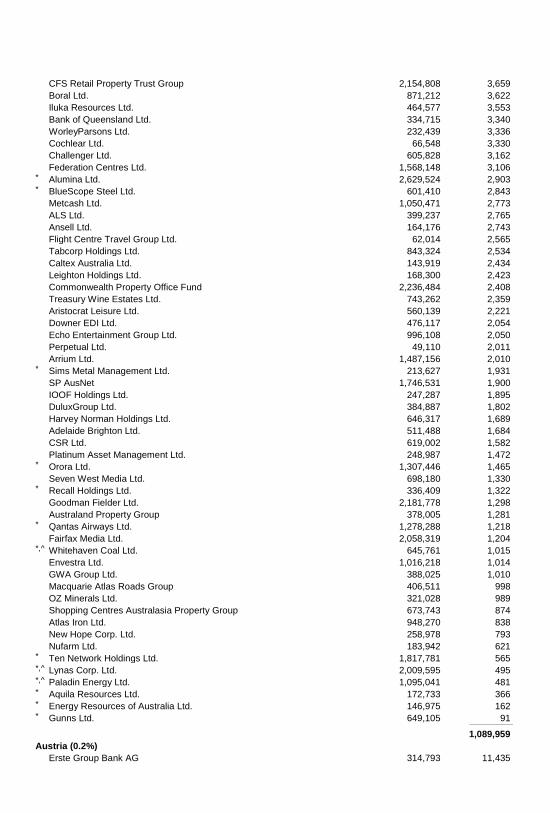
CFS Retail Property Trust Group 2,154,808 3,659 Boral Ltd. 871,212 3,622 Iluka Resources Ltd. 464,577 3,553 Bank of Queensland Ltd. 334,715 3,340 WorleyParsons Ltd. 232,439 3,336 Cochlear Ltd. 66,548 3,330 Challenger Ltd. 605,828 3,162 Federation Centres Ltd. 1,568,148 3,106 * Alumina Ltd. 2,629,524 2,903 * BlueScope Steel Ltd. 601,410 2,843 Metcash Ltd. 1,050,471 2,773 ALS Ltd. 399,237 2,765 Ansell Ltd. 164,176 2,743 Flight Centre Travel Group Ltd. 62,014 2,565 Tabcorp Holdings Ltd. 843,324 2,534 Caltex Australia Ltd. 143,919 2,434 Leighton Holdings Ltd. 168,300 2,423 Commonwealth Property Office Fund 2,236,484 2,408 Treasury Wine Estates Ltd. 743,262 2,359 Aristocrat Leisure Ltd. 560,139 2,221 Downer EDI Ltd. 476,117 2,054 Echo Entertainment Group Ltd. 996,108 2,050 Perpetual Ltd. 49,110 2,011 Arrium Ltd. 1,487,156 2,010 * Sims Metal Management Ltd. 213,627 1,931 SP AusNet 1,746,531 1,900 IOOF Holdings Ltd. 247,287 1,895 DuluxGroup Ltd. 384,887 1,802 Harvey Norman Holdings Ltd. 646,317 1,689 Adelaide Brighton Ltd. 511,488 1,684 CSR Ltd. 619,002 1,582 Platinum Asset Management Ltd. 248,987 1,472 * Orora Ltd. 1,307,446 1,465 Seven West Media Ltd. 698,180 1,330 * Recall Holdings Ltd. 336,409 1,322 Goodman Fielder Ltd. 2,181,778 1,298 Australand Property Group 378,005 1,281 * Qantas Airways Ltd. 1,278,288 1,218 Fairfax Media Ltd. 2,058,319 1,204 *,^ Whitehaven Coal Ltd. 645,761 1,015 Envestra Ltd. 1,016,218 1,014 GWA Group Ltd. 388,025 1,010 Macquarie Atlas Roads Group 406,511 998 OZ Minerals Ltd. 321,028 989 Shopping Centres Australasia Property Group 673,743 874 Atlas Iron Ltd. 948,270 838 New Hope Corp. Ltd. 258,978 793 Nufarm Ltd. 183,942 621 * Ten Network Holdings Ltd. 1,817,781 565 *,^ Lynas Corp. Ltd. 2,009,595 495 *,^ Paladin Energy Ltd. 1,095,041 481 * Aquila Resources Ltd. 172,733 366 * Energy Resources of Australia Ltd. 146,975 162 * Gunns Ltd. 649,105 91 _____________
1,089,959
Austria (0.2%)
Erste Group Bank AG 314,793 11,435
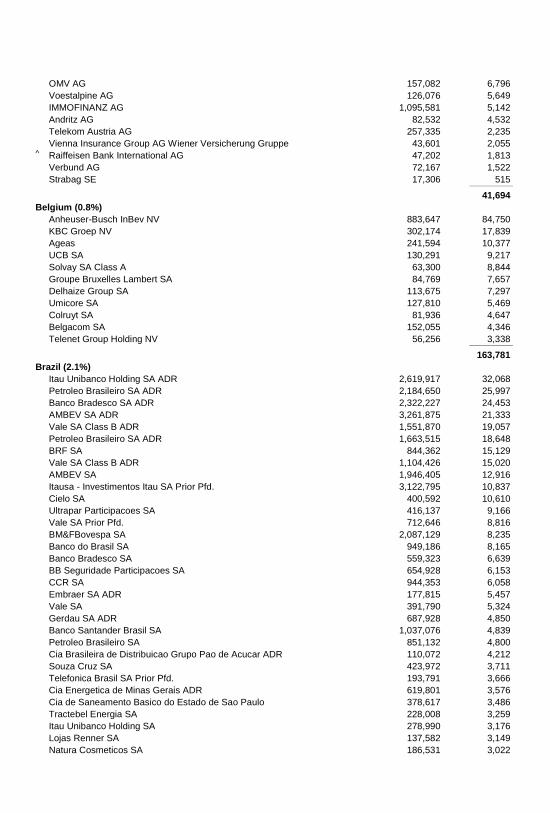
OMV AG 157,082 6,796 Voestalpine AG 126,076 5,649 IMMOFINANZ AG 1,095,581 5,142 Andritz AG 82,532 4,532 Telekom Austria AG 257,335 2,235 Vienna Insurance Group AG Wiener Versicherung Gruppe 43,601 2,055 ^ Raiffeisen Bank International AG 47,202 1,813 Verbund AG 72,167 1,522 Strabag SE 17,306 515 _____________
41,694
Belgium (0.8%)
Anheuser-Busch InBev NV 883,647 84,750 KBC Groep NV 302,174 17,839 Ageas 241,594 10,377 UCB SA 130,291 9,217 Solvay SA Class A 63,300 8,844 Groupe Bruxelles Lambert SA 84,769 7,657 Delhaize Group SA 113,675 7,297 Umicore SA 127,810 5,469 Colruyt SA 81,936 4,647 Belgacom SA 152,055 4,346 Telenet Group Holding NV 56,256 3,338 _____________
163,781
Brazil (2.1%)
Itau Unibanco Holding SA ADR 2,619,917 32,068 Petroleo Brasileiro SA ADR 2,184,650 25,997 Banco Bradesco SA ADR 2,322,227 24,453 AMBEV SA ADR 3,261,875 21,333 Vale SA Class B ADR 1,551,870 19,057 Petroleo Brasileiro SA ADR 1,663,515 18,648 BRF SA 844,362 15,129 Vale SA Class B ADR 1,104,426 15,020 AMBEV SA 1,946,405 12,916 Itausa - Investimentos Itau SA Prior Pfd. 3,122,795 10,837 Cielo SA 400,592 10,610 Ultrapar Participacoes SA 416,137 9,166 Vale SA Prior Pfd. 712,646 8,816 BM&FBovespa SA 2,087,129 8,235 Banco do Brasil SA 949,186 8,165 Banco Bradesco SA 559,323 6,639 BB Seguridade Participacoes SA 654,928 6,153 CCR SA 944,353 6,058 Embraer SA ADR 177,815 5,457 Vale SA 391,790 5,324 Gerdau SA ADR 687,928 4,850 Banco Santander Brasil SA 1,037,076 4,839 Petroleo Brasileiro SA 851,132 4,800 Cia Brasileira de Distribuicao Grupo Pao de Acucar ADR 110,072 4,212 Souza Cruz SA 423,972 3,711 Telefonica Brasil SA Prior Pfd. 193,791 3,666 Cia Energetica de Minas Gerais ADR 619,801 3,576 Cia de Saneamento Basico do Estado de Sao Paulo 378,617 3,486 Tractebel Energia SA 228,008 3,259 Itau Unibanco Holding SA 278,990 3,176 Lojas Renner SA 137,582 3,149 Natura Cosmeticos SA 186,531 3,022
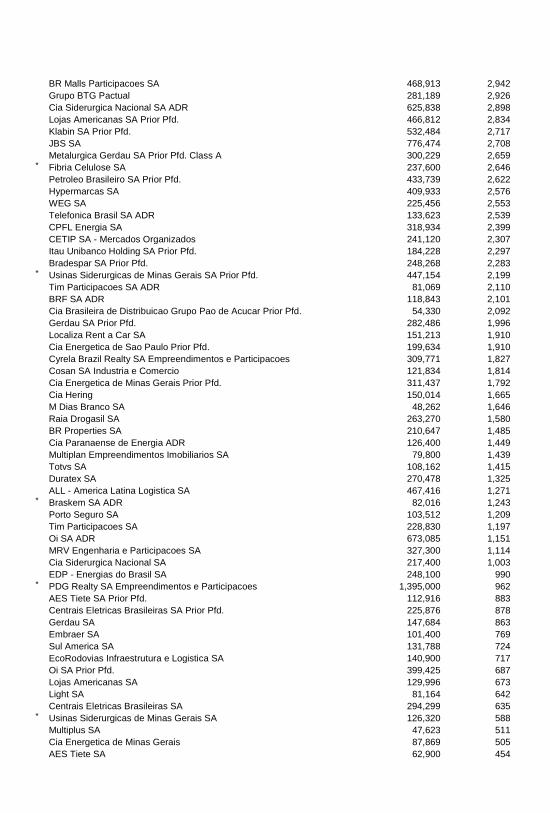
BR Malls Participacoes SA 468,913 2,942 Grupo BTG Pactual 281,189 2,926 Cia Siderurgica Nacional SA ADR 625,838 2,898 Lojas Americanas SA Prior Pfd. 466,812 2,834 Klabin SA Prior Pfd. 532,484 2,717 JBS SA 776,474 2,708 Metalurgica Gerdau SA Prior Pfd. Class A 300,229 2,659 * Fibria Celulose SA 237,600 2,646 Petroleo Brasileiro SA Prior Pfd. 433,739 2,622 Hypermarcas SA 409,933 2,576 WEG SA 225,456 2,553 Telefonica Brasil SA ADR 133,623 2,539 CPFL Energia SA 318,934 2,399 CETIP SA - Mercados Organizados 241,120 2,307 Itau Unibanco Holding SA Prior Pfd. 184,228 2,297 Bradespar SA Prior Pfd. 248,268 2,283 * Usinas Siderurgicas de Minas Gerais SA Prior Pfd. 447,154 2,199 Tim Participacoes SA ADR 81,069 2,110 BRF SA ADR 118,843 2,101 Cia Brasileira de Distribuicao Grupo Pao de Acucar Prior Pfd. 54,330 2,092 Gerdau SA Prior Pfd. 282,486 1,996 Localiza Rent a Car SA 151,213 1,910 Cia Energetica de Sao Paulo Prior Pfd. 199,634 1,910 Cyrela Brazil Realty SA Empreendimentos e Participacoes 309,771 1,827 Cosan SA Industria e Comercio 121,834 1,814 Cia Energetica de Minas Gerais Prior Pfd. 311,437 1,792 Cia Hering 150,014 1,665 M Dias Branco SA 48,262 1,646 Raia Drogasil SA 263,270 1,580 BR Properties SA 210,647 1,485 Cia Paranaense de Energia ADR 126,400 1,449 Multiplan Empreendimentos Imobiliarios SA 79,800 1,439 Totvs SA 108,162 1,415 Duratex SA 270,478 1,325 ALL - America Latina Logistica SA 467,416 1,271 * Braskem SA ADR 82,016 1,243 Porto Seguro SA 103,512 1,209 Tim Participacoes SA 228,830 1,197 Oi SA ADR 673,085 1,151 MRV Engenharia e Participacoes SA 327,300 1,114 Cia Siderurgica Nacional SA 217,400 1,003 EDP - Energias do Brasil SA 248,100 990 * PDG Realty SA Empreendimentos e Participacoes 1,395,000 962 AES Tiete SA Prior Pfd. 112,916 883 Centrais Eletricas Brasileiras SA Prior Pfd. 225,876 878 Gerdau SA 147,684 863 Embraer SA 101,400 769 Sul America SA 131,788 724 EcoRodovias Infraestrutura e Logistica SA 140,900 717 Oi SA Prior Pfd. 399,425 687 Lojas Americanas SA 129,996 673 Light SA 81,164 642 Centrais Eletricas Brasileiras SA 294,299 635 * Usinas Siderurgicas de Minas Gerais SA 126,320 588 Multiplus SA 47,623 511 Cia Energetica de Minas Gerais 87,869 505 AES Tiete SA 62,900 454
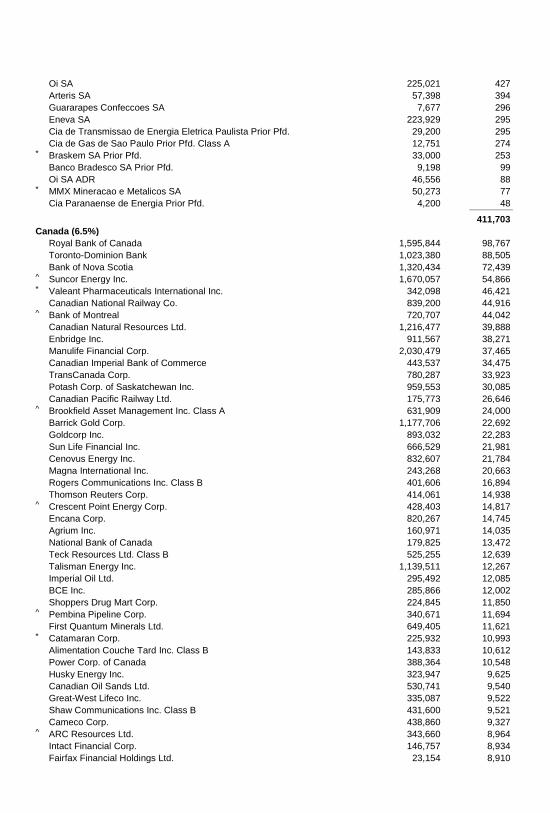
Oi SA 225,021 427 Arteris SA 57,398 394 Guararapes Confeccoes SA 7,677 296 Eneva SA 223,929 295 Cia de Transmissao de Energia Eletrica Paulista Prior Pfd. 29,200 295 Cia de Gas de Sao Paulo Prior Pfd. Class A 12,751 274 * Braskem SA Prior Pfd. 33,000 253 Banco Bradesco SA Prior Pfd. 9,198 99 Oi SA ADR 46,556 88 * MMX Mineracao e Metalicos SA 50,273 77 Cia Paranaense de Energia Prior Pfd. 4,200 48 _____________
411,703
Canada (6.5%)
Royal Bank of Canada 1,595,844 98,767 Toronto-Dominion Bank 1,023,380 88,505 Bank of Nova Scotia 1,320,434 72,439 ^ Suncor Energy Inc. 1,670,057 54,866 * Valeant Pharmaceuticals International Inc. 342,098 46,421 Canadian National Railway Co. 839,200 44,916 ^ Bank of Montreal 720,707 44,042 Canadian Natural Resources Ltd. 1,216,477 39,888 Enbridge Inc. 911,567 38,271 Manulife Financial Corp. 2,030,479 37,465 Canadian Imperial Bank of Commerce 443,537 34,475 TransCanada Corp. 780,287 33,923 Potash Corp. of Saskatchewan Inc. 959,553 30,085 Canadian Pacific Railway Ltd. 175,773 26,646 ^ Brookfield Asset Management Inc. Class A 631,909 24,000 Barrick Gold Corp. 1,177,706 22,692 Goldcorp Inc. 893,032 22,283 Sun Life Financial Inc. 666,529 21,981 Cenovus Energy Inc. 832,607 21,784 Magna International Inc. 243,268 20,663 Rogers Communications Inc. Class B 401,606 16,894 Thomson Reuters Corp. 414,061 14,938 ^ Crescent Point Energy Corp. 428,403 14,817 Encana Corp. 820,267 14,745 Agrium Inc. 160,971 14,035 National Bank of Canada 179,825 13,472 Teck Resources Ltd. Class B 525,255 12,639 Talisman Energy Inc. 1,139,511 12,267 Imperial Oil Ltd. 295,492 12,085 BCE Inc. 285,866 12,002 Shoppers Drug Mart Corp. 224,845 11,850 ^ Pembina Pipeline Corp. 340,671 11,694 First Quantum Minerals Ltd. 649,405 11,621 * Catamaran Corp. 225,932 10,993 Alimentation Couche Tard Inc. Class B 143,833 10,612 Power Corp. of Canada 388,364 10,548 Husky Energy Inc. 323,947 9,625 Canadian Oil Sands Ltd. 530,741 9,540 Great-West Lifeco Inc. 335,087 9,522 Shaw Communications Inc. Class B 431,600 9,521 Cameco Corp. 438,860 9,327 ^ ARC Resources Ltd. 343,660 8,964 Intact Financial Corp. 146,757 8,934 Fairfax Financial Holdings Ltd. 23,154 8,910
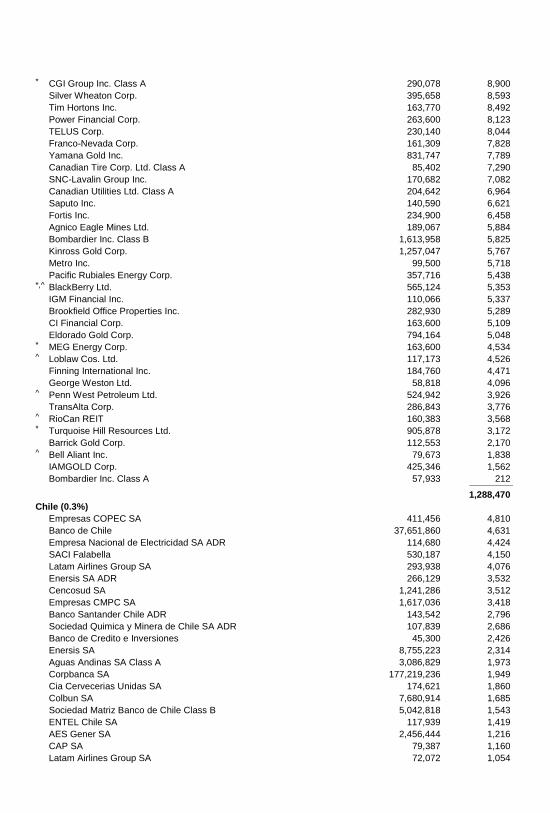
* CGI Group Inc. Class A 290,078 8,900 Silver Wheaton Corp. 395,658 8,593 Tim Hortons Inc. 163,770 8,492 Power Financial Corp. 263,600 8,123 TELUS Corp. 230,140 8,044 Franco-Nevada Corp. 161,309 7,828 Yamana Gold Inc. 831,747 7,789 Canadian Tire Corp. Ltd. Class A 85,402 7,290 SNC-Lavalin Group Inc. 170,682 7,082 Canadian Utilities Ltd. Class A 204,642 6,964 Saputo Inc. 140,590 6,621 Fortis Inc. 234,900 6,458 Agnico Eagle Mines Ltd. 189,067 5,884 Bombardier Inc. Class B 1,613,958 5,825 Kinross Gold Corp. 1,257,047 5,767 Metro Inc. 99,500 5,718 Pacific Rubiales Energy Corp. 357,716 5,438 *,^ BlackBerry Ltd. 565,124 5,353 IGM Financial Inc. 110,066 5,337 Brookfield Office Properties Inc. 282,930 5,289 CI Financial Corp. 163,600 5,109 Eldorado Gold Corp. 794,164 5,048 * MEG Energy Corp. 163,600 4,534 ^ Loblaw Cos. Ltd. 117,173 4,526 Finning International Inc. 184,760 4,471 George Weston Ltd. 58,818 4,096 ^ Penn West Petroleum Ltd. 524,942 3,926 TransAlta Corp. 286,843 3,776 ^ RioCan REIT 160,383 3,568 * Turquoise Hill Resources Ltd. 905,878 3,172 Barrick Gold Corp. 112,553 2,170 ^ Bell Aliant Inc. 79,673 1,838 IAMGOLD Corp. 425,346 1,562 Bombardier Inc. Class A 57,933 212 _____________
1,288,470
Chile (0.3%)
Empresas COPEC SA 411,456 4,810 Banco de Chile 37,651,860 4,631 Empresa Nacional de Electricidad SA ADR 114,680 4,424 SACI Falabella 530,187 4,150 Latam Airlines Group SA 293,938 4,076 Enersis SA ADR 266,129 3,532 Cencosud SA 1,241,286 3,512 Empresas CMPC SA 1,617,036 3,418 Banco Santander Chile ADR 143,542 2,796 Sociedad Quimica y Minera de Chile SA ADR 107,839 2,686 Banco de Credito e Inversiones 45,300 2,426 Enersis SA 8,755,223 2,314 Aguas Andinas SA Class A 3,086,829 1,973 Corpbanca SA 177,219,236 1,949 Cia Cervecerias Unidas SA 174,621 1,860 Colbun SA 7,680,914 1,685 Sociedad Matriz Banco de Chile Class B 5,042,818 1,543 ENTEL Chile SA 117,939 1,419 AES Gener SA 2,456,444 1,216 CAP SA 79,387 1,160 Latam Airlines Group SA 72,072 1,054
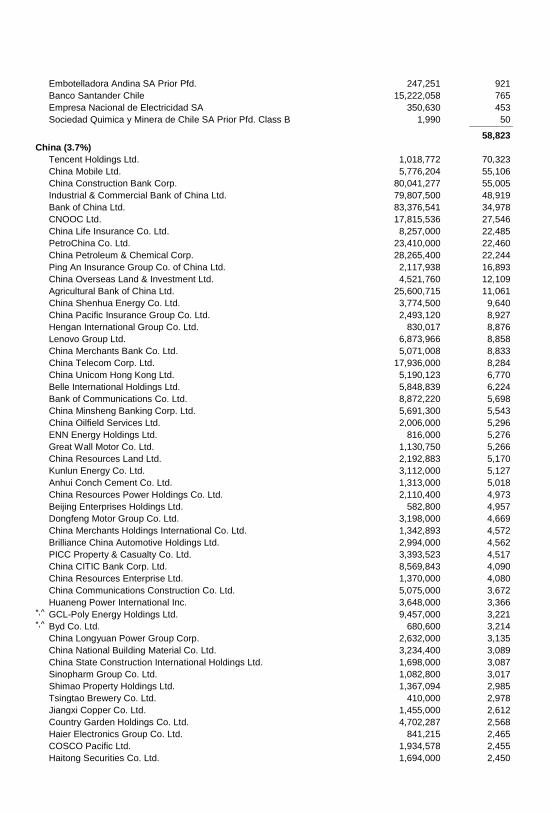
Embotelladora Andina SA Prior Pfd. 247,251 921 Banco Santander Chile 15,222,058 765 Empresa Nacional de Electricidad SA 350,630 453 Sociedad Quimica y Minera de Chile SA Prior Pfd. Class B 1,990 50 _____________
58,823
China (3.7%)
Tencent Holdings Ltd. 1,018,772 70,323 China Mobile Ltd. 5,776,204 55,106 China Construction Bank Corp. 80,041,277 55,005 Industrial & Commercial Bank of China Ltd. 79,807,500 48,919 Bank of China Ltd. 83,376,541 34,978 CNOOC Ltd. 17,815,536 27,546 China Life Insurance Co. Ltd. 8,257,000 22,485 PetroChina Co. Ltd. 23,410,000 22,460 China Petroleum & Chemical Corp. 28,265,400 22,244 Ping An Insurance Group Co. of China Ltd. 2,117,938 16,893 China Overseas Land & Investment Ltd. 4,521,760 12,109 Agricultural Bank of China Ltd. 25,600,715 11,061 China Shenhua Energy Co. Ltd. 3,774,500 9,640 China Pacific Insurance Group Co. Ltd. 2,493,120 8,927 Hengan International Group Co. Ltd. 830,017 8,876 Lenovo Group Ltd. 6,873,966 8,858 China Merchants Bank Co. Ltd. 5,071,008 8,833 China Telecom Corp. Ltd. 17,936,000 8,284 China Unicom Hong Kong Ltd. 5,190,123 6,770 Belle International Holdings Ltd. 5,848,839 6,224 Bank of Communications Co. Ltd. 8,872,220 5,698 China Minsheng Banking Corp. Ltd. 5,691,300 5,543 China Oilfield Services Ltd. 2,006,000 5,296 ENN Energy Holdings Ltd. 816,000 5,276 Great Wall Motor Co. Ltd. 1,130,750 5,266 China Resources Land Ltd. 2,192,883 5,170 Kunlun Energy Co. Ltd. 3,112,000 5,127 Anhui Conch Cement Co. Ltd. 1,313,000 5,018 China Resources Power Holdings Co. Ltd. 2,110,400 4,973 Beijing Enterprises Holdings Ltd. 582,800 4,957 Dongfeng Motor Group Co. Ltd. 3,198,000 4,669 China Merchants Holdings International Co. Ltd. 1,342,893 4,572 Brilliance China Automotive Holdings Ltd. 2,994,000 4,562 PICC Property & Casualty Co. Ltd. 3,393,523 4,517 China CITIC Bank Corp. Ltd. 8,569,843 4,090 China Resources Enterprise Ltd. 1,370,000 4,080 China Communications Construction Co. Ltd. 5,075,000 3,672 Huaneng Power International Inc. 3,648,000 3,366 *,^ GCL-Poly Energy Holdings Ltd. 9,457,000 3,221 *,^ Byd Co. Ltd. 680,600 3,214 China Longyuan Power Group Corp. 2,632,000 3,135 China National Building Material Co. Ltd. 3,234,400 3,089 China State Construction International Holdings Ltd. 1,698,000 3,087 Sinopharm Group Co. Ltd. 1,082,800 3,017 Shimao Property Holdings Ltd. 1,367,094 2,985 Tsingtao Brewery Co. Ltd. 410,000 2,978 Jiangxi Copper Co. Ltd. 1,455,000 2,612 Country Garden Holdings Co. Ltd. 4,702,287 2,568 Haier Electronics Group Co. Ltd. 841,215 2,465 COSCO Pacific Ltd. 1,934,578 2,455 Haitong Securities Co. Ltd. 1,694,000 2,450
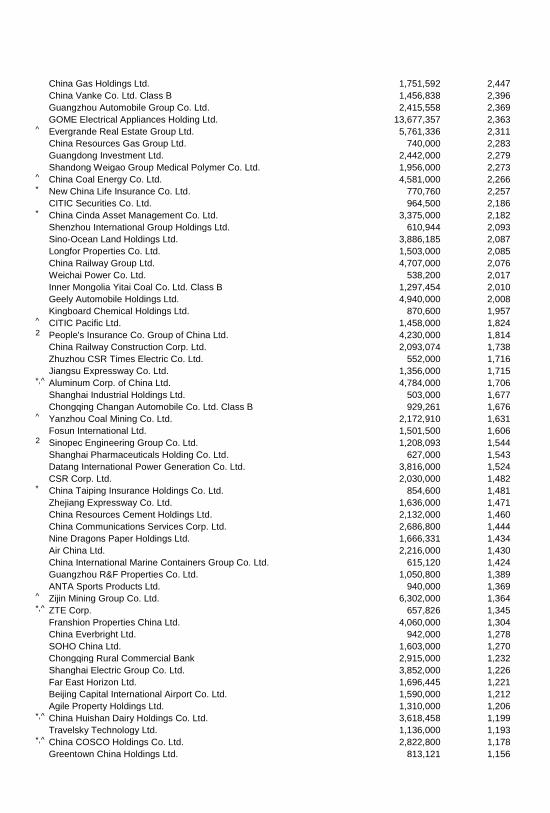
China Gas Holdings Ltd. 1,751,592 2,447 China Vanke Co. Ltd. Class B 1,456,838 2,396 Guangzhou Automobile Group Co. Ltd. 2,415,558 2,369 GOME Electrical Appliances Holding Ltd. 13,677,357 2,363 ^ Evergrande Real Estate Group Ltd. 5,761,336 2,311 China Resources Gas Group Ltd. 740,000 2,283 Guangdong Investment Ltd. 2,442,000 2,279 Shandong Weigao Group Medical Polymer Co. Ltd. 1,956,000 2,273 ^ China Coal Energy Co. Ltd. 4,581,000 2,266 * New China Life Insurance Co. Ltd. 770,760 2,257 CITIC Securities Co. Ltd. 964,500 2,186 * China Cinda Asset Management Co. Ltd. 3,375,000 2,182 Shenzhou International Group Holdings Ltd. 610,944 2,093 Sino-Ocean Land Holdings Ltd. 3,886,185 2,087 Longfor Properties Co. Ltd. 1,503,000 2,085 China Railway Group Ltd. 4,707,000 2,076 Weichai Power Co. Ltd. 538,200 2,017 Inner Mongolia Yitai Coal Co. Ltd. Class B 1,297,454 2,010 Geely Automobile Holdings Ltd. 4,940,000 2,008 Kingboard Chemical Holdings Ltd. 870,600 1,957 ^ CITIC Pacific Ltd. 1,458,000 1,824 2 People's Insurance Co. Group of China Ltd. 4,230,000 1,814 China Railway Construction Corp. Ltd. 2,093,074 1,738 Zhuzhou CSR Times Electric Co. Ltd. 552,000 1,716 Jiangsu Expressway Co. Ltd. 1,356,000 1,715 *,^ Aluminum Corp. of China Ltd. 4,784,000 1,706 Shanghai Industrial Holdings Ltd. 503,000 1,677 Chongqing Changan Automobile Co. Ltd. Class B 929,261 1,676 ^ Yanzhou Coal Mining Co. Ltd. 2,172,910 1,631 Fosun International Ltd. 1,501,500 1,606 2 Sinopec Engineering Group Co. Ltd. 1,208,093 1,544 Shanghai Pharmaceuticals Holding Co. Ltd. 627,000 1,543 Datang International Power Generation Co. Ltd. 3,816,000 1,524 CSR Corp. Ltd. 2,030,000 1,482 * China Taiping Insurance Holdings Co. Ltd. 854,600 1,481 Zhejiang Expressway Co. Ltd. 1,636,000 1,471 China Resources Cement Holdings Ltd. 2,132,000 1,460 China Communications Services Corp. Ltd. 2,686,800 1,444 Nine Dragons Paper Holdings Ltd. 1,666,331 1,434 Air China Ltd. 2,216,000 1,430 China International Marine Containers Group Co. Ltd. 615,120 1,424 Guangzhou R&F Properties Co. Ltd. 1,050,800 1,389 ANTA Sports Products Ltd. 940,000 1,369 ^ Zijin Mining Group Co. Ltd. 6,302,000 1,364 *,^ ZTE Corp. 657,826 1,345 Franshion Properties China Ltd. 4,060,000 1,304 China Everbright Ltd. 942,000 1,278 SOHO China Ltd. 1,603,000 1,270 Chongqing Rural Commercial Bank 2,915,000 1,232 Shanghai Electric Group Co. Ltd. 3,852,000 1,226 Far East Horizon Ltd. 1,696,445 1,221 Beijing Capital International Airport Co. Ltd. 1,590,000 1,212 Agile Property Holdings Ltd. 1,310,000 1,206 *,^ China Huishan Dairy Holdings Co. Ltd. 3,618,458 1,199 Travelsky Technology Ltd. 1,136,000 1,193 *,^ China COSCO Holdings Co. Ltd. 2,822,800 1,178 Greentown China Holdings Ltd. 813,121 1,156

^ Zoomlion Heavy Industry Science and Technology Co. Ltd. 1,424,805 1,149 Shenzhen International Holdings Ltd. 8,865,000 1,142 China BlueChemical Ltd. 2,044,000 1,131 Lee & Man Paper Manufacturing Ltd. 1,665,200 1,124 *,^ China Yurun Food Group Ltd. 1,793,000 1,052 Sinopec Shanghai Petrochemical Co. Ltd. 3,651,000 1,035 Yuexiu Property Co. Ltd. 4,950,000 1,010 Golden Eagle Retail Group Ltd. 716,000 979 China Agri-Industries Holdings Ltd. 2,202,200 978 BBMG Corp. 1,203,500 934 *,^ China Shipping Container Lines Co. Ltd. 3,933,700 921 Poly Property Group Co. Ltd. 1,850,000 886 Shanghai Lujiazui Finance & Trade Zone Development Co. Ltd. Class B 534,490 871 Zhongsheng Group Holdings Ltd. 581,000 859 Shenzhen Investment Ltd. 2,414,808 857 *,2 China Galaxy Securities Co. Ltd. 1,137,500 811 * Li Ning Co. Ltd. 1,003,750 796 *,^ China Shipping Development Co. Ltd. 1,316,000 782 Guangzhou Baiyunshan Pharmaceutical Holdings Co. Ltd. 230,000 748 * Huishang Bank Corp. Ltd. 1,605,504 743 Sinotrans Ltd. 1,776,000 739 Wumart Stores Inc. 564,094 719 *,^ Angang Steel Co. Ltd. 1,104,000 694 China Southern Airlines Co. Ltd. 1,995,000 684 Guangshen Railway Co. Ltd. 1,502,000 646 CSG Holding Co. Ltd. Class B 799,812 632 KWG Property Holding Ltd. 1,209,500 630 * Hopson Development Holdings Ltd. 676,000 624 Yantai Changyu Pioneer Wine Co. Ltd. Class B 235,484 601 China Molybdenum Co. Ltd. 1,375,000 574 Huadian Power International Corp. Ltd. 1,358,000 563 * China Eastern Airlines Corp. Ltd. 1,672,000 563 ^ Zhaojin Mining Industry Co. Ltd. 929,500 555 China Dongxiang Group Co. 2,813,000 548 * Renhe Commercial Holdings Co. Ltd. 10,734,000 532 Bosideng International Holdings Ltd. 2,846,000 513 Weifu High-Technology Group Co. Ltd. Class B 147,300 508 Xinjiang Goldwind Science & Technology Co. Ltd. 476,000 505 * Metallurgical Corp. of China Ltd. 2,795,000 490 Guangzhou Shipyard International Co. Ltd. 226,800 483 ^ Dongfang Electric Corp. Ltd. 348,400 479 Shanghai Waigaoqiao Free Trade Zone Development Co. Ltd. Class B 208,900 473 * China Zhongwang Holdings Ltd. 1,482,800 441 *,^ Maanshan Iron & Steel 1,818,000 437 * Shanghai Zhenhua Heavy Industries Co. Ltd. Class B 996,370 418 Inner Mongolia Eerduosi Resourses Co. Ltd. Class B 440,500 403 Shanghai Mechanical and Electrical Industry Co. Ltd. Class B 200,391 400 * Sinopec Yizheng Chemical Fibre Co. Ltd. 2,151,000 394 Guangdong Electric Power Development Co. Ltd. Class B 654,360 386 Kingboard Laminates Holdings Ltd. 1,035,500 386 Harbin Electric Co. Ltd. 698,000 385 China Merchants Property Development Co. Ltd. Class B 144,550 369 Dazhong Transportation Group Co. Ltd. Class B 547,900 363 * BOE Technology Group Co. Ltd. Class B 1,358,920 339 Shenzhen Expressway Co. Ltd. 744,000 329 *,^ China Foods Ltd. 934,000 326 Sinotruk Hong Kong Ltd. 631,500 324
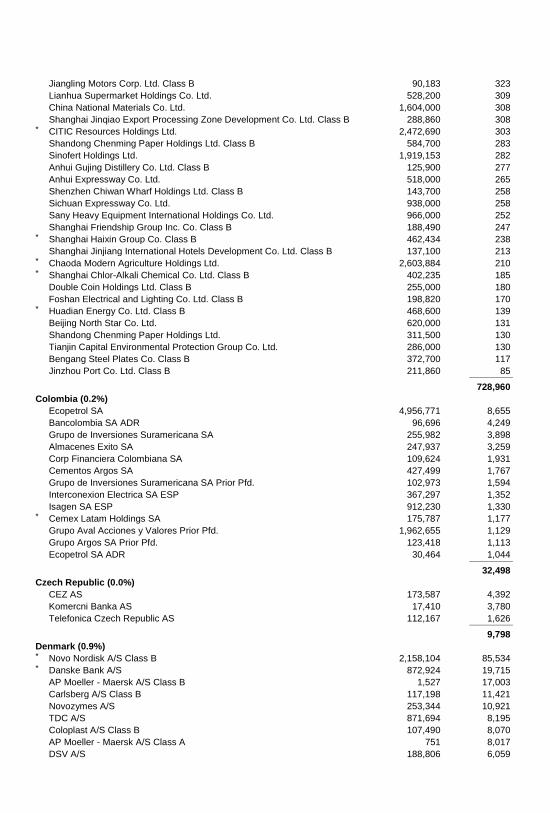
Jiangling Motors Corp. Ltd. Class B 90,183 323 Lianhua Supermarket Holdings Co. Ltd. 528,200 309 China National Materials Co. Ltd. 1,604,000 308 Shanghai Jinqiao Export Processing Zone Development Co. Ltd. Class B 288,860 308 * CITIC Resources Holdings Ltd. 2,472,690 303 Shandong Chenming Paper Holdings Ltd. Class B 584,700 283 Sinofert Holdings Ltd. 1,919,153 282 Anhui Gujing Distillery Co. Ltd. Class B 125,900 277 Anhui Expressway Co. Ltd. 518,000 265 Shenzhen Chiwan Wharf Holdings Ltd. Class B 143,700 258 Sichuan Expressway Co. Ltd. 938,000 258 Sany Heavy Equipment International Holdings Co. Ltd. 966,000 252 Shanghai Friendship Group Inc. Co. Class B 188,490 247 * Shanghai Haixin Group Co. Class B 462,434 238 Shanghai Jinjiang International Hotels Development Co. Ltd. Class B 137,100 213 * Chaoda Modern Agriculture Holdings Ltd. 2,603,884 210 * Shanghai Chlor-Alkali Chemical Co. Ltd. Class B 402,235 185 Double Coin Holdings Ltd. Class B 255,000 180 Foshan Electrical and Lighting Co. Ltd. Class B 198,820 170 * Huadian Energy Co. Ltd. Class B 468,600 139 Beijing North Star Co. Ltd. 620,000 131 Shandong Chenming Paper Holdings Ltd. 311,500 130 Tianjin Capital Environmental Protection Group Co. Ltd. 286,000 130 Bengang Steel Plates Co. Class B 372,700 117 Jinzhou Port Co. Ltd. Class B 211,860 85 _____________
728,960
Colombia (0.2%)
Ecopetrol SA 4,956,771 8,655 Bancolombia SA ADR 96,696 4,249 Grupo de Inversiones Suramericana SA 255,982 3,898 Almacenes Exito SA 247,937 3,259 Corp Financiera Colombiana SA 109,624 1,931 Cementos Argos SA 427,499 1,767 Grupo de Inversiones Suramericana SA Prior Pfd. 102,973 1,594 Interconexion Electrica SA ESP 367,297 1,352 Isagen SA ESP 912,230 1,330 * Cemex Latam Holdings SA 175,787 1,177 Grupo Aval Acciones y Valores Prior Pfd. 1,962,655 1,129 Grupo Argos SA Prior Pfd. 123,418 1,113 Ecopetrol SA ADR 30,464 1,044 _____________
32,498
Czech Republic (0.0%)
CEZ AS 173,587 4,392 Komercni Banka AS 17,410 3,780 Telefonica Czech Republic AS 112,167 1,626 _____________
9,798
Denmark (0.9%)
* Novo Nordisk A/S Class B 2,158,104 85,534 * Danske Bank A/S 872,924 19,715 AP Moeller - Maersk A/S Class B 1,527 17,003 Carlsberg A/S Class B 117,198 11,421 Novozymes A/S 253,344 10,921 TDC A/S 871,694 8,195 Coloplast A/S Class B 107,490 8,070 AP Moeller - Maersk A/S Class A 751 8,017 DSV A/S 188,806 6,059
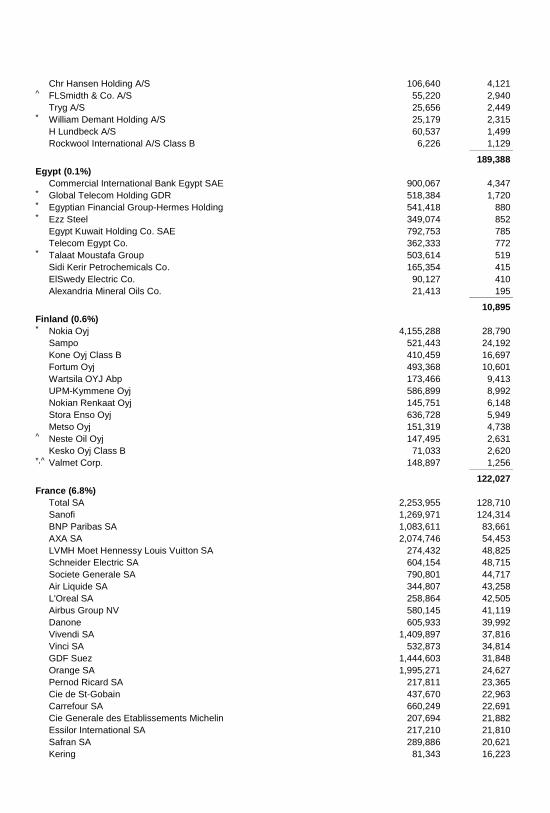
Chr Hansen Holding A/S 106,640 4,121 ^ FLSmidth & Co. A/S 55,220 2,940 Tryg A/S 25,656 2,449 * William Demant Holding A/S 25,179 2,315 H Lundbeck A/S 60,537 1,499 Rockwool International A/S Class B 6,226 1,129 _____________
189,388
Egypt (0.1%)
Commercial International Bank Egypt SAE 900,067 4,347 * Global Telecom Holding GDR 518,384 1,720 * Egyptian Financial Group-Hermes Holding 541,418 880 * Ezz Steel 349,074 852 Egypt Kuwait Holding Co. SAE 792,753 785 Telecom Egypt Co. 362,333 772 * Talaat Moustafa Group 503,614 519 Sidi Kerir Petrochemicals Co. 165,354 415 ElSwedy Electric Co. 90,127 410 Alexandria Mineral Oils Co. 21,413 195 _____________
10,895
Finland (0.6%)
* Nokia Oyj 4,155,288 28,790 Sampo 521,443 24,192 Kone Oyj Class B 410,459 16,697 Fortum Oyj 493,368 10,601 Wartsila OYJ Abp 173,466 9,413 UPM-Kymmene Oyj 586,899 8,992 Nokian Renkaat Oyj 145,751 6,148 Stora Enso Oyj 636,728 5,949 Metso Oyj 151,319 4,738 ^ Neste Oil Oyj 147,495 2,631 Kesko Oyj Class B 71,033 2,620 *,^ Valmet Corp. 148,897 1,256 _____________
122,027
France (6.8%)
Total SA 2,253,955 128,710 Sanofi 1,269,971 124,314 BNP Paribas SA 1,083,611 83,661 AXA SA 2,074,746 54,453 LVMH Moet Hennessy Louis Vuitton SA 274,432 48,825 Schneider Electric SA 604,154 48,715 Societe Generale SA 790,801 44,717 Air Liquide SA 344,807 43,258 L'Oreal SA 258,864 42,505 Airbus Group NV 580,145 41,119 Danone 605,933 39,992 Vivendi SA 1,409,897 37,816 Vinci SA 532,873 34,814 GDF Suez 1,444,603 31,848 Orange SA 1,995,271 24,627 Pernod Ricard SA 217,811 23,365 Cie de St-Gobain 437,670 22,963 Carrefour SA 660,249 22,691 Cie Generale des Etablissements Michelin 207,694 21,882 Essilor International SA 217,210 21,810 Safran SA 289,886 20,621 Kering 81,343 16,223
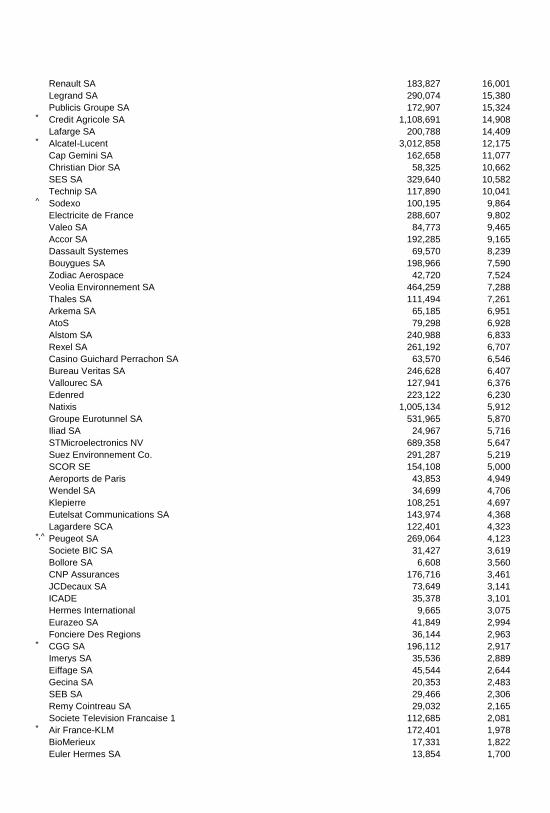
Renault SA 183,827 16,001 Legrand SA 290,074 15,380 Publicis Groupe SA 172,907 15,324 * Credit Agricole SA 1,108,691 14,908 Lafarge SA 200,788 14,409 * Alcatel-Lucent 3,012,858 12,175 Cap Gemini SA 162,658 11,077 Christian Dior SA 58,325 10,662 SES SA 329,640 10,582 Technip SA 117,890 10,041 ^ Sodexo 100,195 9,864 Electricite de France 288,607 9,802 Valeo SA 84,773 9,465 Accor SA 192,285 9,165 Dassault Systemes 69,570 8,239 Bouygues SA 198,966 7,590 Zodiac Aerospace 42,720 7,524 Veolia Environnement SA 464,259 7,288 Thales SA 111,494 7,261 Arkema SA 65,185 6,951 AtoS 79,298 6,928 Alstom SA 240,988 6,833 Rexel SA 261,192 6,707 Casino Guichard Perrachon SA 63,570 6,546 Bureau Veritas SA 246,628 6,407 Vallourec SA 127,941 6,376 Edenred 223,122 6,230 Natixis 1,005,134 5,912 Groupe Eurotunnel SA 531,965 5,870 Iliad SA 24,967 5,716 STMicroelectronics NV 689,358 5,647 Suez Environnement Co. 291,287 5,219 SCOR SE 154,108 5,000 Aeroports de Paris 43,853 4,949 Wendel SA 34,699 4,706 Klepierre 108,251 4,697 Eutelsat Communications SA 143,974 4,368 Lagardere SCA 122,401 4,323 *,^ Peugeot SA 269,064 4,123 Societe BIC SA 31,427 3,619 Bollore SA 6,608 3,560 CNP Assurances 176,716 3,461 JCDecaux SA 73,649 3,141 ICADE 35,378 3,101 Hermes International 9,665 3,075 Eurazeo SA 41,849 2,994 Fonciere Des Regions 36,144 2,963 * CGG SA 196,112 2,917 Imerys SA 35,536 2,889 Eiffage SA 45,544 2,644 Gecina SA 20,353 2,483 SEB SA 29,466 2,306 Remy Cointreau SA 29,032 2,165 Societe Television Francaise 1 112,685 2,081 * Air France-KLM 172,401 1,978 BioMerieux 17,331 1,822 Euler Hermes SA 13,854 1,700
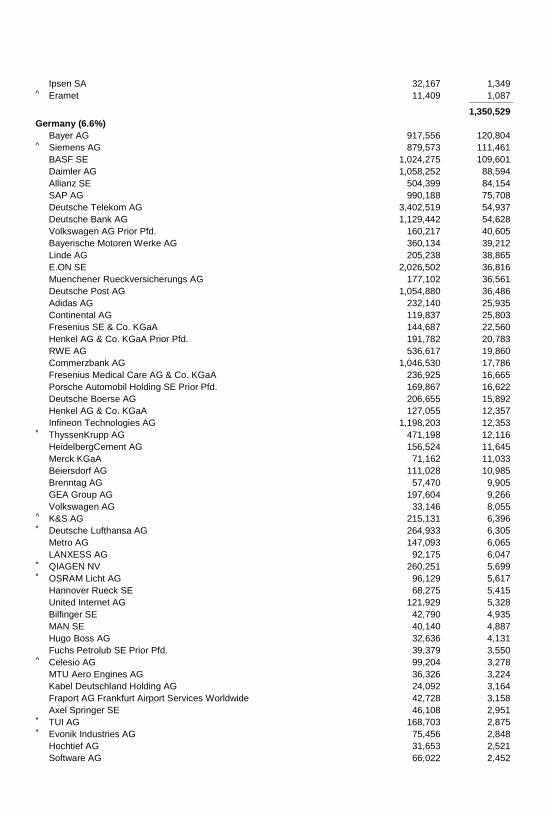
Ipsen SA 32,167 1,349 ^ Eramet 11,409 1,087 _____________
1,350,529
Germany (6.6%)
Bayer AG 917,556 120,804 ^ Siemens AG 879,573 111,461 BASF SE 1,024,275 109,601 Daimler AG 1,058,252 88,594 Allianz SE 504,399 84,154 SAP AG 990,188 75,708 Deutsche Telekom AG 3,402,519 54,937 Deutsche Bank AG 1,129,442 54,628 Volkswagen AG Prior Pfd. 160,217 40,605 Bayerische Motoren Werke AG 360,134 39,212 Linde AG 205,238 38,865 E.ON SE 2,026,502 36,816 Muenchener Rueckversicherungs AG 177,102 36,561 Deutsche Post AG 1,054,880 36,486 Adidas AG 232,140 25,935 Continental AG 119,837 25,803 Fresenius SE & Co. KGaA 144,687 22,560 Henkel AG & Co. KGaA Prior Pfd. 191,782 20,783 RWE AG 536,617 19,860 Commerzbank AG 1,046,530 17,786 Fresenius Medical Care AG & Co. KGaA 236,925 16,665 Porsche Automobil Holding SE Prior Pfd. 169,867 16,622 Deutsche Boerse AG 206,655 15,892 Henkel AG & Co. KGaA 127,055 12,357 Infineon Technologies AG 1,198,203 12,353 * ThyssenKrupp AG 471,198 12,116 HeidelbergCement AG 156,524 11,645 Merck KGaA 71,162 11,033 Beiersdorf AG 111,028 10,985 Brenntag AG 57,470 9,905 GEA Group AG 197,604 9,266 Volkswagen AG 33,146 8,055 ^ K&S AG 215,131 6,396 * Deutsche Lufthansa AG 264,933 6,305 Metro AG 147,093 6,065 LANXESS AG 92,175 6,047 * QIAGEN NV 260,251 5,699 * OSRAM Licht AG 96,129 5,617 Hannover Rueck SE 68,275 5,415 United Internet AG 121,929 5,328 Bilfinger SE 42,790 4,935 MAN SE 40,140 4,887 Hugo Boss AG 32,636 4,131 Fuchs Petrolub SE Prior Pfd. 39,379 3,550 ^ Celesio AG 99,204 3,278 MTU Aero Engines AG 36,326 3,224 Kabel Deutschland Holding AG 24,092 3,164 Fraport AG Frankfurt Airport Services Worldwide 42,728 3,158 Axel Springer SE 46,108 2,951 * TUI AG 168,703 2,875 * Evonik Industries AG 75,456 2,848 Hochtief AG 31,653 2,521 Software AG 66,022 2,452
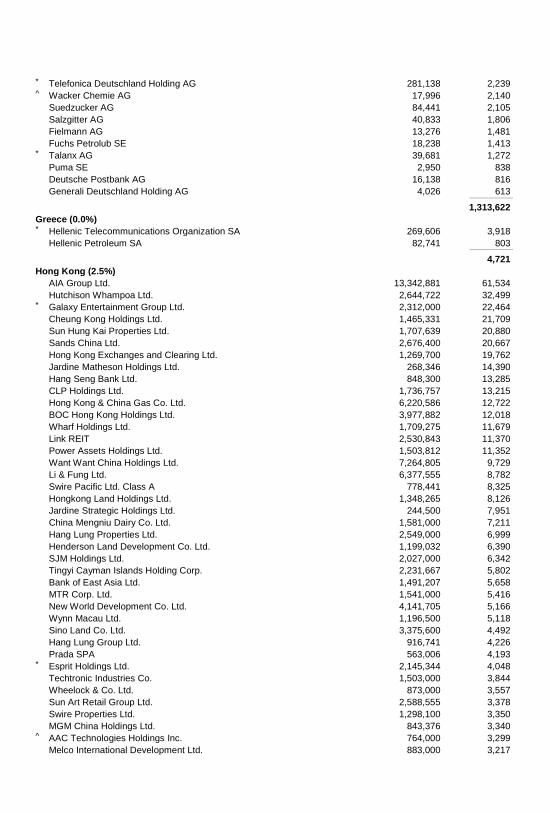
* Telefonica Deutschland Holding AG 281,138 2,239 ^ Wacker Chemie AG 17,996 2,140 Suedzucker AG 84,441 2,105 Salzgitter AG 40,833 1,806 Fielmann AG 13,276 1,481 Fuchs Petrolub SE 18,238 1,413 * Talanx AG 39,681 1,272 Puma SE 2,950 838 Deutsche Postbank AG 16,138 816 Generali Deutschland Holding AG 4,026 613 _____________
1,313,622
Greece (0.0%)
* Hellenic Telecommunications Organization SA 269,606 3,918 Hellenic Petroleum SA 82,741 803 _____________
4,721
Hong Kong (2.5%)
AIA Group Ltd. 13,342,881 61,534 Hutchison Whampoa Ltd. 2,644,722 32,499 * Galaxy Entertainment Group Ltd. 2,312,000 22,464 Cheung Kong Holdings Ltd. 1,465,331 21,709 Sun Hung Kai Properties Ltd. 1,707,639 20,880 Sands China Ltd. 2,676,400 20,667 Hong Kong Exchanges and Clearing Ltd. 1,269,700 19,762 Jardine Matheson Holdings Ltd. 268,346 14,390 Hang Seng Bank Ltd. 848,300 13,285 CLP Holdings Ltd. 1,736,757 13,215 Hong Kong & China Gas Co. Ltd. 6,220,586 12,722 BOC Hong Kong Holdings Ltd. 3,977,882 12,018 Wharf Holdings Ltd. 1,709,275 11,679 Link REIT 2,530,843 11,370 Power Assets Holdings Ltd. 1,503,812 11,352 Want Want China Holdings Ltd. 7,264,805 9,729 Li & Fung Ltd. 6,377,555 8,782 Swire Pacific Ltd. Class A 778,441 8,325 Hongkong Land Holdings Ltd. 1,348,265 8,126 Jardine Strategic Holdings Ltd. 244,500 7,951 China Mengniu Dairy Co. Ltd. 1,581,000 7,211 Hang Lung Properties Ltd. 2,549,000 6,999 Henderson Land Development Co. Ltd. 1,199,032 6,390 SJM Holdings Ltd. 2,027,000 6,342 Tingyi Cayman Islands Holding Corp. 2,231,667 5,802 Bank of East Asia Ltd. 1,491,207 5,658 MTR Corp. Ltd. 1,541,000 5,416 New World Development Co. Ltd. 4,141,705 5,166 Wynn Macau Ltd. 1,196,500 5,118 Sino Land Co. Ltd. 3,375,600 4,492 Hang Lung Group Ltd. 916,741 4,226 Prada SPA 563,006 4,193 * Esprit Holdings Ltd. 2,145,344 4,048 Techtronic Industries Co. 1,503,000 3,844 Wheelock & Co. Ltd. 873,000 3,557 Sun Art Retail Group Ltd. 2,588,555 3,378 Swire Properties Ltd. 1,298,100 3,350 MGM China Holdings Ltd. 843,376 3,340 ^ AAC Technologies Holdings Inc. 764,000 3,299 Melco International Development Ltd. 883,000 3,217
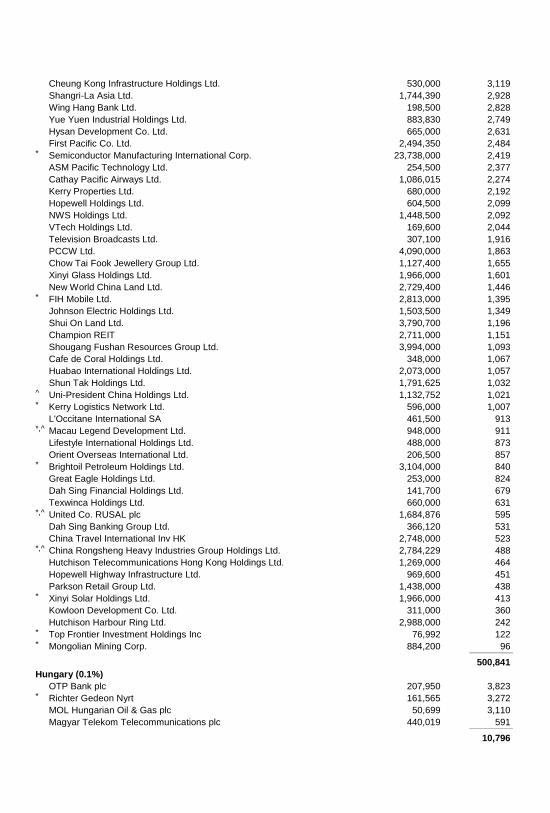
Cheung Kong Infrastructure Holdings Ltd. 530,000 3,119 Shangri-La Asia Ltd. 1,744,390 2,928 Wing Hang Bank Ltd. 198,500 2,828 Yue Yuen Industrial Holdings Ltd. 883,830 2,749 Hysan Development Co. Ltd. 665,000 2,631 First Pacific Co. Ltd. 2,494,350 2,484 * Semiconductor Manufacturing International Corp. 23,738,000 2,419 ASM Pacific Technology Ltd. 254,500 2,377 Cathay Pacific Airways Ltd. 1,086,015 2,274 Kerry Properties Ltd. 680,000 2,192 Hopewell Holdings Ltd. 604,500 2,099 NWS Holdings Ltd. 1,448,500 2,092 VTech Holdings Ltd. 169,600 2,044 Television Broadcasts Ltd. 307,100 1,916 PCCW Ltd. 4,090,000 1,863 Chow Tai Fook Jewellery Group Ltd. 1,127,400 1,655 Xinyi Glass Holdings Ltd. 1,966,000 1,601 New World China Land Ltd. 2,729,400 1,446 * FIH Mobile Ltd. 2,813,000 1,395 Johnson Electric Holdings Ltd. 1,503,500 1,349 Shui On Land Ltd. 3,790,700 1,196 Champion REIT 2,711,000 1,151 Shougang Fushan Resources Group Ltd. 3,994,000 1,093 Cafe de Coral Holdings Ltd. 348,000 1,067 Huabao International Holdings Ltd. 2,073,000 1,057 Shun Tak Holdings Ltd. 1,791,625 1,032 ^ Uni-President China Holdings Ltd. 1,132,752 1,021 * Kerry Logistics Network Ltd. 596,000 1,007 L'Occitane International SA 461,500 913 *,^ Macau Legend Development Ltd. 948,000 911 Lifestyle International Holdings Ltd. 488,000 873 Orient Overseas International Ltd. 206,500 857 * Brightoil Petroleum Holdings Ltd. 3,104,000 840 Great Eagle Holdings Ltd. 253,000 824 Dah Sing Financial Holdings Ltd. 141,700 679 Texwinca Holdings Ltd. 660,000 631 *,^ United Co. RUSAL plc 1,684,876 595 Dah Sing Banking Group Ltd. 366,120 531 China Travel International Inv HK 2,748,000 523 *,^ China Rongsheng Heavy Industries Group Holdings Ltd. 2,784,229 488 Hutchison Telecommunications Hong Kong Holdings Ltd. 1,269,000 464 Hopewell Highway Infrastructure Ltd. 969,600 451 Parkson Retail Group Ltd. 1,438,000 438 * Xinyi Solar Holdings Ltd. 1,966,000 413 Kowloon Development Co. Ltd. 311,000 360 Hutchison Harbour Ring Ltd. 2,988,000 242 * Top Frontier Investment Holdings Inc 76,992 122 * Mongolian Mining Corp. 884,200 96 _____________
500,841
Hungary (0.1%)
OTP Bank plc 207,950 3,823 * Richter Gedeon Nyrt 161,565 3,272 MOL Hungarian Oil & Gas plc 50,699 3,110 Magyar Telekom Telecommunications plc 440,019 591 _____________
10,796
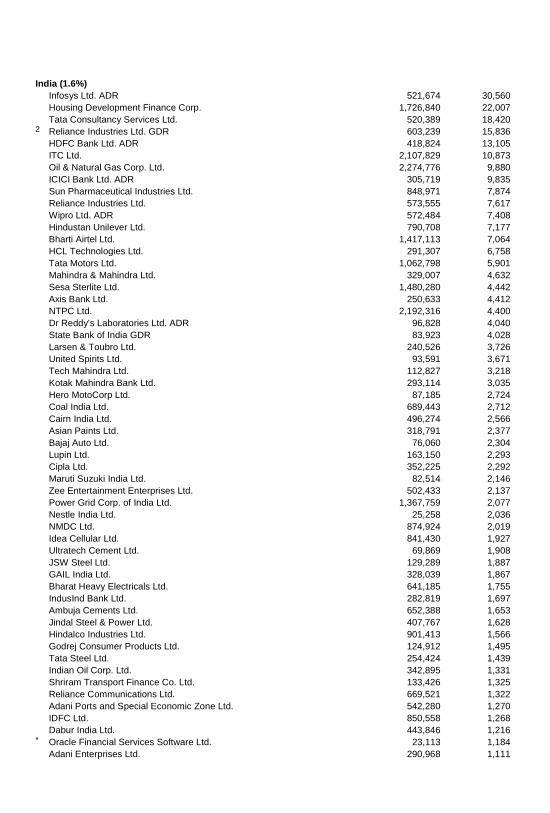
India (1.6%)
Infosys Ltd. ADR 521,674 30,560 Housing Development Finance Corp. 1,726,840 22,007 Tata Consultancy Services Ltd. 520,389 18,420 2 Reliance Industries Ltd. GDR 603,239 15,836 HDFC Bank Ltd. ADR 418,824 13,105 ITC Ltd. 2,107,829 10,873 Oil & Natural Gas Corp. Ltd. 2,274,776 9,880 ICICI Bank Ltd. ADR 305,719 9,835 Sun Pharmaceutical Industries Ltd. 848,971 7,874 Reliance Industries Ltd. 573,555 7,617 Wipro Ltd. ADR 572,484 7,408 Hindustan Unilever Ltd. 790,708 7,177 Bharti Airtel Ltd. 1,417,113 7,064 HCL Technologies Ltd. 291,307 6,758 Tata Motors Ltd. 1,062,798 5,901 Mahindra & Mahindra Ltd. 329,007 4,632 Sesa Sterlite Ltd. 1,480,280 4,442 Axis Bank Ltd. 250,633 4,412 NTPC Ltd. 2,192,316 4,400 Dr Reddy's Laboratories Ltd. ADR 96,828 4,040 State Bank of India GDR 83,923 4,028 Larsen & Toubro Ltd. 240,526 3,726 United Spirits Ltd. 93,591 3,671 Tech Mahindra Ltd. 112,827 3,218 Kotak Mahindra Bank Ltd. 293,114 3,035 Hero MotoCorp Ltd. 87,185 2,724 Coal India Ltd. 689,443 2,712 Cairn India Ltd. 496,274 2,566 Asian Paints Ltd. 318,791 2,377 Bajaj Auto Ltd. 76,060 2,304 Lupin Ltd. 163,150 2,293 Cipla Ltd. 352,225 2,292 Maruti Suzuki India Ltd. 82,514 2,146 Zee Entertainment Enterprises Ltd. 502,433 2,137 Power Grid Corp. of India Ltd. 1,367,759 2,077 Nestle India Ltd. 25,258 2,036 NMDC Ltd. 874,924 2,019 Idea Cellular Ltd. 841,430 1,927 Ultratech Cement Ltd. 69,869 1,908 JSW Steel Ltd. 129,289 1,887 GAIL India Ltd. 328,039 1,867 Bharat Heavy Electricals Ltd. 641,185 1,755 IndusInd Bank Ltd. 282,819 1,697 Ambuja Cements Ltd. 652,388 1,653 Jindal Steel & Power Ltd. 407,767 1,628 Hindalco Industries Ltd. 901,413 1,566 Godrej Consumer Products Ltd. 124,912 1,495 Tata Steel Ltd. 254,424 1,439 Indian Oil Corp. Ltd. 342,895 1,331 Shriram Transport Finance Co. Ltd. 133,426 1,325 Reliance Communications Ltd. 669,521 1,322 Adani Ports and Special Economic Zone Ltd. 542,280 1,270 IDFC Ltd. 850,558 1,268 Dabur India Ltd. 443,846 1,216 * Oracle Financial Services Software Ltd. 23,113 1,184 Adani Enterprises Ltd. 290,968 1,111
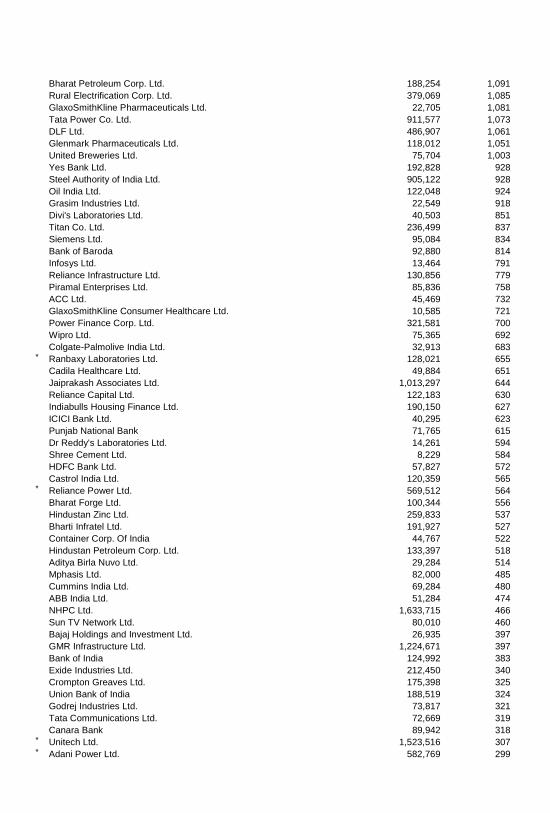
Bharat Petroleum Corp. Ltd. 188,254 1,091 Rural Electrification Corp. Ltd. 379,069 1,085 GlaxoSmithKline Pharmaceuticals Ltd. 22,705 1,081 Tata Power Co. Ltd. 911,577 1,073 DLF Ltd. 486,907 1,061 Glenmark Pharmaceuticals Ltd. 118,012 1,051 United Breweries Ltd. 75,704 1,003 Yes Bank Ltd. 192,828 928 Steel Authority of India Ltd. 905,122 928 Oil India Ltd. 122,048 924 Grasim Industries Ltd. 22,549 918 Divi's Laboratories Ltd. 40,503 851 Titan Co. Ltd. 236,499 837 Siemens Ltd. 95,084 834 Bank of Baroda 92,880 814 Infosys Ltd. 13,464 791 Reliance Infrastructure Ltd. 130,856 779 Piramal Enterprises Ltd. 85,836 758 ACC Ltd. 45,469 732 GlaxoSmithKline Consumer Healthcare Ltd. 10,585 721 Power Finance Corp. Ltd. 321,581 700 Wipro Ltd. 75,365 692 Colgate-Palmolive India Ltd. 32,913 683 * Ranbaxy Laboratories Ltd. 128,021 655 Cadila Healthcare Ltd. 49,884 651 Jaiprakash Associates Ltd. 1,013,297 644 Reliance Capital Ltd. 122,183 630 Indiabulls Housing Finance Ltd. 190,150 627 ICICI Bank Ltd. 40,295 623 Punjab National Bank 71,765 615 Dr Reddy's Laboratories Ltd. 14,261 594 Shree Cement Ltd. 8,229 584 HDFC Bank Ltd. 57,827 572 Castrol India Ltd. 120,359 565 * Reliance Power Ltd. 569,512 564 Bharat Forge Ltd. 100,344 556 Hindustan Zinc Ltd. 259,833 537 Bharti Infratel Ltd. 191,927 527 Container Corp. Of India 44,767 522 Hindustan Petroleum Corp. Ltd. 133,397 518 Aditya Birla Nuvo Ltd. 29,284 514 Mphasis Ltd. 82,000 485 Cummins India Ltd. 69,284 480 ABB India Ltd. 51,284 474 NHPC Ltd. 1,633,715 466 Sun TV Network Ltd. 80,010 460 Bajaj Holdings and Investment Ltd. 26,935 397 GMR Infrastructure Ltd. 1,224,671 397 Bank of India 124,992 383 Exide Industries Ltd. 212,450 340 Crompton Greaves Ltd. 175,398 325 Union Bank of India 188,519 324 Godrej Industries Ltd. 73,817 321 Tata Communications Ltd. 72,669 319 Canara Bank 89,942 318 * Unitech Ltd. 1,523,516 307 * Adani Power Ltd. 582,769 299
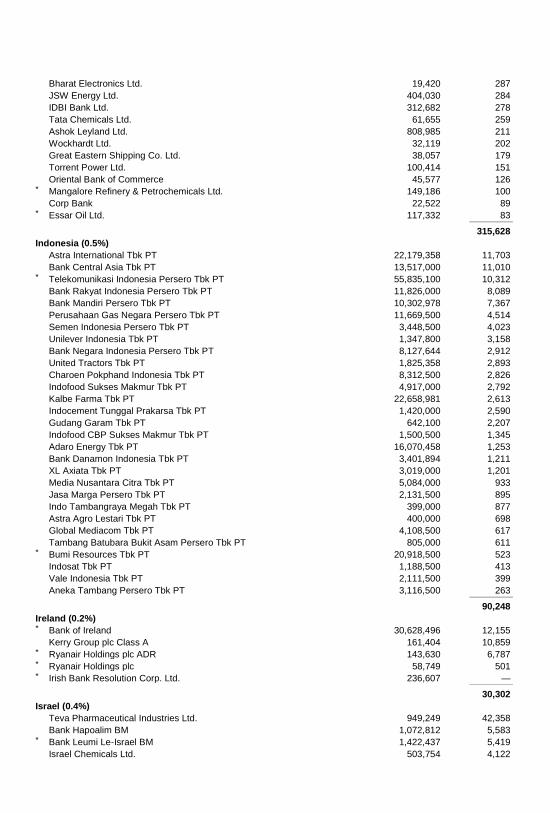
Bharat Electronics Ltd. 19,420 287 JSW Energy Ltd. 404,030 284 IDBI Bank Ltd. 312,682 278 Tata Chemicals Ltd. 61,655 259 Ashok Leyland Ltd. 808,985 211 Wockhardt Ltd. 32,119 202 Great Eastern Shipping Co. Ltd. 38,057 179 Torrent Power Ltd. 100,414 151 Oriental Bank of Commerce 45,577 126 * Mangalore Refinery & Petrochemicals Ltd. 149,186 100 Corp Bank 22,522 89 * Essar Oil Ltd. 117,332 83 _____________
315,628
Indonesia (0.5%)
Astra International Tbk PT 22,179,358 11,703 Bank Central Asia Tbk PT 13,517,000 11,010 * Telekomunikasi Indonesia Persero Tbk PT 55,835,100 10,312 Bank Rakyat Indonesia Persero Tbk PT 11,826,000 8,089 Bank Mandiri Persero Tbk PT 10,302,978 7,367 Perusahaan Gas Negara Persero Tbk PT 11,669,500 4,514 Semen Indonesia Persero Tbk PT 3,448,500 4,023 Unilever Indonesia Tbk PT 1,347,800 3,158 Bank Negara Indonesia Persero Tbk PT 8,127,644 2,912 United Tractors Tbk PT 1,825,358 2,893 Charoen Pokphand Indonesia Tbk PT 8,312,500 2,826 Indofood Sukses Makmur Tbk PT 4,917,000 2,792 Kalbe Farma Tbk PT 22,658,981 2,613 Indocement Tunggal Prakarsa Tbk PT 1,420,000 2,590 Gudang Garam Tbk PT 642,100 2,207 Indofood CBP Sukses Makmur Tbk PT 1,500,500 1,345 Adaro Energy Tbk PT 16,070,458 1,253 Bank Danamon Indonesia Tbk PT 3,401,894 1,211 XL Axiata Tbk PT 3,019,000 1,201 Media Nusantara Citra Tbk PT 5,084,000 933 Jasa Marga Persero Tbk PT 2,131,500 895 Indo Tambangraya Megah Tbk PT 399,000 877 Astra Agro Lestari Tbk PT 400,000 698 Global Mediacom Tbk PT 4,108,500 617 Tambang Batubara Bukit Asam Persero Tbk PT 805,000 611 * Bumi Resources Tbk PT 20,918,500 523 Indosat Tbk PT 1,188,500 413 Vale Indonesia Tbk PT 2,111,500 399 Aneka Tambang Persero Tbk PT 3,116,500 263 _____________
90,248
Ireland (0.2%)
* Bank of Ireland 30,628,496 12,155 Kerry Group plc Class A 161,404 10,859 * Ryanair Holdings plc ADR 143,630 6,787 * Ryanair Holdings plc 58,749 501 * Irish Bank Resolution Corp. Ltd. 236,607 — _____________
30,302
Israel (0.4%)
Teva Pharmaceutical Industries Ltd. 949,249 42,358 Bank Hapoalim BM 1,072,812 5,583 * Bank Leumi Le-Israel BM 1,422,437 5,419 Israel Chemicals Ltd. 503,754 4,122
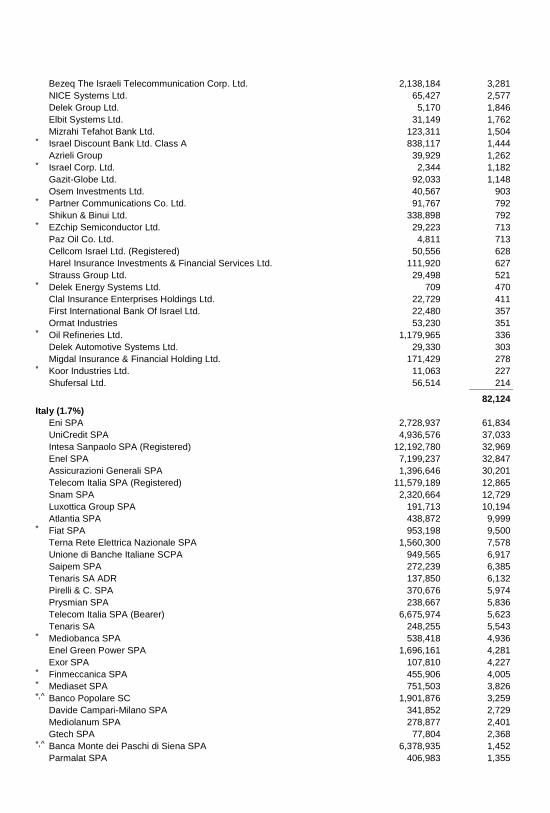
Bezeq The Israeli Telecommunication Corp. Ltd. 2,138,184 3,281 NICE Systems Ltd. 65,427 2,577 Delek Group Ltd. 5,170 1,846 Elbit Systems Ltd. 31,149 1,762 Mizrahi Tefahot Bank Ltd. 123,311 1,504 * Israel Discount Bank Ltd. Class A 838,117 1,444 Azrieli Group 39,929 1,262 * Israel Corp. Ltd. 2,344 1,182 Gazit-Globe Ltd. 92,033 1,148 Osem Investments Ltd. 40,567 903 * Partner Communications Co. Ltd. 91,767 792 Shikun & Binui Ltd. 338,898 792 * EZchip Semiconductor Ltd. 29,223 713 Paz Oil Co. Ltd. 4,811 713 Cellcom Israel Ltd. (Registered) 50,556 628 Harel Insurance Investments & Financial Services Ltd. 111,920 627 Strauss Group Ltd. 29,498 521 * Delek Energy Systems Ltd. 709 470 Clal Insurance Enterprises Holdings Ltd. 22,729 411 First International Bank Of Israel Ltd. 22,480 357 Ormat Industries 53,230 351 * Oil Refineries Ltd. 1,179,965 336 Delek Automotive Systems Ltd. 29,330 303 Migdal Insurance & Financial Holding Ltd. 171,429 278 * Koor Industries Ltd. 11,063 227 Shufersal Ltd. 56,514 214 _____________
82,124
Italy (1.7%)
Eni SPA 2,728,937 61,834 UniCredit SPA 4,936,576 37,033 Intesa Sanpaolo SPA (Registered) 12,192,780 32,969 Enel SPA 7,199,237 32,847 Assicurazioni Generali SPA 1,396,646 30,201 Telecom Italia SPA (Registered) 11,579,189 12,865 Snam SPA 2,320,664 12,729 Luxottica Group SPA 191,713 10,194 Atlantia SPA 438,872 9,999 * Fiat SPA 953,198 9,500 Terna Rete Elettrica Nazionale SPA 1,560,300 7,578 Unione di Banche Italiane SCPA 949,565 6,917 Saipem SPA 272,239 6,385 Tenaris SA ADR 137,850 6,132 Pirelli & C. SPA 370,676 5,974 Prysmian SPA 238,667 5,836 Telecom Italia SPA (Bearer) 6,675,974 5,623 Tenaris SA 248,255 5,543 * Mediobanca SPA 538,418 4,936 Enel Green Power SPA 1,696,161 4,281 Exor SPA 107,810 4,227 * Finmeccanica SPA 455,906 4,005 * Mediaset SPA 751,503 3,826 *,^ Banco Popolare SC 1,901,876 3,259 Davide Campari-Milano SPA 341,852 2,729 Mediolanum SPA 278,877 2,401 Gtech SPA 77,804 2,368 *,^ Banca Monte dei Paschi di Siena SPA 6,378,935 1,452 Parmalat SPA 406,983 1,355
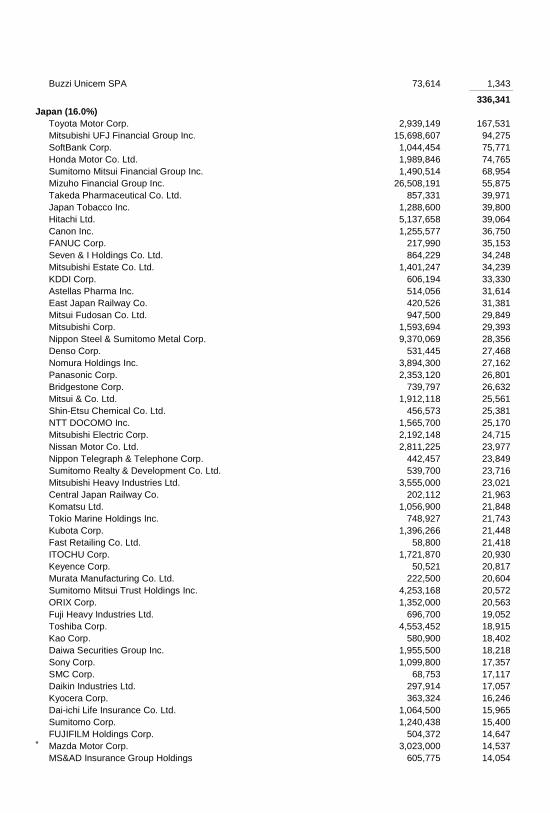
Buzzi Unicem SPA 73,614 1,343 _____________
336,341
Japan (16.0%)
Toyota Motor Corp. 2,939,149 167,531 Mitsubishi UFJ Financial Group Inc. 15,698,607 94,275 SoftBank Corp. 1,044,454 75,771 Honda Motor Co. Ltd. 1,989,846 74,765 Sumitomo Mitsui Financial Group Inc. 1,490,514 68,954 Mizuho Financial Group Inc. 26,508,191 55,875 Takeda Pharmaceutical Co. Ltd. 857,331 39,971 Japan Tobacco Inc. 1,288,600 39,800 Hitachi Ltd. 5,137,658 39,064 Canon Inc. 1,255,577 36,750 FANUC Corp. 217,990 35,153 Seven & I Holdings Co. Ltd. 864,229 34,248 Mitsubishi Estate Co. Ltd. 1,401,247 34,239 KDDI Corp. 606,194 33,330 Astellas Pharma Inc. 514,056 31,614 East Japan Railway Co. 420,526 31,381 Mitsui Fudosan Co. Ltd. 947,500 29,849 Mitsubishi Corp. 1,593,694 29,393 Nippon Steel & Sumitomo Metal Corp. 9,370,069 28,356 Denso Corp. 531,445 27,468 Nomura Holdings Inc. 3,894,300 27,162 Panasonic Corp. 2,353,120 26,801 Bridgestone Corp. 739,797 26,632 Mitsui & Co. Ltd. 1,912,118 25,561 Shin-Etsu Chemical Co. Ltd. 456,573 25,381 NTT DOCOMO Inc. 1,565,700 25,170 Mitsubishi Electric Corp. 2,192,148 24,715 Nissan Motor Co. Ltd. 2,811,225 23,977 Nippon Telegraph & Telephone Corp. 442,457 23,849 Sumitomo Realty & Development Co. Ltd. 539,700 23,716 Mitsubishi Heavy Industries Ltd. 3,555,000 23,021 Central Japan Railway Co. 202,112 21,963 Komatsu Ltd. 1,056,900 21,848 Tokio Marine Holdings Inc. 748,927 21,743 Kubota Corp. 1,396,266 21,448 Fast Retailing Co. Ltd. 58,800 21,418 ITOCHU Corp. 1,721,870 20,930 Keyence Corp. 50,521 20,817 Murata Manufacturing Co. Ltd. 222,500 20,604 Sumitomo Mitsui Trust Holdings Inc. 4,253,168 20,572 ORIX Corp. 1,352,000 20,563 Fuji Heavy Industries Ltd. 696,700 19,052 Toshiba Corp. 4,553,452 18,915 Kao Corp. 580,900 18,402 Daiwa Securities Group Inc. 1,955,500 18,218 Sony Corp. 1,099,800 17,357 SMC Corp. 68,753 17,117 Daikin Industries Ltd. 297,914 17,057 Kyocera Corp. 363,324 16,246 Dai-ichi Life Insurance Co. Ltd. 1,064,500 15,965 Sumitomo Corp. 1,240,438 15,400 FUJIFILM Holdings Corp. 504,372 14,647 * Mazda Motor Corp. 3,023,000 14,537 MS&AD Insurance Group Holdings 605,775 14,054
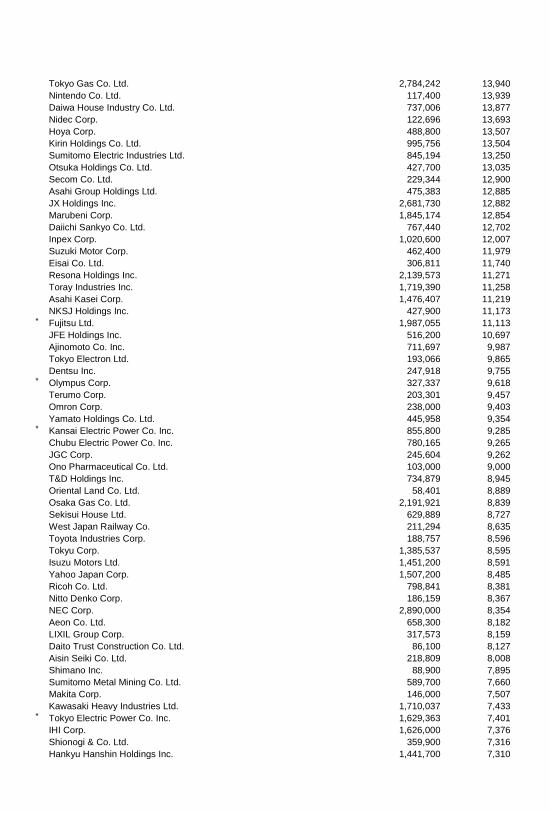
Tokyo Gas Co. Ltd. 2,784,242 13,940 Nintendo Co. Ltd. 117,400 13,939 Daiwa House Industry Co. Ltd. 737,006 13,877 Nidec Corp. 122,696 13,693 Hoya Corp. 488,800 13,507 Kirin Holdings Co. Ltd. 995,756 13,504 Sumitomo Electric Industries Ltd. 845,194 13,250 Otsuka Holdings Co. Ltd. 427,700 13,035 Secom Co. Ltd. 229,344 12,900 Asahi Group Holdings Ltd. 475,383 12,885 JX Holdings Inc. 2,681,730 12,882 Marubeni Corp. 1,845,174 12,854 Daiichi Sankyo Co. Ltd. 767,440 12,702 Inpex Corp. 1,020,600 12,007 Suzuki Motor Corp. 462,400 11,979 Eisai Co. Ltd. 306,811 11,740 Resona Holdings Inc. 2,139,573 11,271 Toray Industries Inc. 1,719,390 11,258 Asahi Kasei Corp. 1,476,407 11,219 NKSJ Holdings Inc. 427,900 11,173 * Fujitsu Ltd. 1,987,055 11,113 JFE Holdings Inc. 516,200 10,697 Ajinomoto Co. Inc. 711,697 9,987 Tokyo Electron Ltd. 193,066 9,865 Dentsu Inc. 247,918 9,755 * Olympus Corp. 327,337 9,618 Terumo Corp. 203,301 9,457 Omron Corp. 238,000 9,403 Yamato Holdings Co. Ltd. 445,958 9,354 * Kansai Electric Power Co. Inc. 855,800 9,285 Chubu Electric Power Co. Inc. 780,165 9,265 JGC Corp. 245,604 9,262 Ono Pharmaceutical Co. Ltd. 103,000 9,000 T&D Holdings Inc. 734,879 8,945 Oriental Land Co. Ltd. 58,401 8,889 Osaka Gas Co. Ltd. 2,191,921 8,839 Sekisui House Ltd. 629,889 8,727 West Japan Railway Co. 211,294 8,635 Toyota Industries Corp. 188,757 8,596 Tokyu Corp. 1,385,537 8,595 Isuzu Motors Ltd. 1,451,200 8,591 Yahoo Japan Corp. 1,507,200 8,485 Ricoh Co. Ltd. 798,841 8,381 Nitto Denko Corp. 186,159 8,367 NEC Corp. 2,890,000 8,354 Aeon Co. Ltd. 658,300 8,182 LIXIL Group Corp. 317,573 8,159 Daito Trust Construction Co. Ltd. 86,100 8,127 Aisin Seiki Co. Ltd. 218,809 8,008 Shimano Inc. 88,900 7,895 Sumitomo Metal Mining Co. Ltd. 589,700 7,660 Makita Corp. 146,000 7,507 Kawasaki Heavy Industries Ltd. 1,710,037 7,433 * Tokyo Electric Power Co. Inc. 1,629,363 7,401 IHI Corp. 1,626,000 7,376 Shionogi & Co. Ltd. 359,900 7,316 Hankyu Hanshin Holdings Inc. 1,441,700 7,310
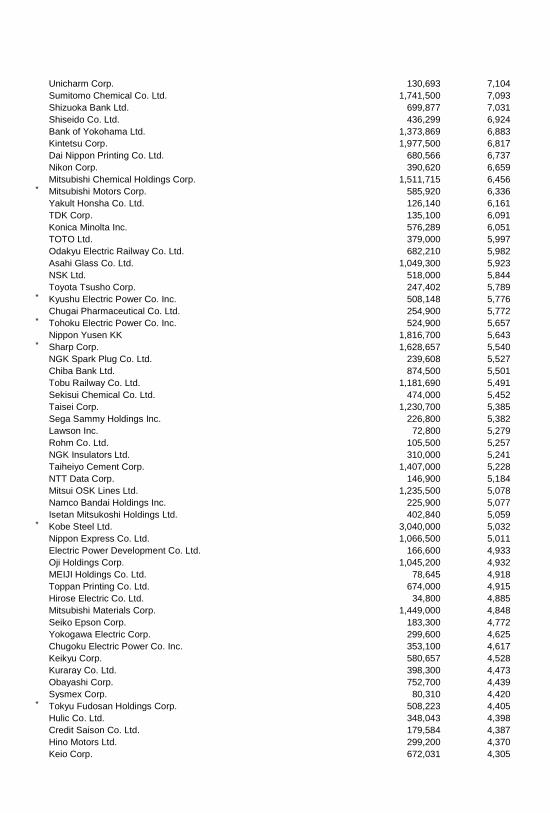
Unicharm Corp. 130,693 7,104 Sumitomo Chemical Co. Ltd. 1,741,500 7,093 Shizuoka Bank Ltd. 699,877 7,031 Shiseido Co. Ltd. 436,299 6,924 Bank of Yokohama Ltd. 1,373,869 6,883 Kintetsu Corp. 1,977,500 6,817 Dai Nippon Printing Co. Ltd. 680,566 6,737 Nikon Corp. 390,620 6,659 Mitsubishi Chemical Holdings Corp. 1,511,715 6,456 * Mitsubishi Motors Corp. 585,920 6,336 Yakult Honsha Co. Ltd. 126,140 6,161 TDK Corp. 135,100 6,091 Konica Minolta Inc. 576,289 6,051 TOTO Ltd. 379,000 5,997 Odakyu Electric Railway Co. Ltd. 682,210 5,982 Asahi Glass Co. Ltd. 1,049,300 5,923 NSK Ltd. 518,000 5,844 Toyota Tsusho Corp. 247,402 5,789 * Kyushu Electric Power Co. Inc. 508,148 5,776 Chugai Pharmaceutical Co. Ltd. 254,900 5,772 * Tohoku Electric Power Co. Inc. 524,900 5,657 Nippon Yusen KK 1,816,700 5,643 * Sharp Corp. 1,628,657 5,540 NGK Spark Plug Co. Ltd. 239,608 5,527 Chiba Bank Ltd. 874,500 5,501 Tobu Railway Co. Ltd. 1,181,690 5,491 Sekisui Chemical Co. Ltd. 474,000 5,452 Taisei Corp. 1,230,700 5,385 Sega Sammy Holdings Inc. 226,800 5,382 Lawson Inc. 72,800 5,279 Rohm Co. Ltd. 105,500 5,257 NGK Insulators Ltd. 310,000 5,241 Taiheiyo Cement Corp. 1,407,000 5,228 NTT Data Corp. 146,900 5,184 Mitsui OSK Lines Ltd. 1,235,500 5,078 Namco Bandai Holdings Inc. 225,900 5,077 Isetan Mitsukoshi Holdings Ltd. 402,840 5,059 * Kobe Steel Ltd. 3,040,000 5,032 Nippon Express Co. Ltd. 1,066,500 5,011 Electric Power Development Co. Ltd. 166,600 4,933 Oji Holdings Corp. 1,045,200 4,932 MEIJI Holdings Co. Ltd. 78,645 4,918 Toppan Printing Co. Ltd. 674,000 4,915 Hirose Electric Co. Ltd. 34,800 4,885 Mitsubishi Materials Corp. 1,449,000 4,848 Seiko Epson Corp. 183,300 4,772 Yokogawa Electric Corp. 299,600 4,625 Chugoku Electric Power Co. Inc. 353,100 4,617 Keikyu Corp. 580,657 4,528 Kuraray Co. Ltd. 398,300 4,473 Obayashi Corp. 752,700 4,439 Sysmex Corp. 80,310 4,420 * Tokyu Fudosan Holdings Corp. 508,223 4,405 Hulic Co. Ltd. 348,043 4,398 Credit Saison Co. Ltd. 179,584 4,387 Hino Motors Ltd. 299,200 4,370 Keio Corp. 672,031 4,305
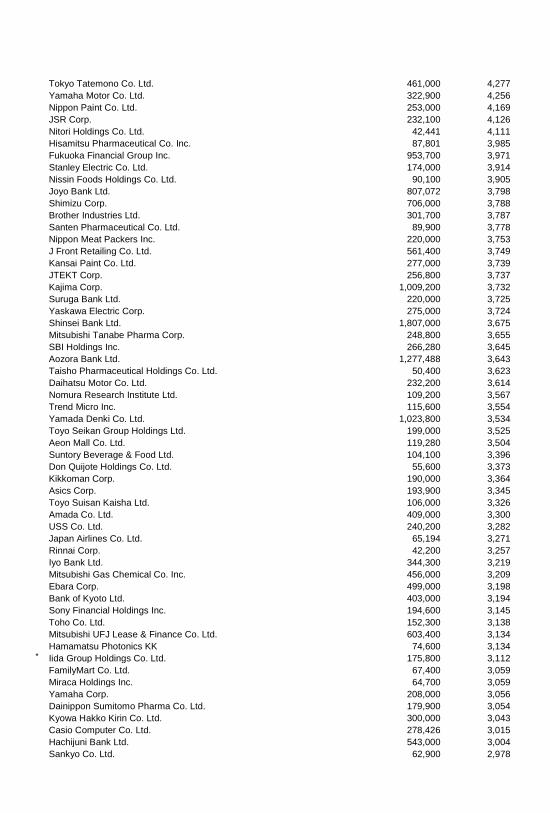
Tokyo Tatemono Co. Ltd. 461,000 4,277 Yamaha Motor Co. Ltd. 322,900 4,256 Nippon Paint Co. Ltd. 253,000 4,169 JSR Corp. 232,100 4,126 Nitori Holdings Co. Ltd. 42,441 4,111 Hisamitsu Pharmaceutical Co. Inc. 87,801 3,985 Fukuoka Financial Group Inc. 953,700 3,971 Stanley Electric Co. Ltd. 174,000 3,914 Nissin Foods Holdings Co. Ltd. 90,100 3,905 Joyo Bank Ltd. 807,072 3,798 Shimizu Corp. 706,000 3,788 Brother Industries Ltd. 301,700 3,787 Santen Pharmaceutical Co. Ltd. 89,900 3,778 Nippon Meat Packers Inc. 220,000 3,753 J Front Retailing Co. Ltd. 561,400 3,749 Kansai Paint Co. Ltd. 277,000 3,739 JTEKT Corp. 256,800 3,737 Kajima Corp. 1,009,200 3,732 Suruga Bank Ltd. 220,000 3,725 Yaskawa Electric Corp. 275,000 3,724 Shinsei Bank Ltd. 1,807,000 3,675 Mitsubishi Tanabe Pharma Corp. 248,800 3,655 SBI Holdings Inc. 266,280 3,645 Aozora Bank Ltd. 1,277,488 3,643 Taisho Pharmaceutical Holdings Co. Ltd. 50,400 3,623 Daihatsu Motor Co. Ltd. 232,200 3,614 Nomura Research Institute Ltd. 109,200 3,567 Trend Micro Inc. 115,600 3,554 Yamada Denki Co. Ltd. 1,023,800 3,534 Toyo Seikan Group Holdings Ltd. 199,000 3,525 Aeon Mall Co. Ltd. 119,280 3,504 Suntory Beverage & Food Ltd. 104,100 3,396 Don Quijote Holdings Co. Ltd. 55,600 3,373 Kikkoman Corp. 190,000 3,364 Asics Corp. 193,900 3,345 Toyo Suisan Kaisha Ltd. 106,000 3,326 Amada Co. Ltd. 409,000 3,300 USS Co. Ltd. 240,200 3,282 Japan Airlines Co. Ltd. 65,194 3,271 Rinnai Corp. 42,200 3,257 Iyo Bank Ltd. 344,300 3,219 Mitsubishi Gas Chemical Co. Inc. 456,000 3,209 Ebara Corp. 499,000 3,198 Bank of Kyoto Ltd. 403,000 3,194 Sony Financial Holdings Inc. 194,600 3,145 Toho Co. Ltd. 152,300 3,138 Mitsubishi UFJ Lease & Finance Co. Ltd. 603,400 3,134 Hamamatsu Photonics KK 74,600 3,134 * Iida Group Holdings Co. Ltd. 175,800 3,112 FamilyMart Co. Ltd. 67,400 3,059 Miraca Holdings Inc. 64,700 3,059 Yamaha Corp. 208,000 3,056 Dainippon Sumitomo Pharma Co. Ltd. 179,900 3,054 Kyowa Hakko Kirin Co. Ltd. 300,000 3,043 Casio Computer Co. Ltd. 278,426 3,015 Hachijuni Bank Ltd. 543,000 3,004 Sankyo Co. Ltd. 62,900 2,978
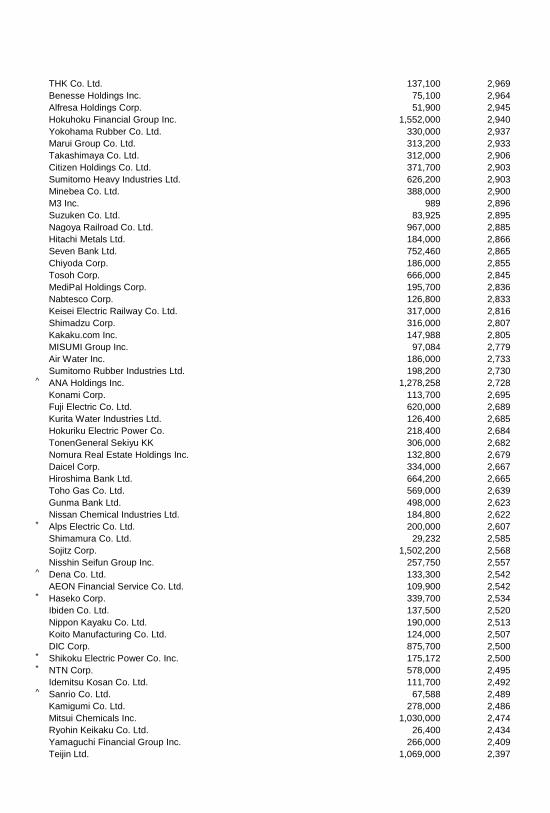
THK Co. Ltd. 137,100 2,969 Benesse Holdings Inc. 75,100 2,964 Alfresa Holdings Corp. 51,900 2,945 Hokuhoku Financial Group Inc. 1,552,000 2,940 Yokohama Rubber Co. Ltd. 330,000 2,937 Marui Group Co. Ltd. 313,200 2,933 Takashimaya Co. Ltd. 312,000 2,906 Citizen Holdings Co. Ltd. 371,700 2,903 Sumitomo Heavy Industries Ltd. 626,200 2,903 Minebea Co. Ltd. 388,000 2,900 M3 Inc. 989 2,896 Suzuken Co. Ltd. 83,925 2,895 Nagoya Railroad Co. Ltd. 967,000 2,885 Hitachi Metals Ltd. 184,000 2,866 Seven Bank Ltd. 752,460 2,865 Chiyoda Corp. 186,000 2,855 Tosoh Corp. 666,000 2,845 MediPal Holdings Corp. 195,700 2,836 Nabtesco Corp. 126,800 2,833 Keisei Electric Railway Co. Ltd. 317,000 2,816 Shimadzu Corp. 316,000 2,807 Kakaku.com Inc. 147,988 2,805 MISUMI Group Inc. 97,084 2,779 Air Water Inc. 186,000 2,733 Sumitomo Rubber Industries Ltd. 198,200 2,730 ^ ANA Holdings Inc. 1,278,258 2,728 Konami Corp. 113,700 2,695 Fuji Electric Co. Ltd. 620,000 2,689 Kurita Water Industries Ltd. 126,400 2,685 Hokuriku Electric Power Co. 218,400 2,684 TonenGeneral Sekiyu KK 306,000 2,682 Nomura Real Estate Holdings Inc. 132,800 2,679 Daicel Corp. 334,000 2,667 Hiroshima Bank Ltd. 664,200 2,665 Toho Gas Co. Ltd. 569,000 2,639 Gunma Bank Ltd. 498,000 2,623 Nissan Chemical Industries Ltd. 184,800 2,622 * Alps Electric Co. Ltd. 200,000 2,607 Shimamura Co. Ltd. 29,232 2,585 Sojitz Corp. 1,502,200 2,568 Nisshin Seifun Group Inc. 257,750 2,557 ^ Dena Co. Ltd. 133,300 2,542 AEON Financial Service Co. Ltd. 109,900 2,542 * Haseko Corp. 339,700 2,534 Ibiden Co. Ltd. 137,500 2,520 Nippon Kayaku Co. Ltd. 190,000 2,513 Koito Manufacturing Co. Ltd. 124,000 2,507 DIC Corp. 875,700 2,500 * Shikoku Electric Power Co. Inc. 175,172 2,500 * NTN Corp. 578,000 2,495 Idemitsu Kosan Co. Ltd. 111,700 2,492 ^ Sanrio Co. Ltd. 67,588 2,489 Kamigumi Co. Ltd. 278,000 2,486 Mitsui Chemicals Inc. 1,030,000 2,474 Ryohin Keikaku Co. Ltd. 26,400 2,434 Yamaguchi Financial Group Inc. 266,000 2,409 Teijin Ltd. 1,069,000 2,397
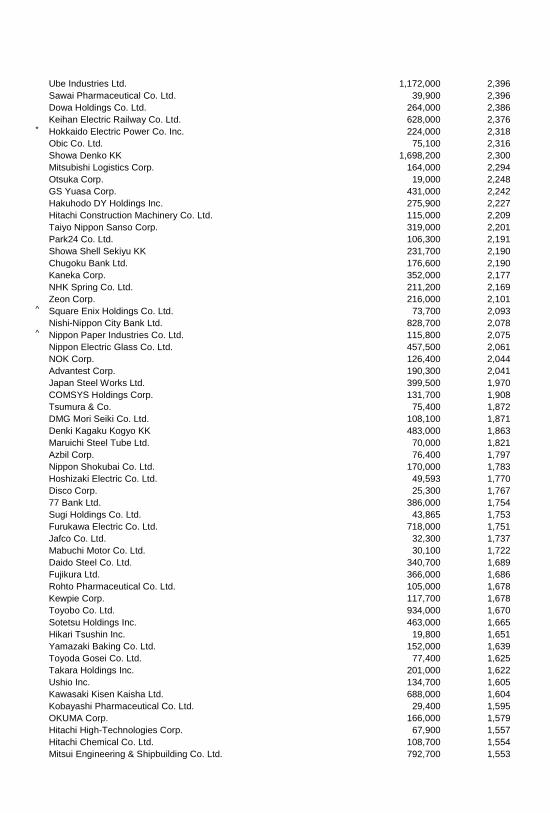
Ube Industries Ltd. 1,172,000 2,396 Sawai Pharmaceutical Co. Ltd. 39,900 2,396 Dowa Holdings Co. Ltd. 264,000 2,386 Keihan Electric Railway Co. Ltd. 628,000 2,376 * Hokkaido Electric Power Co. Inc. 224,000 2,318 Obic Co. Ltd. 75,100 2,316 Showa Denko KK 1,698,200 2,300 Mitsubishi Logistics Corp. 164,000 2,294 Otsuka Corp. 19,000 2,248 GS Yuasa Corp. 431,000 2,242 Hakuhodo DY Holdings Inc. 275,900 2,227 Hitachi Construction Machinery Co. Ltd. 115,000 2,209 Taiyo Nippon Sanso Corp. 319,000 2,201 Park24 Co. Ltd. 106,300 2,191 Showa Shell Sekiyu KK 231,700 2,190 Chugoku Bank Ltd. 176,600 2,190 Kaneka Corp. 352,000 2,177 NHK Spring Co. Ltd. 211,200 2,169 Zeon Corp. 216,000 2,101 ^ Square Enix Holdings Co. Ltd. 73,700 2,093 Nishi-Nippon City Bank Ltd. 828,700 2,078 ^ Nippon Paper Industries Co. Ltd. 115,800 2,075 Nippon Electric Glass Co. Ltd. 457,500 2,061 NOK Corp. 126,400 2,044 Advantest Corp. 190,300 2,041 Japan Steel Works Ltd. 399,500 1,970 COMSYS Holdings Corp. 131,700 1,908 Tsumura & Co. 75,400 1,872 DMG Mori Seiki Co. Ltd. 108,100 1,871 Denki Kagaku Kogyo KK 483,000 1,863 Maruichi Steel Tube Ltd. 70,000 1,821 Azbil Corp. 76,400 1,797 Nippon Shokubai Co. Ltd. 170,000 1,783 Hoshizaki Electric Co. Ltd. 49,593 1,770 Disco Corp. 25,300 1,767 77 Bank Ltd. 386,000 1,754 Sugi Holdings Co. Ltd. 43,865 1,753 Furukawa Electric Co. Ltd. 718,000 1,751 Jafco Co. Ltd. 32,300 1,737 Mabuchi Motor Co. Ltd. 30,100 1,722 Daido Steel Co. Ltd. 340,700 1,689 Fujikura Ltd. 366,000 1,686 Rohto Pharmaceutical Co. Ltd. 105,000 1,678 Kewpie Corp. 117,700 1,678 Toyobo Co. Ltd. 934,000 1,670 Sotetsu Holdings Inc. 463,000 1,665 Hikari Tsushin Inc. 19,800 1,651 Yamazaki Baking Co. Ltd. 152,000 1,639 Toyoda Gosei Co. Ltd. 77,400 1,625 Takara Holdings Inc. 201,000 1,622 Ushio Inc. 134,700 1,605 Kawasaki Kisen Kaisha Ltd. 688,000 1,604 Kobayashi Pharmaceutical Co. Ltd. 29,400 1,595 OKUMA Corp. 166,000 1,579 Hitachi High-Technologies Corp. 67,900 1,557 Hitachi Chemical Co. Ltd. 108,700 1,554 Mitsui Engineering & Shipbuilding Co. Ltd. 792,700 1,553
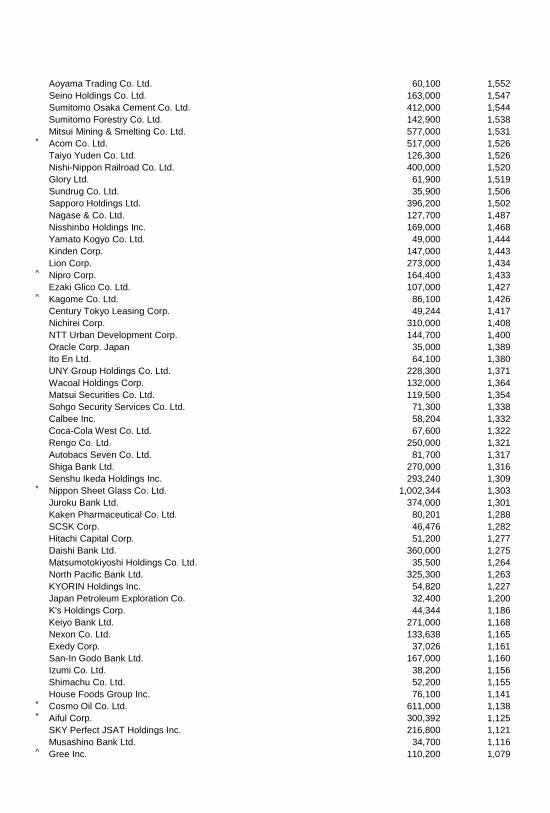
Aoyama Trading Co. Ltd. 60,100 1,552 Seino Holdings Co. Ltd. 163,000 1,547 Sumitomo Osaka Cement Co. Ltd. 412,000 1,544 Sumitomo Forestry Co. Ltd. 142,900 1,538 Mitsui Mining & Smelting Co. Ltd. 577,000 1,531 * Acom Co. Ltd. 517,000 1,526 Taiyo Yuden Co. Ltd. 126,300 1,526 Nishi-Nippon Railroad Co. Ltd. 400,000 1,520 Glory Ltd. 61,900 1,519 Sundrug Co. Ltd. 35,900 1,506 Sapporo Holdings Ltd. 396,200 1,502 Nagase & Co. Ltd. 127,700 1,487 Nisshinbo Holdings Inc. 169,000 1,468 Yamato Kogyo Co. Ltd. 49,000 1,444 Kinden Corp. 147,000 1,443 Lion Corp. 273,000 1,434 ^ Nipro Corp. 164,400 1,433 Ezaki Glico Co. Ltd. 107,000 1,427 ^ Kagome Co. Ltd. 86,100 1,426 Century Tokyo Leasing Corp. 49,244 1,417 Nichirei Corp. 310,000 1,408 NTT Urban Development Corp. 144,700 1,400 Oracle Corp. Japan 35,000 1,389 Ito En Ltd. 64,100 1,380 UNY Group Holdings Co. Ltd. 228,300 1,371 Wacoal Holdings Corp. 132,000 1,364 Matsui Securities Co. Ltd. 119,500 1,354 Sohgo Security Services Co. Ltd. 71,300 1,338 Calbee Inc. 58,204 1,332 Coca-Cola West Co. Ltd. 67,600 1,322 Rengo Co. Ltd. 250,000 1,321 Autobacs Seven Co. Ltd. 81,700 1,317 Shiga Bank Ltd. 270,000 1,316 Senshu Ikeda Holdings Inc. 293,240 1,309 * Nippon Sheet Glass Co. Ltd. 1,002,344 1,303 Juroku Bank Ltd. 374,000 1,301 Kaken Pharmaceutical Co. Ltd. 80,201 1,288 SCSK Corp. 46,476 1,282 Hitachi Capital Corp. 51,200 1,277 Daishi Bank Ltd. 360,000 1,275 Matsumotokiyoshi Holdings Co. Ltd. 35,500 1,264 North Pacific Bank Ltd. 325,300 1,263 KYORIN Holdings Inc. 54,820 1,227 Japan Petroleum Exploration Co. 32,400 1,200 K's Holdings Corp. 44,344 1,186 Keiyo Bank Ltd. 271,000 1,168 Nexon Co. Ltd. 133,638 1,165 Exedy Corp. 37,026 1,161 San-In Godo Bank Ltd. 167,000 1,160 Izumi Co. Ltd. 38,200 1,156 Shimachu Co. Ltd. 52,200 1,155 House Foods Group Inc. 76,100 1,141 * Cosmo Oil Co. Ltd. 611,000 1,138 * Aiful Corp. 300,392 1,125 SKY Perfect JSAT Holdings Inc. 216,800 1,121 Musashino Bank Ltd. 34,700 1,116 ^ Gree Inc. 110,200 1,079
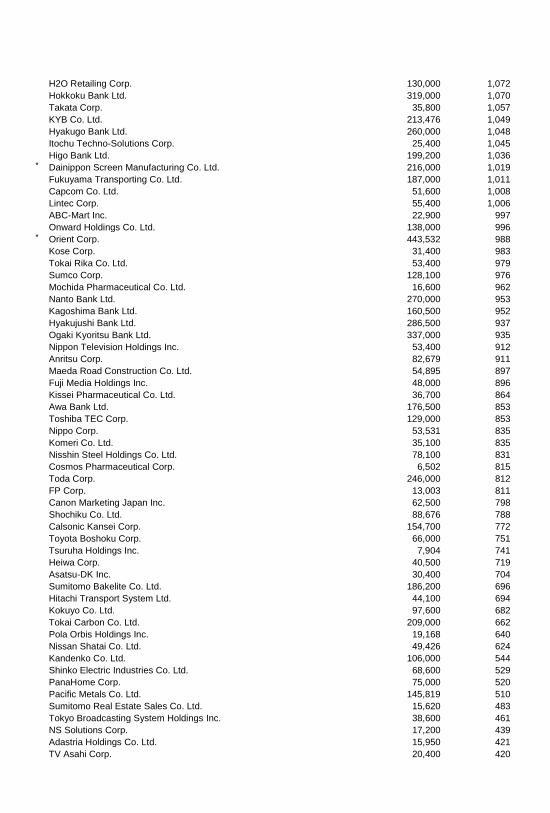
H2O Retailing Corp. 130,000 1,072 Hokkoku Bank Ltd. 319,000 1,070 Takata Corp. 35,800 1,057 KYB Co. Ltd. 213,476 1,049 Hyakugo Bank Ltd. 260,000 1,048 Itochu Techno-Solutions Corp. 25,400 1,045 Higo Bank Ltd. 199,200 1,036 * Dainippon Screen Manufacturing Co. Ltd. 216,000 1,019 Fukuyama Transporting Co. Ltd. 187,000 1,011 Capcom Co. Ltd. 51,600 1,008 Lintec Corp. 55,400 1,006 ABC-Mart Inc. 22,900 997 Onward Holdings Co. Ltd. 138,000 996 * Orient Corp. 443,532 988 Kose Corp. 31,400 983 Tokai Rika Co. Ltd. 53,400 979 Sumco Corp. 128,100 976 Mochida Pharmaceutical Co. Ltd. 16,600 962 Nanto Bank Ltd. 270,000 953 Kagoshima Bank Ltd. 160,500 952 Hyakujushi Bank Ltd. 286,500 937 Ogaki Kyoritsu Bank Ltd. 337,000 935 Nippon Television Holdings Inc. 53,400 912 Anritsu Corp. 82,679 911 Maeda Road Construction Co. Ltd. 54,895 897 Fuji Media Holdings Inc. 48,000 896 Kissei Pharmaceutical Co. Ltd. 36,700 864 Awa Bank Ltd. 176,500 853 Toshiba TEC Corp. 129,000 853 Nippo Corp. 53,531 835 Komeri Co. Ltd. 35,100 835 Nisshin Steel Holdings Co. Ltd. 78,100 831 Cosmos Pharmaceutical Corp. 6,502 815 Toda Corp. 246,000 812 FP Corp. 13,003 811 Canon Marketing Japan Inc. 62,500 798 Shochiku Co. Ltd. 88,676 788 Calsonic Kansei Corp. 154,700 772 Toyota Boshoku Corp. 66,000 751 Tsuruha Holdings Inc. 7,904 741 Heiwa Corp. 40,500 719 Asatsu-DK Inc. 30,400 704 Sumitomo Bakelite Co. Ltd. 186,200 696 Hitachi Transport System Ltd. 44,100 694 Kokuyo Co. Ltd. 97,600 682 Tokai Carbon Co. Ltd. 209,000 662 Pola Orbis Holdings Inc. 19,168 640 Nissan Shatai Co. Ltd. 49,426 624 Kandenko Co. Ltd. 106,000 544 Shinko Electric Industries Co. Ltd. 68,600 529 PanaHome Corp. 75,000 520 Pacific Metals Co. Ltd. 145,819 510 Sumitomo Real Estate Sales Co. Ltd. 15,620 483 Tokyo Broadcasting System Holdings Inc. 38,600 461 NS Solutions Corp. 17,200 439 Adastria Holdings Co. Ltd. 15,950 421 TV Asahi Corp. 20,400 420

Tokai Rubber Industries Ltd. 38,200 394 Toppan Forms Co. Ltd. 44,600 385 Hitachi Koki Co. Ltd. 51,600 365 Kansai Urban Banking Corp. 299,000 360 Mitsubishi Shokuhin Co. Ltd. 14,302 341 ^ OSAKA Titanium Technologies Co. Ltd. 18,700 298 _____________
3,189,217
Luxembourg (0.0%)
Samsonite International SA 1,376,120 3,751
Malaysia (0.8%)
Malayan Banking Bhd. 4,768,674 13,701 CIMB Group Holdings Bhd. 5,399,800 11,140 Axiata Group Bhd. 5,519,924 10,815 Sime Darby Bhd. 3,455,297 9,262 Genting Bhd. 2,455,600 7,636 Public Bank Bhd. (Foreign) 1,148,769 6,557 Petronas Chemicals Group Bhd. 3,191,668 6,366 Petronas Gas Bhd. 876,800 6,106 Maxis Bhd. 2,924,600 6,084 DiGi.Com Bhd. 4,165,966 5,847 Tenaga Nasional Bhd. 1,555,000 5,520 IOI Corp. Bhd. 4,159,465 5,228 * Sapurakencana Petroleum Bhd. 3,783,900 4,948 Genting Malaysia Bhd. 3,326,100 4,331 AMMB Holdings Bhd. 1,959,700 4,295 Kuala Lumpur Kepong Bhd. 585,500 4,062 * IHH Healthcare Bhd. 3,022,800 3,319 Petronas Dagangan Bhd. 334,300 3,054 PPB Group Bhd. 650,000 2,994 British American Tobacco Malaysia Bhd. 160,600 2,911 Gamuda Bhd. 2,176,200 2,907 YTL Corp. Bhd. 5,851,253 2,706 Felda Global Ventures Holdings Bhd. 2,054,700 2,679 Hong Leong Bank Bhd. 627,060 2,638 UMW Holdings Bhd. 745,200 2,632 IJM Corp. Bhd. 1,315,620 2,324 * YTL Power International Bhd. 3,674,902 2,054 Telekom Malaysia Bhd. 1,172,600 1,935 Bumi Armada Bhd. 1,492,400 1,798 RHB Capital Bhd. 760,700 1,744 Alliance Financial Group Bhd. 1,194,000 1,661 * IOI Properties Group Sdn Bhd. 2,005,332 1,618 2 Astro Malaysia Holdings Bhd. 1,764,868 1,550 Lafarge Malaysia Bhd. 488,410 1,238 Berjaya Sports Toto Bhd. 939,873 1,138 Hong Leong Financial Group Bhd. 228,000 1,078 UEM Sunrise Bhd. 1,652,900 1,019 AirAsia Bhd. 1,372,200 927 SP Setia Bhd. 908,100 781 MMC Corp. Bhd. 887,900 741 Parkson Holdings Bhd. 599,456 524 Malaysia Marine and Heavy Engineering Holdings Bhd. 445,200 483 Public Bank Bhd. (Local) 28,231 161 _____________
160,512
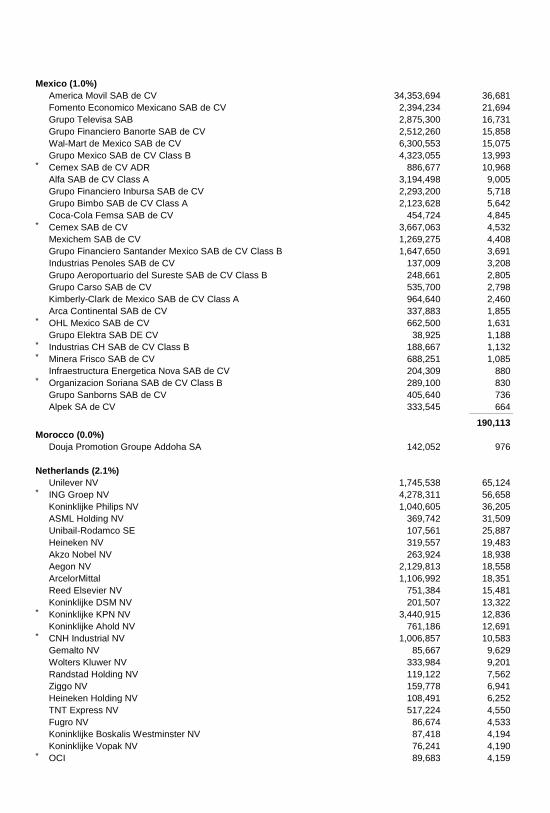
Mexico (1.0%)
America Movil SAB de CV 34,353,694 36,681 Fomento Economico Mexicano SAB de CV 2,394,234 21,694 Grupo Televisa SAB 2,875,300 16,731 Grupo Financiero Banorte SAB de CV 2,512,260 15,858 Wal-Mart de Mexico SAB de CV 6,300,553 15,075 Grupo Mexico SAB de CV Class B 4,323,055 13,993 * Cemex SAB de CV ADR 886,677 10,968 Alfa SAB de CV Class A 3,194,498 9,005 Grupo Financiero Inbursa SAB de CV 2,293,200 5,718 Grupo Bimbo SAB de CV Class A 2,123,628 5,642 Coca-Cola Femsa SAB de CV 454,724 4,845 * Cemex SAB de CV 3,667,063 4,532 Mexichem SAB de CV 1,269,275 4,408 Grupo Financiero Santander Mexico SAB de CV Class B 1,647,650 3,691 Industrias Penoles SAB de CV 137,009 3,208 Grupo Aeroportuario del Sureste SAB de CV Class B 248,661 2,805 Grupo Carso SAB de CV 535,700 2,798 Kimberly-Clark de Mexico SAB de CV Class A 964,640 2,460 Arca Continental SAB de CV 337,883 1,855 * OHL Mexico SAB de CV 662,500 1,631 Grupo Elektra SAB DE CV 38,925 1,188 * Industrias CH SAB de CV Class B 188,667 1,132 * Minera Frisco SAB de CV 688,251 1,085 Infraestructura Energetica Nova SAB de CV 204,309 880 * Organizacion Soriana SAB de CV Class B 289,100 830 Grupo Sanborns SAB de CV 405,640 736 Alpek SA de CV 333,545 664 _____________
190,113
Morocco (0.0%)
Douja Promotion Groupe Addoha SA 142,052 976
Netherlands (2.1%)
Unilever NV 1,745,538 65,124 * ING Groep NV 4,278,311 56,658 Koninklijke Philips NV 1,040,605 36,205 ASML Holding NV 369,742 31,509 Unibail-Rodamco SE 107,561 25,887 Heineken NV 319,557 19,483 Akzo Nobel NV 263,924 18,938 Aegon NV 2,129,813 18,558 ArcelorMittal 1,106,992 18,351 Reed Elsevier NV 751,384 15,481 Koninklijke DSM NV 201,507 13,322 * Koninklijke KPN NV 3,440,915 12,836 Koninklijke Ahold NV 761,186 12,691 * CNH Industrial NV 1,006,857 10,583 Gemalto NV 85,667 9,629 Wolters Kluwer NV 333,984 9,201 Randstad Holding NV 119,122 7,562 Ziggo NV 159,778 6,941 Heineken Holding NV 108,491 6,252 TNT Express NV 517,224 4,550 Fugro NV 86,674 4,533 Koninklijke Boskalis Westminster NV 87,418 4,194 Koninklijke Vopak NV 76,241 4,190 * OCI 89,683 4,159
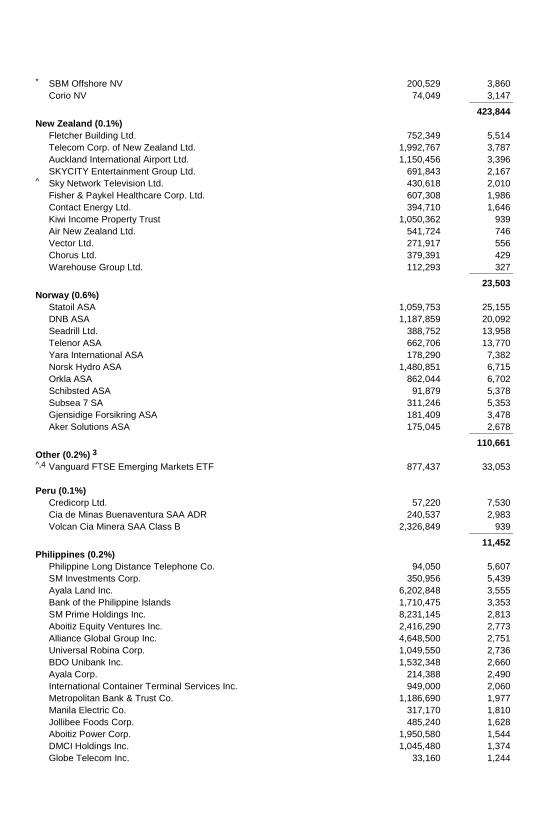
* SBM Offshore NV 200,529 3,860 Corio NV 74,049 3,147 _____________
423,844
New Zealand (0.1%)
Fletcher Building Ltd. 752,349 5,514 Telecom Corp. of New Zealand Ltd. 1,992,767 3,787 Auckland International Airport Ltd. 1,150,456 3,396 SKYCITY Entertainment Group Ltd. 691,843 2,167 ^ Sky Network Television Ltd. 430,618 2,010 Fisher & Paykel Healthcare Corp. Ltd. 607,308 1,986 Contact Energy Ltd. 394,710 1,646 Kiwi Income Property Trust 1,050,362 939 Air New Zealand Ltd. 541,724 746 Vector Ltd. 271,917 556 Chorus Ltd. 379,391 429 Warehouse Group Ltd. 112,293 327 _____________
23,503
Norway (0.6%)
Statoil ASA 1,059,753 25,155 DNB ASA 1,187,859 20,092 Seadrill Ltd. 388,752 13,958 Telenor ASA 662,706 13,770 Yara International ASA 178,290 7,382 Norsk Hydro ASA 1,480,851 6,715 Orkla ASA 862,044 6,702 Schibsted ASA 91,879 5,378 Subsea 7 SA 311,246 5,353 Gjensidige Forsikring ASA 181,409 3,478 Aker Solutions ASA 175,045 2,678 _____________
110,661
Other (0.2%) 3
^,4 Vanguard FTSE Emerging Markets ETF 877,437 33,053
Peru (0.1%)
Credicorp Ltd. 57,220 7,530 Cia de Minas Buenaventura SAA ADR 240,537 2,983 Volcan Cia Minera SAA Class B 2,326,849 939 _____________
11,452
Philippines (0.2%)
Philippine Long Distance Telephone Co. 94,050 5,607 SM Investments Corp. 350,956 5,439 Ayala Land Inc. 6,202,848 3,555 Bank of the Philippine Islands 1,710,475 3,353 SM Prime Holdings Inc. 8,231,145 2,813 Aboitiz Equity Ventures Inc. 2,416,290 2,773 Alliance Global Group Inc. 4,648,500 2,751 Universal Robina Corp. 1,049,550 2,736 BDO Unibank Inc. 1,532,348 2,660 Ayala Corp. 214,388 2,490 International Container Terminal Services Inc. 949,000 2,060 Metropolitan Bank & Trust Co. 1,186,690 1,977 Manila Electric Co. 317,170 1,810 Jollibee Foods Corp. 485,240 1,628 Aboitiz Power Corp. 1,950,580 1,544 DMCI Holdings Inc. 1,045,480 1,374 Globe Telecom Inc. 33,160 1,244
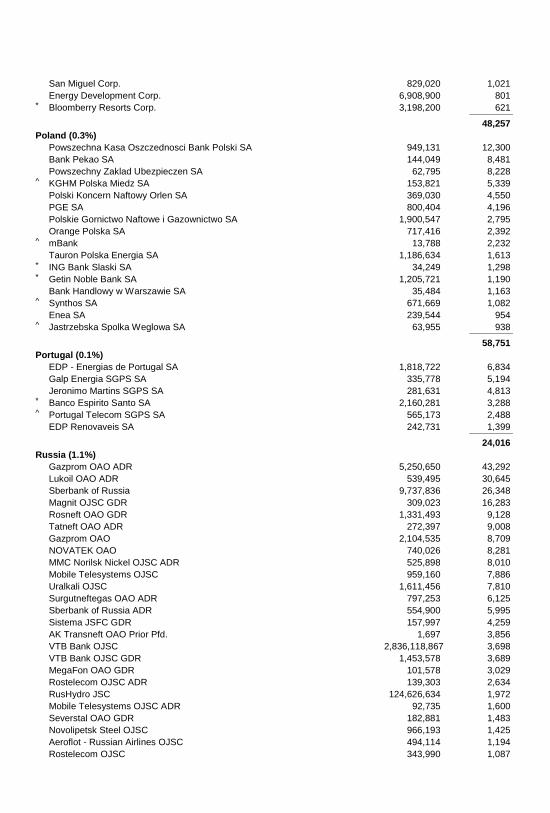
San Miguel Corp. 829,020 1,021 Energy Development Corp. 6,908,900 801 * Bloomberry Resorts Corp. 3,198,200 621 _____________
48,257
Poland (0.3%)
Powszechna Kasa Oszczednosci Bank Polski SA 949,131 12,300 Bank Pekao SA 144,049 8,481 Powszechny Zaklad Ubezpieczen SA 62,795 8,228 ^ KGHM Polska Miedz SA 153,821 5,339 Polski Koncern Naftowy Orlen SA 369,030 4,550 PGE SA 800,404 4,196 Polskie Gornictwo Naftowe i Gazownictwo SA 1,900,547 2,795 Orange Polska SA 717,416 2,392 ^ mBank 13,788 2,232 Tauron Polska Energia SA 1,186,634 1,613 * ING Bank Slaski SA 34,249 1,298 * Getin Noble Bank SA 1,205,721 1,190 Bank Handlowy w Warszawie SA 35,484 1,163 ^ Synthos SA 671,669 1,082 Enea SA 239,544 954 ^ Jastrzebska Spolka Weglowa SA 63,955 938 _____________
58,751
Portugal (0.1%)
EDP - Energias de Portugal SA 1,818,722 6,834 Galp Energia SGPS SA 335,778 5,194 Jeronimo Martins SGPS SA 281,631 4,813 * Banco Espirito Santo SA 2,160,281 3,288 ^ Portugal Telecom SGPS SA 565,173 2,488 EDP Renovaveis SA 242,731 1,399 _____________
24,016
Russia (1.1%)
Gazprom OAO ADR 5,250,650 43,292 Lukoil OAO ADR 539,495 30,645 Sberbank of Russia 9,737,836 26,348 Magnit OJSC GDR 309,023 16,283 Rosneft OAO GDR 1,331,493 9,128 Tatneft OAO ADR 272,397 9,008 Gazprom OAO 2,104,535 8,709 NOVATEK OAO 740,026 8,281 MMC Norilsk Nickel OJSC ADR 525,898 8,010 Mobile Telesystems OJSC 959,160 7,886 Uralkali OJSC 1,611,456 7,810 Surgutneftegas OAO ADR 797,253 6,125 Sberbank of Russia ADR 554,900 5,995 Sistema JSFC GDR 157,997 4,259 AK Transneft OAO Prior Pfd. 1,697 3,856 VTB Bank OJSC 2,836,118,867 3,698 VTB Bank OJSC GDR 1,453,578 3,689 MegaFon OAO GDR 101,578 3,029 Rostelecom OJSC ADR 139,303 2,634 RusHydro JSC 124,626,634 1,972 Mobile Telesystems OJSC ADR 92,735 1,600 Severstal OAO GDR 182,881 1,483 Novolipetsk Steel OJSC 966,193 1,425 Aeroflot - Russian Airlines OJSC 494,114 1,194 Rostelecom OJSC 343,990 1,087
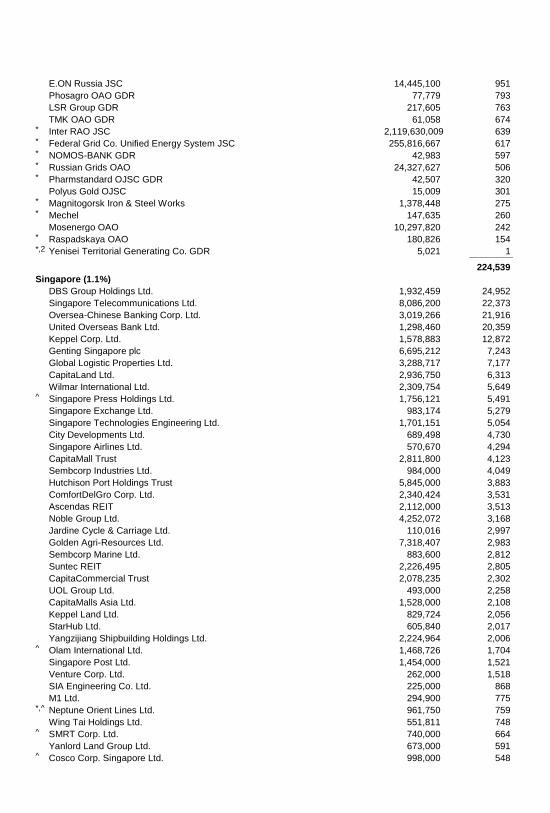
E.ON Russia JSC 14,445,100 951 Phosagro OAO GDR 77,779 793 LSR Group GDR 217,605 763 TMK OAO GDR 61,058 674 * Inter RAO JSC 2,119,630,009 639 * Federal Grid Co. Unified Energy System JSC 255,816,667 617 * NOMOS-BANK GDR 42,983 597 * Russian Grids OAO 24,327,627 506 * Pharmstandard OJSC GDR 42,507 320 Polyus Gold OJSC 15,009 301 * Magnitogorsk Iron & Steel Works 1,378,448 275 * Mechel 147,635 260 Mosenergo OAO 10,297,820 242 * Raspadskaya OAO 180,826 154 *,2 Yenisei Territorial Generating Co. GDR 5,021 1 _____________
224,539
Singapore (1.1%)
DBS Group Holdings Ltd. 1,932,459 24,952 Singapore Telecommunications Ltd. 8,086,200 22,373 Oversea-Chinese Banking Corp. Ltd. 3,019,266 21,916 United Overseas Bank Ltd. 1,298,460 20,359 Keppel Corp. Ltd. 1,578,883 12,872 Genting Singapore plc 6,695,212 7,243 Global Logistic Properties Ltd. 3,288,717 7,177 CapitaLand Ltd. 2,936,750 6,313 Wilmar International Ltd. 2,309,754 5,649 ^ Singapore Press Holdings Ltd. 1,756,121 5,491 Singapore Exchange Ltd. 983,174 5,279 Singapore Technologies Engineering Ltd. 1,701,151 5,054 City Developments Ltd. 689,498 4,730 Singapore Airlines Ltd. 570,670 4,294 CapitaMall Trust 2,811,800 4,123 Sembcorp Industries Ltd. 984,000 4,049 Hutchison Port Holdings Trust 5,845,000 3,883 ComfortDelGro Corp. Ltd. 2,340,424 3,531 Ascendas REIT 2,112,000 3,513 Noble Group Ltd. 4,252,072 3,168 Jardine Cycle & Carriage Ltd. 110,016 2,997 Golden Agri-Resources Ltd. 7,318,407 2,983 Sembcorp Marine Ltd. 883,600 2,812 Suntec REIT 2,226,495 2,805 CapitaCommercial Trust 2,078,235 2,302 UOL Group Ltd. 493,000 2,258 CapitaMalls Asia Ltd. 1,528,000 2,108 Keppel Land Ltd. 829,724 2,056 StarHub Ltd. 605,840 2,017 Yangzijiang Shipbuilding Holdings Ltd. 2,224,964 2,006 ^ Olam International Ltd. 1,468,726 1,704 Singapore Post Ltd. 1,454,000 1,521 Venture Corp. Ltd. 262,000 1,518 SIA Engineering Co. Ltd. 225,000 868 M1 Ltd. 294,900 775 *,^ Neptune Orient Lines Ltd. 961,750 759 Wing Tai Holdings Ltd. 551,811 748 ^ SMRT Corp. Ltd. 740,000 664 Yanlord Land Group Ltd. 673,000 591 ^ Cosco Corp. Singapore Ltd. 998,000 548
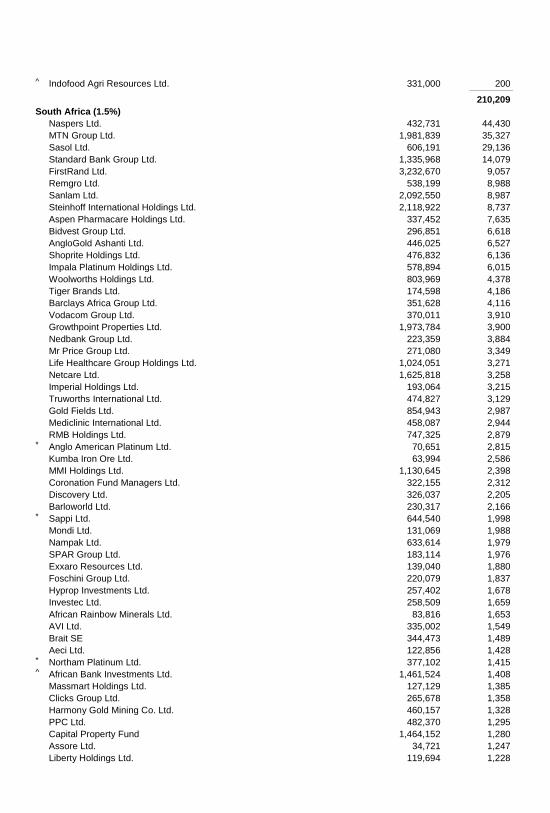
^ Indofood Agri Resources Ltd. 331,000 200 _____________
210,209
South Africa (1.5%)
Naspers Ltd. 432,731 44,430 MTN Group Ltd. 1,981,839 35,327 Sasol Ltd. 606,191 29,136 Standard Bank Group Ltd. 1,335,968 14,079 FirstRand Ltd. 3,232,670 9,057 Remgro Ltd. 538,199 8,988 Sanlam Ltd. 2,092,550 8,987 Steinhoff International Holdings Ltd. 2,118,922 8,737 Aspen Pharmacare Holdings Ltd. 337,452 7,635 Bidvest Group Ltd. 296,851 6,618 AngloGold Ashanti Ltd. 446,025 6,527 Shoprite Holdings Ltd. 476,832 6,136 Impala Platinum Holdings Ltd. 578,894 6,015 Woolworths Holdings Ltd. 803,969 4,378 Tiger Brands Ltd. 174,598 4,186 Barclays Africa Group Ltd. 351,628 4,116 Vodacom Group Ltd. 370,011 3,910 Growthpoint Properties Ltd. 1,973,784 3,900 Nedbank Group Ltd. 223,359 3,884 Mr Price Group Ltd. 271,080 3,349 Life Healthcare Group Holdings Ltd. 1,024,051 3,271 Netcare Ltd. 1,625,818 3,258 Imperial Holdings Ltd. 193,064 3,215 Truworths International Ltd. 474,827 3,129 Gold Fields Ltd. 854,943 2,987 Mediclinic International Ltd. 458,087 2,944 RMB Holdings Ltd. 747,325 2,879 * Anglo American Platinum Ltd. 70,651 2,815 Kumba Iron Ore Ltd. 63,994 2,586 MMI Holdings Ltd. 1,130,645 2,398 Coronation Fund Managers Ltd. 322,155 2,312 Discovery Ltd. 326,037 2,205 Barloworld Ltd. 230,317 2,166 * Sappi Ltd. 644,540 1,998 Mondi Ltd. 131,069 1,988 Nampak Ltd. 633,614 1,979 SPAR Group Ltd. 183,114 1,976 Exxaro Resources Ltd. 139,040 1,880 Foschini Group Ltd. 220,079 1,837 Hyprop Investments Ltd. 257,402 1,678 Investec Ltd. 258,509 1,659 African Rainbow Minerals Ltd. 83,816 1,653 AVI Ltd. 335,002 1,549 Brait SE 344,473 1,489 Aeci Ltd. 122,856 1,428 * Northam Platinum Ltd. 377,102 1,415 ^ African Bank Investments Ltd. 1,461,524 1,408 Massmart Holdings Ltd. 127,129 1,385 Clicks Group Ltd. 265,678 1,358 Harmony Gold Mining Co. Ltd. 460,157 1,328 PPC Ltd. 482,370 1,295 Capital Property Fund 1,464,152 1,280 Assore Ltd. 34,721 1,247 Liberty Holdings Ltd. 119,694 1,228
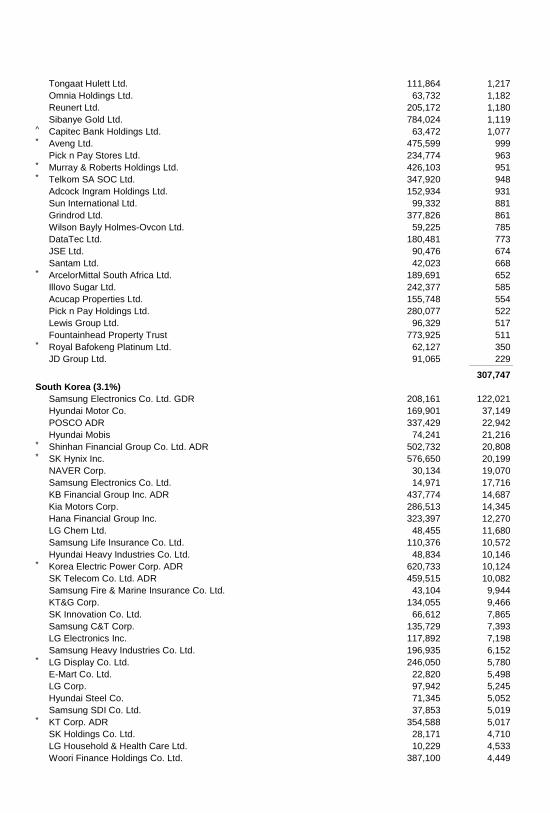
Tongaat Hulett Ltd. 111,864 1,217 Omnia Holdings Ltd. 63,732 1,182 Reunert Ltd. 205,172 1,180 Sibanye Gold Ltd. 784,024 1,119 ^ Capitec Bank Holdings Ltd. 63,472 1,077 * Aveng Ltd. 475,599 999 Pick n Pay Stores Ltd. 234,774 963 * Murray & Roberts Holdings Ltd. 426,103 951 * Telkom SA SOC Ltd. 347,920 948 Adcock Ingram Holdings Ltd. 152,934 931 Sun International Ltd. 99,332 881 Grindrod Ltd. 377,826 861 Wilson Bayly Holmes-Ovcon Ltd. 59,225 785 DataTec Ltd. 180,481 773 JSE Ltd. 90,476 674 Santam Ltd. 42,023 668 * ArcelorMittal South Africa Ltd. 189,691 652 Illovo Sugar Ltd. 242,377 585 Acucap Properties Ltd. 155,748 554 Pick n Pay Holdings Ltd. 280,077 522 Lewis Group Ltd. 96,329 517 Fountainhead Property Trust 773,925 511 * Royal Bafokeng Platinum Ltd. 62,127 350 JD Group Ltd. 91,065 229 _____________
307,747
South Korea (3.1%)
Samsung Electronics Co. Ltd. GDR 208,161 122,021 Hyundai Motor Co. 169,901 37,149 POSCO ADR 337,429 22,942 Hyundai Mobis 74,241 21,216 * Shinhan Financial Group Co. Ltd. ADR 502,732 20,808 * SK Hynix Inc. 576,650 20,199 NAVER Corp. 30,134 19,070 Samsung Electronics Co. Ltd. 14,971 17,716 KB Financial Group Inc. ADR 437,774 14,687 Kia Motors Corp. 286,513 14,345 Hana Financial Group Inc. 323,397 12,270 LG Chem Ltd. 48,455 11,680 Samsung Life Insurance Co. Ltd. 110,376 10,572 Hyundai Heavy Industries Co. Ltd. 48,834 10,146 * Korea Electric Power Corp. ADR 620,733 10,124 SK Telecom Co. Ltd. ADR 459,515 10,082 Samsung Fire & Marine Insurance Co. Ltd. 43,104 9,944 KT&G Corp. 134,055 9,466 SK Innovation Co. Ltd. 66,612 7,865 Samsung C&T Corp. 135,729 7,393 LG Electronics Inc. 117,892 7,198 Samsung Heavy Industries Co. Ltd. 196,935 6,152 * LG Display Co. Ltd. 246,050 5,780 E-Mart Co. Ltd. 22,820 5,498 LG Corp. 97,942 5,245 Hyundai Steel Co. 71,345 5,052 Samsung SDI Co. Ltd. 37,853 5,019 * KT Corp. ADR 354,588 5,017 SK Holdings Co. Ltd. 28,171 4,710 LG Household & Health Care Ltd. 10,229 4,533 Woori Finance Holdings Co. Ltd. 387,100 4,449
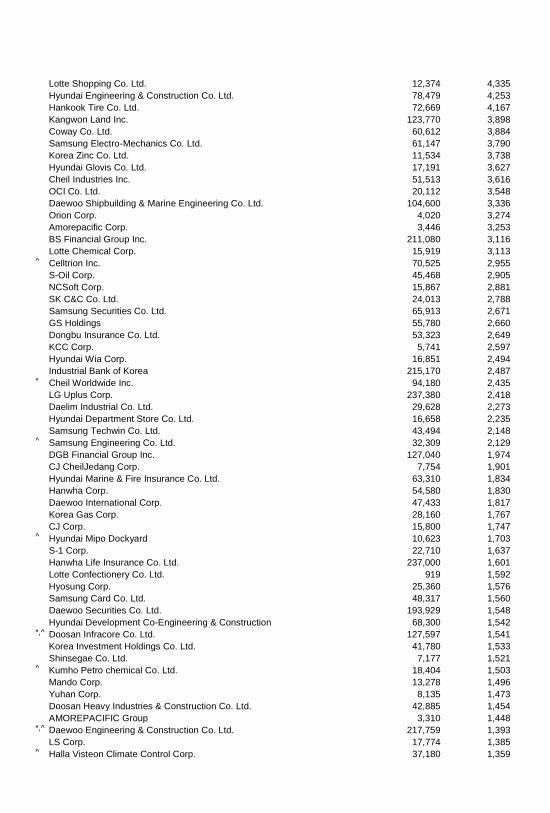
Lotte Shopping Co. Ltd. 12,374 4,335 Hyundai Engineering & Construction Co. Ltd. 78,479 4,253 Hankook Tire Co. Ltd. 72,669 4,167 Kangwon Land Inc. 123,770 3,898 Coway Co. Ltd. 60,612 3,884 Samsung Electro-Mechanics Co. Ltd. 61,147 3,790 Korea Zinc Co. Ltd. 11,534 3,738 Hyundai Glovis Co. Ltd. 17,191 3,627 Cheil Industries Inc. 51,513 3,616 OCI Co. Ltd. 20,112 3,548 Daewoo Shipbuilding & Marine Engineering Co. Ltd. 104,600 3,336 Orion Corp. 4,020 3,274 Amorepacific Corp. 3,446 3,253 BS Financial Group Inc. 211,080 3,116 Lotte Chemical Corp. 15,919 3,113 ^ Celltrion Inc. 70,525 2,955 S-Oil Corp. 45,468 2,905 NCSoft Corp. 15,867 2,881 SK C&C Co. Ltd. 24,013 2,788 Samsung Securities Co. Ltd. 65,913 2,671 GS Holdings 55,780 2,660 Dongbu Insurance Co. Ltd. 53,323 2,649 KCC Corp. 5,741 2,597 Hyundai Wia Corp. 16,851 2,494 Industrial Bank of Korea 215,170 2,487 * Cheil Worldwide Inc. 94,180 2,435 LG Uplus Corp. 237,380 2,418 Daelim Industrial Co. Ltd. 29,628 2,273 Hyundai Department Store Co. Ltd. 16,658 2,235 Samsung Techwin Co. Ltd. 43,494 2,148 ^ Samsung Engineering Co. Ltd. 32,309 2,129 DGB Financial Group Inc. 127,040 1,974 CJ CheilJedang Corp. 7,754 1,901 Hyundai Marine & Fire Insurance Co. Ltd. 63,310 1,834 Hanwha Corp. 54,580 1,830 Daewoo International Corp. 47,433 1,817 Korea Gas Corp. 28,160 1,767 CJ Corp. 15,800 1,747 ^ Hyundai Mipo Dockyard 10,623 1,703 S-1 Corp. 22,710 1,637 Hanwha Life Insurance Co. Ltd. 237,000 1,601 Lotte Confectionery Co. Ltd. 919 1,592 Hyosung Corp. 25,360 1,576 Samsung Card Co. Ltd. 48,317 1,560 Daewoo Securities Co. Ltd. 193,929 1,548 Hyundai Development Co-Engineering & Construction 68,300 1,542 *,^ Doosan Infracore Co. Ltd. 127,597 1,541 Korea Investment Holdings Co. Ltd. 41,780 1,533 Shinsegae Co. Ltd. 7,177 1,521 ^ Kumho Petro chemical Co. Ltd. 18,404 1,503 Mando Corp. 13,278 1,496 Yuhan Corp. 8,135 1,473 Doosan Heavy Industries & Construction Co. Ltd. 42,885 1,454 AMOREPACIFIC Group 3,310 1,448 *,^ Daewoo Engineering & Construction Co. Ltd. 217,759 1,393 LS Corp. 17,774 1,385 ^ Halla Visteon Climate Control Corp. 37,180 1,359
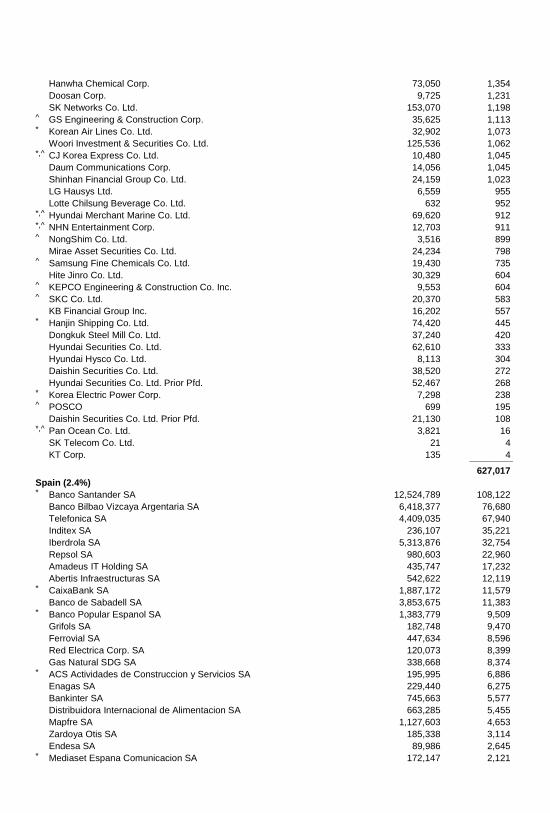
Hanwha Chemical Corp. 73,050 1,354 Doosan Corp. 9,725 1,231 SK Networks Co. Ltd. 153,070 1,198 ^ GS Engineering & Construction Corp. 35,625 1,113 * Korean Air Lines Co. Ltd. 32,902 1,073 Woori Investment & Securities Co. Ltd. 125,536 1,062 *,^ CJ Korea Express Co. Ltd. 10,480 1,045 Daum Communications Corp. 14,056 1,045 Shinhan Financial Group Co. Ltd. 24,159 1,023 LG Hausys Ltd. 6,559 955 Lotte Chilsung Beverage Co. Ltd. 632 952 *,^ Hyundai Merchant Marine Co. Ltd. 69,620 912 *,^ NHN Entertainment Corp. 12,703 911 ^ NongShim Co. Ltd. 3,516 899 Mirae Asset Securities Co. Ltd. 24,234 798 ^ Samsung Fine Chemicals Co. Ltd. 19,430 735 Hite Jinro Co. Ltd. 30,329 604 ^ KEPCO Engineering & Construction Co. Inc. 9,553 604 ^ SKC Co. Ltd. 20,370 583 KB Financial Group Inc. 16,202 557 * Hanjin Shipping Co. Ltd. 74,420 445 Dongkuk Steel Mill Co. Ltd. 37,240 420 Hyundai Securities Co. Ltd. 62,610 333 Hyundai Hysco Co. Ltd. 8,113 304 Daishin Securities Co. Ltd. 38,520 272 Hyundai Securities Co. Ltd. Prior Pfd. 52,467 268 * Korea Electric Power Corp. 7,298 238 ^ POSCO 699 195 Daishin Securities Co. Ltd. Prior Pfd. 21,130 108 *,^ Pan Ocean Co. Ltd. 3,821 16 SK Telecom Co. Ltd. 21 4 KT Corp. 135 4 _____________
627,017
Spain (2.4%)
* Banco Santander SA 12,524,789 108,122 Banco Bilbao Vizcaya Argentaria SA 6,418,377 76,680 Telefonica SA 4,409,035 67,940 Inditex SA 236,107 35,221 Iberdrola SA 5,313,876 32,754 Repsol SA 980,603 22,960 Amadeus IT Holding SA 435,747 17,232 Abertis Infraestructuras SA 542,622 12,119 * CaixaBank SA 1,887,172 11,579 Banco de Sabadell SA 3,853,675 11,383 * Banco Popular Espanol SA 1,383,779 9,509 Grifols SA 182,748 9,470 Ferrovial SA 447,634 8,596 Red Electrica Corp. SA 120,073 8,399 Gas Natural SDG SA 338,668 8,374 * ACS Actividades de Construccion y Servicios SA 195,995 6,886 Enagas SA 229,440 6,275 Bankinter SA 745,663 5,577 Distribuidora Internacional de Alimentacion SA 663,285 5,455 Mapfre SA 1,127,603 4,653 Zardoya Otis SA 185,338 3,114 Endesa SA 89,986 2,645 * Mediaset Espana Comunicacion SA 172,147 2,121
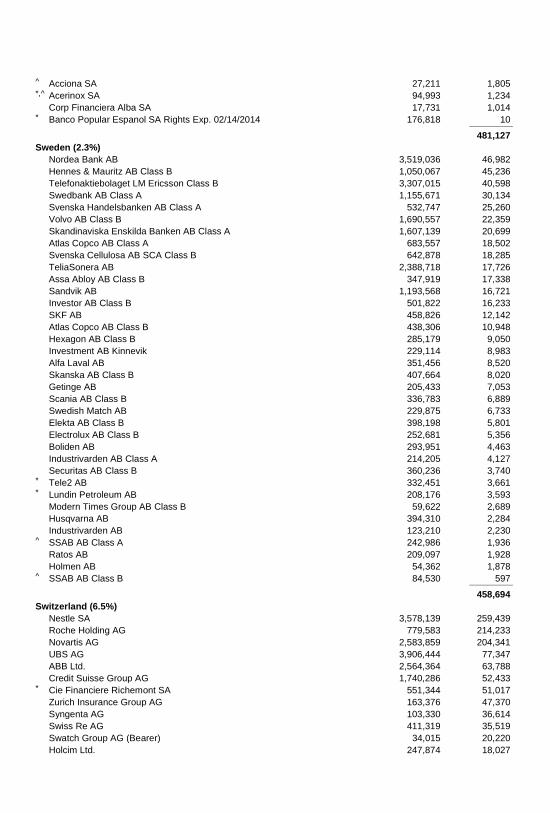
^ Acciona SA 27,211 1,805 *,^ Acerinox SA 94,993 1,234 Corp Financiera Alba SA 17,731 1,014 * Banco Popular Espanol SA Rights Exp. 02/14/2014 176,818 10 _____________
481,127
Sweden (2.3%)
Nordea Bank AB 3,519,036 46,982 Hennes & Mauritz AB Class B 1,050,067 45,236 Telefonaktiebolaget LM Ericsson Class B 3,307,015 40,598 Swedbank AB Class A 1,155,671 30,134 Svenska Handelsbanken AB Class A 532,747 25,260 Volvo AB Class B 1,690,557 22,359 Skandinaviska Enskilda Banken AB Class A 1,607,139 20,699 Atlas Copco AB Class A 683,557 18,502 Svenska Cellulosa AB SCA Class B 642,878 18,285 TeliaSonera AB 2,388,718 17,726 Assa Abloy AB Class B 347,919 17,338 Sandvik AB 1,193,568 16,721 Investor AB Class B 501,822 16,233 SKF AB 458,826 12,142 Atlas Copco AB Class B 438,306 10,948 Hexagon AB Class B 285,179 9,050 Investment AB Kinnevik 229,114 8,983 Alfa Laval AB 351,456 8,520 Skanska AB Class B 407,664 8,020 Getinge AB 205,433 7,053 Scania AB Class B 336,783 6,889 Swedish Match AB 229,875 6,733 Elekta AB Class B 398,198 5,801 Electrolux AB Class B 252,681 5,356 Boliden AB 293,951 4,463 Industrivarden AB Class A 214,205 4,127 Securitas AB Class B 360,236 3,740 * Tele2 AB 332,451 3,661 * Lundin Petroleum AB 208,176 3,593 Modern Times Group AB Class B 59,622 2,689 Husqvarna AB 394,310 2,284 Industrivarden AB 123,210 2,230 ^ SSAB AB Class A 242,986 1,936 Ratos AB 209,097 1,928 Holmen AB 54,362 1,878 ^ SSAB AB Class B 84,530 597 _____________
458,694
Switzerland (6.5%)
Nestle SA 3,578,139 259,439 Roche Holding AG 779,583 214,233 Novartis AG 2,583,859 204,341 UBS AG 3,906,444 77,347 ABB Ltd. 2,564,364 63,788 Credit Suisse Group AG 1,740,286 52,433 * Cie Financiere Richemont SA 551,344 51,017 Zurich Insurance Group AG 163,376 47,370 Syngenta AG 103,330 36,614 Swiss Re AG 411,319 35,519 Swatch Group AG (Bearer) 34,015 20,220 Holcim Ltd. 247,874 18,027
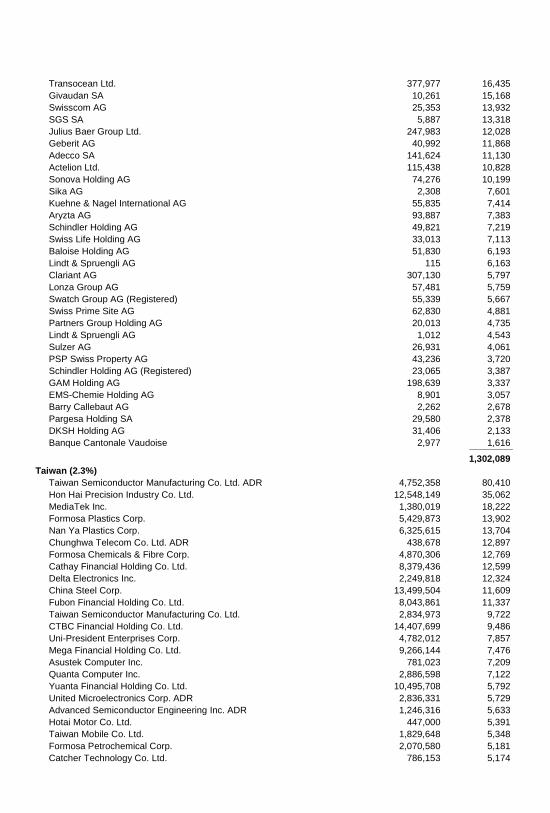
Transocean Ltd. 377,977 16,435 Givaudan SA 10,261 15,168 Swisscom AG 25,353 13,932 SGS SA 5,887 13,318 Julius Baer Group Ltd. 247,983 12,028 Geberit AG 40,992 11,868 Adecco SA 141,624 11,130 Actelion Ltd. 115,438 10,828 Sonova Holding AG 74,276 10,199 Sika AG 2,308 7,601 Kuehne & Nagel International AG 55,835 7,414 Aryzta AG 93,887 7,383 Schindler Holding AG 49,821 7,219 Swiss Life Holding AG 33,013 7,113 Baloise Holding AG 51,830 6,193 Lindt & Spruengli AG 115 6,163 Clariant AG 307,130 5,797 Lonza Group AG 57,481 5,759 Swatch Group AG (Registered) 55,339 5,667 Swiss Prime Site AG 62,830 4,881 Partners Group Holding AG 20,013 4,735 Lindt & Spruengli AG 1,012 4,543 Sulzer AG 26,931 4,061 PSP Swiss Property AG 43,236 3,720 Schindler Holding AG (Registered) 23,065 3,387 GAM Holding AG 198,639 3,337 EMS-Chemie Holding AG 8,901 3,057 Barry Callebaut AG 2,262 2,678 Pargesa Holding SA 29,580 2,378 DKSH Holding AG 31,406 2,133 Banque Cantonale Vaudoise 2,977 1,616 _____________
1,302,089
Taiwan (2.3%)
Taiwan Semiconductor Manufacturing Co. Ltd. ADR 4,752,358 80,410 Hon Hai Precision Industry Co. Ltd. 12,548,149 35,062 MediaTek Inc. 1,380,019 18,222 Formosa Plastics Corp. 5,429,873 13,902 Nan Ya Plastics Corp. 6,325,615 13,704 Chunghwa Telecom Co. Ltd. ADR 438,678 12,897 Formosa Chemicals & Fibre Corp. 4,870,306 12,769 Cathay Financial Holding Co. Ltd. 8,379,436 12,599 Delta Electronics Inc. 2,249,818 12,324 China Steel Corp. 13,499,504 11,609 Fubon Financial Holding Co. Ltd. 8,043,861 11,337 Taiwan Semiconductor Manufacturing Co. Ltd. 2,834,973 9,722 CTBC Financial Holding Co. Ltd. 14,407,699 9,486 Uni-President Enterprises Corp. 4,782,012 7,857 Mega Financial Holding Co. Ltd. 9,266,144 7,476 Asustek Computer Inc. 781,023 7,209 Quanta Computer Inc. 2,886,598 7,122 Yuanta Financial Holding Co. Ltd. 10,495,708 5,792 United Microelectronics Corp. ADR 2,836,331 5,729 Advanced Semiconductor Engineering Inc. ADR 1,246,316 5,633 Hotai Motor Co. Ltd. 447,000 5,391 Taiwan Mobile Co. Ltd. 1,829,648 5,348 Formosa Petrochemical Corp. 2,070,580 5,181 Catcher Technology Co. Ltd. 786,153 5,174

Taiwan Cement Corp. 3,505,768 5,090 Cheng Shin Rubber Industry Co. Ltd. 2,016,220 5,065 China Development Financial Holding Corp. 15,402,318 4,469 First Financial Holding Co. Ltd. 7,461,977 4,456 Far Eastern New Century Corp. 4,211,545 4,306 Largan Precision Co. Ltd. 110,068 4,222 Hua Nan Financial Holdings Co. Ltd. 7,413,600 4,164 President Chain Store Corp. 612,904 4,092 Siliconware Precision Industries Co. ADR 690,428 3,942 SinoPac Financial Holdings Co. Ltd. 8,113,657 3,768 Taishin Financial Holding Co. Ltd. 7,783,046 3,681 HTC Corp. 818,570 3,627 Compal Electronics Inc. 4,611,510 3,451 Lite-On Technology Corp. 2,341,808 3,440 Far EasTone Telecommunications Co. Ltd. 1,742,643 3,418 Taiwan Cooperative Financial Holding Co. Ltd. 6,295,315 3,395 E.Sun Financial Holding Co. Ltd. 5,474,772 3,389 MStar Semiconductor Inc. 301,539 3,304 Asia Cement Corp. 2,522,274 3,100 * Innolux Corp. 9,013,580 3,099 Inventec Corp. 3,328,064 3,044 * AU Optronics Corp. ADR 988,319 2,728 Pegatron Corp. 1,850,038 2,427 Foxconn Technology Co. Ltd. 1,076,663 2,407 Synnex Technology International Corp. 1,414,990 2,380 Shin Kong Financial Holding Co. Ltd. 6,853,180 2,293 Novatek Microelectronics Corp. 564,916 2,248 Advantech Co. Ltd. 342,105 2,130 Teco Electric and Machinery Co. Ltd. 1,951,000 2,122 Wistron Corp. 2,519,193 2,083 Epistar Corp. 925,000 2,026 Giant Manufacturing Co. Ltd. 306,625 1,934 Chang Hwa Commercial Bank 3,250,116 1,913 Pou Chen Corp. 1,316,125 1,807 * Acer Inc. 2,908,822 1,720 Taiwan Fertilizer Co. Ltd. 802,000 1,677 Advanced Semiconductor Engineering Inc. 1,785,847 1,648 TPK Holding Co. Ltd. 258,422 1,635 Chicony Electronics Co. Ltd. 603,401 1,539 Yulon Motor Co. Ltd. 893,898 1,534 Taiwan Glass Industry Corp. 1,513,701 1,482 Realtek Semiconductor Corp. 484,768 1,316 Formosa Taffeta Co. Ltd. 1,122,000 1,182 * Walsin Lihwa Corp. 3,624,000 1,126 Unimicron Technology Corp. 1,452,975 1,112 * Taiwan Business Bank 3,725,673 1,102 * Evergreen Marine Corp. Taiwan Ltd. 1,674,993 983 Capital Securities Corp. 2,294,231 892 * Eva Airways Corp. 1,654,221 875 Transcend Information Inc. 286,455 845 Far Eastern International Bank 2,173,133 843 Siliconware Precision Industries Co. 697,000 833 Feng Hsin Iron & Steel Co. 474,790 812 Eternal Chemical Co. Ltd. 870,056 812 * China Airlines Ltd. 2,305,913 809 Vanguard International Semiconductor Corp. 734,466 801 * Macronix International 3,651,748 800
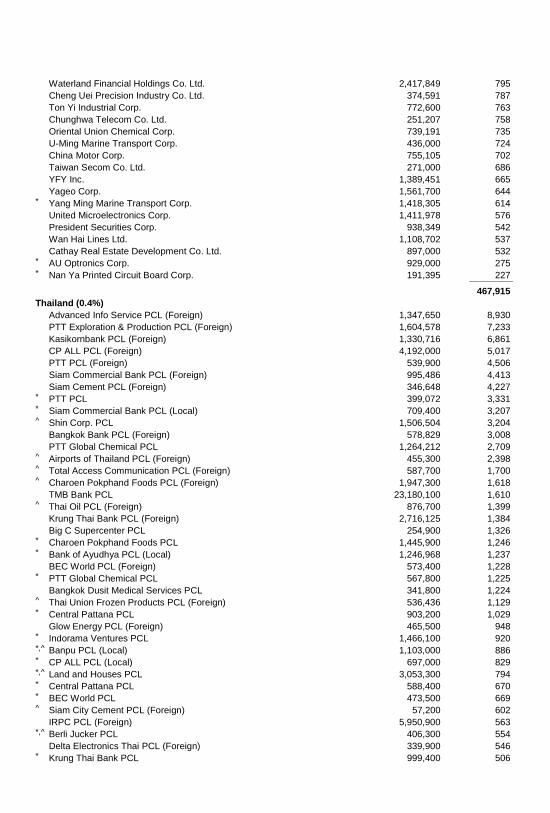
Waterland Financial Holdings Co. Ltd. 2,417,849 795 Cheng Uei Precision Industry Co. Ltd. 374,591 787 Ton Yi Industrial Corp. 772,600 763 Chunghwa Telecom Co. Ltd. 251,207 758 Oriental Union Chemical Corp. 739,191 735 U-Ming Marine Transport Corp. 436,000 724 China Motor Corp. 755,105 702 Taiwan Secom Co. Ltd. 271,000 686 YFY Inc. 1,389,451 665 Yageo Corp. 1,561,700 644 * Yang Ming Marine Transport Corp. 1,418,305 614 United Microelectronics Corp. 1,411,978 576 President Securities Corp. 938,349 542 Wan Hai Lines Ltd. 1,108,702 537 Cathay Real Estate Development Co. Ltd. 897,000 532 * AU Optronics Corp. 929,000 275 * Nan Ya Printed Circuit Board Corp. 191,395 227 _____________
467,915
Thailand (0.4%)
Advanced Info Service PCL (Foreign) 1,347,650 8,930 PTT Exploration & Production PCL (Foreign) 1,604,578 7,233 Kasikornbank PCL (Foreign) 1,330,716 6,861 CP ALL PCL (Foreign) 4,192,000 5,017 PTT PCL (Foreign) 539,900 4,506 Siam Commercial Bank PCL (Foreign) 995,486 4,413 Siam Cement PCL (Foreign) 346,648 4,227 * PTT PCL 399,072 3,331 * Siam Commercial Bank PCL (Local) 709,400 3,207 ^ Shin Corp. PCL 1,506,504 3,204 Bangkok Bank PCL (Foreign) 578,829 3,008 PTT Global Chemical PCL 1,264,212 2,709 ^ Airports of Thailand PCL (Foreign) 455,300 2,398 ^ Total Access Communication PCL (Foreign) 587,700 1,700 ^ Charoen Pokphand Foods PCL (Foreign) 1,947,300 1,618 TMB Bank PCL 23,180,100 1,610 ^ Thai Oil PCL (Foreign) 876,700 1,399 Krung Thai Bank PCL (Foreign) 2,716,125 1,384 Big C Supercenter PCL 254,900 1,326 * Charoen Pokphand Foods PCL 1,445,900 1,246 * Bank of Ayudhya PCL (Local) 1,246,968 1,237 BEC World PCL (Foreign) 573,400 1,228 * PTT Global Chemical PCL 567,800 1,225 Bangkok Dusit Medical Services PCL 341,800 1,224 ^ Thai Union Frozen Products PCL (Foreign) 536,436 1,129 * Central Pattana PCL 903,200 1,029 Glow Energy PCL (Foreign) 465,500 948 * Indorama Ventures PCL 1,466,100 920 *,^ Banpu PCL (Local) 1,103,000 886 * CP ALL PCL (Local) 697,000 829 *,^ Land and Houses PCL 3,053,300 794 * Central Pattana PCL 588,400 670 * BEC World PCL 473,500 669 ^ Siam City Cement PCL (Foreign) 57,200 602 IRPC PCL (Foreign) 5,950,900 563 *,^ Berli Jucker PCL 406,300 554 Delta Electronics Thai PCL (Foreign) 339,900 546 * Krung Thai Bank PCL 999,400 506
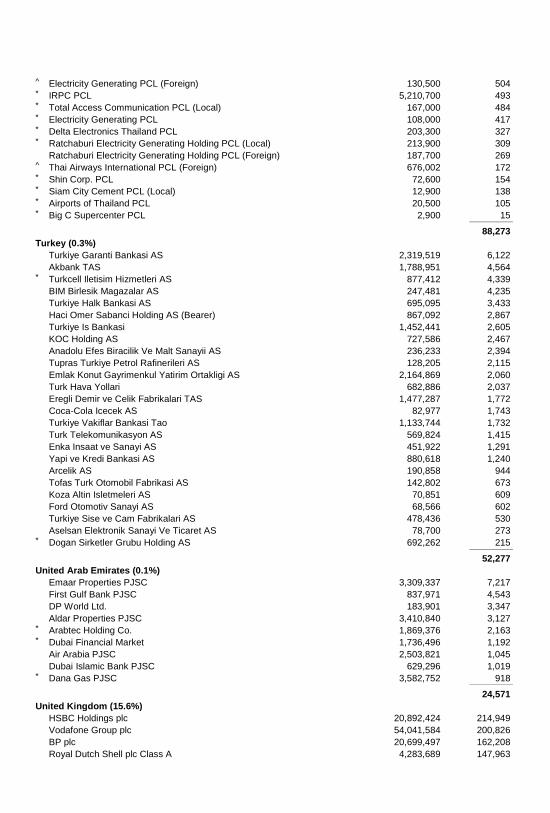
^ Electricity Generating PCL (Foreign) 130,500 504 * IRPC PCL 5,210,700 493 * Total Access Communication PCL (Local) 167,000 484 * Electricity Generating PCL 108,000 417 * Delta Electronics Thailand PCL 203,300 327 * Ratchaburi Electricity Generating Holding PCL (Local) 213,900 309 Ratchaburi Electricity Generating Holding PCL (Foreign) 187,700 269 ^ Thai Airways International PCL (Foreign) 676,002 172 * Shin Corp. PCL 72,600 154 * Siam City Cement PCL (Local) 12,900 138 * Airports of Thailand PCL 20,500 105 * Big C Supercenter PCL 2,900 15 _____________
88,273
Turkey (0.3%)
Turkiye Garanti Bankasi AS 2,319,519 6,122 Akbank TAS 1,788,951 4,564 * Turkcell Iletisim Hizmetleri AS 877,412 4,339 BIM Birlesik Magazalar AS 247,481 4,235 Turkiye Halk Bankasi AS 695,095 3,433 Haci Omer Sabanci Holding AS (Bearer) 867,092 2,867 Turkiye Is Bankasi 1,452,441 2,605 KOC Holding AS 727,586 2,467 Anadolu Efes Biracilik Ve Malt Sanayii AS 236,233 2,394 Tupras Turkiye Petrol Rafinerileri AS 128,205 2,115 Emlak Konut Gayrimenkul Yatirim Ortakligi AS 2,164,869 2,060 Turk Hava Yollari 682,886 2,037 Eregli Demir ve Celik Fabrikalari TAS 1,477,287 1,772 Coca-Cola Icecek AS 82,977 1,743 Turkiye Vakiflar Bankasi Tao 1,133,744 1,732 Turk Telekomunikasyon AS 569,824 1,415 Enka Insaat ve Sanayi AS 451,922 1,291 Yapi ve Kredi Bankasi AS 880,618 1,240 Arcelik AS 190,858 944 Tofas Turk Otomobil Fabrikasi AS 142,802 673 Koza Altin Isletmeleri AS 70,851 609 Ford Otomotiv Sanayi AS 68,566 602 Turkiye Sise ve Cam Fabrikalari AS 478,436 530 Aselsan Elektronik Sanayi Ve Ticaret AS 78,700 273 * Dogan Sirketler Grubu Holding AS 692,262 215 _____________
52,277
United Arab Emirates (0.1%)
Emaar Properties PJSC 3,309,337 7,217 First Gulf Bank PJSC 837,971 4,543 DP World Ltd. 183,901 3,347 Aldar Properties PJSC 3,410,840 3,127 * Arabtec Holding Co. 1,869,376 2,163 * Dubai Financial Market 1,736,496 1,192 Air Arabia PJSC 2,503,821 1,045 Dubai Islamic Bank PJSC 629,296 1,019 * Dana Gas PJSC 3,582,752 918 _____________
24,571
United Kingdom (15.6%)
HSBC Holdings plc 20,892,424 214,949 Vodafone Group plc 54,041,584 200,826 BP plc 20,699,497 162,208 Royal Dutch Shell plc Class A 4,283,689 147,963
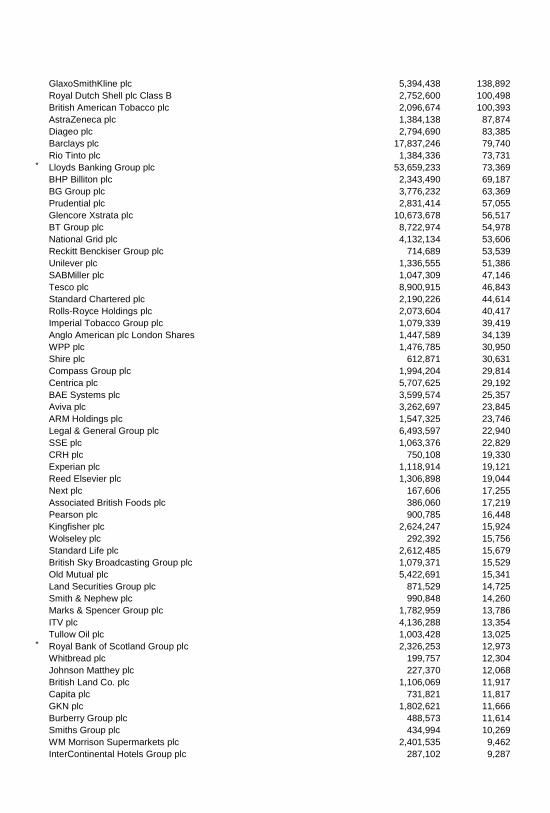
GlaxoSmithKline plc 5,394,438 138,892 Royal Dutch Shell plc Class B 2,752,600 100,498 British American Tobacco plc 2,096,674 100,393 AstraZeneca plc 1,384,138 87,874 Diageo plc 2,794,690 83,385 Barclays plc 17,837,246 79,740 Rio Tinto plc 1,384,336 73,731 * Lloyds Banking Group plc 53,659,233 73,369 BHP Billiton plc 2,343,490 69,187 BG Group plc 3,776,232 63,369 Prudential plc 2,831,414 57,055 Glencore Xstrata plc 10,673,678 56,517 BT Group plc 8,722,974 54,978 National Grid plc 4,132,134 53,606 Reckitt Benckiser Group plc 714,689 53,539 Unilever plc 1,336,555 51,386 SABMiller plc 1,047,309 47,146 Tesco plc 8,900,915 46,843 Standard Chartered plc 2,190,226 44,614 Rolls-Royce Holdings plc 2,073,604 40,417 Imperial Tobacco Group plc 1,079,339 39,419 Anglo American plc London Shares 1,447,589 34,139 WPP plc 1,476,785 30,950 Shire plc 612,871 30,631 Compass Group plc 1,994,204 29,814 Centrica plc 5,707,625 29,192 BAE Systems plc 3,599,574 25,357 Aviva plc 3,262,697 23,845 ARM Holdings plc 1,547,325 23,746 Legal & General Group plc 6,493,597 22,940 SSE plc 1,063,376 22,829 CRH plc 750,108 19,330 Experian plc 1,118,914 19,121 Reed Elsevier plc 1,306,898 19,044 Next plc 167,606 17,255 Associated British Foods plc 386,060 17,219 Pearson plc 900,785 16,448 Kingfisher plc 2,624,247 15,924 Wolseley plc 292,392 15,756 Standard Life plc 2,612,485 15,679 British Sky Broadcasting Group plc 1,079,371 15,529 Old Mutual plc 5,422,691 15,341 Land Securities Group plc 871,529 14,725 Smith & Nephew plc 990,848 14,260 Marks & Spencer Group plc 1,782,959 13,786 ITV plc 4,136,288 13,354 Tullow Oil plc 1,003,428 13,025 * Royal Bank of Scotland Group plc 2,326,253 12,973 Whitbread plc 199,757 12,304 Johnson Matthey plc 227,370 12,068 British Land Co. plc 1,106,069 11,917 Capita plc 731,821 11,817 GKN plc 1,802,621 11,666 Burberry Group plc 488,573 11,614 Smiths Group plc 434,994 10,269 WM Morrison Supermarkets plc 2,401,535 9,462 InterContinental Hotels Group plc 287,102 9,287
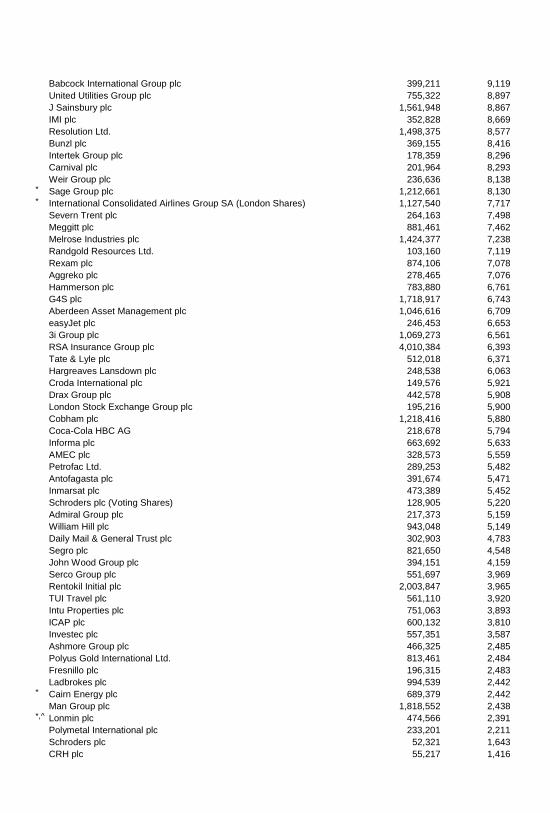
Babcock International Group plc 399,211 9,119 United Utilities Group plc 755,322 8,897 J Sainsbury plc 1,561,948 8,867 IMI plc 352,828 8,669 Resolution Ltd. 1,498,375 8,577 Bunzl plc 369,155 8,416 Intertek Group plc 178,359 8,296 Carnival plc 201,964 8,293 Weir Group plc 236,636 8,138 * Sage Group plc 1,212,661 8,130 * International Consolidated Airlines Group SA (London Shares) 1,127,540 7,717 Severn Trent plc 264,163 7,498 Meggitt plc 881,461 7,462 Melrose Industries plc 1,424,377 7,238 Randgold Resources Ltd. 103,160 7,119 Rexam plc 874,106 7,078 Aggreko plc 278,465 7,076 Hammerson plc 783,880 6,761 G4S plc 1,718,917 6,743 Aberdeen Asset Management plc 1,046,616 6,709 easyJet plc 246,453 6,653 3i Group plc 1,069,273 6,561 RSA Insurance Group plc 4,010,384 6,393 Tate & Lyle plc 512,018 6,371 Hargreaves Lansdown plc 248,538 6,063 Croda International plc 149,576 5,921 Drax Group plc 442,578 5,908 London Stock Exchange Group plc 195,216 5,900 Cobham plc 1,218,416 5,880 Coca-Cola HBC AG 218,678 5,794 Informa plc 663,692 5,633 AMEC plc 328,573 5,559 Petrofac Ltd. 289,253 5,482 Antofagasta plc 391,674 5,471 Inmarsat plc 473,389 5,452 Schroders plc (Voting Shares) 128,905 5,220 Admiral Group plc 217,373 5,159 William Hill plc 943,048 5,149 Daily Mail & General Trust plc 302,903 4,783 Segro plc 821,650 4,548 John Wood Group plc 394,151 4,159 Serco Group plc 551,697 3,969 Rentokil Initial plc 2,003,847 3,965 TUI Travel plc 561,110 3,920 Intu Properties plc 751,063 3,893 ICAP plc 600,132 3,810 Investec plc 557,351 3,587 Ashmore Group plc 466,325 2,485 Polyus Gold International Ltd. 813,461 2,484 Fresnillo plc 196,315 2,483 Ladbrokes plc 994,539 2,442 * Cairn Energy plc 689,379 2,442 Man Group plc 1,818,552 2,438 *,^ Lonmin plc 474,566 2,391 Polymetal International plc 233,201 2,211 Schroders plc 52,321 1,643 CRH plc 55,217 1,416

^ Vedanta Resources plc 106,255 1,408 ^ Kazakhmys plc 278,739 815 * Evraz plc 508,869 714 African Barrick Gold plc 129,025 466 Ferrexpo plc 137,551 343 * Essar Energy plc 350,120 332 _____________
3,109,039
Total Common Stocks (Cost $17,618,459) 19,814,751
Coupon
Temporary Cash Investments (2.0%)1
Money Market Fund (1.9%) 5,6 Vanguard Market Liquidity Fund 0.130% 380,662,979 380,663
Maturity
Date
Face
Amount
($000)
U.S. Government and Agency Obligations (0.1%)
7 Fannie Mae Discount Notes 0.060% 3/19/14 600 600 8 Federal Home Loan Bank Discount Notes 0.090% 3/21/14 300 300 8,9 Federal Home Loan Bank Discount Notes 0.056% 4/9/14 2,000 1,999 8 Federal Home Loan Bank Discount Notes 0.070% 4/21/14 3,000 2,999 8,9 Federal Home Loan Bank Discount Notes 0.130% 5/23/14 200 200 8,9 Federal Home Loan Bank Discount Notes 0.125% 5/30/14 1,200 1,199 7 Freddie Mac Discount Notes 0.080% 2/10/14 300 300 9 United States Treasury Note/Bond 1.750% 3/31/14 1,700 1,704 _____________
9,301
Total Temporary Cash Investments (Cost $389,966) 389,964
Total Investments (101.5%) (Cost $18,008,425) 20,204,715
Other Assets and Liabilities-Net (-1.5%)5 (295,561)
Net Assets (100%) 19,909,154
* Non-income-producing security.
^ Includes partial security positions on loan to broker-dealers. The total value of securities on loan is $300,820,000.
1 The fund invests a portion of its cash reserves in equity markets through the use of index futures contracts. After giving effect to futures investments, the fund's effective common stock and temporary cash investment positions represent 99.9% and 1.6%, respectively, of net assets.
2 Security exempt from registration under Rule 144A of the Securities Act of 1933. Such securities may be sold in transactions exempt from registration, normally to qualified institutional buyers. At January 31, 2014, the aggregate value of these securities was $21,556,000, representing 0.1% of net assets.
3 “Other” represents securities that are not classified by the fund’s benchmark index.
4 Considered an affiliated company of the fund as the issuer is another member of The Vanguard Group.
5 Affiliated money market fund available only to Vanguard funds and certain trusts and accounts managed by Vanguard. Rate shown is the 7-day yield.
6 Includes $319,095,000 of collateral received for securities on loan.
7 The issuer was placed under federal conservatorship in September 2008; since that time, its daily operations have been managed by the Federal Housing Finance Agency and it receives capital from the U.S. Treasury, as needed to maintain a positive net worth, in exchange for senior preferred stock.
8 The issuer operates under a congressional charter; its securities are generally neither guaranteed by the U.S. Treasury nor backed by the full faith and credit of the U.S. government.
9 Securities with a value of $4,609,000 have been segregated as initial margin for open futures contracts.
ADR—American Depositary Receipt. GDR—Global Depositary Receipt. REIT—Real Estate Investment Trust.
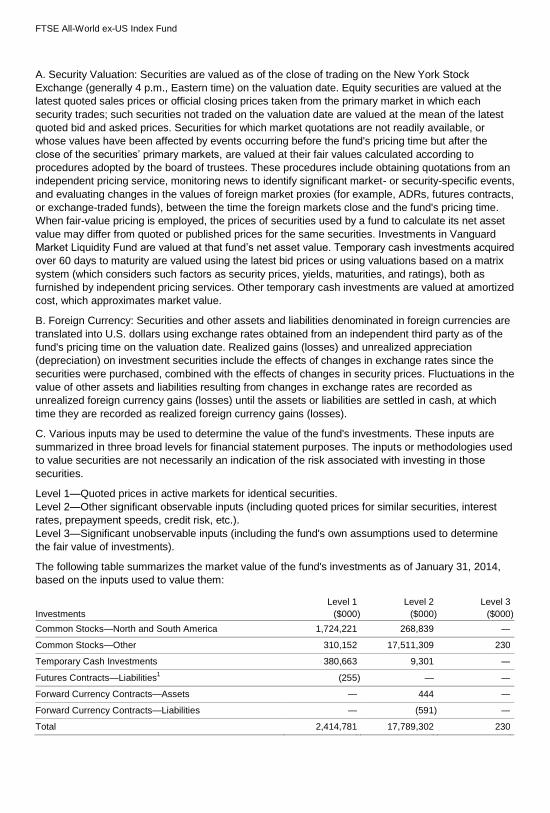
FTSE All-World ex-US Index Fund
A. Security Valuation: Securities are valued as of the close of trading on the New York Stock
Exchange (generally 4 p.m., Eastern time) on the valuation date. Equity securities are valued at the
latest quoted sales prices or official closing prices taken from the primary market in which each
security trades; such securities not traded on the valuation date are valued at the mean of the latest
quoted bid and asked prices. Securities for which market quotations are not readily available, or
whose values have been affected by events occurring before the fund's pricing time but after the
close of the securities’ primary markets, are valued at their fair values calculated according to
procedures adopted by the board of trustees. These procedures include obtaining quotations from an
independent pricing service, monitoring news to identify significant market- or security-specific events,
and evaluating changes in the values of foreign market proxies (for example, ADRs, futures contracts,
or exchange-traded funds), between the time the foreign markets close and the fund's pricing time.
When fair-value pricing is employed, the prices of securities used by a fund to calculate its net asset
value may differ from quoted or published prices for the same securities. Investments in Vanguard
Market Liquidity Fund are valued at that fund’s net asset value. Temporary cash investments acquired
over 60 days to maturity are valued using the latest bid prices or using valuations based on a matrix
system (which considers such factors as security prices, yields, maturities, and ratings), both as
furnished by independent pricing services. Other temporary cash investments are valued at amortized
cost, which approximates market value.
B. Foreign Currency: Securities and other assets and liabilities denominated in foreign currencies are
translated into U.S. dollars using exchange rates obtained from an independent third party as of the
fund's pricing time on the valuation date. Realized gains (losses) and unrealized appreciation
(depreciation) on investment securities include the effects of changes in exchange rates since the
securities were purchased, combined with the effects of changes in security prices. Fluctuations in the
value of other assets and liabilities resulting from changes in exchange rates are recorded as
unrealized foreign currency gains (losses) until the assets or liabilities are settled in cash, at which
time they are recorded as realized foreign currency gains (losses).
C. Various inputs may be used to determine the value of the fund's investments. These inputs are
summarized in three broad levels for financial statement purposes. The inputs or methodologies used
to value securities are not necessarily an indication of the risk associated with investing in those
securities.
Level 1—Quoted prices in active markets for identical securities.
Level 2—Other significant observable inputs (including quoted prices for similar securities, interest
rates, prepayment speeds, credit risk, etc.).
Level 3—Significant unobservable inputs (including the fund's own assumptions used to determine
the fair value of investments).
The following table summarizes the market value of the fund's investments as of January 31, 2014,
based on the inputs used to value them:
Investments
Level 1
($000 )
Level 2
($000 )
Level 3
($000 )
Common Stocks—North and South America 1,724,221 268,839 —
Common Stocks—Other 310,152 17,511,309 230
Temporary Cash Investments 380,663 9,301 —
Futures Contracts—Liabilities1 (255 ) — —
Forward Currency Contracts—Assets — 444 —
Forward Currency Contracts—Liabilities — (591 ) —
Total 2,414,781 17,789,302 230
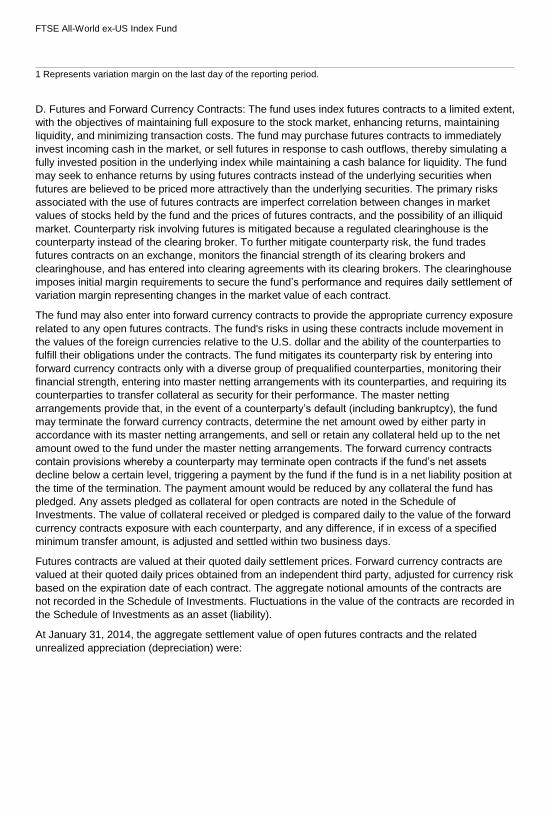
FTSE All-World ex-US Index Fund
1 Represents variation margin on the last day of the reporting period.
D. Futures and Forward Currency Contracts: The fund uses index futures contracts to a limited extent,
with the objectives of maintaining full exposure to the stock market, enhancing returns, maintaining
liquidity, and minimizing transaction costs. The fund may purchase futures contracts to immediately
invest incoming cash in the market, or sell futures in response to cash outflows, thereby simulating a
fully invested position in the underlying index while maintaining a cash balance for liquidity. The fund
may seek to enhance returns by using futures contracts instead of the underlying securities when
futures are believed to be priced more attractively than the underlying securities. The primary risks
associated with the use of futures contracts are imperfect correlation between changes in market
values of stocks held by the fund and the prices of futures contracts, and the possibility of an illiquid
market. Counterparty risk involving futures is mitigated because a regulated clearinghouse is the
counterparty instead of the clearing broker. To further mitigate counterparty risk, the fund trades
futures contracts on an exchange, monitors the financial strength of its clearing brokers and
clearinghouse, and has entered into clearing agreements with its clearing brokers. The clearinghouse
imposes initial margin requirements to secure the fund’s performance and requires daily settlement of
variation margin representing changes in the market value of each contract.
The fund may also enter into forward currency contracts to provide the appropriate currency exposure
related to any open futures contracts. The fund's risks in using these contracts include movement in
the values of the foreign currencies relative to the U.S. dollar and the ability of the counterparties to
fulfill their obligations under the contracts. The fund mitigates its counterparty risk by entering into
forward currency contracts only with a diverse group of prequalified counterparties, monitoring their
financial strength, entering into master netting arrangements with its counterparties, and requiring its
counterparties to transfer collateral as security for their performance. The master netting
arrangements provide that, in the event of a counterparty’s default (including bankruptcy), the fund
may terminate the forward currency contracts, determine the net amount owed by either party in
accordance with its master netting arrangements, and sell or retain any collateral held up to the net
amount owed to the fund under the master netting arrangements. The forward currency contracts
contain provisions whereby a counterparty may terminate open contracts if the fund’s net assets
decline below a certain level, triggering a payment by the fund if the fund is in a net liability position at
the time of the termination. The payment amount would be reduced by any collateral the fund has
pledged. Any assets pledged as collateral for open contracts are noted in the Schedule of
Investments. The value of collateral received or pledged is compared daily to the value of the forward
currency contracts exposure with each counterparty, and any difference, if in excess of a specified
minimum transfer amount, is adjusted and settled within two business days.
Futures contracts are valued at their quoted daily settlement prices. Forward currency contracts are
valued at their quoted daily prices obtained from an independent third party, adjusted for currency risk
based on the expiration date of each contract. The aggregate notional amounts of the contracts are
not recorded in the Schedule of Investments. Fluctuations in the value of the contracts are recorded in
the Schedule of Investments as an asset (liability).
At January 31, 2014, the aggregate settlement value of open futures contracts and the related
unrealized appreciation (depreciation) were:

FTSE All-World ex-US Index Fund
($000 )
Futures Contracts Expiration
Number of
Long (Short
Contracts
)
Aggregate
Settlement
Value Long
(Short)
Unrealized
Appreciation
(Depreciation )
FTSE 100 Index March 2014 250 26,536 (90 )
Dow Jones EURO STOXX 50 March 2014 556 22,629 276
Topix Index March 2014 145 17,274 (633 )
S&P ASX 200 Index March 2014 98 10,994 31
(416 )
Unrealized appreciation (depreciation) on open FTSE 100 Index and Dow Jones EURO STOXX 50
Index futures contracts are required to be treated as realized gain (loss) for tax purposes.
At January 31, 2014, the fund had open forward currency contracts to receive and deliver currencies
as follows. Unrealized appreciation (depreciation) on open forward currency contracts is treated as
realized gain (loss) for tax purposes. Contract Amount (000)
Counterparty
Contract
Settlement
Date Receive Deliver
Unrealized
Appreciation
(Depreciation
($000
)
)
UBS AG 3/26/14 GBP 15,898 USD 25,873 252
UBS AG 3/26/14 EUR 16,102 USD 22,122 (405 )
UBS AG 3/18/14 JPY 1,801,717 USD 17,446 192
UBS AG 3/25/14 AUD 12,422 USD 11,019 (186 )
(147 )
AUD—Australian dollar.
EUR—Euro.
GBP—British pound.
JPY—Japanese yen.
USD—U.S. dollar.
E. At January 31, 2014, the cost of investment securities for tax purposes was $18,061,778,000. Net
unrealized appreciation of investment securities for tax purposes was $2,142,937,000, consisting of
unrealized gains of $3,613,511,000 on securities that had risen in value since their purchase and
$1,470,574,000 in unrealized losses on securities that had fallen in value since their purchase.
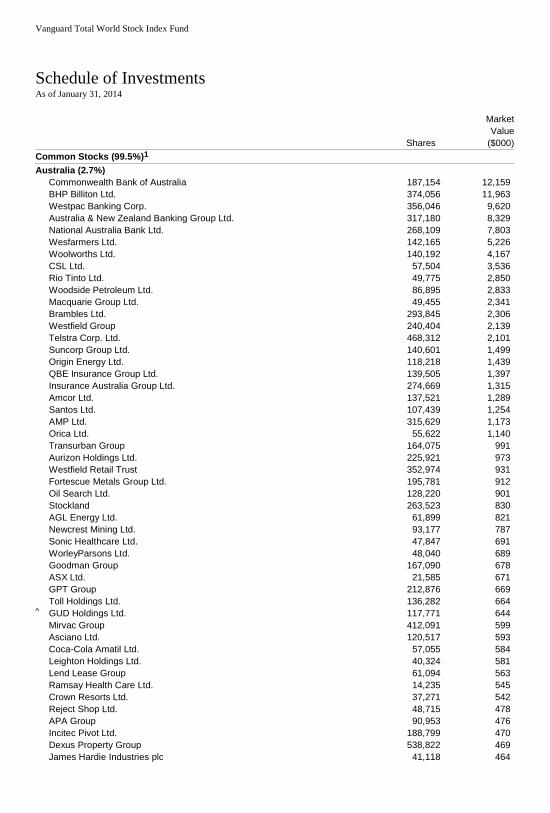
Vanguard Total World Stock Index Fund
Schedule of Investments As of January 31, 2014
Shares
Market
Value
($000)
Common Stocks (99.5%)1
Australia (2.7%)
Commonwealth Bank of Australia 187,154 12,159 BHP Billiton Ltd. 374,056 11,963 Westpac Banking Corp. 356,046 9,620 Australia & New Zealand Banking Group Ltd. 317,180 8,329 National Australia Bank Ltd. 268,109 7,803 Wesfarmers Ltd. 142,165 5,226 Woolworths Ltd. 140,192 4,167 CSL Ltd. 57,504 3,536 Rio Tinto Ltd. 49,775 2,850 Woodside Petroleum Ltd. 86,895 2,833 Macquarie Group Ltd. 49,455 2,341 Brambles Ltd. 293,845 2,306 Westfield Group 240,404 2,139 Telstra Corp. Ltd. 468,312 2,101 Suncorp Group Ltd. 140,601 1,499 Origin Energy Ltd. 118,218 1,439 QBE Insurance Group Ltd. 139,505 1,397 Insurance Australia Group Ltd. 274,669 1,315 Amcor Ltd. 137,521 1,289 Santos Ltd. 107,439 1,254 AMP Ltd. 315,629 1,173 Orica Ltd. 55,622 1,140 Transurban Group 164,075 991 Aurizon Holdings Ltd. 225,921 973 Westfield Retail Trust 352,974 931 Fortescue Metals Group Ltd. 195,781 912 Oil Search Ltd. 128,220 901 Stockland 263,523 830 AGL Energy Ltd. 61,899 821 Newcrest Mining Ltd. 93,177 787 Sonic Healthcare Ltd. 47,847 691 WorleyParsons Ltd. 48,040 689 Goodman Group 167,090 678 ASX Ltd. 21,585 671 GPT Group 212,876 669 Toll Holdings Ltd. 136,282 664 ^ GUD Holdings Ltd. 117,771 644 Mirvac Group 412,091 599 Asciano Ltd. 120,517 593 Coca-Cola Amatil Ltd. 57,055 584 Leighton Holdings Ltd. 40,324 581 Lend Lease Group 61,094 563 Ramsay Health Care Ltd. 14,235 545 Crown Resorts Ltd. 37,271 542 Reject Shop Ltd. 48,715 478 APA Group 90,953 476 Incitec Pivot Ltd. 188,799 470 Dexus Property Group 538,822 469 James Hardie Industries plc 41,118 464
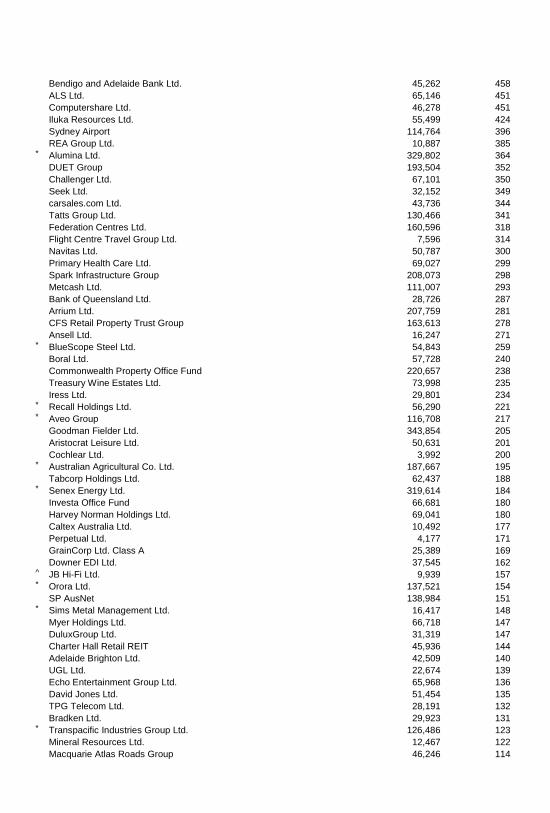
Bendigo and Adelaide Bank Ltd. 45,262 458 ALS Ltd. 65,146 451 Computershare Ltd. 46,278 451 Iluka Resources Ltd. 55,499 424 Sydney Airport 114,764 396 REA Group Ltd. 10,887 385 * Alumina Ltd. 329,802 364 DUET Group 193,504 352 Challenger Ltd. 67,101 350 Seek Ltd. 32,152 349 carsales.com Ltd. 43,736 344 Tatts Group Ltd. 130,466 341 Federation Centres Ltd. 160,596 318 Flight Centre Travel Group Ltd. 7,596 314 Navitas Ltd. 50,787 300 Primary Health Care Ltd. 69,027 299 Spark Infrastructure Group 208,073 298 Metcash Ltd. 111,007 293 Bank of Queensland Ltd. 28,726 287 Arrium Ltd. 207,759 281 CFS Retail Property Trust Group 163,613 278 Ansell Ltd. 16,247 271 * BlueScope Steel Ltd. 54,843 259 Boral Ltd. 57,728 240 Commonwealth Property Office Fund 220,657 238 Treasury Wine Estates Ltd. 73,998 235 Iress Ltd. 29,801 234 * Recall Holdings Ltd. 56,290 221 * Aveo Group 116,708 217 Goodman Fielder Ltd. 343,854 205 Aristocrat Leisure Ltd. 50,631 201 Cochlear Ltd. 3,992 200 * Australian Agricultural Co. Ltd. 187,667 195 Tabcorp Holdings Ltd. 62,437 188 * Senex Energy Ltd. 319,614 184 Investa Office Fund 66,681 180 Harvey Norman Holdings Ltd. 69,041 180 Caltex Australia Ltd. 10,492 177 Perpetual Ltd. 4,177 171 GrainCorp Ltd. Class A 25,389 169 Downer EDI Ltd. 37,545 162 ^ JB Hi-Fi Ltd. 9,939 157 * Orora Ltd. 137,521 154 SP AusNet 138,984 151 * Sims Metal Management Ltd. 16,417 148 Myer Holdings Ltd. 66,718 147 DuluxGroup Ltd. 31,319 147 Charter Hall Retail REIT 45,936 144 Adelaide Brighton Ltd. 42,509 140 UGL Ltd. 22,674 139 Echo Entertainment Group Ltd. 65,968 136 David Jones Ltd. 51,454 135 TPG Telecom Ltd. 28,191 132 Bradken Ltd. 29,923 131 * Transpacific Industries Group Ltd. 126,486 123 Mineral Resources Ltd. 12,467 122 Macquarie Atlas Roads Group 46,246 114
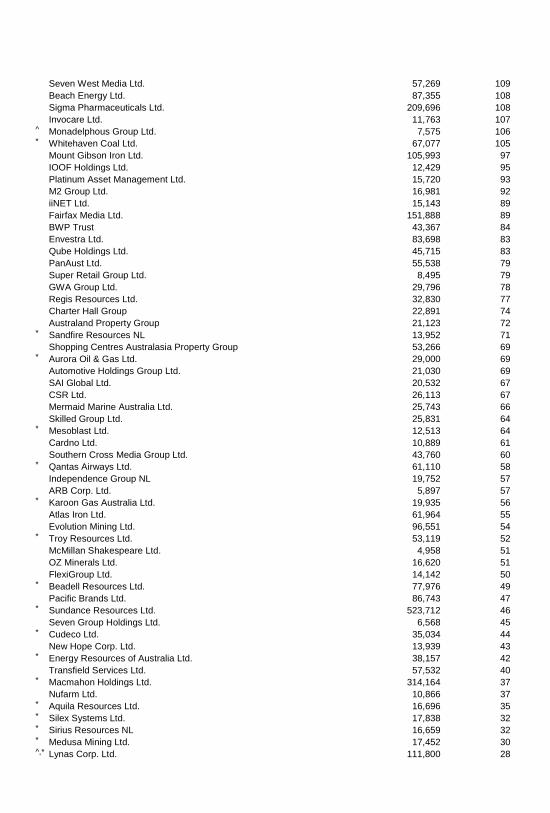
Seven West Media Ltd. 57,269 109 Beach Energy Ltd. 87,355 108 Sigma Pharmaceuticals Ltd. 209,696 108 Invocare Ltd. 11,763 107 ^ Monadelphous Group Ltd. 7,575 106 * Whitehaven Coal Ltd. 67,077 105 Mount Gibson Iron Ltd. 105,993 97 IOOF Holdings Ltd. 12,429 95 Platinum Asset Management Ltd. 15,720 93 M2 Group Ltd. 16,981 92 iiNET Ltd. 15,143 89 Fairfax Media Ltd. 151,888 89 BWP Trust 43,367 84 Envestra Ltd. 83,698 83 Qube Holdings Ltd. 45,715 83 PanAust Ltd. 55,538 79 Super Retail Group Ltd. 8,495 79 GWA Group Ltd. 29,796 78 Regis Resources Ltd. 32,830 77 Charter Hall Group 22,891 74 Australand Property Group 21,123 72 * Sandfire Resources NL 13,952 71 Shopping Centres Australasia Property Group 53,266 69 * Aurora Oil & Gas Ltd. 29,000 69 Automotive Holdings Group Ltd. 21,030 69 SAI Global Ltd. 20,532 67 CSR Ltd. 26,113 67 Mermaid Marine Australia Ltd. 25,743 66 Skilled Group Ltd. 25,831 64 * Mesoblast Ltd. 12,513 64 Cardno Ltd. 10,889 61 Southern Cross Media Group Ltd. 43,760 60 * Qantas Airways Ltd. 61,110 58 Independence Group NL 19,752 57 ARB Corp. Ltd. 5,897 57 * Karoon Gas Australia Ltd. 19,935 56 Atlas Iron Ltd. 61,964 55 Evolution Mining Ltd. 96,551 54 * Troy Resources Ltd. 53,119 52 McMillan Shakespeare Ltd. 4,958 51 OZ Minerals Ltd. 16,620 51 FlexiGroup Ltd. 14,142 50 * Beadell Resources Ltd. 77,976 49 Pacific Brands Ltd. 86,743 47 * Sundance Resources Ltd. 523,712 46 Seven Group Holdings Ltd. 6,568 45 * Cudeco Ltd. 35,034 44 New Hope Corp. Ltd. 13,939 43 * Energy Resources of Australia Ltd. 38,157 42 Transfield Services Ltd. 57,532 40 * Macmahon Holdings Ltd. 314,164 37 Nufarm Ltd. 10,866 37 * Aquila Resources Ltd. 16,696 35 * Silex Systems Ltd. 17,838 32 * Sirius Resources NL 16,659 32 * Medusa Mining Ltd. 17,452 30 ^,* Lynas Corp. Ltd. 111,800 28

NRW Holdings Ltd. 24,486 27 * Resolute Mining Ltd. 53,798 26 * Energy World Corp. Ltd. 66,725 21 * Drillsearch Energy Ltd. 16,393 21 * Ten Network Holdings Ltd. 66,725 21 * Paladin Energy Ltd. 42,266 19 ^ Boart Longyear Ltd. 41,694 17 * Silver Lake Resources Ltd. 31,731 17 Ausdrill Ltd. 19,488 15 * Perseus Mining Ltd. 36,239 12 * Billabong International Ltd. 20,048 11 ^,* Coalspur Mines Ltd. 29,796 8 _____________
123,752
Austria (0.1%)
Voestalpine AG 28,692 1,286 Erste Group Bank AG 30,841 1,120 OMV AG 16,201 701 IMMOFINANZ AG 108,616 510 Andritz AG 8,191 450 Wienerberger AG 20,167 317 Atrium European Real Estate Ltd. 41,152 231 Vienna Insurance Group AG Wiener Versicherung Gruppe 4,320 204 Telekom Austria AG 17,373 151 Schoeller-Bleckmann Oilfield Equipment AG 1,440 151 ^ Raiffeisen Bank International AG 3,547 136 Oesterreichische Post AG 2,849 131 CA Immobilien Anlagen AG 6,058 105 Mayr Melnhof Karton AG 708 86 RHI AG 2,157 71 Verbund AG 3,189 67 Strabag SE 1,787 53 _____________
5,770
Belgium (0.4%)
Anheuser-Busch InBev NV 95,260 9,136 KBC Groep NV 29,586 1,746 Ageas 39,088 1,679 Umicore SA 38,292 1,639 UCB SA 12,339 873 Solvay SA Class A 5,545 775 Delhaize Group SA 10,338 664 Groupe Bruxelles Lambert SA 6,546 591 Sofina SA 3,883 448 Recticel SA 47,797 438 Belgacom SA 14,271 408 Colruyt SA 5,164 293 Ackermans & van Haaren NV 2,684 290 EVS Broadcast Equipment SA 4,620 277 Telenet Group Holding NV 4,319 256 Cofinimmo 1,856 216 * bpost SA 9,693 189 Befimmo SA 2,451 167 Cie d'Entreprises CFE 1,711 150 Melexis NV 3,442 119 ^,* ThromboGenics NV 4,042 102 D'ieteren SA 1,939 93 ^ Nyrstar (Voting Shares) 21,066 81
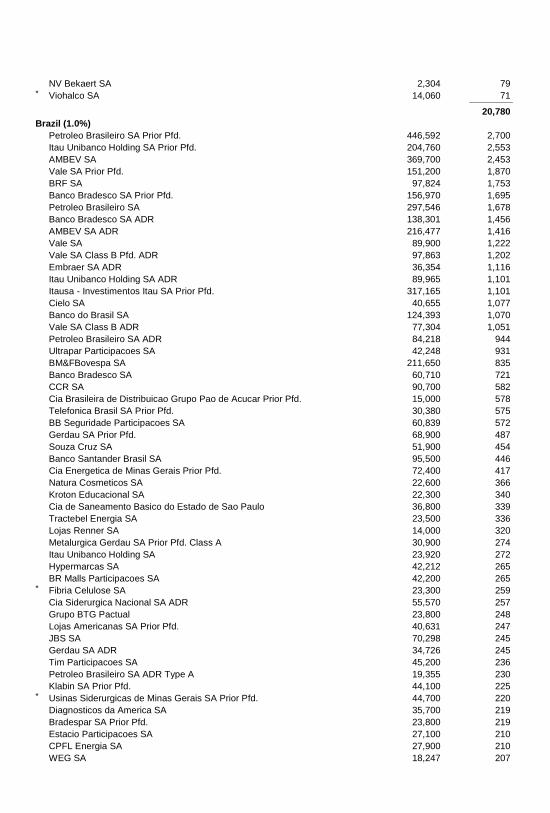
NV Bekaert SA 2,304 79 * Viohalco SA 14,060 71 _____________
20,780
Brazil (1.0%)
Petroleo Brasileiro SA Prior Pfd. 446,592 2,700 Itau Unibanco Holding SA Prior Pfd. 204,760 2,553 AMBEV SA 369,700 2,453 Vale SA Prior Pfd. 151,200 1,870 BRF SA 97,824 1,753 Banco Bradesco SA Prior Pfd. 156,970 1,695 Petroleo Brasileiro SA 297,546 1,678 Banco Bradesco SA ADR 138,301 1,456 AMBEV SA ADR 216,477 1,416 Vale SA 89,900 1,222 Vale SA Class B Pfd. ADR 97,863 1,202 Embraer SA ADR 36,354 1,116 Itau Unibanco Holding SA ADR 89,965 1,101 Itausa - Investimentos Itau SA Prior Pfd. 317,165 1,101 Cielo SA 40,655 1,077 Banco do Brasil SA 124,393 1,070 Vale SA Class B ADR 77,304 1,051 Petroleo Brasileiro SA ADR 84,218 944 Ultrapar Participacoes SA 42,248 931 BM&FBovespa SA 211,650 835 Banco Bradesco SA 60,710 721 CCR SA 90,700 582 Cia Brasileira de Distribuicao Grupo Pao de Acucar Prior Pfd. 15,000 578 Telefonica Brasil SA Prior Pfd. 30,380 575 BB Seguridade Participacoes SA 60,839 572 Gerdau SA Prior Pfd. 68,900 487 Souza Cruz SA 51,900 454 Banco Santander Brasil SA 95,500 446 Cia Energetica de Minas Gerais Prior Pfd. 72,400 417 Natura Cosmeticos SA 22,600 366 Kroton Educacional SA 22,300 340 Cia de Saneamento Basico do Estado de Sao Paulo 36,800 339 Tractebel Energia SA 23,500 336 Lojas Renner SA 14,000 320 Metalurgica Gerdau SA Prior Pfd. Class A 30,900 274 Itau Unibanco Holding SA 23,920 272 Hypermarcas SA 42,212 265 BR Malls Participacoes SA 42,200 265 * Fibria Celulose SA 23,300 259 Cia Siderurgica Nacional SA ADR 55,570 257 Grupo BTG Pactual 23,800 248 Lojas Americanas SA Prior Pfd. 40,631 247 JBS SA 70,298 245 Gerdau SA ADR 34,726 245 Tim Participacoes SA 45,200 236 Petroleo Brasileiro SA ADR Type A 19,355 230 Klabin SA Prior Pfd. 44,100 225 * Usinas Siderurgicas de Minas Gerais SA Prior Pfd. 44,700 220 Diagnosticos da America SA 35,700 219 Bradespar SA Prior Pfd. 23,800 219 Estacio Participacoes SA 27,100 210 CPFL Energia SA 27,900 210 WEG SA 18,247 207
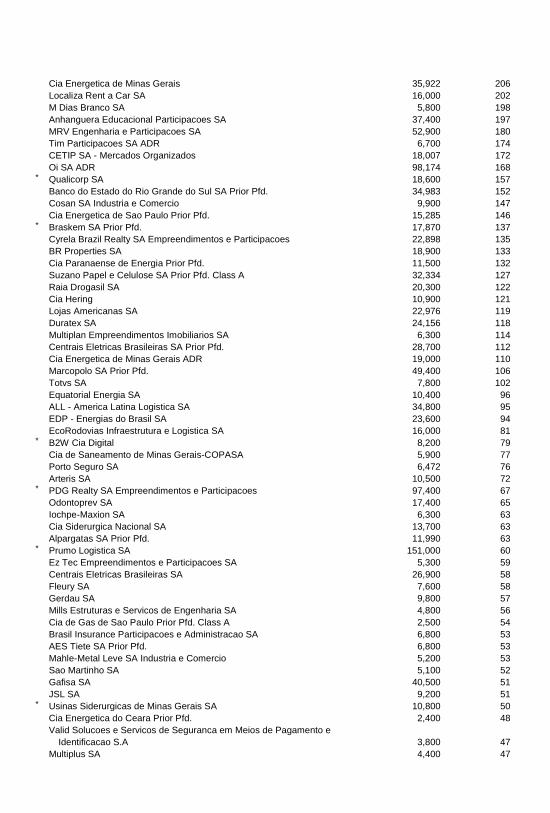
Cia Energetica de Minas Gerais 35,922 206 Localiza Rent a Car SA 16,000 202 M Dias Branco SA 5,800 198 Anhanguera Educacional Participacoes SA 37,400 197 MRV Engenharia e Participacoes SA 52,900 180 Tim Participacoes SA ADR 6,700 174 CETIP SA - Mercados Organizados 18,007 172 Oi SA ADR 98,174 168 * Qualicorp SA 18,600 157 Banco do Estado do Rio Grande do Sul SA Prior Pfd. 34,983 152 Cosan SA Industria e Comercio 9,900 147 Cia Energetica de Sao Paulo Prior Pfd. 15,285 146 * Braskem SA Prior Pfd. 17,870 137 Cyrela Brazil Realty SA Empreendimentos e Participacoes 22,898 135 BR Properties SA 18,900 133 Cia Paranaense de Energia Prior Pfd. 11,500 132 Suzano Papel e Celulose SA Prior Pfd. Class A 32,334 127 Raia Drogasil SA 20,300 122 Cia Hering 10,900 121 Lojas Americanas SA 22,976 119 Duratex SA 24,156 118 Multiplan Empreendimentos Imobiliarios SA 6,300 114 Centrais Eletricas Brasileiras SA Prior Pfd. 28,700 112 Cia Energetica de Minas Gerais ADR 19,000 110 Marcopolo SA Prior Pfd. 49,400 106 Totvs SA 7,800 102 Equatorial Energia SA 10,400 96 ALL - America Latina Logistica SA 34,800 95 EDP - Energias do Brasil SA 23,600 94 EcoRodovias Infraestrutura e Logistica SA 16,000 81 * B2W Cia Digital 8,200 79 Cia de Saneamento de Minas Gerais-COPASA 5,900 77 Porto Seguro SA 6,472 76 Arteris SA 10,500 72 * PDG Realty SA Empreendimentos e Participacoes 97,400 67 Odontoprev SA 17,400 65 Iochpe-Maxion SA 6,300 63 Cia Siderurgica Nacional SA 13,700 63 Alpargatas SA Prior Pfd. 11,990 63 * Prumo Logistica SA 151,000 60 Ez Tec Empreendimentos e Participacoes SA 5,300 59 Centrais Eletricas Brasileiras SA 26,900 58 Fleury SA 7,600 58 Gerdau SA 9,800 57 Mills Estruturas e Servicos de Engenharia SA 4,800 56 Cia de Gas de Sao Paulo Prior Pfd. Class A 2,500 54 Brasil Insurance Participacoes e Administracao SA 6,800 53 AES Tiete SA Prior Pfd. 6,800 53 Mahle-Metal Leve SA Industria e Comercio 5,200 53 Sao Martinho SA 5,100 52 Gafisa SA 40,500 51 JSL SA 9,200 51 * Usinas Siderurgicas de Minas Gerais SA 10,800 50 Cia Energetica do Ceara Prior Pfd. 2,400 48 Valid Solucoes e Servicos de Seguranca em Meios de Pagamento e
Identificacao S.A 3,800 47 Multiplus SA 4,400 47
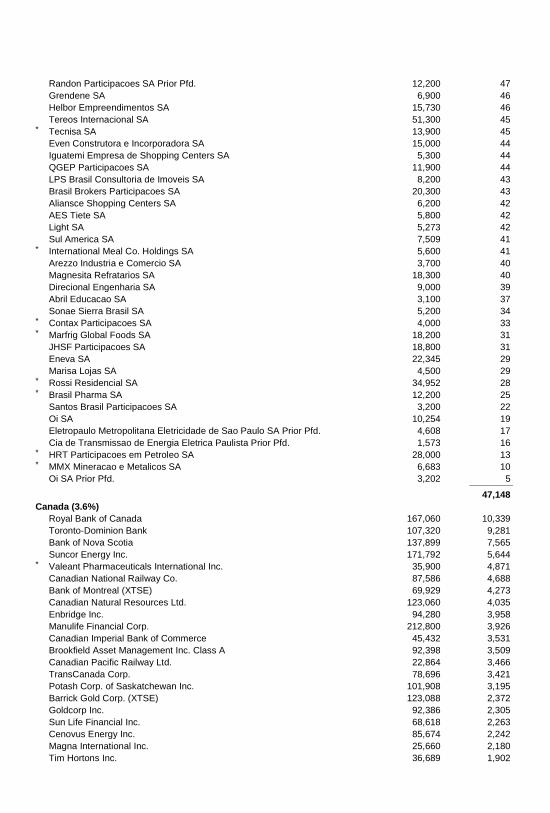
Randon Participacoes SA Prior Pfd. 12,200 47 Grendene SA 6,900 46 Helbor Empreendimentos SA 15,730 46 Tereos Internacional SA 51,300 45 * Tecnisa SA 13,900 45 Even Construtora e Incorporadora SA 15,000 44 Iguatemi Empresa de Shopping Centers SA 5,300 44 QGEP Participacoes SA 11,900 44 LPS Brasil Consultoria de Imoveis SA 8,200 43 Brasil Brokers Participacoes SA 20,300 43 Aliansce Shopping Centers SA 6,200 42 AES Tiete SA 5,800 42 Light SA 5,273 42 Sul America SA 7,509 41 * International Meal Co. Holdings SA 5,600 41 Arezzo Industria e Comercio SA 3,700 40 Magnesita Refratarios SA 18,300 40 Direcional Engenharia SA 9,000 39 Abril Educacao SA 3,100 37 Sonae Sierra Brasil SA 5,200 34 * Contax Participacoes SA 4,000 33 * Marfrig Global Foods SA 18,200 31 JHSF Participacoes SA 18,800 31 Eneva SA 22,345 29 Marisa Lojas SA 4,500 29 * Rossi Residencial SA 34,952 28 * Brasil Pharma SA 12,200 25 Santos Brasil Participacoes SA 3,200 22 Oi SA 10,254 19 Eletropaulo Metropolitana Eletricidade de Sao Paulo SA Prior Pfd. 4,608 17 Cia de Transmissao de Energia Eletrica Paulista Prior Pfd. 1,573 16 * HRT Participacoes em Petroleo SA 28,000 13 * MMX Mineracao e Metalicos SA 6,683 10 Oi SA Prior Pfd. 3,202 5 _____________
47,148
Canada (3.6%)
Royal Bank of Canada 167,060 10,339 Toronto-Dominion Bank 107,320 9,281 Bank of Nova Scotia 137,899 7,565 Suncor Energy Inc. 171,792 5,644 * Valeant Pharmaceuticals International Inc. 35,900 4,871 Canadian National Railway Co. 87,586 4,688 Bank of Montreal (XTSE) 69,929 4,273 Canadian Natural Resources Ltd. 123,060 4,035 Enbridge Inc. 94,280 3,958 Manulife Financial Corp. 212,800 3,926 Canadian Imperial Bank of Commerce 45,432 3,531 Brookfield Asset Management Inc. Class A 92,398 3,509 Canadian Pacific Railway Ltd. 22,864 3,466 TransCanada Corp. 78,696 3,421 Potash Corp. of Saskatchewan Inc. 101,908 3,195 Barrick Gold Corp. (XTSE) 123,088 2,372 Goldcorp Inc. 92,386 2,305 Sun Life Financial Inc. 68,618 2,263 Cenovus Energy Inc. 85,674 2,242 Magna International Inc. 25,660 2,180 Tim Hortons Inc. 36,689 1,902
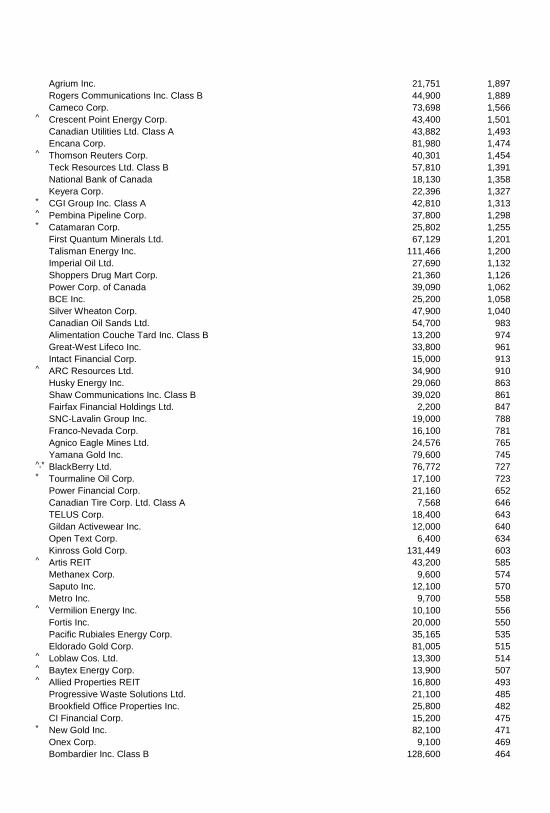
Agrium Inc. 21,751 1,897 Rogers Communications Inc. Class B 44,900 1,889 Cameco Corp. 73,698 1,566 ^ Crescent Point Energy Corp. 43,400 1,501 Canadian Utilities Ltd. Class A 43,882 1,493 Encana Corp. 81,980 1,474 ^ Thomson Reuters Corp. 40,301 1,454 Teck Resources Ltd. Class B 57,810 1,391 National Bank of Canada 18,130 1,358 Keyera Corp. 22,396 1,327 * CGI Group Inc. Class A 42,810 1,313 ^ Pembina Pipeline Corp. 37,800 1,298 * Catamaran Corp. 25,802 1,255 First Quantum Minerals Ltd. 67,129 1,201 Talisman Energy Inc. 111,466 1,200 Imperial Oil Ltd. 27,690 1,132 Shoppers Drug Mart Corp. 21,360 1,126 Power Corp. of Canada 39,090 1,062 BCE Inc. 25,200 1,058 Silver Wheaton Corp. 47,900 1,040 Canadian Oil Sands Ltd. 54,700 983 Alimentation Couche Tard Inc. Class B 13,200 974 Great-West Lifeco Inc. 33,800 961 Intact Financial Corp. 15,000 913 ^ ARC Resources Ltd. 34,900 910 Husky Energy Inc. 29,060 863 Shaw Communications Inc. Class B 39,020 861 Fairfax Financial Holdings Ltd. 2,200 847 SNC-Lavalin Group Inc. 19,000 788 Franco-Nevada Corp. 16,100 781 Agnico Eagle Mines Ltd. 24,576 765 Yamana Gold Inc. 79,600 745 ^,* BlackBerry Ltd. 76,772 727 * Tourmaline Oil Corp. 17,100 723 Power Financial Corp. 21,160 652 Canadian Tire Corp. Ltd. Class A 7,568 646 TELUS Corp. 18,400 643 Gildan Activewear Inc. 12,000 640 Open Text Corp. 6,400 634 Kinross Gold Corp. 131,449 603 ^ Artis REIT 43,200 585 Methanex Corp. 9,600 574 Saputo Inc. 12,100 570 Metro Inc. 9,700 558 ^ Vermilion Energy Inc. 10,100 556 Fortis Inc. 20,000 550 Pacific Rubiales Energy Corp. 35,165 535 Eldorado Gold Corp. 81,005 515 ^ Loblaw Cos. Ltd. 13,300 514 ^ Baytex Energy Corp. 13,900 507 ^ Allied Properties REIT 16,800 493 Progressive Waste Solutions Ltd. 21,100 485 Brookfield Office Properties Inc. 25,800 482 CI Financial Corp. 15,200 475 * New Gold Inc. 82,100 471 Onex Corp. 9,100 469 Bombardier Inc. Class B 128,600 464
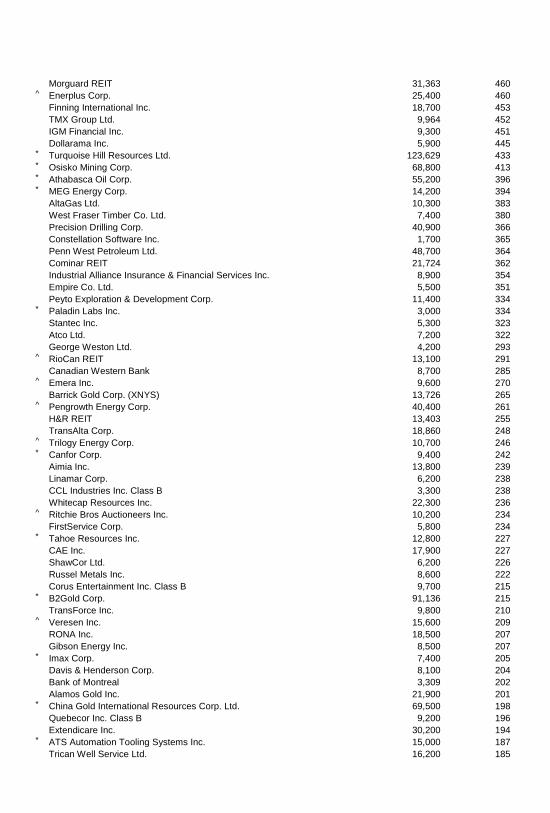
Morguard REIT 31,363 460 ^ Enerplus Corp. 25,400 460 Finning International Inc. 18,700 453 TMX Group Ltd. 9,964 452 IGM Financial Inc. 9,300 451 Dollarama Inc. 5,900 445 * Turquoise Hill Resources Ltd. 123,629 433 * Osisko Mining Corp. 68,800 413 * Athabasca Oil Corp. 55,200 396 * MEG Energy Corp. 14,200 394 AltaGas Ltd. 10,300 383 West Fraser Timber Co. Ltd. 7,400 380 Precision Drilling Corp. 40,900 366 Constellation Software Inc. 1,700 365 Penn West Petroleum Ltd. 48,700 364 Cominar REIT 21,724 362 Industrial Alliance Insurance & Financial Services Inc. 8,900 354 Empire Co. Ltd. 5,500 351 Peyto Exploration & Development Corp. 11,400 334 * Paladin Labs Inc. 3,000 334 Stantec Inc. 5,300 323 Atco Ltd. 7,200 322 George Weston Ltd. 4,200 293 ^ RioCan REIT 13,100 291 Canadian Western Bank 8,700 285 ^ Emera Inc. 9,600 270 Barrick Gold Corp. (XNYS) 13,726 265 ^ Pengrowth Energy Corp. 40,400 261 H&R REIT 13,403 255 TransAlta Corp. 18,860 248 ^ Trilogy Energy Corp. 10,700 246 * Canfor Corp. 9,400 242 Aimia Inc. 13,800 239 Linamar Corp. 6,200 238 CCL Industries Inc. Class B 3,300 238 Whitecap Resources Inc. 22,300 236 ^ Ritchie Bros Auctioneers Inc. 10,200 234 FirstService Corp. 5,800 234 * Tahoe Resources Inc. 12,800 227 CAE Inc. 17,900 227 ShawCor Ltd. 6,200 226 Russel Metals Inc. 8,600 222 Corus Entertainment Inc. Class B 9,700 215 * B2Gold Corp. 91,136 215 TransForce Inc. 9,800 210 ^ Veresen Inc. 15,600 209 RONA Inc. 18,500 207 Gibson Energy Inc. 8,500 207 * Imax Corp. 7,400 205 Davis & Henderson Corp. 8,100 204 Bank of Montreal 3,309 202 Alamos Gold Inc. 21,900 201 * China Gold International Resources Corp. Ltd. 69,500 198 Quebecor Inc. Class B 9,200 196 Extendicare Inc. 30,200 194 * ATS Automation Tooling Systems Inc. 15,000 187 Trican Well Service Ltd. 16,200 185
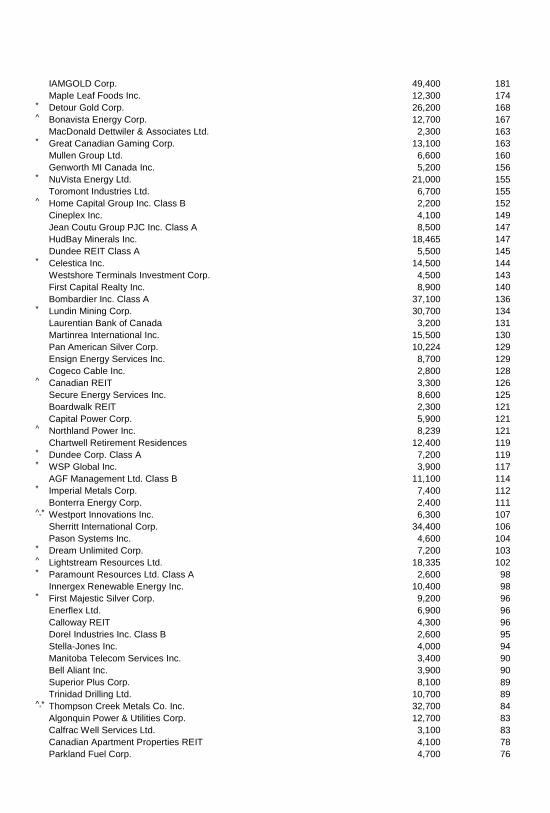
IAMGOLD Corp. 49,400 181 Maple Leaf Foods Inc. 12,300 174 * Detour Gold Corp. 26,200 168 ^ Bonavista Energy Corp. 12,700 167 MacDonald Dettwiler & Associates Ltd. 2,300 163 * Great Canadian Gaming Corp. 13,100 163 Mullen Group Ltd. 6,600 160 Genworth MI Canada Inc. 5,200 156 * NuVista Energy Ltd. 21,000 155 Toromont Industries Ltd. 6,700 155 ^ Home Capital Group Inc. Class B 2,200 152 Cineplex Inc. 4,100 149 Jean Coutu Group PJC Inc. Class A 8,500 147 HudBay Minerals Inc. 18,465 147 Dundee REIT Class A 5,500 145 * Celestica Inc. 14,500 144 Westshore Terminals Investment Corp. 4,500 143 First Capital Realty Inc. 8,900 140 Bombardier Inc. Class A 37,100 136 * Lundin Mining Corp. 30,700 134 Laurentian Bank of Canada 3,200 131 Martinrea International Inc. 15,500 130 Pan American Silver Corp. 10,224 129 Ensign Energy Services Inc. 8,700 129 Cogeco Cable Inc. 2,800 128 ^ Canadian REIT 3,300 126 Secure Energy Services Inc. 8,600 125 Boardwalk REIT 2,300 121 Capital Power Corp. 5,900 121 ^ Northland Power Inc. 8,239 121 Chartwell Retirement Residences 12,400 119 * Dundee Corp. Class A 7,200 119 * WSP Global Inc. 3,900 117 AGF Management Ltd. Class B 11,100 114 * Imperial Metals Corp. 7,400 112 Bonterra Energy Corp. 2,400 111 ^,* Westport Innovations Inc. 6,300 107 Sherritt International Corp. 34,400 106 Pason Systems Inc. 4,600 104 * Dream Unlimited Corp. 7,200 103 ^ Lightstream Resources Ltd. 18,335 102 * Paramount Resources Ltd. Class A 2,600 98 Innergex Renewable Energy Inc. 10,400 98 * First Majestic Silver Corp. 9,200 96 Enerflex Ltd. 6,900 96 Calloway REIT 4,300 96 Dorel Industries Inc. Class B 2,600 95 Stella-Jones Inc. 4,000 94 Manitoba Telecom Services Inc. 3,400 90 Bell Aliant Inc. 3,900 90 Superior Plus Corp. 8,100 89 Trinidad Drilling Ltd. 10,700 89 ^,* Thompson Creek Metals Co. Inc. 32,700 84 Algonquin Power & Utilities Corp. 12,700 83 Calfrac Well Services Ltd. 3,100 83 Canadian Apartment Properties REIT 4,100 78 Parkland Fuel Corp. 4,700 76
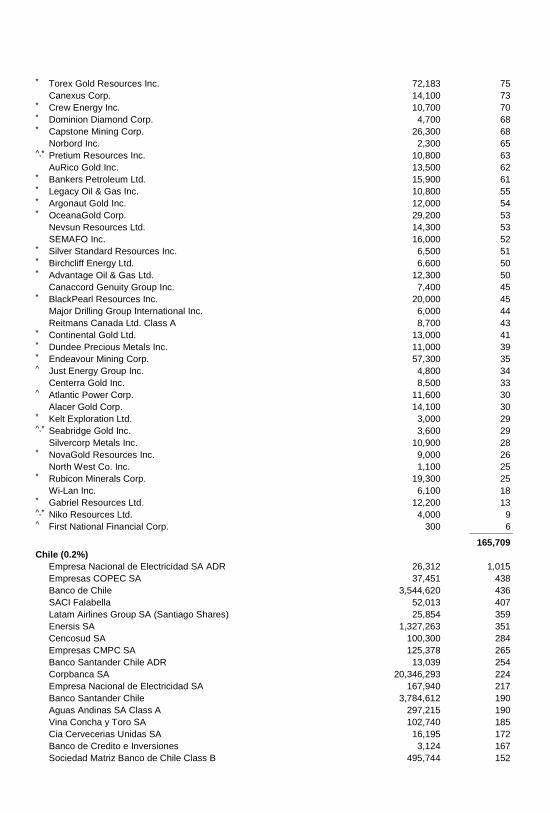
* Torex Gold Resources Inc. 72,183 75 Canexus Corp. 14,100 73 * Crew Energy Inc. 10,700 70 * Dominion Diamond Corp. 4,700 68 * Capstone Mining Corp. 26,300 68 Norbord Inc. 2,300 65 ^,* Pretium Resources Inc. 10,800 63 AuRico Gold Inc. 13,500 62 * Bankers Petroleum Ltd. 15,900 61 * Legacy Oil & Gas Inc. 10,800 55 * Argonaut Gold Inc. 12,000 54 * OceanaGold Corp. 29,200 53 Nevsun Resources Ltd. 14,300 53 SEMAFO Inc. 16,000 52 * Silver Standard Resources Inc. 6,500 51 * Birchcliff Energy Ltd. 6,600 50 * Advantage Oil & Gas Ltd. 12,300 50 Canaccord Genuity Group Inc. 7,400 45 * BlackPearl Resources Inc. 20,000 45 Major Drilling Group International Inc. 6,000 44 Reitmans Canada Ltd. Class A 8,700 43 * Continental Gold Ltd. 13,000 41 * Dundee Precious Metals Inc. 11,000 39 * Endeavour Mining Corp. 57,300 35 ^ Just Energy Group Inc. 4,800 34 Centerra Gold Inc. 8,500 33 ^ Atlantic Power Corp. 11,600 30 Alacer Gold Corp. 14,100 30 * Kelt Exploration Ltd. 3,000 29 ^,* Seabridge Gold Inc. 3,600 29 Silvercorp Metals Inc. 10,900 28 * NovaGold Resources Inc. 9,000 26 North West Co. Inc. 1,100 25 * Rubicon Minerals Corp. 19,300 25 Wi-Lan Inc. 6,100 18 * Gabriel Resources Ltd. 12,200 13 ^,* Niko Resources Ltd. 4,000 9 ^ First National Financial Corp. 300 6 _____________
165,709
Chile (0.2%)
Empresa Nacional de Electricidad SA ADR 26,312 1,015 Empresas COPEC SA 37,451 438 Banco de Chile 3,544,620 436 SACI Falabella 52,013 407 Latam Airlines Group SA (Santiago Shares) 25,854 359 Enersis SA 1,327,263 351 Cencosud SA 100,300 284 Empresas CMPC SA 125,378 265 Banco Santander Chile ADR 13,039 254 Corpbanca SA 20,346,293 224 Empresa Nacional de Electricidad SA 167,940 217 Banco Santander Chile 3,784,612 190 Aguas Andinas SA Class A 297,215 190 Vina Concha y Toro SA 102,740 185 Cia Cervecerias Unidas SA 16,195 172 Banco de Credito e Inversiones 3,124 167 Sociedad Matriz Banco de Chile Class B 495,744 152
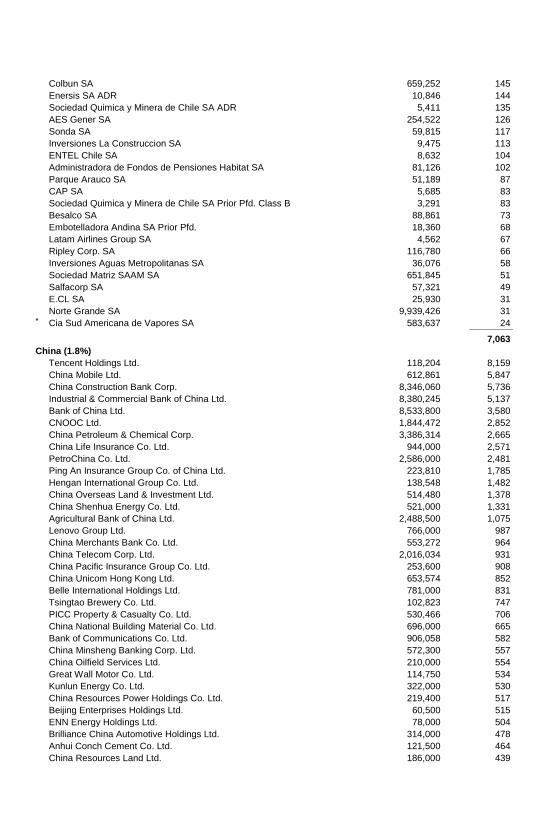
Colbun SA 659,252 145 Enersis SA ADR 10,846 144 Sociedad Quimica y Minera de Chile SA ADR 5,411 135 AES Gener SA 254,522 126 Sonda SA 59,815 117 Inversiones La Construccion SA 9,475 113 ENTEL Chile SA 8,632 104 Administradora de Fondos de Pensiones Habitat SA 81,126 102 Parque Arauco SA 51,189 87 CAP SA 5,685 83 Sociedad Quimica y Minera de Chile SA Prior Pfd. Class B 3,291 83 Besalco SA 88,861 73 Embotelladora Andina SA Prior Pfd. 18,360 68 Latam Airlines Group SA 4,562 67 Ripley Corp. SA 116,780 66 Inversiones Aguas Metropolitanas SA 36,076 58 Sociedad Matriz SAAM SA 651,845 51 Salfacorp SA 57,321 49 E.CL SA 25,930 31 Norte Grande SA 9,939,426 31 * Cia Sud Americana de Vapores SA 583,637 24 _____________
7,063
China (1.8%)
Tencent Holdings Ltd. 118,204 8,159 China Mobile Ltd. 612,861 5,847 China Construction Bank Corp. 8,346,060 5,736 Industrial & Commercial Bank of China Ltd. 8,380,245 5,137 Bank of China Ltd. 8,533,800 3,580 CNOOC Ltd. 1,844,472 2,852 China Petroleum & Chemical Corp. 3,386,314 2,665 China Life Insurance Co. Ltd. 944,000 2,571 PetroChina Co. Ltd. 2,586,000 2,481 Ping An Insurance Group Co. of China Ltd. 223,810 1,785 Hengan International Group Co. Ltd. 138,548 1,482 China Overseas Land & Investment Ltd. 514,480 1,378 China Shenhua Energy Co. Ltd. 521,000 1,331 Agricultural Bank of China Ltd. 2,488,500 1,075 Lenovo Group Ltd. 766,000 987 China Merchants Bank Co. Ltd. 553,272 964 China Telecom Corp. Ltd. 2,016,034 931 China Pacific Insurance Group Co. Ltd. 253,600 908 China Unicom Hong Kong Ltd. 653,574 852 Belle International Holdings Ltd. 781,000 831 Tsingtao Brewery Co. Ltd. 102,823 747 PICC Property & Casualty Co. Ltd. 530,466 706 China National Building Material Co. Ltd. 696,000 665 Bank of Communications Co. Ltd. 906,058 582 China Minsheng Banking Corp. Ltd. 572,300 557 China Oilfield Services Ltd. 210,000 554 Great Wall Motor Co. Ltd. 114,750 534 Kunlun Energy Co. Ltd. 322,000 530 China Resources Power Holdings Co. Ltd. 219,400 517 Beijing Enterprises Holdings Ltd. 60,500 515 ENN Energy Holdings Ltd. 78,000 504 Brilliance China Automotive Holdings Ltd. 314,000 478 Anhui Conch Cement Co. Ltd. 121,500 464 China Resources Land Ltd. 186,000 439
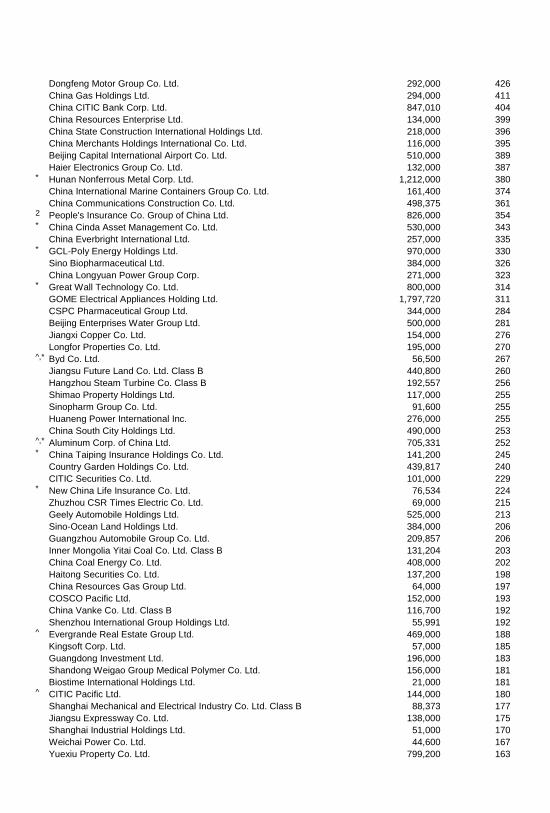
Dongfeng Motor Group Co. Ltd. 292,000 426 China Gas Holdings Ltd. 294,000 411 China CITIC Bank Corp. Ltd. 847,010 404 China Resources Enterprise Ltd. 134,000 399 China State Construction International Holdings Ltd. 218,000 396 China Merchants Holdings International Co. Ltd. 116,000 395 Beijing Capital International Airport Co. Ltd. 510,000 389 Haier Electronics Group Co. Ltd. 132,000 387 * Hunan Nonferrous Metal Corp. Ltd. 1,212,000 380 China International Marine Containers Group Co. Ltd. 161,400 374 China Communications Construction Co. Ltd. 498,375 361 2 People's Insurance Co. Group of China Ltd. 826,000 354 * China Cinda Asset Management Co. Ltd. 530,000 343 China Everbright International Ltd. 257,000 335 * GCL-Poly Energy Holdings Ltd. 970,000 330 Sino Biopharmaceutical Ltd. 384,000 326 China Longyuan Power Group Corp. 271,000 323 * Great Wall Technology Co. Ltd. 800,000 314 GOME Electrical Appliances Holding Ltd. 1,797,720 311 CSPC Pharmaceutical Group Ltd. 344,000 284 Beijing Enterprises Water Group Ltd. 500,000 281 Jiangxi Copper Co. Ltd. 154,000 276 Longfor Properties Co. Ltd. 195,000 270 ^,* Byd Co. Ltd. 56,500 267 Jiangsu Future Land Co. Ltd. Class B 440,800 260 Hangzhou Steam Turbine Co. Class B 192,557 256 Shimao Property Holdings Ltd. 117,000 255 Sinopharm Group Co. Ltd. 91,600 255 Huaneng Power International Inc. 276,000 255 China South City Holdings Ltd. 490,000 253 ^,* Aluminum Corp. of China Ltd. 705,331 252 * China Taiping Insurance Holdings Co. Ltd. 141,200 245 Country Garden Holdings Co. Ltd. 439,817 240 CITIC Securities Co. Ltd. 101,000 229 * New China Life Insurance Co. Ltd. 76,534 224 Zhuzhou CSR Times Electric Co. Ltd. 69,000 215 Geely Automobile Holdings Ltd. 525,000 213 Sino-Ocean Land Holdings Ltd. 384,000 206 Guangzhou Automobile Group Co. Ltd. 209,857 206 Inner Mongolia Yitai Coal Co. Ltd. Class B 131,204 203 China Coal Energy Co. Ltd. 408,000 202 Haitong Securities Co. Ltd. 137,200 198 China Resources Gas Group Ltd. 64,000 197 COSCO Pacific Ltd. 152,000 193 China Vanke Co. Ltd. Class B 116,700 192 Shenzhou International Group Holdings Ltd. 55,991 192 ^ Evergrande Real Estate Group Ltd. 469,000 188 Kingsoft Corp. Ltd. 57,000 185 Guangdong Investment Ltd. 196,000 183 Shandong Weigao Group Medical Polymer Co. Ltd. 156,000 181 Biostime International Holdings Ltd. 21,000 181 ^ CITIC Pacific Ltd. 144,000 180 Shanghai Mechanical and Electrical Industry Co. Ltd. Class B 88,373 177 Jiangsu Expressway Co. Ltd. 138,000 175 Shanghai Industrial Holdings Ltd. 51,000 170 Weichai Power Co. Ltd. 44,600 167 Yuexiu Property Co. Ltd. 799,200 163
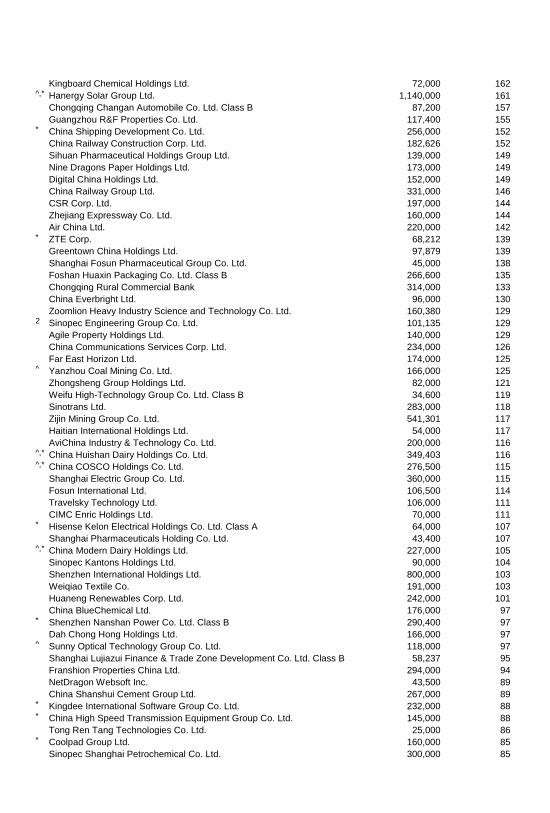
Kingboard Chemical Holdings Ltd. 72,000 162 ^,* Hanergy Solar Group Ltd. 1,140,000 161 Chongqing Changan Automobile Co. Ltd. Class B 87,200 157 Guangzhou R&F Properties Co. Ltd. 117,400 155 * China Shipping Development Co. Ltd. 256,000 152 China Railway Construction Corp. Ltd. 182,626 152 Sihuan Pharmaceutical Holdings Group Ltd. 139,000 149 Nine Dragons Paper Holdings Ltd. 173,000 149 Digital China Holdings Ltd. 152,000 149 China Railway Group Ltd. 331,000 146 CSR Corp. Ltd. 197,000 144 Zhejiang Expressway Co. Ltd. 160,000 144 Air China Ltd. 220,000 142 * ZTE Corp. 68,212 139 Greentown China Holdings Ltd. 97,879 139 Shanghai Fosun Pharmaceutical Group Co. Ltd. 45,000 138 Foshan Huaxin Packaging Co. Ltd. Class B 266,600 135 Chongqing Rural Commercial Bank 314,000 133 China Everbright Ltd. 96,000 130 Zoomlion Heavy Industry Science and Technology Co. Ltd. 160,380 129 2 Sinopec Engineering Group Co. Ltd. 101,135 129 Agile Property Holdings Ltd. 140,000 129 China Communications Services Corp. Ltd. 234,000 126 Far East Horizon Ltd. 174,000 125 ^ Yanzhou Coal Mining Co. Ltd. 166,000 125 Zhongsheng Group Holdings Ltd. 82,000 121 Weifu High-Technology Group Co. Ltd. Class B 34,600 119 Sinotrans Ltd. 283,000 118 Zijin Mining Group Co. Ltd. 541,301 117 Haitian International Holdings Ltd. 54,000 117 AviChina Industry & Technology Co. Ltd. 200,000 116 ^,* China Huishan Dairy Holdings Co. Ltd. 349,403 116 ^,* China COSCO Holdings Co. Ltd. 276,500 115 Shanghai Electric Group Co. Ltd. 360,000 115 Fosun International Ltd. 106,500 114 Travelsky Technology Ltd. 106,000 111 CIMC Enric Holdings Ltd. 70,000 111 * Hisense Kelon Electrical Holdings Co. Ltd. Class A 64,000 107 Shanghai Pharmaceuticals Holding Co. Ltd. 43,400 107 ^,* China Modern Dairy Holdings Ltd. 227,000 105 Sinopec Kantons Holdings Ltd. 90,000 104 Shenzhen International Holdings Ltd. 800,000 103 Weiqiao Textile Co. 191,000 103 Huaneng Renewables Corp. Ltd. 242,000 101 China BlueChemical Ltd. 176,000 97 * Shenzhen Nanshan Power Co. Ltd. Class B 290,400 97 Dah Chong Hong Holdings Ltd. 166,000 97 ^ Sunny Optical Technology Group Co. Ltd. 118,000 97 Shanghai Lujiazui Finance & Trade Zone Development Co. Ltd. Class B 58,237 95 Franshion Properties China Ltd. 294,000 94 NetDragon Websoft Inc. 43,500 89 China Shanshui Cement Group Ltd. 267,000 89 * Kingdee International Software Group Co. Ltd. 232,000 88 * China High Speed Transmission Equipment Group Co. Ltd. 145,000 88 Tong Ren Tang Technologies Co. Ltd. 25,000 86 * Coolpad Group Ltd. 160,000 85 Sinopec Shanghai Petrochemical Co. Ltd. 300,000 85
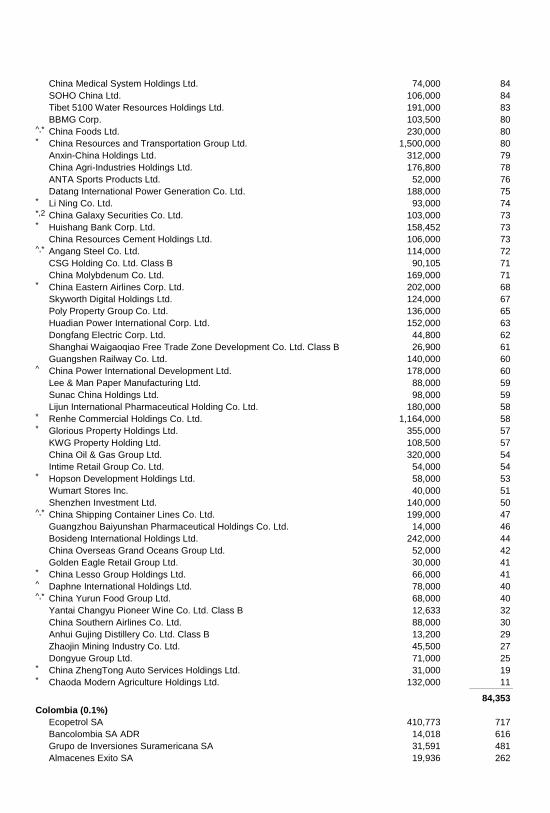
China Medical System Holdings Ltd. 74,000 84 SOHO China Ltd. 106,000 84 Tibet 5100 Water Resources Holdings Ltd. 191,000 83 BBMG Corp. 103,500 80 ^,* China Foods Ltd. 230,000 80 * China Resources and Transportation Group Ltd. 1,500,000 80 Anxin-China Holdings Ltd. 312,000 79 China Agri-Industries Holdings Ltd. 176,800 78 ANTA Sports Products Ltd. 52,000 76 Datang International Power Generation Co. Ltd. 188,000 75 * Li Ning Co. Ltd. 93,000 74 *,2 China Galaxy Securities Co. Ltd. 103,000 73 * Huishang Bank Corp. Ltd. 158,452 73 China Resources Cement Holdings Ltd. 106,000 73 ^,* Angang Steel Co. Ltd. 114,000 72 CSG Holding Co. Ltd. Class B 90,105 71 China Molybdenum Co. Ltd. 169,000 71 * China Eastern Airlines Corp. Ltd. 202,000 68 Skyworth Digital Holdings Ltd. 124,000 67 Poly Property Group Co. Ltd. 136,000 65 Huadian Power International Corp. Ltd. 152,000 63 Dongfang Electric Corp. Ltd. 44,800 62 Shanghai Waigaoqiao Free Trade Zone Development Co. Ltd. Class B 26,900 61 Guangshen Railway Co. Ltd. 140,000 60 ^ China Power International Development Ltd. 178,000 60 Lee & Man Paper Manufacturing Ltd. 88,000 59 Sunac China Holdings Ltd. 98,000 59 Lijun International Pharmaceutical Holding Co. Ltd. 180,000 58 * Renhe Commercial Holdings Co. Ltd. 1,164,000 58 * Glorious Property Holdings Ltd. 355,000 57 KWG Property Holding Ltd. 108,500 57 China Oil & Gas Group Ltd. 320,000 54 Intime Retail Group Co. Ltd. 54,000 54 * Hopson Development Holdings Ltd. 58,000 53 Wumart Stores Inc. 40,000 51 Shenzhen Investment Ltd. 140,000 50 ^,* China Shipping Container Lines Co. Ltd. 199,000 47 Guangzhou Baiyunshan Pharmaceutical Holdings Co. Ltd. 14,000 46 Bosideng International Holdings Ltd. 242,000 44 China Overseas Grand Oceans Group Ltd. 52,000 42 Golden Eagle Retail Group Ltd. 30,000 41 * China Lesso Group Holdings Ltd. 66,000 41 ^ Daphne International Holdings Ltd. 78,000 40 ^,* China Yurun Food Group Ltd. 68,000 40 Yantai Changyu Pioneer Wine Co. Ltd. Class B 12,633 32 China Southern Airlines Co. Ltd. 88,000 30 Anhui Gujing Distillery Co. Ltd. Class B 13,200 29 Zhaojin Mining Industry Co. Ltd. 45,500 27 Dongyue Group Ltd. 71,000 25 * China ZhengTong Auto Services Holdings Ltd. 31,000 19 * Chaoda Modern Agriculture Holdings Ltd. 132,000 11 _____________
84,353
Colombia (0.1%)
Ecopetrol SA 410,773 717 Bancolombia SA ADR 14,018 616 Grupo de Inversiones Suramericana SA 31,591 481 Almacenes Exito SA 19,936 262
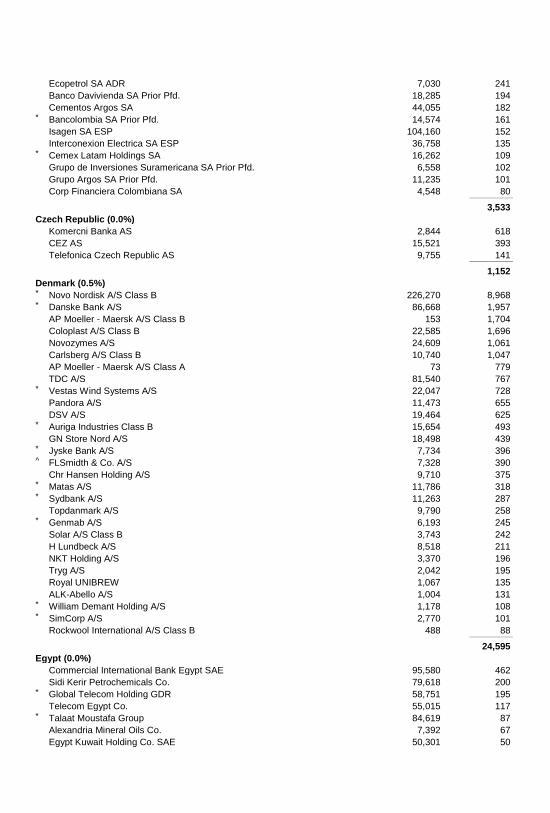
Ecopetrol SA ADR 7,030 241 Banco Davivienda SA Prior Pfd. 18,285 194 Cementos Argos SA 44,055 182 * Bancolombia SA Prior Pfd. 14,574 161 Isagen SA ESP 104,160 152 Interconexion Electrica SA ESP 36,758 135 * Cemex Latam Holdings SA 16,262 109 Grupo de Inversiones Suramericana SA Prior Pfd. 6,558 102 Grupo Argos SA Prior Pfd. 11,235 101 Corp Financiera Colombiana SA 4,548 80 _____________
3,533
Czech Republic (0.0%)
Komercni Banka AS 2,844 618 CEZ AS 15,521 393 Telefonica Czech Republic AS 9,755 141 _____________
1,152
Denmark (0.5%)
* Novo Nordisk A/S Class B 226,270 8,968 * Danske Bank A/S 86,668 1,957 AP Moeller - Maersk A/S Class B 153 1,704 Coloplast A/S Class B 22,585 1,696 Novozymes A/S 24,609 1,061 Carlsberg A/S Class B 10,740 1,047 AP Moeller - Maersk A/S Class A 73 779 TDC A/S 81,540 767 * Vestas Wind Systems A/S 22,047 728 Pandora A/S 11,473 655 DSV A/S 19,464 625 * Auriga Industries Class B 15,654 493 GN Store Nord A/S 18,498 439 * Jyske Bank A/S 7,734 396 ^ FLSmidth & Co. A/S 7,328 390 Chr Hansen Holding A/S 9,710 375 * Matas A/S 11,786 318 * Sydbank A/S 11,263 287 Topdanmark A/S 9,790 258 * Genmab A/S 6,193 245 Solar A/S Class B 3,743 242 H Lundbeck A/S 8,518 211 NKT Holding A/S 3,370 196 Tryg A/S 2,042 195 Royal UNIBREW 1,067 135 ALK-Abello A/S 1,004 131 * William Demant Holding A/S 1,178 108 * SimCorp A/S 2,770 101 Rockwool International A/S Class B 488 88 _____________
24,595
Egypt (0.0%)
Commercial International Bank Egypt SAE 95,580 462 Sidi Kerir Petrochemicals Co. 79,618 200 * Global Telecom Holding GDR 58,751 195 Telecom Egypt Co. 55,015 117 * Talaat Moustafa Group 84,619 87 Alexandria Mineral Oils Co. 7,392 67 Egypt Kuwait Holding Co. SAE 50,301 50
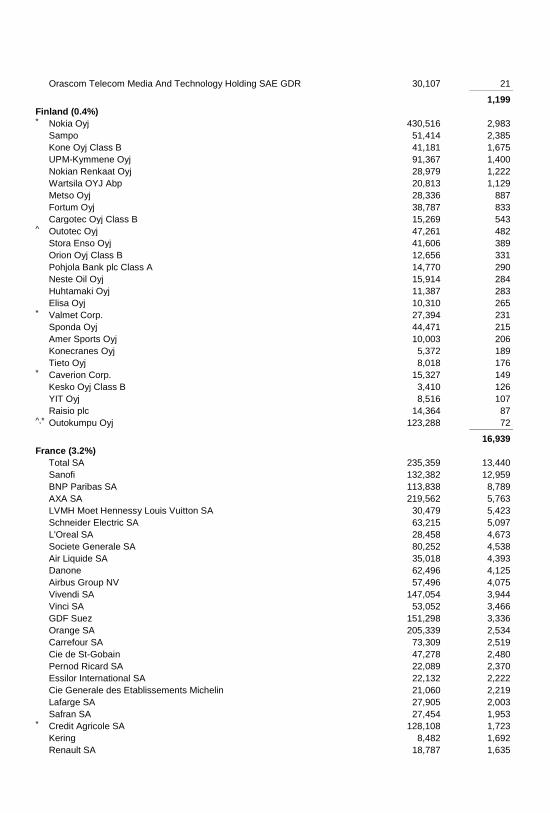
Orascom Telecom Media And Technology Holding SAE GDR 30,107 21 _____________
1,199
Finland (0.4%)
* Nokia Oyj 430,516 2,983 Sampo 51,414 2,385 Kone Oyj Class B 41,181 1,675 UPM-Kymmene Oyj 91,367 1,400 Nokian Renkaat Oyj 28,979 1,222 Wartsila OYJ Abp 20,813 1,129 Metso Oyj 28,336 887 Fortum Oyj 38,787 833 Cargotec Oyj Class B 15,269 543 ^ Outotec Oyj 47,261 482 Stora Enso Oyj 41,606 389 Orion Oyj Class B 12,656 331 Pohjola Bank plc Class A 14,770 290 Neste Oil Oyj 15,914 284 Huhtamaki Oyj 11,387 283 Elisa Oyj 10,310 265 * Valmet Corp. 27,394 231 Sponda Oyj 44,471 215 Amer Sports Oyj 10,003 206 Konecranes Oyj 5,372 189 Tieto Oyj 8,018 176 * Caverion Corp. 15,327 149 Kesko Oyj Class B 3,410 126 YIT Oyj 8,516 107 Raisio plc 14,364 87 ^,* Outokumpu Oyj 123,288 72 _____________
16,939
France (3.2%)
Total SA 235,359 13,440 Sanofi 132,382 12,959 BNP Paribas SA 113,838 8,789 AXA SA 219,562 5,763 LVMH Moet Hennessy Louis Vuitton SA 30,479 5,423 Schneider Electric SA 63,215 5,097 L'Oreal SA 28,458 4,673 Societe Generale SA 80,252 4,538 Air Liquide SA 35,018 4,393 Danone 62,496 4,125 Airbus Group NV 57,496 4,075 Vivendi SA 147,054 3,944 Vinci SA 53,052 3,466 GDF Suez 151,298 3,336 Orange SA 205,339 2,534 Carrefour SA 73,309 2,519 Cie de St-Gobain 47,278 2,480 Pernod Ricard SA 22,089 2,370 Essilor International SA 22,132 2,222 Cie Generale des Etablissements Michelin 21,060 2,219 Lafarge SA 27,905 2,003 Safran SA 27,454 1,953 * Credit Agricole SA 128,108 1,723 Kering 8,482 1,692 Renault SA 18,787 1,635

Publicis Groupe SA 17,631 1,563 Legrand SA 26,296 1,394 * Alcatel-Lucent 338,922 1,370 Societe BIC SA 10,776 1,241 Technip SA 13,863 1,181 SES SA 35,710 1,146 Alstom SA 40,287 1,142 Bouygues SA 28,785 1,098 Christian Dior SA 5,914 1,081 Casino Guichard Perrachon SA 10,268 1,057 Arkema SA 9,892 1,055 Edenred 34,593 966 Cap Gemini SA 13,829 942 Dassault Systemes 7,885 934 Hermes International 2,906 925 Vallourec SA 17,573 876 Sartorius Stedim Biotech 4,901 875 Electricite de France 25,444 864 Valeo SA 7,646 854 Veolia Environnement SA 54,120 850 ^ Sodexo 8,490 836 Accor SA 17,222 821 SCOR SE 24,093 782 Iliad SA 3,312 758 Thales SA 11,183 728 Rexel SA 26,955 692 Societe de la Tour Eiffel 9,791 655 AtoS 7,170 626 Zodiac Aerospace 3,554 626 Saft Groupe SA 17,256 604 Bureau Veritas SA 21,820 567 STMicroelectronics NV 67,881 556 Natixis 91,531 538 Groupe Eurotunnel SA 46,791 516 SEB SA 6,591 516 Aeroports de Paris 3,928 443 Eutelsat Communications SA 13,886 421 Havas SA 49,634 389 Suez Environnement Co. 21,109 378 Wendel SA 2,775 376 Eurofins Scientific SE 1,478 376 ^,* Peugeot SA 24,352 373 ^ Ingenico 4,284 368 Klepierre 8,243 358 ^ Neopost SA 3,984 338 Teleperformance 5,376 315 Bollore SA 583 314 CNP Assurances 14,082 276 Lagardere SCA 7,785 275 Metropole Television SA 12,110 262 * CGG SA 17,581 261 Eurazeo SA 3,594 257 Eiffage SA 4,416 256 Imerys SA 3,027 246 Orpea 4,455 244 Nexans SA 5,175 242 ICADE 2,637 231
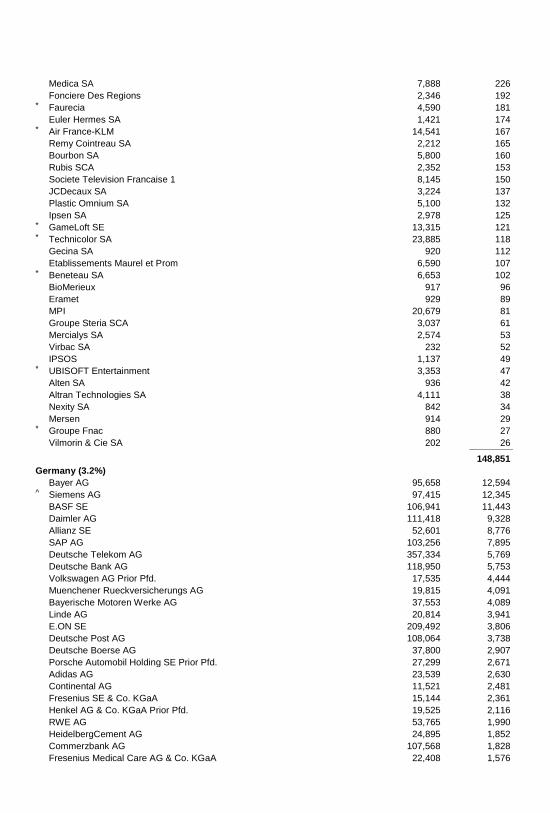
Medica SA 7,888 226 Fonciere Des Regions 2,346 192 * Faurecia 4,590 181 Euler Hermes SA 1,421 174 * Air France-KLM 14,541 167 Remy Cointreau SA 2,212 165 Bourbon SA 5,800 160 Rubis SCA 2,352 153 Societe Television Francaise 1 8,145 150 JCDecaux SA 3,224 137 Plastic Omnium SA 5,100 132 Ipsen SA 2,978 125 * GameLoft SE 13,315 121 * Technicolor SA 23,885 118 Gecina SA 920 112 Etablissements Maurel et Prom 6,590 107 * Beneteau SA 6,653 102 BioMerieux 917 96 Eramet 929 89 MPI 20,679 81 Groupe Steria SCA 3,037 61 Mercialys SA 2,574 53 Virbac SA 232 52 IPSOS 1,137 49 * UBISOFT Entertainment 3,353 47 Alten SA 936 42 Altran Technologies SA 4,111 38 Nexity SA 842 34 Mersen 914 29 * Groupe Fnac 880 27 Vilmorin & Cie SA 202 26 _____________
148,851
Germany (3.2%)
Bayer AG 95,658 12,594 ^ Siemens AG 97,415 12,345 BASF SE 106,941 11,443 Daimler AG 111,418 9,328 Allianz SE 52,601 8,776 SAP AG 103,256 7,895 Deutsche Telekom AG 357,334 5,769 Deutsche Bank AG 118,950 5,753 Volkswagen AG Prior Pfd. 17,535 4,444 Muenchener Rueckversicherungs AG 19,815 4,091 Bayerische Motoren Werke AG 37,553 4,089 Linde AG 20,814 3,941 E.ON SE 209,492 3,806 Deutsche Post AG 108,064 3,738 Deutsche Boerse AG 37,800 2,907 Porsche Automobil Holding SE Prior Pfd. 27,299 2,671 Adidas AG 23,539 2,630 Continental AG 11,521 2,481 Fresenius SE & Co. KGaA 15,144 2,361 Henkel AG & Co. KGaA Prior Pfd. 19,525 2,116 RWE AG 53,765 1,990 HeidelbergCement AG 24,895 1,852 Commerzbank AG 107,568 1,828 Fresenius Medical Care AG & Co. KGaA 22,408 1,576
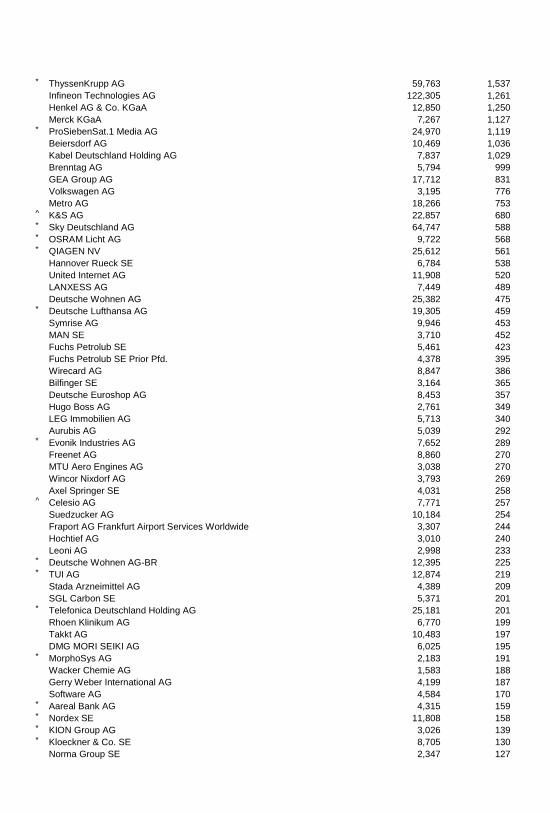
* ThyssenKrupp AG 59,763 1,537 Infineon Technologies AG 122,305 1,261 Henkel AG & Co. KGaA 12,850 1,250 Merck KGaA 7,267 1,127 * ProSiebenSat.1 Media AG 24,970 1,119 Beiersdorf AG 10,469 1,036 Kabel Deutschland Holding AG 7,837 1,029 Brenntag AG 5,794 999 GEA Group AG 17,712 831 Volkswagen AG 3,195 776 Metro AG 18,266 753 ^ K&S AG 22,857 680 * Sky Deutschland AG 64,747 588 * OSRAM Licht AG 9,722 568 * QIAGEN NV 25,612 561 Hannover Rueck SE 6,784 538 United Internet AG 11,908 520 LANXESS AG 7,449 489 Deutsche Wohnen AG 25,382 475 * Deutsche Lufthansa AG 19,305 459 Symrise AG 9,946 453 MAN SE 3,710 452 Fuchs Petrolub SE 5,461 423 Fuchs Petrolub SE Prior Pfd. 4,378 395 Wirecard AG 8,847 386 Bilfinger SE 3,164 365 Deutsche Euroshop AG 8,453 357 Hugo Boss AG 2,761 349 LEG Immobilien AG 5,713 340 Aurubis AG 5,039 292 * Evonik Industries AG 7,652 289 Freenet AG 8,860 270 MTU Aero Engines AG 3,038 270 Wincor Nixdorf AG 3,793 269 Axel Springer SE 4,031 258 ^ Celesio AG 7,771 257 Suedzucker AG 10,184 254 Fraport AG Frankfurt Airport Services Worldwide 3,307 244 Hochtief AG 3,010 240 Leoni AG 2,998 233 * Deutsche Wohnen AG-BR 12,395 225 * TUI AG 12,874 219 Stada Arzneimittel AG 4,389 209 SGL Carbon SE 5,371 201 * Telefonica Deutschland Holding AG 25,181 201 Rhoen Klinikum AG 6,770 199 Takkt AG 10,483 197 DMG MORI SEIKI AG 6,025 195 * MorphoSys AG 2,183 191 Wacker Chemie AG 1,583 188 Gerry Weber International AG 4,199 187 Software AG 4,584 170 * Aareal Bank AG 4,315 159 * Nordex SE 11,808 158 * KION Group AG 3,026 139 * Kloeckner & Co. SE 8,705 130 Norma Group SE 2,347 127
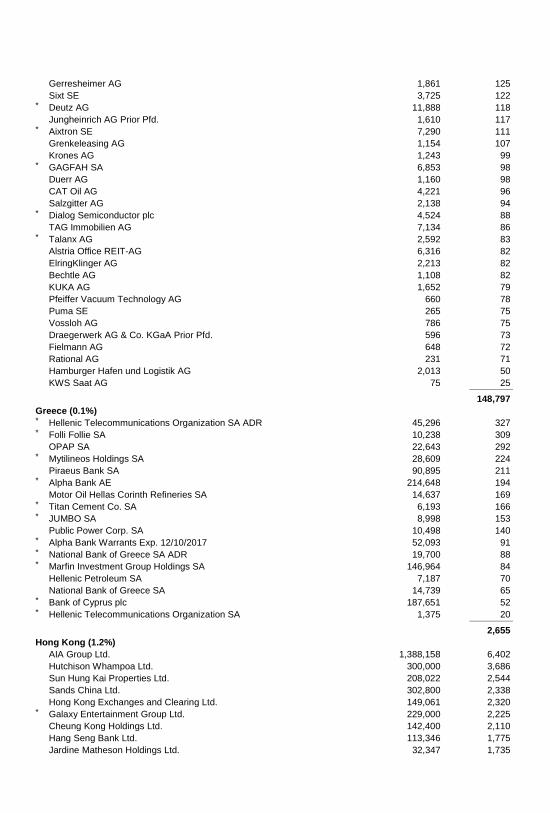
Gerresheimer AG 1,861 125 Sixt SE 3,725 122 * Deutz AG 11,888 118 Jungheinrich AG Prior Pfd. 1,610 117 * Aixtron SE 7,290 111 Grenkeleasing AG 1,154 107 Krones AG 1,243 99 * GAGFAH SA 6,853 98 Duerr AG 1,160 98 CAT Oil AG 4,221 96 Salzgitter AG 2,138 94 * Dialog Semiconductor plc 4,524 88 TAG Immobilien AG 7,134 86 * Talanx AG 2,592 83 Alstria Office REIT-AG 6,316 82 ElringKlinger AG 2,213 82 Bechtle AG 1,108 82 KUKA AG 1,652 79 Pfeiffer Vacuum Technology AG 660 78 Puma SE 265 75 Vossloh AG 786 75 Draegerwerk AG & Co. KGaA Prior Pfd. 596 73 Fielmann AG 648 72 Rational AG 231 71 Hamburger Hafen und Logistik AG 2,013 50 KWS Saat AG 75 25 _____________
148,797
Greece (0.1%)
* Hellenic Telecommunications Organization SA ADR 45,296 327 * Folli Follie SA 10,238 309 OPAP SA 22,643 292 * Mytilineos Holdings SA 28,609 224 Piraeus Bank SA 90,895 211 * Alpha Bank AE 214,648 194 Motor Oil Hellas Corinth Refineries SA 14,637 169 * Titan Cement Co. SA 6,193 166 * JUMBO SA 8,998 153 Public Power Corp. SA 10,498 140 * Alpha Bank Warrants Exp. 12/10/2017 52,093 91 * National Bank of Greece SA ADR 19,700 88 * Marfin Investment Group Holdings SA 146,964 84 Hellenic Petroleum SA 7,187 70 National Bank of Greece SA 14,739 65 * Bank of Cyprus plc 187,651 52 * Hellenic Telecommunications Organization SA 1,375 20 _____________
2,655
Hong Kong (1.2%)
AIA Group Ltd. 1,388,158 6,402 Hutchison Whampoa Ltd. 300,000 3,686 Sun Hung Kai Properties Ltd. 208,022 2,544 Sands China Ltd. 302,800 2,338 Hong Kong Exchanges and Clearing Ltd. 149,061 2,320 * Galaxy Entertainment Group Ltd. 229,000 2,225 Cheung Kong Holdings Ltd. 142,400 2,110 Hang Seng Bank Ltd. 113,346 1,775 Jardine Matheson Holdings Ltd. 32,347 1,735
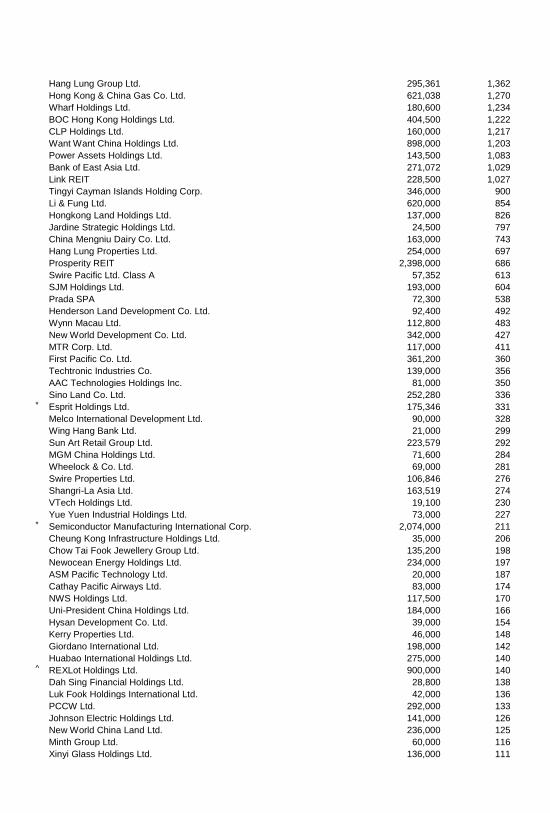
Hang Lung Group Ltd. 295,361 1,362 Hong Kong & China Gas Co. Ltd. 621,038 1,270 Wharf Holdings Ltd. 180,600 1,234 BOC Hong Kong Holdings Ltd. 404,500 1,222 CLP Holdings Ltd. 160,000 1,217 Want Want China Holdings Ltd. 898,000 1,203 Power Assets Holdings Ltd. 143,500 1,083 Bank of East Asia Ltd. 271,072 1,029 Link REIT 228,500 1,027 Tingyi Cayman Islands Holding Corp. 346,000 900 Li & Fung Ltd. 620,000 854 Hongkong Land Holdings Ltd. 137,000 826 Jardine Strategic Holdings Ltd. 24,500 797 China Mengniu Dairy Co. Ltd. 163,000 743 Hang Lung Properties Ltd. 254,000 697 Prosperity REIT 2,398,000 686 Swire Pacific Ltd. Class A 57,352 613 SJM Holdings Ltd. 193,000 604 Prada SPA 72,300 538 Henderson Land Development Co. Ltd. 92,400 492 Wynn Macau Ltd. 112,800 483 New World Development Co. Ltd. 342,000 427 MTR Corp. Ltd. 117,000 411 First Pacific Co. Ltd. 361,200 360 Techtronic Industries Co. 139,000 356 AAC Technologies Holdings Inc. 81,000 350 Sino Land Co. Ltd. 252,280 336 * Esprit Holdings Ltd. 175,346 331 Melco International Development Ltd. 90,000 328 Wing Hang Bank Ltd. 21,000 299 Sun Art Retail Group Ltd. 223,579 292 MGM China Holdings Ltd. 71,600 284 Wheelock & Co. Ltd. 69,000 281 Swire Properties Ltd. 106,846 276 Shangri-La Asia Ltd. 163,519 274 VTech Holdings Ltd. 19,100 230 Yue Yuen Industrial Holdings Ltd. 73,000 227 * Semiconductor Manufacturing International Corp. 2,074,000 211 Cheung Kong Infrastructure Holdings Ltd. 35,000 206 Chow Tai Fook Jewellery Group Ltd. 135,200 198 Newocean Energy Holdings Ltd. 234,000 197 ASM Pacific Technology Ltd. 20,000 187 Cathay Pacific Airways Ltd. 83,000 174 NWS Holdings Ltd. 117,500 170 Uni-President China Holdings Ltd. 184,000 166 Hysan Development Co. Ltd. 39,000 154 Kerry Properties Ltd. 46,000 148 Giordano International Ltd. 198,000 142 Huabao International Holdings Ltd. 275,000 140 ^ REXLot Holdings Ltd. 900,000 140 Dah Sing Financial Holdings Ltd. 28,800 138 Luk Fook Holdings International Ltd. 42,000 136 PCCW Ltd. 292,000 133 Johnson Electric Holdings Ltd. 141,000 126 New World China Land Ltd. 236,000 125 Minth Group Ltd. 60,000 116 Xinyi Glass Holdings Ltd. 136,000 111
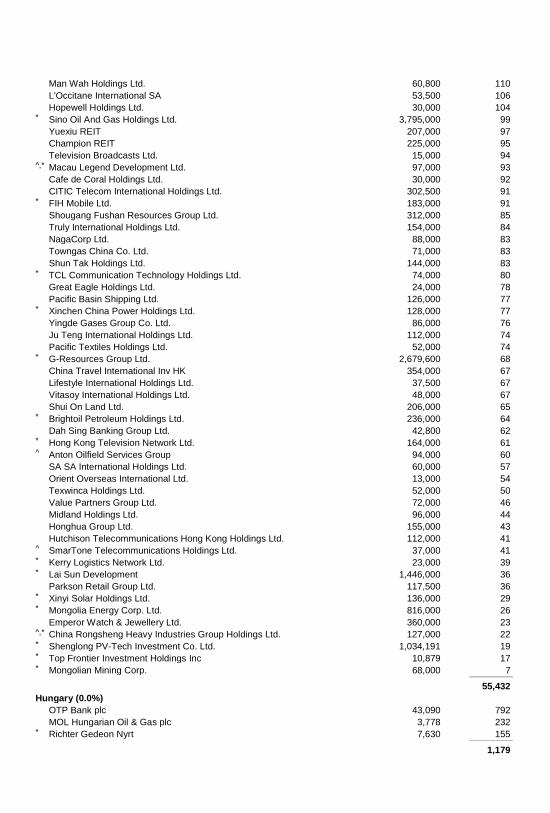
Man Wah Holdings Ltd. 60,800 110 L'Occitane International SA 53,500 106 Hopewell Holdings Ltd. 30,000 104 * Sino Oil And Gas Holdings Ltd. 3,795,000 99 Yuexiu REIT 207,000 97 Champion REIT 225,000 95 Television Broadcasts Ltd. 15,000 94 ^,* Macau Legend Development Ltd. 97,000 93 Cafe de Coral Holdings Ltd. 30,000 92 CITIC Telecom International Holdings Ltd. 302,500 91 * FIH Mobile Ltd. 183,000 91 Shougang Fushan Resources Group Ltd. 312,000 85 Truly International Holdings Ltd. 154,000 84 NagaCorp Ltd. 88,000 83 Towngas China Co. Ltd. 71,000 83 Shun Tak Holdings Ltd. 144,000 83 * TCL Communication Technology Holdings Ltd. 74,000 80 Great Eagle Holdings Ltd. 24,000 78 Pacific Basin Shipping Ltd. 126,000 77 * Xinchen China Power Holdings Ltd. 128,000 77 Yingde Gases Group Co. Ltd. 86,000 76 Ju Teng International Holdings Ltd. 112,000 74 Pacific Textiles Holdings Ltd. 52,000 74 * G-Resources Group Ltd. 2,679,600 68 China Travel International Inv HK 354,000 67 Lifestyle International Holdings Ltd. 37,500 67 Vitasoy International Holdings Ltd. 48,000 67 Shui On Land Ltd. 206,000 65 * Brightoil Petroleum Holdings Ltd. 236,000 64 Dah Sing Banking Group Ltd. 42,800 62 * Hong Kong Television Network Ltd. 164,000 61 ^ Anton Oilfield Services Group 94,000 60 SA SA International Holdings Ltd. 60,000 57 Orient Overseas International Ltd. 13,000 54 Texwinca Holdings Ltd. 52,000 50 Value Partners Group Ltd. 72,000 46 Midland Holdings Ltd. 96,000 44 Honghua Group Ltd. 155,000 43 Hutchison Telecommunications Hong Kong Holdings Ltd. 112,000 41 ^ SmarTone Telecommunications Holdings Ltd. 37,000 41 * Kerry Logistics Network Ltd. 23,000 39 * Lai Sun Development 1,446,000 36 Parkson Retail Group Ltd. 117,500 36 * Xinyi Solar Holdings Ltd. 136,000 29 * Mongolia Energy Corp. Ltd. 816,000 26 Emperor Watch & Jewellery Ltd. 360,000 23 ^,* China Rongsheng Heavy Industries Group Holdings Ltd. 127,000 22 * Shenglong PV-Tech Investment Co. Ltd. 1,034,191 19 * Top Frontier Investment Holdings Inc 10,879 17 * Mongolian Mining Corp. 68,000 7 _____________
55,432
Hungary (0.0%)
OTP Bank plc 43,090 792 MOL Hungarian Oil & Gas plc 3,778 232 * Richter Gedeon Nyrt 7,630 155 _____________
1,179
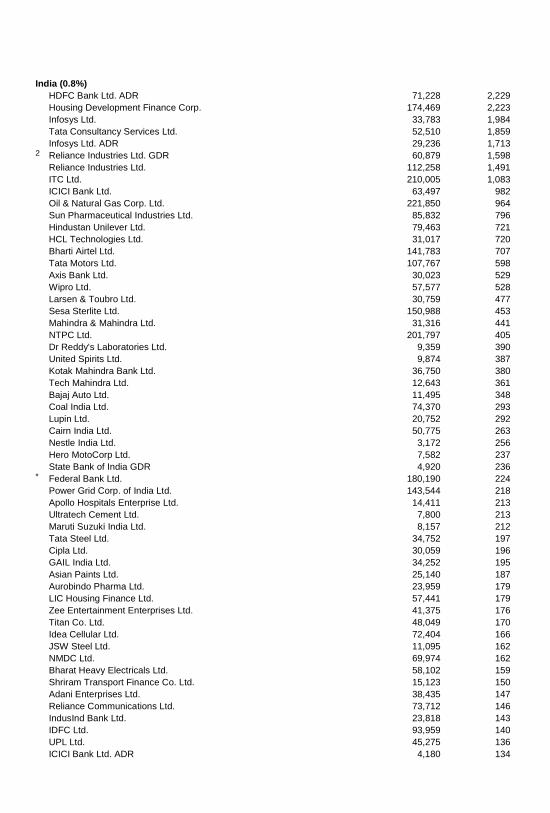
India (0.8%)
HDFC Bank Ltd. ADR 71,228 2,229 Housing Development Finance Corp. 174,469 2,223 Infosys Ltd. 33,783 1,984 Tata Consultancy Services Ltd. 52,510 1,859 Infosys Ltd. ADR 29,236 1,713 2 Reliance Industries Ltd. GDR 60,879 1,598 Reliance Industries Ltd. 112,258 1,491 ITC Ltd. 210,005 1,083 ICICI Bank Ltd. 63,497 982 Oil & Natural Gas Corp. Ltd. 221,850 964 Sun Pharmaceutical Industries Ltd. 85,832 796 Hindustan Unilever Ltd. 79,463 721 HCL Technologies Ltd. 31,017 720 Bharti Airtel Ltd. 141,783 707 Tata Motors Ltd. 107,767 598 Axis Bank Ltd. 30,023 529 Wipro Ltd. 57,577 528 Larsen & Toubro Ltd. 30,759 477 Sesa Sterlite Ltd. 150,988 453 Mahindra & Mahindra Ltd. 31,316 441 NTPC Ltd. 201,797 405 Dr Reddy's Laboratories Ltd. 9,359 390 United Spirits Ltd. 9,874 387 Kotak Mahindra Bank Ltd. 36,750 380 Tech Mahindra Ltd. 12,643 361 Bajaj Auto Ltd. 11,495 348 Coal India Ltd. 74,370 293 Lupin Ltd. 20,752 292 Cairn India Ltd. 50,775 263 Nestle India Ltd. 3,172 256 Hero MotoCorp Ltd. 7,582 237 State Bank of India GDR 4,920 236 * Federal Bank Ltd. 180,190 224 Power Grid Corp. of India Ltd. 143,544 218 Apollo Hospitals Enterprise Ltd. 14,411 213 Ultratech Cement Ltd. 7,800 213 Maruti Suzuki India Ltd. 8,157 212 Tata Steel Ltd. 34,752 197 Cipla Ltd. 30,059 196 GAIL India Ltd. 34,252 195 Asian Paints Ltd. 25,140 187 Aurobindo Pharma Ltd. 23,959 179 LIC Housing Finance Ltd. 57,441 179 Zee Entertainment Enterprises Ltd. 41,375 176 Titan Co. Ltd. 48,049 170 Idea Cellular Ltd. 72,404 166 JSW Steel Ltd. 11,095 162 NMDC Ltd. 69,974 162 Bharat Heavy Electricals Ltd. 58,102 159 Shriram Transport Finance Co. Ltd. 15,123 150 Adani Enterprises Ltd. 38,435 147 Reliance Communications Ltd. 73,712 146 IndusInd Bank Ltd. 23,818 143 IDFC Ltd. 93,959 140 UPL Ltd. 45,275 136 ICICI Bank Ltd. ADR 4,180 134
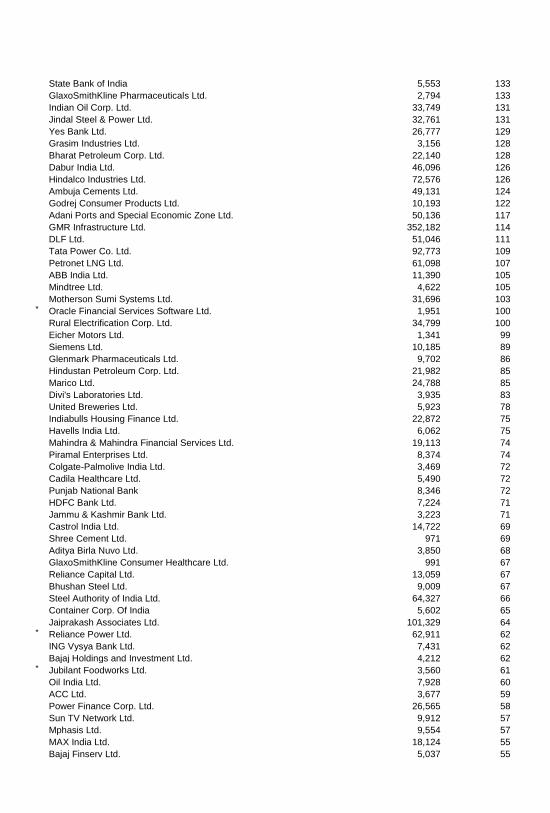
State Bank of India 5,553 133 GlaxoSmithKline Pharmaceuticals Ltd. 2,794 133 Indian Oil Corp. Ltd. 33,749 131 Jindal Steel & Power Ltd. 32,761 131 Yes Bank Ltd. 26,777 129 Grasim Industries Ltd. 3,156 128 Bharat Petroleum Corp. Ltd. 22,140 128 Dabur India Ltd. 46,096 126 Hindalco Industries Ltd. 72,576 126 Ambuja Cements Ltd. 49,131 124 Godrej Consumer Products Ltd. 10,193 122 Adani Ports and Special Economic Zone Ltd. 50,136 117 GMR Infrastructure Ltd. 352,182 114 DLF Ltd. 51,046 111 Tata Power Co. Ltd. 92,773 109 Petronet LNG Ltd. 61,098 107 ABB India Ltd. 11,390 105 Mindtree Ltd. 4,622 105 Motherson Sumi Systems Ltd. 31,696 103 * Oracle Financial Services Software Ltd. 1,951 100 Rural Electrification Corp. Ltd. 34,799 100 Eicher Motors Ltd. 1,341 99 Siemens Ltd. 10,185 89 Glenmark Pharmaceuticals Ltd. 9,702 86 Hindustan Petroleum Corp. Ltd. 21,982 85 Marico Ltd. 24,788 85 Divi's Laboratories Ltd. 3,935 83 United Breweries Ltd. 5,923 78 Indiabulls Housing Finance Ltd. 22,872 75 Havells India Ltd. 6,062 75 Mahindra & Mahindra Financial Services Ltd. 19,113 74 Piramal Enterprises Ltd. 8,374 74 Colgate-Palmolive India Ltd. 3,469 72 Cadila Healthcare Ltd. 5,490 72 Punjab National Bank 8,346 72 HDFC Bank Ltd. 7,224 71 Jammu & Kashmir Bank Ltd. 3,223 71 Castrol India Ltd. 14,722 69 Shree Cement Ltd. 971 69 Aditya Birla Nuvo Ltd. 3,850 68 GlaxoSmithKline Consumer Healthcare Ltd. 991 67 Reliance Capital Ltd. 13,059 67 Bhushan Steel Ltd. 9,009 67 Steel Authority of India Ltd. 64,327 66 Container Corp. Of India 5,602 65 Jaiprakash Associates Ltd. 101,329 64 * Reliance Power Ltd. 62,911 62 ING Vysya Bank Ltd. 7,431 62 Bajaj Holdings and Investment Ltd. 4,212 62 * Jubilant Foodworks Ltd. 3,560 61 Oil India Ltd. 7,928 60 ACC Ltd. 3,677 59 Power Finance Corp. Ltd. 26,565 58 Sun TV Network Ltd. 9,912 57 Mphasis Ltd. 9,554 57 MAX India Ltd. 18,124 55 Bajaj Finserv Ltd. 5,037 55
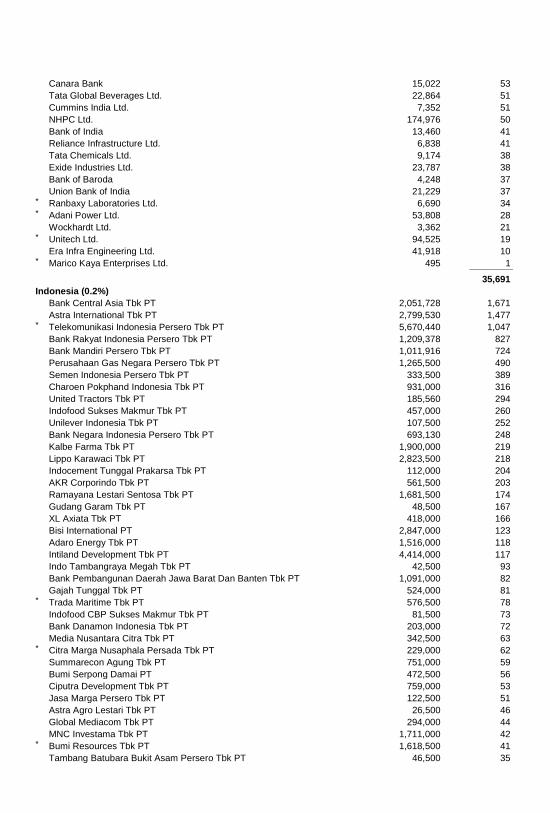
Canara Bank 15,022 53 Tata Global Beverages Ltd. 22,864 51 Cummins India Ltd. 7,352 51 NHPC Ltd. 174,976 50 Bank of India 13,460 41 Reliance Infrastructure Ltd. 6,838 41 Tata Chemicals Ltd. 9,174 38 Exide Industries Ltd. 23,787 38 Bank of Baroda 4,248 37 Union Bank of India 21,229 37 * Ranbaxy Laboratories Ltd. 6,690 34 * Adani Power Ltd. 53,808 28 Wockhardt Ltd. 3,362 21 * Unitech Ltd. 94,525 19 Era Infra Engineering Ltd. 41,918 10 * Marico Kaya Enterprises Ltd. 495 1 _____________
35,691
Indonesia (0.2%)
Bank Central Asia Tbk PT 2,051,728 1,671 Astra International Tbk PT 2,799,530 1,477 * Telekomunikasi Indonesia Persero Tbk PT 5,670,440 1,047 Bank Rakyat Indonesia Persero Tbk PT 1,209,378 827 Bank Mandiri Persero Tbk PT 1,011,916 724 Perusahaan Gas Negara Persero Tbk PT 1,265,500 490 Semen Indonesia Persero Tbk PT 333,500 389 Charoen Pokphand Indonesia Tbk PT 931,000 316 United Tractors Tbk PT 185,560 294 Indofood Sukses Makmur Tbk PT 457,000 260 Unilever Indonesia Tbk PT 107,500 252 Bank Negara Indonesia Persero Tbk PT 693,130 248 Kalbe Farma Tbk PT 1,900,000 219 Lippo Karawaci Tbk PT 2,823,500 218 Indocement Tunggal Prakarsa Tbk PT 112,000 204 AKR Corporindo Tbk PT 561,500 203 Ramayana Lestari Sentosa Tbk PT 1,681,500 174 Gudang Garam Tbk PT 48,500 167 XL Axiata Tbk PT 418,000 166 Bisi International PT 2,847,000 123 Adaro Energy Tbk PT 1,516,000 118 Intiland Development Tbk PT 4,414,000 117 Indo Tambangraya Megah Tbk PT 42,500 93 Bank Pembangunan Daerah Jawa Barat Dan Banten Tbk PT 1,091,000 82 Gajah Tunggal Tbk PT 524,000 81 * Trada Maritime Tbk PT 576,500 78 Indofood CBP Sukses Makmur Tbk PT 81,500 73 Bank Danamon Indonesia Tbk PT 203,000 72 Media Nusantara Citra Tbk PT 342,500 63 * Citra Marga Nusaphala Persada Tbk PT 229,000 62 Summarecon Agung Tbk PT 751,000 59 Bumi Serpong Damai PT 472,500 56 Ciputra Development Tbk PT 759,000 53 Jasa Marga Persero Tbk PT 122,500 51 Astra Agro Lestari Tbk PT 26,500 46 Global Mediacom Tbk PT 294,000 44 MNC Investama Tbk PT 1,711,000 42 * Bumi Resources Tbk PT 1,618,500 41 Tambang Batubara Bukit Asam Persero Tbk PT 46,500 35
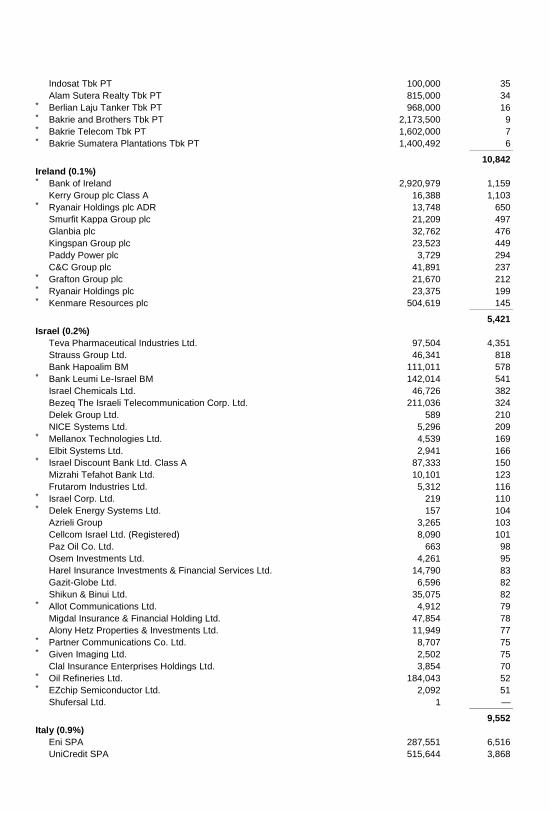
Indosat Tbk PT 100,000 35 Alam Sutera Realty Tbk PT 815,000 34 * Berlian Laju Tanker Tbk PT 968,000 16 * Bakrie and Brothers Tbk PT 2,173,500 9 * Bakrie Telecom Tbk PT 1,602,000 7 * Bakrie Sumatera Plantations Tbk PT 1,400,492 6 _____________
10,842
Ireland (0.1%)
* Bank of Ireland 2,920,979 1,159 Kerry Group plc Class A 16,388 1,103 * Ryanair Holdings plc ADR 13,748 650 Smurfit Kappa Group plc 21,209 497 Glanbia plc 32,762 476 Kingspan Group plc 23,523 449 Paddy Power plc 3,729 294 C&C Group plc 41,891 237 * Grafton Group plc 21,670 212 * Ryanair Holdings plc 23,375 199 * Kenmare Resources plc 504,619 145 _____________
5,421
Israel (0.2%)
Teva Pharmaceutical Industries Ltd. 97,504 4,351 Strauss Group Ltd. 46,341 818 Bank Hapoalim BM 111,011 578 * Bank Leumi Le-Israel BM 142,014 541 Israel Chemicals Ltd. 46,726 382 Bezeq The Israeli Telecommunication Corp. Ltd. 211,036 324 Delek Group Ltd. 589 210 NICE Systems Ltd. 5,296 209 * Mellanox Technologies Ltd. 4,539 169 Elbit Systems Ltd. 2,941 166 * Israel Discount Bank Ltd. Class A 87,333 150 Mizrahi Tefahot Bank Ltd. 10,101 123 Frutarom Industries Ltd. 5,312 116 * Israel Corp. Ltd. 219 110 * Delek Energy Systems Ltd. 157 104 Azrieli Group 3,265 103 Cellcom Israel Ltd. (Registered) 8,090 101 Paz Oil Co. Ltd. 663 98 Osem Investments Ltd. 4,261 95 Harel Insurance Investments & Financial Services Ltd. 14,790 83 Gazit-Globe Ltd. 6,596 82 Shikun & Binui Ltd. 35,075 82 * Allot Communications Ltd. 4,912 79 Migdal Insurance & Financial Holding Ltd. 47,854 78 Alony Hetz Properties & Investments Ltd. 11,949 77 * Partner Communications Co. Ltd. 8,707 75 * Given Imaging Ltd. 2,502 75 Clal Insurance Enterprises Holdings Ltd. 3,854 70 * Oil Refineries Ltd. 184,043 52 * EZchip Semiconductor Ltd. 2,092 51 Shufersal Ltd. 1 — _____________
9,552
Italy (0.9%)
Eni SPA 287,551 6,516 UniCredit SPA 515,644 3,868
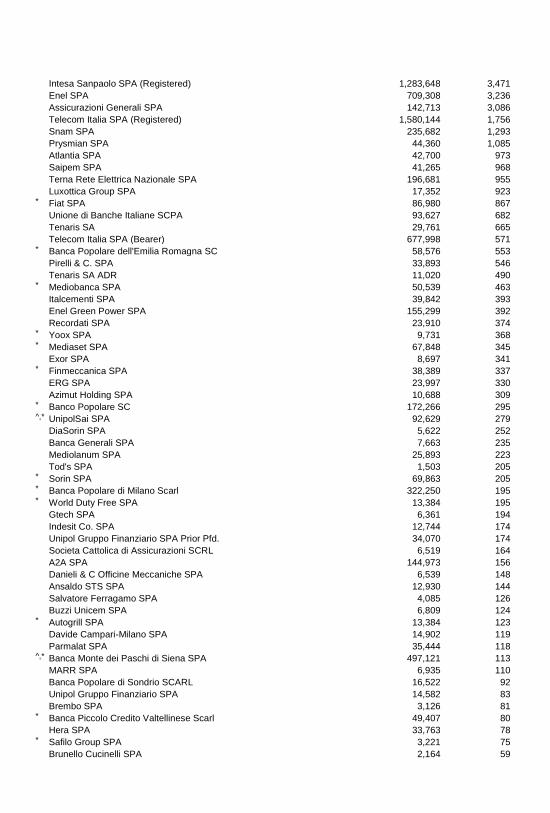
Intesa Sanpaolo SPA (Registered) 1,283,648 3,471 Enel SPA 709,308 3,236 Assicurazioni Generali SPA 142,713 3,086 Telecom Italia SPA (Registered) 1,580,144 1,756 Snam SPA 235,682 1,293 Prysmian SPA 44,360 1,085 Atlantia SPA 42,700 973 Saipem SPA 41,265 968 Terna Rete Elettrica Nazionale SPA 196,681 955 Luxottica Group SPA 17,352 923 * Fiat SPA 86,980 867 Unione di Banche Italiane SCPA 93,627 682 Tenaris SA 29,761 665 Telecom Italia SPA (Bearer) 677,998 571 * Banca Popolare dell'Emilia Romagna SC 58,576 553 Pirelli & C. SPA 33,893 546 Tenaris SA ADR 11,020 490 * Mediobanca SPA 50,539 463 Italcementi SPA 39,842 393 Enel Green Power SPA 155,299 392 Recordati SPA 23,910 374 * Yoox SPA 9,731 368 * Mediaset SPA 67,848 345 Exor SPA 8,697 341 * Finmeccanica SPA 38,389 337 ERG SPA 23,997 330 Azimut Holding SPA 10,688 309 * Banco Popolare SC 172,266 295 ^,* UnipolSai SPA 92,629 279 DiaSorin SPA 5,622 252 Banca Generali SPA 7,663 235 Mediolanum SPA 25,893 223 Tod's SPA 1,503 205 * Sorin SPA 69,863 205 * Banca Popolare di Milano Scarl 322,250 195 * World Duty Free SPA 13,384 195 Gtech SPA 6,361 194 Indesit Co. SPA 12,744 174 Unipol Gruppo Finanziario SPA Prior Pfd. 34,070 174 Societa Cattolica di Assicurazioni SCRL 6,519 164 A2A SPA 144,973 156 Danieli & C Officine Meccaniche SPA 6,539 148 Ansaldo STS SPA 12,930 144 Salvatore Ferragamo SPA 4,085 126 Buzzi Unicem SPA 6,809 124 * Autogrill SPA 13,384 123 Davide Campari-Milano SPA 14,902 119 Parmalat SPA 35,444 118 ^,* Banca Monte dei Paschi di Siena SPA 497,121 113 MARR SPA 6,935 110 Banca Popolare di Sondrio SCARL 16,522 92 Unipol Gruppo Finanziario SPA 14,582 83 Brembo SPA 3,126 81 * Banca Piccolo Credito Valtellinese Scarl 49,407 80 Hera SPA 33,763 78 * Safilo Group SPA 3,221 75 Brunello Cucinelli SPA 2,164 59
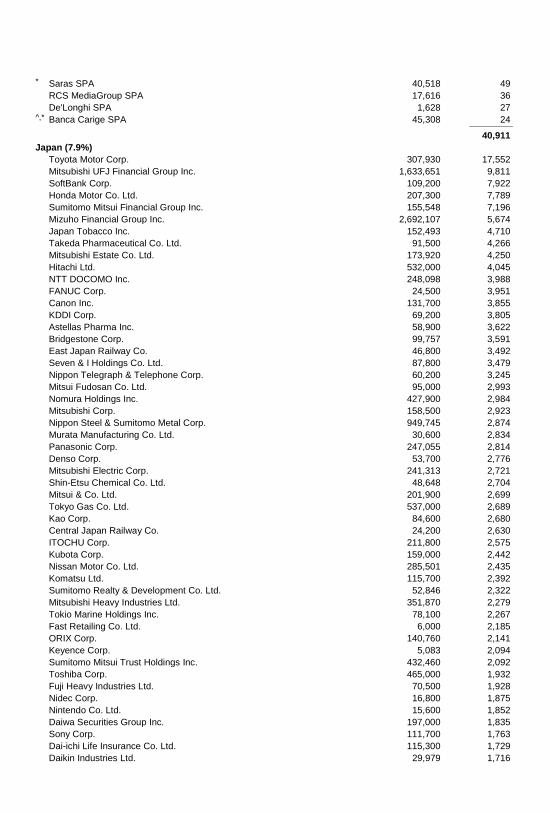
* Saras SPA 40,518 49 RCS MediaGroup SPA 17,616 36 De'Longhi SPA 1,628 27 ^,* Banca Carige SPA 45,308 24 _____________
40,911
Japan (7.9%)
Toyota Motor Corp. 307,930 17,552 Mitsubishi UFJ Financial Group Inc. 1,633,651 9,811 SoftBank Corp. 109,200 7,922 Honda Motor Co. Ltd. 207,300 7,789 Sumitomo Mitsui Financial Group Inc. 155,548 7,196 Mizuho Financial Group Inc. 2,692,107 5,674 Japan Tobacco Inc. 152,493 4,710 Takeda Pharmaceutical Co. Ltd. 91,500 4,266 Mitsubishi Estate Co. Ltd. 173,920 4,250 Hitachi Ltd. 532,000 4,045 NTT DOCOMO Inc. 248,098 3,988 FANUC Corp. 24,500 3,951 Canon Inc. 131,700 3,855 KDDI Corp. 69,200 3,805 Astellas Pharma Inc. 58,900 3,622 Bridgestone Corp. 99,757 3,591 East Japan Railway Co. 46,800 3,492 Seven & I Holdings Co. Ltd. 87,800 3,479 Nippon Telegraph & Telephone Corp. 60,200 3,245 Mitsui Fudosan Co. Ltd. 95,000 2,993 Nomura Holdings Inc. 427,900 2,984 Mitsubishi Corp. 158,500 2,923 Nippon Steel & Sumitomo Metal Corp. 949,745 2,874 Murata Manufacturing Co. Ltd. 30,600 2,834 Panasonic Corp. 247,055 2,814 Denso Corp. 53,700 2,776 Mitsubishi Electric Corp. 241,313 2,721 Shin-Etsu Chemical Co. Ltd. 48,648 2,704 Mitsui & Co. Ltd. 201,900 2,699 Tokyo Gas Co. Ltd. 537,000 2,689 Kao Corp. 84,600 2,680 Central Japan Railway Co. 24,200 2,630 ITOCHU Corp. 211,800 2,575 Kubota Corp. 159,000 2,442 Nissan Motor Co. Ltd. 285,501 2,435 Komatsu Ltd. 115,700 2,392 Sumitomo Realty & Development Co. Ltd. 52,846 2,322 Mitsubishi Heavy Industries Ltd. 351,870 2,279 Tokio Marine Holdings Inc. 78,100 2,267 Fast Retailing Co. Ltd. 6,000 2,185 ORIX Corp. 140,760 2,141 Keyence Corp. 5,083 2,094 Sumitomo Mitsui Trust Holdings Inc. 432,460 2,092 Toshiba Corp. 465,000 1,932 Fuji Heavy Industries Ltd. 70,500 1,928 Nidec Corp. 16,800 1,875 Nintendo Co. Ltd. 15,600 1,852 Daiwa Securities Group Inc. 197,000 1,835 Sony Corp. 111,700 1,763 Dai-ichi Life Insurance Co. Ltd. 115,300 1,729 Daikin Industries Ltd. 29,979 1,716
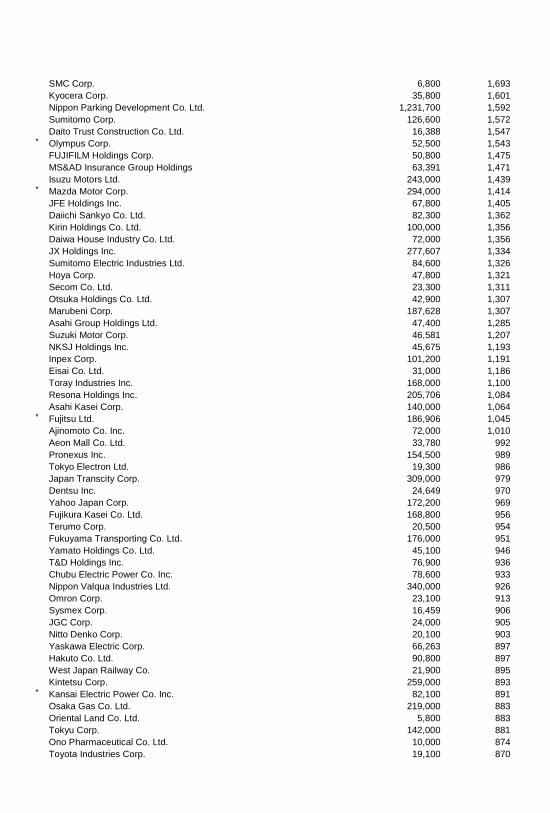
SMC Corp. 6,800 1,693 Kyocera Corp. 35,800 1,601 Nippon Parking Development Co. Ltd. 1,231,700 1,592 Sumitomo Corp. 126,600 1,572 Daito Trust Construction Co. Ltd. 16,388 1,547 * Olympus Corp. 52,500 1,543 FUJIFILM Holdings Corp. 50,800 1,475 MS&AD Insurance Group Holdings 63,391 1,471 Isuzu Motors Ltd. 243,000 1,439 * Mazda Motor Corp. 294,000 1,414 JFE Holdings Inc. 67,800 1,405 Daiichi Sankyo Co. Ltd. 82,300 1,362 Kirin Holdings Co. Ltd. 100,000 1,356 Daiwa House Industry Co. Ltd. 72,000 1,356 JX Holdings Inc. 277,607 1,334 Sumitomo Electric Industries Ltd. 84,600 1,326 Hoya Corp. 47,800 1,321 Secom Co. Ltd. 23,300 1,311 Otsuka Holdings Co. Ltd. 42,900 1,307 Marubeni Corp. 187,628 1,307 Asahi Group Holdings Ltd. 47,400 1,285 Suzuki Motor Corp. 46,581 1,207 NKSJ Holdings Inc. 45,675 1,193 Inpex Corp. 101,200 1,191 Eisai Co. Ltd. 31,000 1,186 Toray Industries Inc. 168,000 1,100 Resona Holdings Inc. 205,706 1,084 Asahi Kasei Corp. 140,000 1,064 * Fujitsu Ltd. 186,906 1,045 Ajinomoto Co. Inc. 72,000 1,010 Aeon Mall Co. Ltd. 33,780 992 Pronexus Inc. 154,500 989 Tokyo Electron Ltd. 19,300 986 Japan Transcity Corp. 309,000 979 Dentsu Inc. 24,649 970 Yahoo Japan Corp. 172,200 969 Fujikura Kasei Co. Ltd. 168,800 956 Terumo Corp. 20,500 954 Fukuyama Transporting Co. Ltd. 176,000 951 Yamato Holdings Co. Ltd. 45,100 946 T&D Holdings Inc. 76,900 936 Chubu Electric Power Co. Inc. 78,600 933 Nippon Valqua Industries Ltd. 340,000 926 Omron Corp. 23,100 913 Sysmex Corp. 16,459 906 JGC Corp. 24,000 905 Nitto Denko Corp. 20,100 903 Yaskawa Electric Corp. 66,263 897 Hakuto Co. Ltd. 90,800 897 West Japan Railway Co. 21,900 895 Kintetsu Corp. 259,000 893 * Kansai Electric Power Co. Inc. 82,100 891 Osaka Gas Co. Ltd. 219,000 883 Oriental Land Co. Ltd. 5,800 883 Tokyu Corp. 142,000 881 Ono Pharmaceutical Co. Ltd. 10,000 874 Toyota Industries Corp. 19,100 870
Aisin Seiki Co. Ltd. 23,600 864 NEC Corp. 295,000 853 Sekisui House Ltd. 61,500 852 ^ Kourakuen Corp. 61,300 852 Japan Pure Chemical Co. Ltd. 389 846 Aeon Co. Ltd. 67,100 834 LIXIL Group Corp. 32,000 822 Taisei Lamick Co. Ltd. 31,200 814 Shimano Inc. 8,900 790 Ricoh Co. Ltd. 75,000 787 Sumitomo Metal Mining Co. Ltd. 60,000 779 Toho Co. Ltd. 219,000 772 Sumitomo Heavy Industries Ltd. 166,000 770 Unicharm Corp. 14,100 766 * Tokyo Electric Power Co. Inc. 167,000 759 Kawasaki Heavy Industries Ltd. 174,000 756 Asahi Organic Chemicals Industry Co. Ltd. 352,000 744 TOTO Ltd. 47,000 744 * Tohoku Electric Power Co. Inc. 68,200 735 IHI Corp. 160,000 726 Shionogi & Co. Ltd. 35,600 724 Hankyu Hanshin Holdings Inc. 142,000 720 Shizuoka Bank Ltd. 71,000 713 Makita Corp. 13,800 710 Bank of Yokohama Ltd. 141,000 706 Yushiro Chemical Industry Co. Ltd. 70,500 703 Shiseido Co. Ltd. 44,100 700 Dai Nippon Printing Co. Ltd. 70,000 693 Rohm Co. Ltd. 13,800 688 ^,* Mitsubishi Motors Corp. 61,300 663 Mitsubishi Chemical Holdings Corp. 152,484 651 Yakult Honsha Co. Ltd. 13,200 645 Coca-Cola East Japan Co. Ltd. 26,200 644 Nikon Corp. 37,000 631 Konica Minolta Inc. 58,500 614 Shimamura Co. Ltd. 6,900 610 Sumitomo Chemical Co. Ltd. 148,492 605 Toyota Tsusho Corp. 25,400 594 Asahi Glass Co. Ltd. 105,000 593 Kyoritsu Maintenance Co. Ltd. 16,158 571 * Kyushu Electric Power Co. Inc. 49,500 563 Tobu Railway Co. Ltd. 121,000 562 Keikyu Corp. 71,000 554 NGK Spark Plug Co. Ltd. 24,000 554 Mitsubishi Materials Corp. 165,340 553 Chugai Pharmaceutical Co. Ltd. 24,400 553 Odakyu Electric Railway Co. Ltd. 63,000 552 Sekisui Chemical Co. Ltd. 48,000 552 Yamada Denki Co. Ltd. 159,360 550 Chiba Bank Ltd. 87,000 547 TDK Corp. 12,000 541 MEIJI Holdings Co. Ltd. 8,617 539 Sega Sammy Holdings Inc. 22,700 539 * Kobe Steel Ltd. 317,000 525 Namco Bandai Holdings Inc. 23,200 521 * Sharp Corp. 153,302 521 Hirose Electric Co. Ltd. 3,700 519
NSK Ltd. 46,000 519 Isetan Mitsukoshi Holdings Ltd. 40,800 512 Oji Holdings Corp. 108,000 510 NGK Insulators Ltd. 30,000 507 Nippon Chemiphar Co. Ltd. 112,000 506 Toppan Printing Co. Ltd. 68,000 496 Nippon Express Co. Ltd. 102,000 479 Nippon Yusen KK 150,000 466 Electric Power Development Co. Ltd. 15,700 465 Yokogawa Electric Corp. 29,800 460 Chugoku Electric Power Co. Inc. 35,100 459 Lawson Inc. 6,300 457 Seiko Epson Corp. 17,400 453 Taisei Corp. 103,000 451 * Tokyu Fudosan Holdings Corp. 51,986 451 Advantest Corp. 41,300 443 Nitori Holdings Co. Ltd. 4,550 441 Mitsui OSK Lines Ltd. 106,397 437 Credit Saison Co. Ltd. 17,900 437 Tokyo Tatemono Co. Ltd. 47,000 436 Keio Corp. 68,000 436 Nippon Meat Packers Inc. 25,000 426 NTT Data Corp. 12,000 424 Santen Pharmaceutical Co. Ltd. 10,000 420 Hulic Co. Ltd. 33,000 417 Nippon Paint Co. Ltd. 25,000 412 Taiheiyo Cement Corp. 110,000 409 ^,* Mitsubishi Kakoki Kaisha Ltd. 242,000 405 Taisho Pharmaceutical Holdings Co. Ltd. 5,600 403 Yamaha Motor Co. Ltd. 29,800 393 Kansai Paint Co. Ltd. 29,000 391 JTEKT Corp. 26,800 390 Obayashi Corp. 66,000 389 Stanley Electric Co. Ltd. 17,300 389 Kajima Corp. 105,000 388 Duskin Co. Ltd. 20,100 384 Joyo Bank Ltd. 80,000 376 KYORIN Holdings Inc. 16,800 376 Suruga Bank Ltd. 22,000 372 Century Tokyo Leasing Corp. 12,900 371 Hino Motors Ltd. 25,000 365 Shibusawa Warehouse Co. Ltd. 103,000 365 Trend Micro Inc. 11,800 363 Kuraray Co. Ltd. 32,200 362 Dainippon Sumitomo Pharma Co. Ltd. 21,100 358 Daihatsu Motor Co. Ltd. 23,000 358 Suntory Beverage & Food Ltd. 10,900 356 Kikkoman Corp. 20,000 354 Ebara Corp. 55,000 352 SBI Holdings Inc. 25,740 352 Aozora Bank Ltd. 122,901 350 Fukuoka Financial Group Inc. 84,000 350 JSR Corp. 19,300 343 Toyo Seikan Group Holdings Ltd. 19,300 342 Hisamitsu Pharmaceutical Co. Inc. 7,500 340 Mitsubishi Gas Chemical Co. Inc. 48,000 338 Amada Co. Ltd. 41,000 331
Mitsubishi UFJ Lease & Finance Co. Ltd. 63,300 329 Mitsubishi Tanabe Pharma Corp. 21,800 320 Hitachi Zosen Corp. 43,000 308 Kyowa Hakko Kirin Co. Ltd. 30,000 304 Shochiku Co. Ltd. 34,000 302 Minebea Co. Ltd. 40,000 299 * Iida Group Holdings Co. Ltd. 16,881 299 Seven Bank Ltd. 77,600 295 Shimizu Corp. 55,000 295 J Front Retailing Co. Ltd. 44,000 294 Nabtesco Corp. 13,000 290 Jafco Co. Ltd. 5,400 290 Japan Airlines Co. Ltd. 5,700 286 Nissin Foods Holdings Co. Ltd. 6,600 286 Nomura Research Institute Ltd. 8,500 278 FP Corp. 4,400 274 Ibiden Co. Ltd. 14,900 273 * Haseko Corp. 36,600 273 Shinsei Bank Ltd. 134,000 273 Kakaku.com Inc. 14,368 272 Brother Industries Ltd. 21,300 267 Don Quijote Holdings Co. Ltd. 4,400 267 AEON Financial Service Co. Ltd. 11,400 264 * Alps Electric Co. Ltd. 20,000 261 M3 Inc. 89 261 USS Co. Ltd. 19,000 260 DIC Corp. 90,000 257 Hamamatsu Photonics KK 6,100 256 Nippon Steel & Sumikin Bussan Corp. 68,000 255 ^ Sanrio Co. Ltd. 6,892 254 Iyo Bank Ltd. 27,000 252 Sawai Pharmaceutical Co. Ltd. 4,200 252 Toyo Suisan Kaisha Ltd. 8,000 251 Marui Group Co. Ltd. 26,800 251 Alfresa Holdings Corp. 4,400 250 FamilyMart Co. Ltd. 5,500 250 Yokohama Rubber Co. Ltd. 28,000 249 Hitachi Metals Ltd. 16,000 249 Asics Corp. 14,400 248 Nissan Chemical Industries Ltd. 17,500 248 Japan Securities Finance Co. Ltd. 36,300 248 Casio Computer Co. Ltd. 22,700 246 Bank of Kyoto Ltd. 31,000 246 Chiyoda Corp. 16,000 246 Fujikura Ltd. 53,000 244 ^ Dena Co. Ltd. 12,700 242 Rinnai Corp. 3,100 239 Sanken Electric Co. Ltd. 35,000 238 Sony Financial Holdings Inc. 14,700 238 Hachijuni Bank Ltd. 42,000 232 THK Co. Ltd. 10,700 232 Miraca Holdings Inc. 4,900 232 Shimadzu Corp. 26,000 231 MISUMI Group Inc. 8,000 229 Toho Co. Ltd. 11,000 227 Hakuhodo DY Holdings Inc. 28,000 226 Takashimaya Co. Ltd. 24,000 224
Mitsui Mining & Smelting Co. Ltd. 84,000 223 Sankyo Co. Ltd. 4,700 222 Yamaha Corp. 15,100 222 Fuji Electric Co. Ltd. 51,000 221 Suzuken Co. Ltd. 6,400 221 Air Water Inc. 15,000 220 Citizen Holdings Co. Ltd. 28,200 220 * Shikoku Electric Power Co. Inc. 15,300 218 Konami Corp. 9,200 218 K's Holdings Corp. 8,142 218 Hokuhoku Financial Group Inc. 114,000 216 MediPal Holdings Corp. 14,800 215 ANA Holdings Inc. 100,000 213 Keisei Electric Railway Co. Ltd. 24,000 213 Tosoh Corp. 49,000 209 Benesse Holdings Inc. 5,300 209 Toho Gas Co. Ltd. 45,000 209 Sumitomo Rubber Industries Ltd. 15,100 208 Dowa Holdings Co. Ltd. 23,000 208 Nomura Real Estate Holdings Inc. 10,200 206 Kamigumi Co. Ltd. 23,000 206 Kurita Water Industries Ltd. 9,600 204 North Pacific Bank Ltd. 52,400 203 Ryohin Keikaku Co. Ltd. 2,200 203 Koito Manufacturing Co. Ltd. 10,000 202 TonenGeneral Sekiyu KK 23,000 202 Gunma Bank Ltd. 38,000 200 ^,* Tokyo Rope Manufacturing Co. Ltd. 126,000 200 Hokuriku Electric Power Co. 16,200 199 * NTN Corp. 46,000 199 Sojitz Corp. 116,048 198 Nippon Kayaku Co. Ltd. 15,000 198 Nihon M&A Center Inc. 2,400 198 Izumi Co. Ltd. 6,500 197 Nisshin Seifun Group Inc. 19,800 196 Nagoya Railroad Co. Ltd. 65,000 194 Hiroshima Bank Ltd. 48,000 193 Hitachi Construction Machinery Co. Ltd. 10,000 192 Kaneka Corp. 31,000 192 Daicel Corp. 24,000 192 Sankyo Tateyama Inc. 8,200 191 Ship Healthcare Holdings Inc. 5,000 191 Keihan Electric Railway Co. Ltd. 50,000 189 Azbil Corp. 8,000 188 Obic Co. Ltd. 6,100 188 Toyobo Co. Ltd. 105,000 188 * Hokkaido Electric Power Co. Inc. 18,000 186 Zenkoku Hosho Co. Ltd. 3,900 182 Yamaguchi Financial Group Inc. 20,000 181 Kanamoto Co. Ltd. 7,000 181 Seino Holdings Co. Ltd. 19,000 180 Idemitsu Kosan Co. Ltd. 8,000 178 Wacom Co. Ltd. 28,000 178 Teijin Ltd. 79,000 177 Anritsu Corp. 16,000 176 Mitsui Chemicals Inc. 73,000 175 NOK Corp. 10,800 175
Maruichi Steel Tube Ltd. 6,700 174 Kewpie Corp. 12,200 174 Chugoku Bank Ltd. 14,000 174 Taiyo Nippon Sanso Corp. 25,000 173 ASKUL Corp. 4,500 171 Nagase & Co. Ltd. 14,600 170 Ube Industries Ltd. 83,000 170 Ushio Inc. 14,100 168 Mitsubishi Logistics Corp. 12,000 168 Hikari Tsushin Inc. 2,000 167 GS Yuasa Corp. 32,000 166 NHK Spring Co. Ltd. 16,200 166 Denki Kagaku Kogyo KK 43,000 166 Otsuka Corp. 1,400 166 SCSK Corp. 6,000 166 Monex Group Inc. 39,500 165 ^ Nippon Paper Industries Co. Ltd. 9,100 163 Disco Corp. 2,300 161 Sugi Holdings Co. Ltd. 4,000 160 Showa Denko KK 118,000 160 Rohto Pharmaceutical Co. Ltd. 10,000 160 Square Enix Holdings Co. Ltd. 5,600 159 Shinko Plantech Co. Ltd. 21,200 159 Kawasaki Kisen Kaisha Ltd. 68,000 159 Nippon Shokubai Co. Ltd. 15,000 157 Tsubakimoto Chain Co. 20,000 156 Zeon Corp. 16,000 156 UACJ Corp. 40,000 155 COMSYS Holdings Corp. 10,700 155 Showa Shell Sekiyu KK 16,300 154 Daido Steel Co. Ltd. 31,000 154 Nippon Electric Glass Co. Ltd. 34,000 153 Sanyo Special Steel Co. Ltd. 34,000 153 Kobayashi Pharmaceutical Co. Ltd. 2,800 152 Temp Holdings Co. Ltd. 5,000 151 Sotetsu Holdings Inc. 42,000 151 Hazama Ando Corp. 42,100 150 Kagome Co. Ltd. 9,000 149 Nishi-Nippon City Bank Ltd. 59,000 148 Taiyo Yuden Co. Ltd. 12,200 147 DMG Mori Seiki Co. Ltd. 8,500 147 Ezaki Glico Co. Ltd. 11,000 147 House Foods Group Inc. 9,600 144 Ichiyoshi Securities Co. Ltd. 9,400 143 Japan Steel Works Ltd. 29,000 143 Furukawa Electric Co. Ltd. 58,000 141 77 Bank Ltd. 31,000 141 Yamazaki Baking Co. Ltd. 13,000 140 Coca-Cola West Co. Ltd. 7,100 139 Hitachi Chemical Co. Ltd. 9,700 139 Nachi-Fujikoshi Corp. 22,000 138 Calbee Inc. 6,000 137 Takara Holdings Inc. 17,000 137 Sohgo Security Services Co. Ltd. 7,300 137 Hokuto Corp. 7,400 137 Tsumura & Co. 5,500 137 Toyoda Gosei Co. Ltd. 6,500 136
Sumitomo Forestry Co. Ltd. 12,600 136 Glory Ltd. 5,500 135 Wacoal Holdings Corp. 13,000 134 Sapporo Holdings Ltd. 35,000 133 Nihon Kohden Corp. 3,400 132 Lion Corp. 25,000 131 Internet Initiative Japan Inc. 5,400 131 * Kenedix Inc. 32,000 130 MOS Food Services Inc. 6,200 129 Nishi-Nippon Railroad Co. Ltd. 34,000 129 Capcom Co. Ltd. 6,600 129 Juroku Bank Ltd. 37,000 129 Park24 Co. Ltd. 6,200 128 Penta-Ocean Construction Co. Ltd. 35,500 127 Rengo Co. Ltd. 24,000 127 Nissan Shatai Co. Ltd. 10,000 126 NOF Corp. 18,000 126 Panasonic Information Systems 4,600 124 Hitachi High-Technologies Corp. 5,400 124 Japan Airport Terminal Co. Ltd. 6,200 124 Toho Holdings Co. Ltd. 7,000 123 Shiga Bank Ltd. 25,000 122 ST Corp. 12,600 122 Sundrug Co. Ltd. 2,900 122 Start Today Co. Ltd. 5,500 121 * Aiful Corp. 32,300 121 Inaba Denki Sangyo Co. Ltd. 3,800 120 Senshu Ikeda Holdings Inc. 26,900 120 Resorttrust Inc. 7,000 120 Daio Paper Corp. 14,000 119 Kose Corp. 3,800 119 Nichirei Corp. 26,000 118 Elematec Corp. 6,800 118 Nippon Shinyaku Co. Ltd. 6,000 117 Tokuyama Corp. 29,000 117 Kyoei Steel Ltd. 5,800 116 Pasona Group Inc. 18,500 116 H2O Retailing Corp. 14,000 115 Furukawa Co. Ltd. 58,000 115 Rock Field Co. Ltd. 6,500 114 OKUMA Corp. 12,000 114 TS Tech Co. Ltd. 3,100 114 Daishi Bank Ltd. 32,000 113 * Acom Co. Ltd. 38,300 113 Hanwa Co. Ltd. 22,000 113 Hyakugo Bank Ltd. 28,000 113 * Ulvac Inc. 6,900 112 Earth Chemical Co. Ltd. 3,300 111 Aoyama Trading Co. Ltd. 4,300 111 Komori Corp. 7,100 111 Ogaki Kyoritsu Bank Ltd. 40,000 111 Matsumotokiyoshi Holdings Co. Ltd. 3,100 110 Kisoji Co. Ltd. 6,000 110 Mitsui Engineering & Shipbuilding Co. Ltd. 56,000 110 Takata Corp. 3,700 109 Hokkoku Bank Ltd. 32,000 107 Makino Milling Machine Co. Ltd. 13,000 107
Yoshinoya Holdings Co. Ltd. 7,400 105 Hitachi Kokusai Electric Inc. 8,000 105 Nishimatsu Construction Co. Ltd. 30,000 105 San-In Godo Bank Ltd. 15,000 104 Tokai Tokyo Financial Holdings Inc. 12,000 104 Japan Petroleum Exploration Co. 2,800 104 Sanwa Holdings Corp. 15,000 104 Keiyo Bank Ltd. 24,000 103 Musashino Bank Ltd. 3,200 103 * Nippon Yakin Kogyo Co. Ltd. 35,000 101 ^ Gree Inc. 10,300 101 Mizuno Corp. 20,000 100 Exedy Corp. 3,200 100 Dunlop Sports Co. Ltd. 8,000 100 Matsuya Foods Co. Ltd. 5,600 100 OSG Corp. 5,400 100 Relo Holdings Inc. 1,900 99 Hoshizaki Electric Co. Ltd. 2,782 99 Toyo Kanetsu KK 36,000 99 Higo Bank Ltd. 19,000 99 SKY Perfect JSAT Holdings Inc. 19,100 99 Nagatanien Co. Ltd. 11,000 99 Tadano Ltd. 7,000 98 Kinden Corp. 10,000 98 Nisshin Steel Holdings Co. Ltd. 9,200 98 Royal Holdings Co. Ltd. 6,700 97 NET One Systems Co. Ltd. 15,600 97 Kaken Pharmaceutical Co. Ltd. 6,000 96 * Oki Electric Industry Co. Ltd. 42,000 96 Hioki EE Corp. 7,000 95 GMO internet Inc. 7,800 95 Kagoshima Bank Ltd. 16,000 95 Lintec Corp. 5,200 94 * Dainippon Screen Manufacturing Co. Ltd. 20,000 94 Onward Holdings Co. Ltd. 13,000 94 Nippo Corp. 6,000 94 Enplas Corp. 1,400 93 KYB Co. Ltd. 19,000 93 * Orient Corp. 41,500 92 Okumura Corp. 21,000 92 Hitachi Capital Corp. 3,700 92 Nagaileben Co. Ltd. 5,600 92 Japan Aviation Electronics Industry Ltd. 6,000 92 Iwatani Corp. 16,000 92 Mabuchi Motor Co. Ltd. 1,600 92 Kyowa Exeo Corp. 7,000 91 Nipro Corp. 10,400 91 Sumitomo Osaka Cement Co. Ltd. 24,000 90 Dwango Co. Ltd. 3,600 90 UNY Group Holdings Co. Ltd. 14,900 89 Daifuku Co. Ltd. 7,500 89 Zensho Holdings Co. Ltd. 7,900 89 * Leopalace21 Corp. 17,100 89 Nifco Inc. 3,401 89 Miura Co. Ltd. 3,400 88 Tokyo Electron Device Ltd. 5,800 88 HIS Co. Ltd. 1,600 88
Nichiden Corp. 4,000 87 Maeda Corp. 13,000 87 Heiwa Corp. 4,900 87 Horiba Ltd. 2,400 87 * Pioneer Corp. 41,100 87 Nihon Parkerizing Co. Ltd. 4,000 86 Tokai Rika Co. Ltd. 4,700 86 Tokyotokeiba Co. Ltd. 25,000 86 Toshiba TEC Corp. 13,000 86 Toho Bank Ltd. 28,000 86 Calsonic Kansei Corp. 17,000 85 Toyo Tire & Rubber Co. Ltd. 15,000 84 United Arrows Ltd. 2,600 84 Takaoka Toko Holdings Co. Ltd. 4,800 84 Fuji Media Holdings Inc. 4,500 84 Nippon Television Holdings Inc. 4,900 84 Kadokawa Corp. 2,600 84 Jeol Ltd. 18,000 84 Nihon Nohyaku Co. Ltd. 6,000 83 Okasan Securities Group Inc. 9,000 83 Topcon Corp. 6,000 83 Meitec Corp. 3,100 83 Nitto Boseki Co. Ltd. 19,000 83 Matsui Securities Co. Ltd. 7,300 83 Daibiru Corp. 7,300 82 Pigeon Corp. 1,800 82 Maeda Road Construction Co. Ltd. 5,000 82 Aica Kogyo Co. Ltd. 4,400 81 Ryosan Co. Ltd. 3,900 80 Nitto Kohki Co. Ltd. 4,500 80 Yamato Kogyo Co. Ltd. 2,700 80 NTT Urban Development Corp. 8,200 79 Sakata Seed Corp. 6,200 79 Modec Inc. 2,900 79 Noritz Corp. 3,800 79 Aeon Delight Co. Ltd. 3,900 78 * Kumagai Gumi Co. Ltd. 30,000 77 Bank of Okinawa Ltd. 2,100 77 Mitsuba Corp. 4,600 77 * Kiyo Bank Ltd. 5,807 76 Nikkiso Co. Ltd. 6,000 76 Okamoto Industries Inc. 23,000 76 Oracle Corp. Japan 1,900 75 Tsuruha Holdings Inc. 800 75 Hitachi Transport System Ltd. 4,700 74 Nichi-iko Pharmaceutical Co. Ltd. 4,950 74 Aomori Bank Ltd. 28,000 74 Colowide Co. Ltd. 7,000 73 Fujitec Co. Ltd. 6,000 73 Toyo Ink SC Holdings Co. Ltd. 15,000 73 MonotaRO Co. Ltd. 3,400 73 Toda Corp. 22,000 73 Autobacs Seven Co. Ltd. 4,500 73 Nexon Co. Ltd. 8,300 72 Hyakujushi Bank Ltd. 22,000 72 Itoham Foods Inc. 16,000 71 Ito En Ltd. 3,300 71
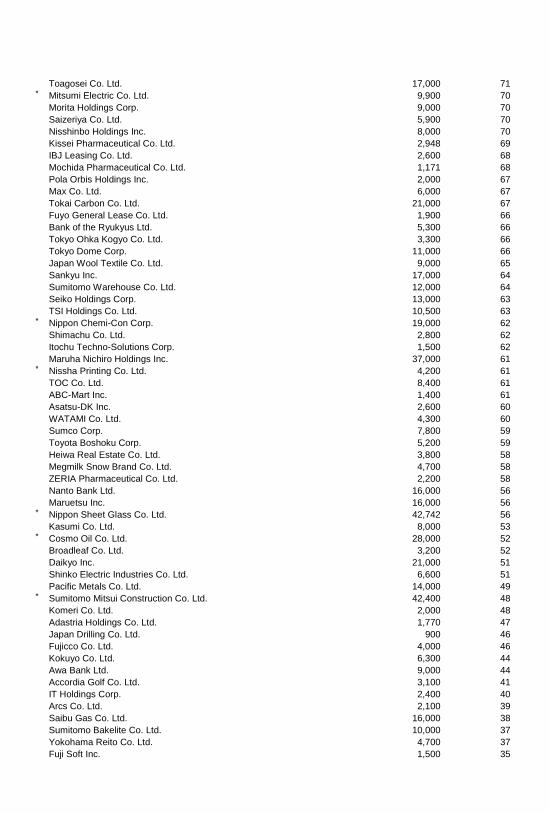
Toagosei Co. Ltd. 17,000 71 * Mitsumi Electric Co. Ltd. 9,900 70 Morita Holdings Corp. 9,000 70 Saizeriya Co. Ltd. 5,900 70 Nisshinbo Holdings Inc. 8,000 70 Kissei Pharmaceutical Co. Ltd. 2,948 69 IBJ Leasing Co. Ltd. 2,600 68 Mochida Pharmaceutical Co. Ltd. 1,171 68 Pola Orbis Holdings Inc. 2,000 67 Max Co. Ltd. 6,000 67 Tokai Carbon Co. Ltd. 21,000 67 Fuyo General Lease Co. Ltd. 1,900 66 Bank of the Ryukyus Ltd. 5,300 66 Tokyo Ohka Kogyo Co. Ltd. 3,300 66 Tokyo Dome Corp. 11,000 66 Japan Wool Textile Co. Ltd. 9,000 65 Sankyu Inc. 17,000 64 Sumitomo Warehouse Co. Ltd. 12,000 64 Seiko Holdings Corp. 13,000 63 TSI Holdings Co. Ltd. 10,500 63 * Nippon Chemi-Con Corp. 19,000 62 Shimachu Co. Ltd. 2,800 62 Itochu Techno-Solutions Corp. 1,500 62 Maruha Nichiro Holdings Inc. 37,000 61 * Nissha Printing Co. Ltd. 4,200 61 TOC Co. Ltd. 8,400 61 ABC-Mart Inc. 1,400 61 Asatsu-DK Inc. 2,600 60 WATAMI Co. Ltd. 4,300 60 Sumco Corp. 7,800 59 Toyota Boshoku Corp. 5,200 59 Heiwa Real Estate Co. Ltd. 3,800 58 Megmilk Snow Brand Co. Ltd. 4,700 58 ZERIA Pharmaceutical Co. Ltd. 2,200 58 Nanto Bank Ltd. 16,000 56 Maruetsu Inc. 16,000 56 * Nippon Sheet Glass Co. Ltd. 42,742 56 Kasumi Co. Ltd. 8,000 53 * Cosmo Oil Co. Ltd. 28,000 52 Broadleaf Co. Ltd. 3,200 52 Daikyo Inc. 21,000 51 Shinko Electric Industries Co. Ltd. 6,600 51 Pacific Metals Co. Ltd. 14,000 49 * Sumitomo Mitsui Construction Co. Ltd. 42,400 48 Komeri Co. Ltd. 2,000 48 Adastria Holdings Co. Ltd. 1,770 47 Japan Drilling Co. Ltd. 900 46 Fujicco Co. Ltd. 4,000 46 Kokuyo Co. Ltd. 6,300 44 Awa Bank Ltd. 9,000 44 Accordia Golf Co. Ltd. 3,100 41 IT Holdings Corp. 2,400 40 Arcs Co. Ltd. 2,100 39 Saibu Gas Co. Ltd. 16,000 38 Sumitomo Bakelite Co. Ltd. 10,000 37 Yokohama Reito Co. Ltd. 4,700 37 Fuji Soft Inc. 1,500 35
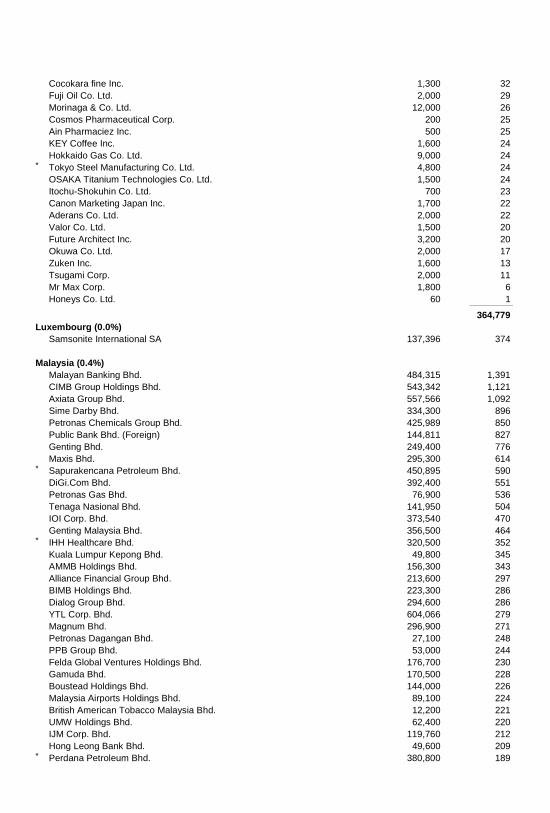
Cocokara fine Inc. 1,300 32 Fuji Oil Co. Ltd. 2,000 29 Morinaga & Co. Ltd. 12,000 26 Cosmos Pharmaceutical Corp. 200 25 Ain Pharmaciez Inc. 500 25 KEY Coffee Inc. 1,600 24 Hokkaido Gas Co. Ltd. 9,000 24 * Tokyo Steel Manufacturing Co. Ltd. 4,800 24 OSAKA Titanium Technologies Co. Ltd. 1,500 24 Itochu-Shokuhin Co. Ltd. 700 23 Canon Marketing Japan Inc. 1,700 22 Aderans Co. Ltd. 2,000 22 Valor Co. Ltd. 1,500 20 Future Architect Inc. 3,200 20 Okuwa Co. Ltd. 2,000 17 Zuken Inc. 1,600 13 Tsugami Corp. 2,000 11 Mr Max Corp. 1,800 6 Honeys Co. Ltd. 60 1 _____________
364,779
Luxembourg (0.0%)
Samsonite International SA 137,396 374
Malaysia (0.4%)
Malayan Banking Bhd. 484,315 1,391 CIMB Group Holdings Bhd. 543,342 1,121 Axiata Group Bhd. 557,566 1,092 Sime Darby Bhd. 334,300 896 Petronas Chemicals Group Bhd. 425,989 850 Public Bank Bhd. (Foreign) 144,811 827 Genting Bhd. 249,400 776 Maxis Bhd. 295,300 614 * Sapurakencana Petroleum Bhd. 450,895 590 DiGi.Com Bhd. 392,400 551 Petronas Gas Bhd. 76,900 536 Tenaga Nasional Bhd. 141,950 504 IOI Corp. Bhd. 373,540 470 Genting Malaysia Bhd. 356,500 464 * IHH Healthcare Bhd. 320,500 352 Kuala Lumpur Kepong Bhd. 49,800 345 AMMB Holdings Bhd. 156,300 343 Alliance Financial Group Bhd. 213,600 297 BIMB Holdings Bhd. 223,300 286 Dialog Group Bhd. 294,600 286 YTL Corp. Bhd. 604,066 279 Magnum Bhd. 296,900 271 Petronas Dagangan Bhd. 27,100 248 PPB Group Bhd. 53,000 244 Felda Global Ventures Holdings Bhd. 176,700 230 Gamuda Bhd. 170,500 228 Boustead Holdings Bhd. 144,000 226 Malaysia Airports Holdings Bhd. 89,100 224 British American Tobacco Malaysia Bhd. 12,200 221 UMW Holdings Bhd. 62,400 220 IJM Corp. Bhd. 119,760 212 Hong Leong Bank Bhd. 49,600 209 * Perdana Petroleum Bhd. 380,800 189
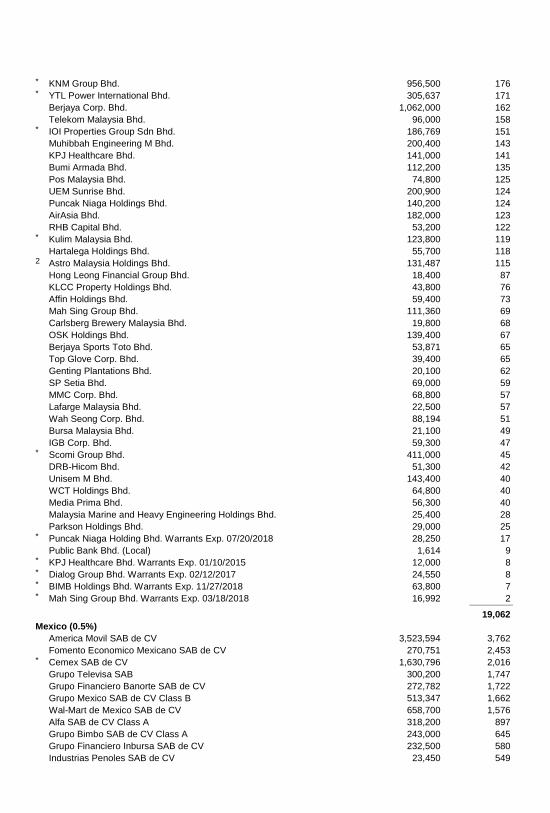
* KNM Group Bhd. 956,500 176 * YTL Power International Bhd. 305,637 171 Berjaya Corp. Bhd. 1,062,000 162 Telekom Malaysia Bhd. 96,000 158 * IOI Properties Group Sdn Bhd. 186,769 151 Muhibbah Engineering M Bhd. 200,400 143 KPJ Healthcare Bhd. 141,000 141 Bumi Armada Bhd. 112,200 135 Pos Malaysia Bhd. 74,800 125 UEM Sunrise Bhd. 200,900 124 Puncak Niaga Holdings Bhd. 140,200 124 AirAsia Bhd. 182,000 123 RHB Capital Bhd. 53,200 122 * Kulim Malaysia Bhd. 123,800 119 Hartalega Holdings Bhd. 55,700 118 2 Astro Malaysia Holdings Bhd. 131,487 115 Hong Leong Financial Group Bhd. 18,400 87 KLCC Property Holdings Bhd. 43,800 76 Affin Holdings Bhd. 59,400 73 Mah Sing Group Bhd. 111,360 69 Carlsberg Brewery Malaysia Bhd. 19,800 68 OSK Holdings Bhd. 139,400 67 Berjaya Sports Toto Bhd. 53,871 65 Top Glove Corp. Bhd. 39,400 65 Genting Plantations Bhd. 20,100 62 SP Setia Bhd. 69,000 59 MMC Corp. Bhd. 68,800 57 Lafarge Malaysia Bhd. 22,500 57 Wah Seong Corp. Bhd. 88,194 51 Bursa Malaysia Bhd. 21,100 49 IGB Corp. Bhd. 59,300 47 * Scomi Group Bhd. 411,000 45 DRB-Hicom Bhd. 51,300 42 Unisem M Bhd. 143,400 40 WCT Holdings Bhd. 64,800 40 Media Prima Bhd. 56,300 40 Malaysia Marine and Heavy Engineering Holdings Bhd. 25,400 28 Parkson Holdings Bhd. 29,000 25 * Puncak Niaga Holding Bhd. Warrants Exp. 07/20/2018 28,250 17 Public Bank Bhd. (Local) 1,614 9 * KPJ Healthcare Bhd. Warrants Exp. 01/10/2015 12,000 8 * Dialog Group Bhd. Warrants Exp. 02/12/2017 24,550 8 * BIMB Holdings Bhd. Warrants Exp. 11/27/2018 63,800 7 * Mah Sing Group Bhd. Warrants Exp. 03/18/2018 16,992 2 _____________
19,062
Mexico (0.5%)
America Movil SAB de CV 3,523,594 3,762 Fomento Economico Mexicano SAB de CV 270,751 2,453 * Cemex SAB de CV 1,630,796 2,016 Grupo Televisa SAB 300,200 1,747 Grupo Financiero Banorte SAB de CV 272,782 1,722 Grupo Mexico SAB de CV Class B 513,347 1,662 Wal-Mart de Mexico SAB de CV 658,700 1,576 Alfa SAB de CV Class A 318,200 897 Grupo Bimbo SAB de CV Class A 243,000 645 Grupo Financiero Inbursa SAB de CV 232,500 580 Industrias Penoles SAB de CV 23,450 549
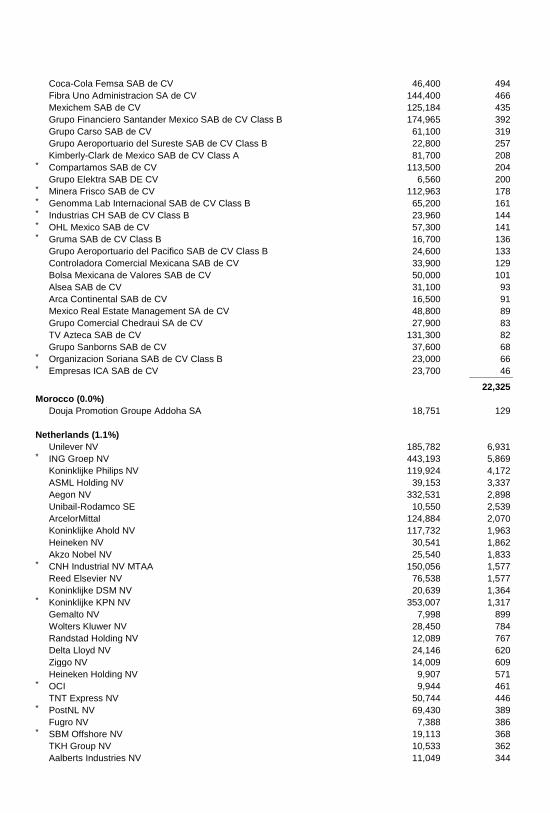
Coca-Cola Femsa SAB de CV 46,400 494 Fibra Uno Administracion SA de CV 144,400 466 Mexichem SAB de CV 125,184 435 Grupo Financiero Santander Mexico SAB de CV Class B 174,965 392 Grupo Carso SAB de CV 61,100 319 Grupo Aeroportuario del Sureste SAB de CV Class B 22,800 257 Kimberly-Clark de Mexico SAB de CV Class A 81,700 208 * Compartamos SAB de CV 113,500 204 Grupo Elektra SAB DE CV 6,560 200 * Minera Frisco SAB de CV 112,963 178 * Genomma Lab Internacional SAB de CV Class B 65,200 161 * Industrias CH SAB de CV Class B 23,960 144 * OHL Mexico SAB de CV 57,300 141 * Gruma SAB de CV Class B 16,700 136 Grupo Aeroportuario del Pacifico SAB de CV Class B 24,600 133 Controladora Comercial Mexicana SAB de CV 33,900 129 Bolsa Mexicana de Valores SAB de CV 50,000 101 Alsea SAB de CV 31,100 93 Arca Continental SAB de CV 16,500 91 Mexico Real Estate Management SA de CV 48,800 89 Grupo Comercial Chedraui SA de CV 27,900 83 TV Azteca SAB de CV 131,300 82 Grupo Sanborns SAB de CV 37,600 68 * Organizacion Soriana SAB de CV Class B 23,000 66 * Empresas ICA SAB de CV 23,700 46 _____________
22,325
Morocco (0.0%)
Douja Promotion Groupe Addoha SA 18,751 129
Netherlands (1.1%)
Unilever NV 185,782 6,931 * ING Groep NV 443,193 5,869 Koninklijke Philips NV 119,924 4,172 ASML Holding NV 39,153 3,337 Aegon NV 332,531 2,898 Unibail-Rodamco SE 10,550 2,539 ArcelorMittal 124,884 2,070 Koninklijke Ahold NV 117,732 1,963 Heineken NV 30,541 1,862 Akzo Nobel NV 25,540 1,833 * CNH Industrial NV MTAA 150,056 1,577 Reed Elsevier NV 76,538 1,577 Koninklijke DSM NV 20,639 1,364 * Koninklijke KPN NV 353,007 1,317 Gemalto NV 7,998 899 Wolters Kluwer NV 28,450 784 Randstad Holding NV 12,089 767 Delta Lloyd NV 24,146 620 Ziggo NV 14,009 609 Heineken Holding NV 9,907 571 * OCI 9,944 461 TNT Express NV 50,744 446 * PostNL NV 69,430 389 Fugro NV 7,388 386 * SBM Offshore NV 19,113 368 TKH Group NV 10,533 362 Aalberts Industries NV 11,049 344
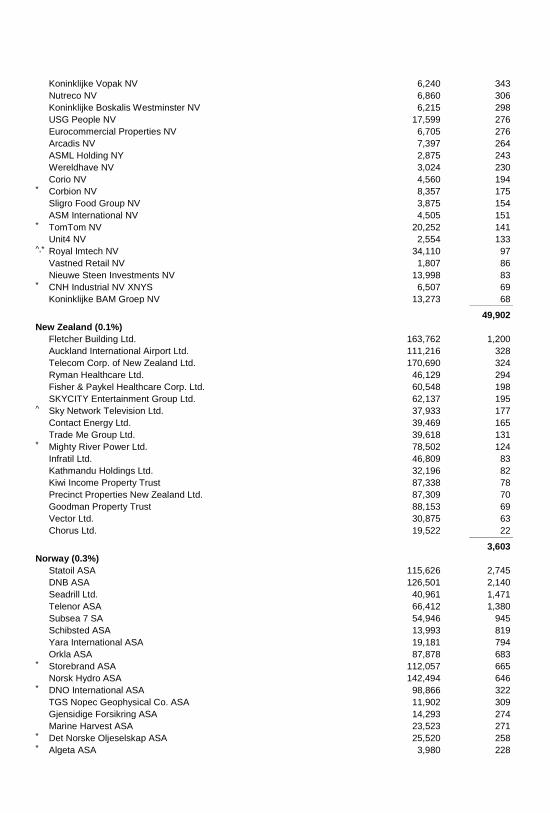
Koninklijke Vopak NV 6,240 343 Nutreco NV 6,860 306 Koninklijke Boskalis Westminster NV 6,215 298 USG People NV 17,599 276 Eurocommercial Properties NV 6,705 276 Arcadis NV 7,397 264 ASML Holding NY 2,875 243 Wereldhave NV 3,024 230 Corio NV 4,560 194 * Corbion NV 8,357 175 Sligro Food Group NV 3,875 154 ASM International NV 4,505 151 * TomTom NV 20,252 141 Unit4 NV 2,554 133 ^,* Royal Imtech NV 34,110 97 Vastned Retail NV 1,807 86 Nieuwe Steen Investments NV 13,998 83 * CNH Industrial NV XNYS 6,507 69 Koninklijke BAM Groep NV 13,273 68 _____________
49,902
New Zealand (0.1%)
Fletcher Building Ltd. 163,762 1,200 Auckland International Airport Ltd. 111,216 328 Telecom Corp. of New Zealand Ltd. 170,690 324 Ryman Healthcare Ltd. 46,129 294 Fisher & Paykel Healthcare Corp. Ltd. 60,548 198 SKYCITY Entertainment Group Ltd. 62,137 195 ^ Sky Network Television Ltd. 37,933 177 Contact Energy Ltd. 39,469 165 Trade Me Group Ltd. 39,618 131 * Mighty River Power Ltd. 78,502 124 Infratil Ltd. 46,809 83 Kathmandu Holdings Ltd. 32,196 82 Kiwi Income Property Trust 87,338 78 Precinct Properties New Zealand Ltd. 87,309 70 Goodman Property Trust 88,153 69 Vector Ltd. 30,875 63 Chorus Ltd. 19,522 22 _____________
3,603
Norway (0.3%)
Statoil ASA 115,626 2,745 DNB ASA 126,501 2,140 Seadrill Ltd. 40,961 1,471 Telenor ASA 66,412 1,380 Subsea 7 SA 54,946 945 Schibsted ASA 13,993 819 Yara International ASA 19,181 794 Orkla ASA 87,878 683 * Storebrand ASA 112,057 665 Norsk Hydro ASA 142,494 646 * DNO International ASA 98,866 322 TGS Nopec Geophysical Co. ASA 11,902 309 Gjensidige Forsikring ASA 14,293 274 Marine Harvest ASA 23,523 271 * Det Norske Oljeselskap ASA 25,520 258 * Algeta ASA 3,980 228
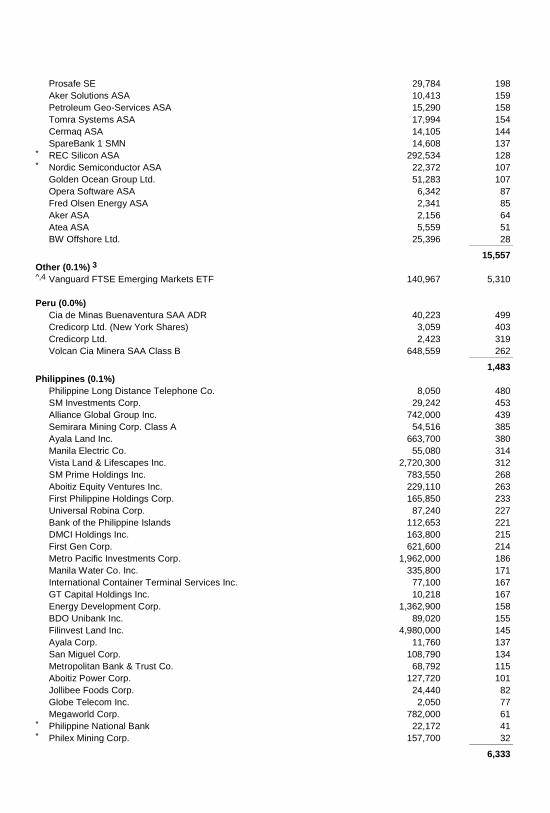
Prosafe SE 29,784 198 Aker Solutions ASA 10,413 159 Petroleum Geo-Services ASA 15,290 158 Tomra Systems ASA 17,994 154 Cermaq ASA 14,105 144 SpareBank 1 SMN 14,608 137 * REC Silicon ASA 292,534 128 * Nordic Semiconductor ASA 22,372 107 Golden Ocean Group Ltd. 51,283 107 Opera Software ASA 6,342 87 Fred Olsen Energy ASA 2,341 85 Aker ASA 2,156 64 Atea ASA 5,559 51 BW Offshore Ltd. 25,396 28 _____________
15,557
Other (0.1%) 3
^,4 Vanguard FTSE Emerging Markets ETF 140,967 5,310
Peru (0.0%)
Cia de Minas Buenaventura SAA ADR 40,223 499 Credicorp Ltd. (New York Shares) 3,059 403 Credicorp Ltd. 2,423 319 Volcan Cia Minera SAA Class B 648,559 262 _____________
1,483
Philippines (0.1%)
Philippine Long Distance Telephone Co. 8,050 480 SM Investments Corp. 29,242 453 Alliance Global Group Inc. 742,000 439 Semirara Mining Corp. Class A 54,516 385 Ayala Land Inc. 663,700 380 Manila Electric Co. 55,080 314 Vista Land & Lifescapes Inc. 2,720,300 312 SM Prime Holdings Inc. 783,550 268 Aboitiz Equity Ventures Inc. 229,110 263 First Philippine Holdings Corp. 165,850 233 Universal Robina Corp. 87,240 227 Bank of the Philippine Islands 112,653 221 DMCI Holdings Inc. 163,800 215 First Gen Corp. 621,600 214 Metro Pacific Investments Corp. 1,962,000 186 Manila Water Co. Inc. 335,800 171 International Container Terminal Services Inc. 77,100 167 GT Capital Holdings Inc. 10,218 167 Energy Development Corp. 1,362,900 158 BDO Unibank Inc. 89,020 155 Filinvest Land Inc. 4,980,000 145 Ayala Corp. 11,760 137 San Miguel Corp. 108,790 134 Metropolitan Bank & Trust Co. 68,792 115 Aboitiz Power Corp. 127,720 101 Jollibee Foods Corp. 24,440 82 Globe Telecom Inc. 2,050 77 Megaworld Corp. 782,000 61 * Philippine National Bank 22,172 41 * Philex Mining Corp. 157,700 32 _____________
6,333
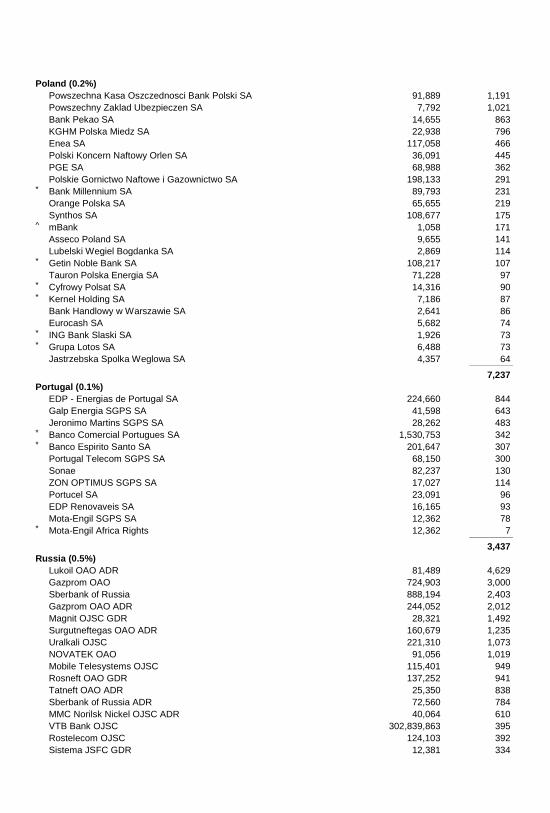
Poland (0.2%)
Powszechna Kasa Oszczednosci Bank Polski SA 91,889 1,191 Powszechny Zaklad Ubezpieczen SA 7,792 1,021 Bank Pekao SA 14,655 863 KGHM Polska Miedz SA 22,938 796 Enea SA 117,058 466 Polski Koncern Naftowy Orlen SA 36,091 445 PGE SA 68,988 362 Polskie Gornictwo Naftowe i Gazownictwo SA 198,133 291 * Bank Millennium SA 89,793 231 Orange Polska SA 65,655 219 Synthos SA 108,677 175 ^ mBank 1,058 171 Asseco Poland SA 9,655 141 Lubelski Wegiel Bogdanka SA 2,869 114 * Getin Noble Bank SA 108,217 107 Tauron Polska Energia SA 71,228 97 * Cyfrowy Polsat SA 14,316 90 * Kernel Holding SA 7,186 87 Bank Handlowy w Warszawie SA 2,641 86 Eurocash SA 5,682 74 * ING Bank Slaski SA 1,926 73 * Grupa Lotos SA 6,488 73 Jastrzebska Spolka Weglowa SA 4,357 64 _____________
7,237
Portugal (0.1%)
EDP - Energias de Portugal SA 224,660 844 Galp Energia SGPS SA 41,598 643 Jeronimo Martins SGPS SA 28,262 483 * Banco Comercial Portugues SA 1,530,753 342 * Banco Espirito Santo SA 201,647 307 Portugal Telecom SGPS SA 68,150 300 Sonae 82,237 130 ZON OPTIMUS SGPS SA 17,027 114 Portucel SA 23,091 96 EDP Renovaveis SA 16,165 93 Mota-Engil SGPS SA 12,362 78 * Mota-Engil Africa Rights 12,362 7 _____________
3,437
Russia (0.5%)
Lukoil OAO ADR 81,489 4,629 Gazprom OAO 724,903 3,000 Sberbank of Russia 888,194 2,403 Gazprom OAO ADR 244,052 2,012 Magnit OJSC GDR 28,321 1,492 Surgutneftegas OAO ADR 160,679 1,235 Uralkali OJSC 221,310 1,073 NOVATEK OAO 91,056 1,019 Mobile Telesystems OJSC 115,401 949 Rosneft OAO GDR 137,252 941 Tatneft OAO ADR 25,350 838 Sberbank of Russia ADR 72,560 784 MMC Norilsk Nickel OJSC ADR 40,064 610 VTB Bank OJSC 302,839,863 395 Rostelecom OJSC 124,103 392 Sistema JSFC GDR 12,381 334
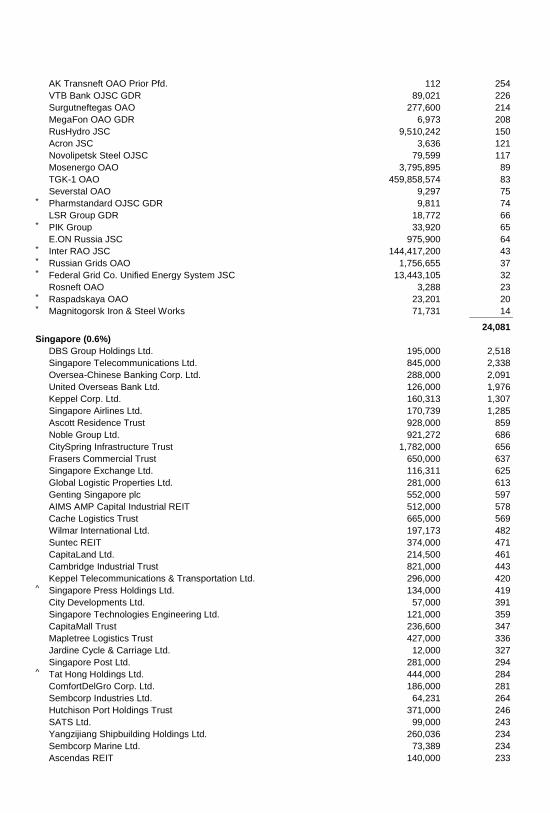
AK Transneft OAO Prior Pfd. 112 254 VTB Bank OJSC GDR 89,021 226 Surgutneftegas OAO 277,600 214 MegaFon OAO GDR 6,973 208 RusHydro JSC 9,510,242 150 Acron JSC 3,636 121 Novolipetsk Steel OJSC 79,599 117 Mosenergo OAO 3,795,895 89 TGK-1 OAO 459,858,574 83 Severstal OAO 9,297 75 * Pharmstandard OJSC GDR 9,811 74 LSR Group GDR 18,772 66 * PIK Group 33,920 65 E.ON Russia JSC 975,900 64 * Inter RAO JSC 144,417,200 43 * Russian Grids OAO 1,756,655 37 * Federal Grid Co. Unified Energy System JSC 13,443,105 32 Rosneft OAO 3,288 23 * Raspadskaya OAO 23,201 20 * Magnitogorsk Iron & Steel Works 71,731 14 _____________
24,081
Singapore (0.6%)
DBS Group Holdings Ltd. 195,000 2,518 Singapore Telecommunications Ltd. 845,000 2,338 Oversea-Chinese Banking Corp. Ltd. 288,000 2,091 United Overseas Bank Ltd. 126,000 1,976 Keppel Corp. Ltd. 160,313 1,307 Singapore Airlines Ltd. 170,739 1,285 Ascott Residence Trust 928,000 859 Noble Group Ltd. 921,272 686 CitySpring Infrastructure Trust 1,782,000 656 Frasers Commercial Trust 650,000 637 Singapore Exchange Ltd. 116,311 625 Global Logistic Properties Ltd. 281,000 613 Genting Singapore plc 552,000 597 AIMS AMP Capital Industrial REIT 512,000 578 Cache Logistics Trust 665,000 569 Wilmar International Ltd. 197,173 482 Suntec REIT 374,000 471 CapitaLand Ltd. 214,500 461 Cambridge Industrial Trust 821,000 443 Keppel Telecommunications & Transportation Ltd. 296,000 420 ^ Singapore Press Holdings Ltd. 134,000 419 City Developments Ltd. 57,000 391 Singapore Technologies Engineering Ltd. 121,000 359 CapitaMall Trust 236,600 347 Mapletree Logistics Trust 427,000 336 Jardine Cycle & Carriage Ltd. 12,000 327 Singapore Post Ltd. 281,000 294 ^ Tat Hong Holdings Ltd. 444,000 284 ComfortDelGro Corp. Ltd. 186,000 281 Sembcorp Industries Ltd. 64,231 264 Hutchison Port Holdings Trust 371,000 246 SATS Ltd. 99,000 243 Yangzijiang Shipbuilding Holdings Ltd. 260,036 234 Sembcorp Marine Ltd. 73,389 234 Ascendas REIT 140,000 233
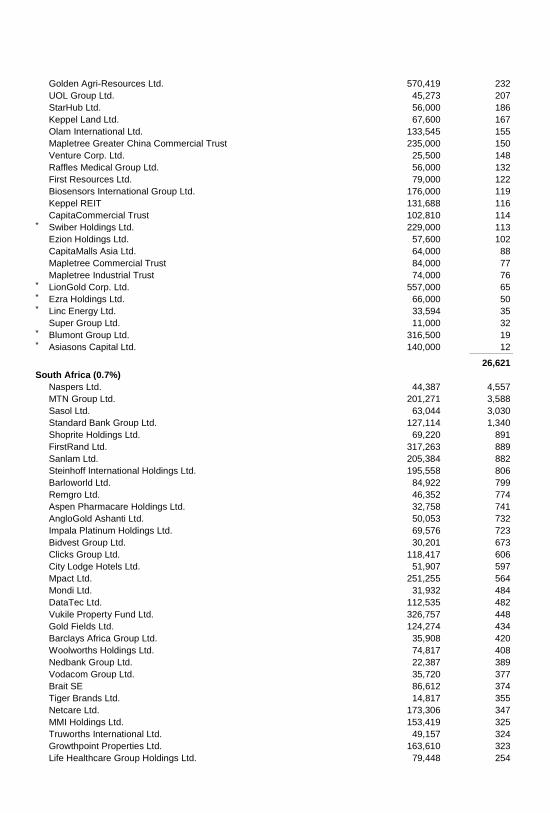
Golden Agri-Resources Ltd. 570,419 232 UOL Group Ltd. 45,273 207 StarHub Ltd. 56,000 186 Keppel Land Ltd. 67,600 167 Olam International Ltd. 133,545 155 Mapletree Greater China Commercial Trust 235,000 150 Venture Corp. Ltd. 25,500 148 Raffles Medical Group Ltd. 56,000 132 First Resources Ltd. 79,000 122 Biosensors International Group Ltd. 176,000 119 Keppel REIT 131,688 116 CapitaCommercial Trust 102,810 114 * Swiber Holdings Ltd. 229,000 113 Ezion Holdings Ltd. 57,600 102 CapitaMalls Asia Ltd. 64,000 88 Mapletree Commercial Trust 84,000 77 Mapletree Industrial Trust 74,000 76 * LionGold Corp. Ltd. 557,000 65 * Ezra Holdings Ltd. 66,000 50 * Linc Energy Ltd. 33,594 35 Super Group Ltd. 11,000 32 * Blumont Group Ltd. 316,500 19 * Asiasons Capital Ltd. 140,000 12 _____________
26,621
South Africa (0.7%)
Naspers Ltd. 44,387 4,557 MTN Group Ltd. 201,271 3,588 Sasol Ltd. 63,044 3,030 Standard Bank Group Ltd. 127,114 1,340 Shoprite Holdings Ltd. 69,220 891 FirstRand Ltd. 317,263 889 Sanlam Ltd. 205,384 882 Steinhoff International Holdings Ltd. 195,558 806 Barloworld Ltd. 84,922 799 Remgro Ltd. 46,352 774 Aspen Pharmacare Holdings Ltd. 32,758 741 AngloGold Ashanti Ltd. 50,053 732 Impala Platinum Holdings Ltd. 69,576 723 Bidvest Group Ltd. 30,201 673 Clicks Group Ltd. 118,417 606 City Lodge Hotels Ltd. 51,907 597 Mpact Ltd. 251,255 564 Mondi Ltd. 31,932 484 DataTec Ltd. 112,535 482 Vukile Property Fund Ltd. 326,757 448 Gold Fields Ltd. 124,274 434 Barclays Africa Group Ltd. 35,908 420 Woolworths Holdings Ltd. 74,817 408 Nedbank Group Ltd. 22,387 389 Vodacom Group Ltd. 35,720 377 Brait SE 86,612 374 Tiger Brands Ltd. 14,817 355 Netcare Ltd. 173,306 347 MMI Holdings Ltd. 153,419 325 Truworths International Ltd. 49,157 324 Growthpoint Properties Ltd. 163,610 323 Life Healthcare Group Holdings Ltd. 79,448 254
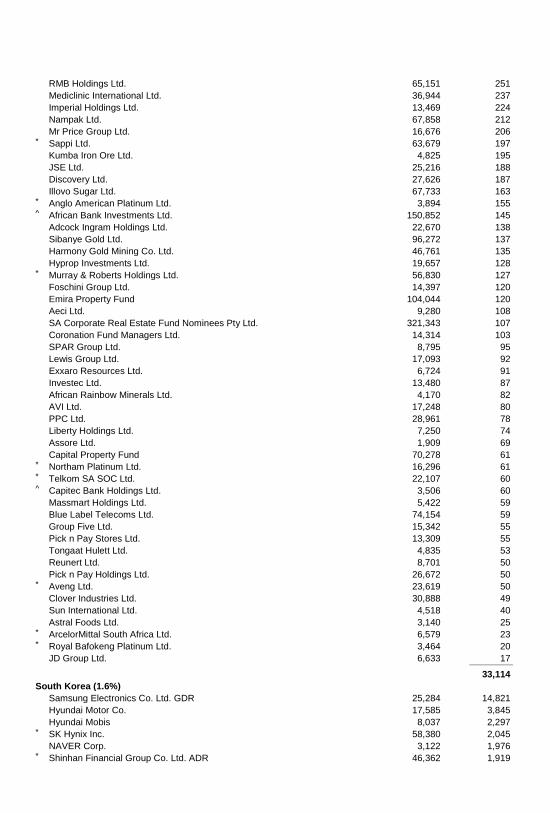
RMB Holdings Ltd. 65,151 251 Mediclinic International Ltd. 36,944 237 Imperial Holdings Ltd. 13,469 224 Nampak Ltd. 67,858 212 Mr Price Group Ltd. 16,676 206 * Sappi Ltd. 63,679 197 Kumba Iron Ore Ltd. 4,825 195 JSE Ltd. 25,216 188 Discovery Ltd. 27,626 187 Illovo Sugar Ltd. 67,733 163 * Anglo American Platinum Ltd. 3,894 155 ^ African Bank Investments Ltd. 150,852 145 Adcock Ingram Holdings Ltd. 22,670 138 Sibanye Gold Ltd. 96,272 137 Harmony Gold Mining Co. Ltd. 46,761 135 Hyprop Investments Ltd. 19,657 128 * Murray & Roberts Holdings Ltd. 56,830 127 Foschini Group Ltd. 14,397 120 Emira Property Fund 104,044 120 Aeci Ltd. 9,280 108 SA Corporate Real Estate Fund Nominees Pty Ltd. 321,343 107 Coronation Fund Managers Ltd. 14,314 103 SPAR Group Ltd. 8,795 95 Lewis Group Ltd. 17,093 92 Exxaro Resources Ltd. 6,724 91 Investec Ltd. 13,480 87 African Rainbow Minerals Ltd. 4,170 82 AVI Ltd. 17,248 80 PPC Ltd. 28,961 78 Liberty Holdings Ltd. 7,250 74 Assore Ltd. 1,909 69 Capital Property Fund 70,278 61 * Northam Platinum Ltd. 16,296 61 * Telkom SA SOC Ltd. 22,107 60 ^ Capitec Bank Holdings Ltd. 3,506 60 Massmart Holdings Ltd. 5,422 59 Blue Label Telecoms Ltd. 74,154 59 Group Five Ltd. 15,342 55 Pick n Pay Stores Ltd. 13,309 55 Tongaat Hulett Ltd. 4,835 53 Reunert Ltd. 8,701 50 Pick n Pay Holdings Ltd. 26,672 50 * Aveng Ltd. 23,619 50 Clover Industries Ltd. 30,888 49 Sun International Ltd. 4,518 40 Astral Foods Ltd. 3,140 25 * ArcelorMittal South Africa Ltd. 6,579 23 * Royal Bafokeng Platinum Ltd. 3,464 20 JD Group Ltd. 6,633 17 _____________
33,114
South Korea (1.6%)
Samsung Electronics Co. Ltd. GDR 25,284 14,821 Hyundai Motor Co. 17,585 3,845 Hyundai Mobis 8,037 2,297 * SK Hynix Inc. 58,380 2,045 NAVER Corp. 3,122 1,976 * Shinhan Financial Group Co. Ltd. ADR 46,362 1,919
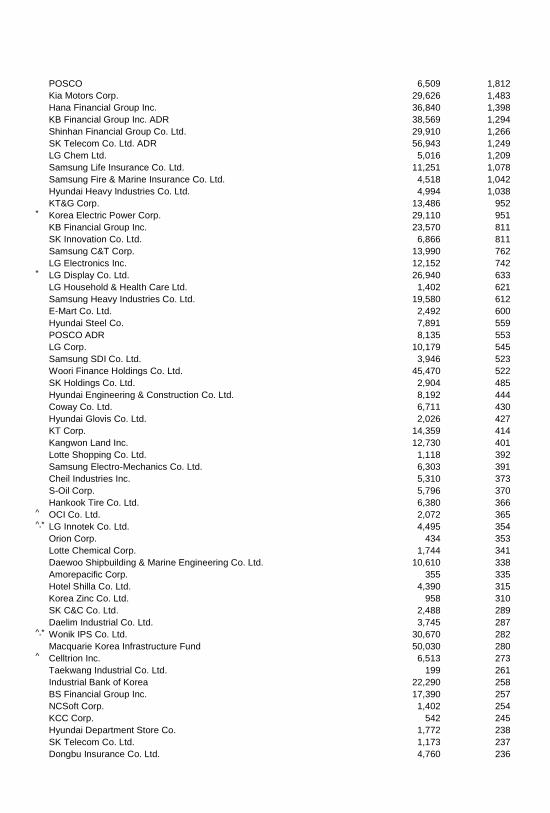
POSCO 6,509 1,812 Kia Motors Corp. 29,626 1,483 Hana Financial Group Inc. 36,840 1,398 KB Financial Group Inc. ADR 38,569 1,294 Shinhan Financial Group Co. Ltd. 29,910 1,266 SK Telecom Co. Ltd. ADR 56,943 1,249 LG Chem Ltd. 5,016 1,209 Samsung Life Insurance Co. Ltd. 11,251 1,078 Samsung Fire & Marine Insurance Co. Ltd. 4,518 1,042 Hyundai Heavy Industries Co. Ltd. 4,994 1,038 KT&G Corp. 13,486 952 * Korea Electric Power Corp. 29,110 951 KB Financial Group Inc. 23,570 811 SK Innovation Co. Ltd. 6,866 811 Samsung C&T Corp. 13,990 762 LG Electronics Inc. 12,152 742 * LG Display Co. Ltd. 26,940 633 LG Household & Health Care Ltd. 1,402 621 Samsung Heavy Industries Co. Ltd. 19,580 612 E-Mart Co. Ltd. 2,492 600 Hyundai Steel Co. 7,891 559 POSCO ADR 8,135 553 LG Corp. 10,179 545 Samsung SDI Co. Ltd. 3,946 523 Woori Finance Holdings Co. Ltd. 45,470 522 SK Holdings Co. Ltd. 2,904 485 Hyundai Engineering & Construction Co. Ltd. 8,192 444 Coway Co. Ltd. 6,711 430 Hyundai Glovis Co. Ltd. 2,026 427 KT Corp. 14,359 414 Kangwon Land Inc. 12,730 401 Lotte Shopping Co. Ltd. 1,118 392 Samsung Electro-Mechanics Co. Ltd. 6,303 391 Cheil Industries Inc. 5,310 373 S-Oil Corp. 5,796 370 Hankook Tire Co. Ltd. 6,380 366 ^ OCI Co. Ltd. 2,072 365 ^,* LG Innotek Co. Ltd. 4,495 354 Orion Corp. 434 353 Lotte Chemical Corp. 1,744 341 Daewoo Shipbuilding & Marine Engineering Co. Ltd. 10,610 338 Amorepacific Corp. 355 335 Hotel Shilla Co. Ltd. 4,390 315 Korea Zinc Co. Ltd. 958 310 SK C&C Co. Ltd. 2,488 289 Daelim Industrial Co. Ltd. 3,745 287 ^,* Wonik IPS Co. Ltd. 30,670 282 Macquarie Korea Infrastructure Fund 50,030 280 ^ Celltrion Inc. 6,513 273 Taekwang Industrial Co. Ltd. 199 261 Industrial Bank of Korea 22,290 258 BS Financial Group Inc. 17,390 257 NCSoft Corp. 1,402 254 KCC Corp. 542 245 Hyundai Department Store Co. 1,772 238 SK Telecom Co. Ltd. 1,173 237 Dongbu Insurance Co. Ltd. 4,760 236
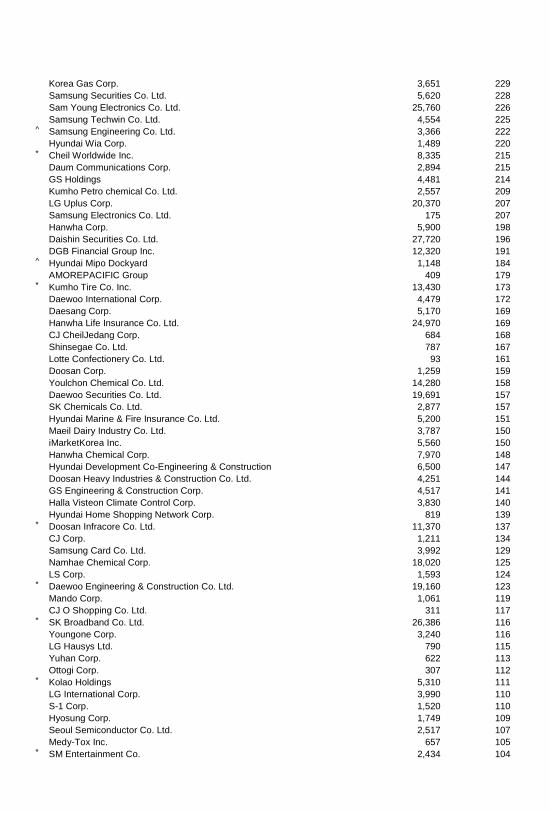
Korea Gas Corp. 3,651 229 Samsung Securities Co. Ltd. 5,620 228 Sam Young Electronics Co. Ltd. 25,760 226 Samsung Techwin Co. Ltd. 4,554 225 ^ Samsung Engineering Co. Ltd. 3,366 222 Hyundai Wia Corp. 1,489 220 * Cheil Worldwide Inc. 8,335 215 Daum Communications Corp. 2,894 215 GS Holdings 4,481 214 Kumho Petro chemical Co. Ltd. 2,557 209 LG Uplus Corp. 20,370 207 Samsung Electronics Co. Ltd. 175 207 Hanwha Corp. 5,900 198 Daishin Securities Co. Ltd. 27,720 196 DGB Financial Group Inc. 12,320 191 ^ Hyundai Mipo Dockyard 1,148 184 AMOREPACIFIC Group 409 179 * Kumho Tire Co. Inc. 13,430 173 Daewoo International Corp. 4,479 172 Daesang Corp. 5,170 169 Hanwha Life Insurance Co. Ltd. 24,970 169 CJ CheilJedang Corp. 684 168 Shinsegae Co. Ltd. 787 167 Lotte Confectionery Co. Ltd. 93 161 Doosan Corp. 1,259 159 Youlchon Chemical Co. Ltd. 14,280 158 Daewoo Securities Co. Ltd. 19,691 157 SK Chemicals Co. Ltd. 2,877 157 Hyundai Marine & Fire Insurance Co. Ltd. 5,200 151 Maeil Dairy Industry Co. Ltd. 3,787 150 iMarketKorea Inc. 5,560 150 Hanwha Chemical Corp. 7,970 148 Hyundai Development Co-Engineering & Construction 6,500 147 Doosan Heavy Industries & Construction Co. Ltd. 4,251 144 GS Engineering & Construction Corp. 4,517 141 Halla Visteon Climate Control Corp. 3,830 140 Hyundai Home Shopping Network Corp. 819 139 * Doosan Infracore Co. Ltd. 11,370 137 CJ Corp. 1,211 134 Samsung Card Co. Ltd. 3,992 129 Namhae Chemical Corp. 18,020 125 LS Corp. 1,593 124 * Daewoo Engineering & Construction Co. Ltd. 19,160 123 Mando Corp. 1,061 119 CJ O Shopping Co. Ltd. 311 117 * SK Broadband Co. Ltd. 26,386 116 Youngone Corp. 3,240 116 LG Hausys Ltd. 790 115 Yuhan Corp. 622 113 Ottogi Corp. 307 112 * Kolao Holdings 5,310 111 LG International Corp. 3,990 110 S-1 Corp. 1,520 110 Hyosung Corp. 1,749 109 Seoul Semiconductor Co. Ltd. 2,517 107 Medy-Tox Inc. 657 105 * SM Entertainment Co. 2,434 104
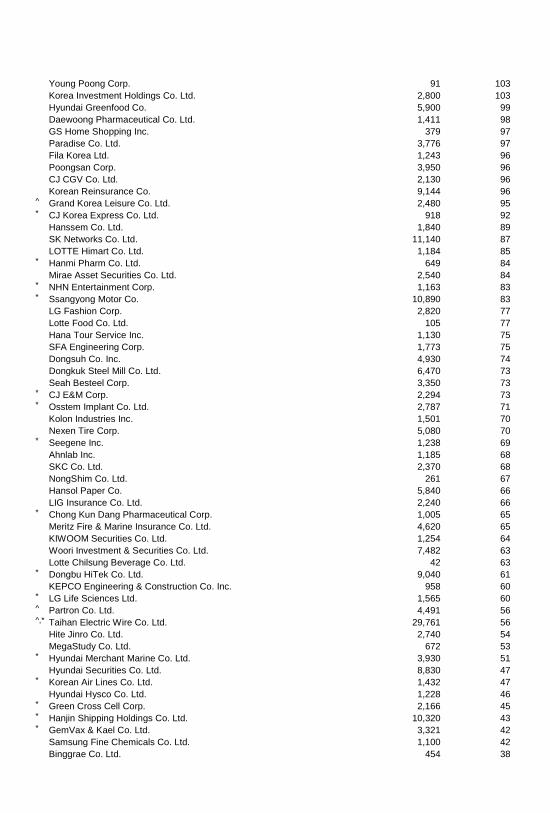
Young Poong Corp. 91 103 Korea Investment Holdings Co. Ltd. 2,800 103 Hyundai Greenfood Co. 5,900 99 Daewoong Pharmaceutical Co. Ltd. 1,411 98 GS Home Shopping Inc. 379 97 Paradise Co. Ltd. 3,776 97 Fila Korea Ltd. 1,243 96 Poongsan Corp. 3,950 96 CJ CGV Co. Ltd. 2,130 96 Korean Reinsurance Co. 9,144 96 ^ Grand Korea Leisure Co. Ltd. 2,480 95 * CJ Korea Express Co. Ltd. 918 92 Hanssem Co. Ltd. 1,840 89 SK Networks Co. Ltd. 11,140 87 LOTTE Himart Co. Ltd. 1,184 85 * Hanmi Pharm Co. Ltd. 649 84 Mirae Asset Securities Co. Ltd. 2,540 84 * NHN Entertainment Corp. 1,163 83 * Ssangyong Motor Co. 10,890 83 LG Fashion Corp. 2,820 77 Lotte Food Co. Ltd. 105 77 Hana Tour Service Inc. 1,130 75 SFA Engineering Corp. 1,773 75 Dongsuh Co. Inc. 4,930 74 Dongkuk Steel Mill Co. Ltd. 6,470 73 Seah Besteel Corp. 3,350 73 * CJ E&M Corp. 2,294 73 * Osstem Implant Co. Ltd. 2,787 71 Kolon Industries Inc. 1,501 70 Nexen Tire Corp. 5,080 70 * Seegene Inc. 1,238 69 Ahnlab Inc. 1,185 68 SKC Co. Ltd. 2,370 68 NongShim Co. Ltd. 261 67 Hansol Paper Co. 5,840 66 LIG Insurance Co. Ltd. 2,240 66 * Chong Kun Dang Pharmaceutical Corp. 1,005 65 Meritz Fire & Marine Insurance Co. Ltd. 4,620 65 KIWOOM Securities Co. Ltd. 1,254 64 Woori Investment & Securities Co. Ltd. 7,482 63 Lotte Chilsung Beverage Co. Ltd. 42 63 * Dongbu HiTek Co. Ltd. 9,040 61 KEPCO Engineering & Construction Co. Inc. 958 60 * LG Life Sciences Ltd. 1,565 60 ^ Partron Co. Ltd. 4,491 56 ^,* Taihan Electric Wire Co. Ltd. 29,761 56 Hite Jinro Co. Ltd. 2,740 54 MegaStudy Co. Ltd. 672 53 * Hyundai Merchant Marine Co. Ltd. 3,930 51 Hyundai Securities Co. Ltd. 8,830 47 * Korean Air Lines Co. Ltd. 1,432 47 Hyundai Hysco Co. Ltd. 1,228 46 * Green Cross Cell Corp. 2,166 45 * Hanjin Shipping Holdings Co. Ltd. 10,320 43 * GemVax & Kael Co. Ltd. 3,321 42 Samsung Fine Chemicals Co. Ltd. 1,100 42 Binggrae Co. Ltd. 454 38
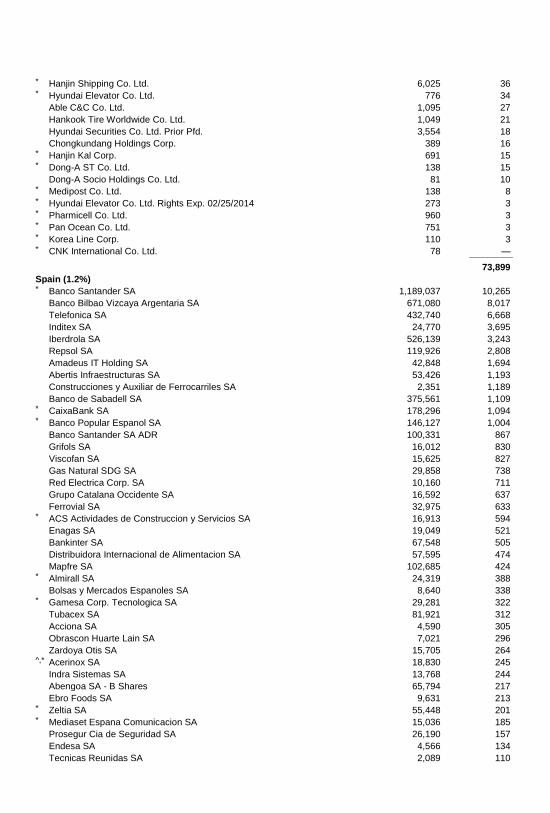
* Hanjin Shipping Co. Ltd. 6,025 36 * Hyundai Elevator Co. Ltd. 776 34 Able C&C Co. Ltd. 1,095 27 Hankook Tire Worldwide Co. Ltd. 1,049 21 Hyundai Securities Co. Ltd. Prior Pfd. 3,554 18 Chongkundang Holdings Corp. 389 16 * Hanjin Kal Corp. 691 15 * Dong-A ST Co. Ltd. 138 15 Dong-A Socio Holdings Co. Ltd. 81 10 * Medipost Co. Ltd. 138 8 * Hyundai Elevator Co. Ltd. Rights Exp. 02/25/2014 273 3 * Pharmicell Co. Ltd. 960 3 * Pan Ocean Co. Ltd. 751 3 * Korea Line Corp. 110 3 * CNK International Co. Ltd. 78 — _____________
73,899
Spain (1.2%)
* Banco Santander SA 1,189,037 10,265 Banco Bilbao Vizcaya Argentaria SA 671,080 8,017 Telefonica SA 432,740 6,668 Inditex SA 24,770 3,695 Iberdrola SA 526,139 3,243 Repsol SA 119,926 2,808 Amadeus IT Holding SA 42,848 1,694 Abertis Infraestructuras SA 53,426 1,193 Construcciones y Auxiliar de Ferrocarriles SA 2,351 1,189 Banco de Sabadell SA 375,561 1,109 * CaixaBank SA 178,296 1,094 * Banco Popular Espanol SA 146,127 1,004 Banco Santander SA ADR 100,331 867 Grifols SA 16,012 830 Viscofan SA 15,625 827 Gas Natural SDG SA 29,858 738 Red Electrica Corp. SA 10,160 711 Grupo Catalana Occidente SA 16,592 637 Ferrovial SA 32,975 633 * ACS Actividades de Construccion y Servicios SA 16,913 594 Enagas SA 19,049 521 Bankinter SA 67,548 505 Distribuidora Internacional de Alimentacion SA 57,595 474 Mapfre SA 102,685 424 * Almirall SA 24,319 388 Bolsas y Mercados Espanoles SA 8,640 338 * Gamesa Corp. Tecnologica SA 29,281 322 Tubacex SA 81,921 312 Acciona SA 4,590 305 Obrascon Huarte Lain SA 7,021 296 Zardoya Otis SA 15,705 264 ^,* Acerinox SA 18,830 245 Indra Sistemas SA 13,768 244 Abengoa SA - B Shares 65,794 217 Ebro Foods SA 9,631 213 * Zeltia SA 55,448 201 * Mediaset Espana Comunicacion SA 15,036 185 Prosegur Cia de Seguridad SA 26,190 157 Endesa SA 4,566 134 Tecnicas Reunidas SA 2,089 110
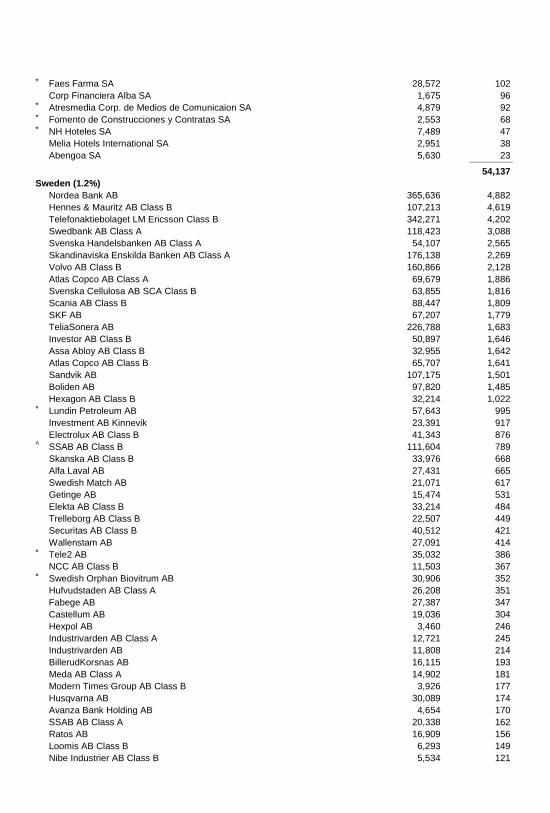
* Faes Farma SA 28,572 102 Corp Financiera Alba SA 1,675 96 * Atresmedia Corp. de Medios de Comunicaion SA 4,879 92 * Fomento de Construcciones y Contratas SA 2,553 68 * NH Hoteles SA 7,489 47 Melia Hotels International SA 2,951 38 Abengoa SA 5,630 23 _____________
54,137
Sweden (1.2%)
Nordea Bank AB 365,636 4,882 Hennes & Mauritz AB Class B 107,213 4,619 Telefonaktiebolaget LM Ericsson Class B 342,271 4,202 Swedbank AB Class A 118,423 3,088 Svenska Handelsbanken AB Class A 54,107 2,565 Skandinaviska Enskilda Banken AB Class A 176,138 2,269 Volvo AB Class B 160,866 2,128 Atlas Copco AB Class A 69,679 1,886 Svenska Cellulosa AB SCA Class B 63,855 1,816 Scania AB Class B 88,447 1,809 SKF AB 67,207 1,779 TeliaSonera AB 226,788 1,683 Investor AB Class B 50,897 1,646 Assa Abloy AB Class B 32,955 1,642 Atlas Copco AB Class B 65,707 1,641 Sandvik AB 107,175 1,501 Boliden AB 97,820 1,485 Hexagon AB Class B 32,214 1,022 * Lundin Petroleum AB 57,643 995 Investment AB Kinnevik 23,391 917 Electrolux AB Class B 41,343 876 ^ SSAB AB Class B 111,604 789 Skanska AB Class B 33,976 668 Alfa Laval AB 27,431 665 Swedish Match AB 21,071 617 Getinge AB 15,474 531 Elekta AB Class B 33,214 484 Trelleborg AB Class B 22,507 449 Securitas AB Class B 40,512 421 Wallenstam AB 27,091 414 * Tele2 AB 35,032 386 NCC AB Class B 11,503 367 * Swedish Orphan Biovitrum AB 30,906 352 Hufvudstaden AB Class A 26,208 351 Fabege AB 27,387 347 Castellum AB 19,036 304 Hexpol AB 3,460 246 Industrivarden AB Class A 12,721 245 Industrivarden AB 11,808 214 BillerudKorsnas AB 16,115 193 Meda AB Class A 14,902 181 Modern Times Group AB Class B 3,926 177 Husqvarna AB 30,089 174 Avanza Bank Holding AB 4,654 170 SSAB AB Class A 20,338 162 Ratos AB 16,909 156 Loomis AB Class B 6,293 149 Nibe Industrier AB Class B 5,534 121
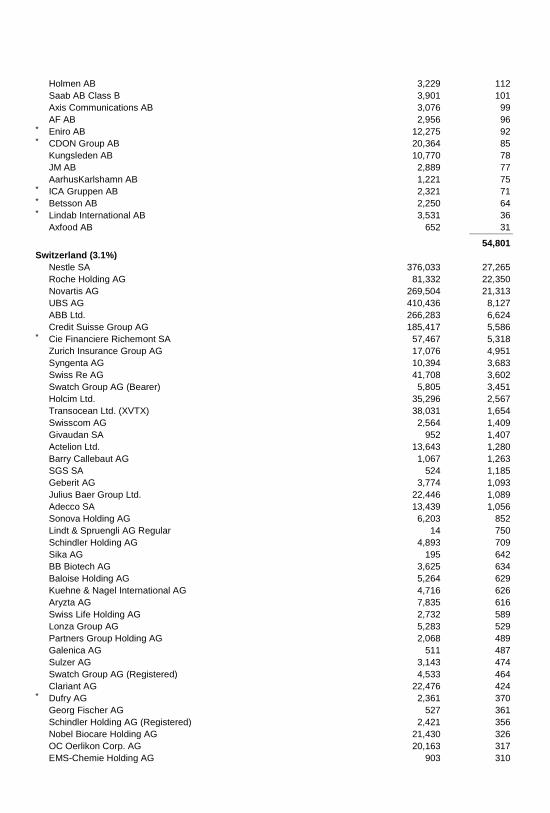
Holmen AB 3,229 112 Saab AB Class B 3,901 101 Axis Communications AB 3,076 99 AF AB 2,956 96 * Eniro AB 12,275 92 * CDON Group AB 20,364 85 Kungsleden AB 10,770 78 JM AB 2,889 77 AarhusKarlshamn AB 1,221 75 * ICA Gruppen AB 2,321 71 * Betsson AB 2,250 64 * Lindab International AB 3,531 36 Axfood AB 652 31 _____________
54,801
Switzerland (3.1%)
Nestle SA 376,033 27,265 Roche Holding AG 81,332 22,350 Novartis AG 269,504 21,313 UBS AG 410,436 8,127 ABB Ltd. 266,283 6,624 Credit Suisse Group AG 185,417 5,586 * Cie Financiere Richemont SA 57,467 5,318 Zurich Insurance Group AG 17,076 4,951 Syngenta AG 10,394 3,683 Swiss Re AG 41,708 3,602 Swatch Group AG (Bearer) 5,805 3,451 Holcim Ltd. 35,296 2,567 Transocean Ltd. (XVTX) 38,031 1,654 Swisscom AG 2,564 1,409 Givaudan SA 952 1,407 Actelion Ltd. 13,643 1,280 Barry Callebaut AG 1,067 1,263 SGS SA 524 1,185 Geberit AG 3,774 1,093 Julius Baer Group Ltd. 22,446 1,089 Adecco SA 13,439 1,056 Sonova Holding AG 6,203 852 Lindt & Spruengli AG Regular 14 750 Schindler Holding AG 4,893 709 Sika AG 195 642 BB Biotech AG 3,625 634 Baloise Holding AG 5,264 629 Kuehne & Nagel International AG 4,716 626 Aryzta AG 7,835 616 Swiss Life Holding AG 2,732 589 Lonza Group AG 5,283 529 Partners Group Holding AG 2,068 489 Galenica AG 511 487 Sulzer AG 3,143 474 Swatch Group AG (Registered) 4,533 464 Clariant AG 22,476 424 * Dufry AG 2,361 370 Georg Fischer AG 527 361 Schindler Holding AG (Registered) 2,421 356 Nobel Biocare Holding AG 21,430 326 OC Oerlikon Corp. AG 20,163 317 EMS-Chemie Holding AG 903 310
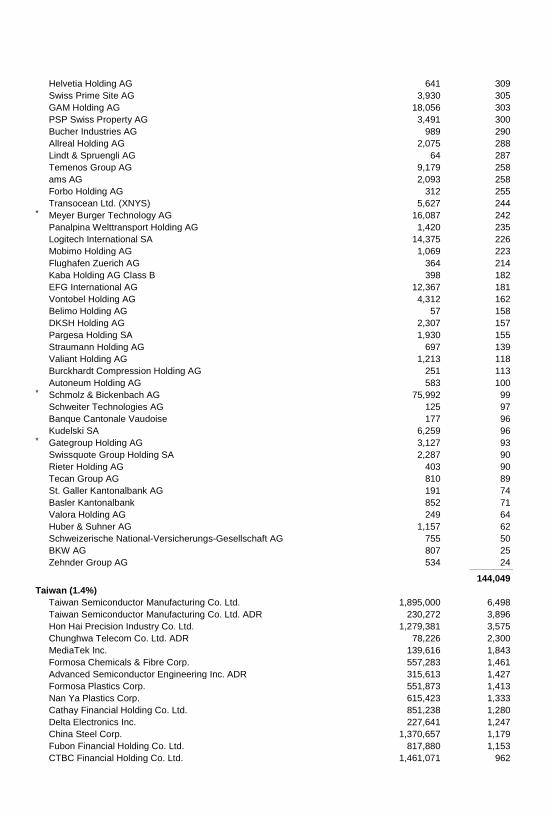
Helvetia Holding AG 641 309 Swiss Prime Site AG 3,930 305 GAM Holding AG 18,056 303 PSP Swiss Property AG 3,491 300 Bucher Industries AG 989 290 Allreal Holding AG 2,075 288 Lindt & Spruengli AG 64 287 Temenos Group AG 9,179 258 ams AG 2,093 258 Forbo Holding AG 312 255 Transocean Ltd. (XNYS) 5,627 244 * Meyer Burger Technology AG 16,087 242 Panalpina Welttransport Holding AG 1,420 235 Logitech International SA 14,375 226 Mobimo Holding AG 1,069 223 Flughafen Zuerich AG 364 214 Kaba Holding AG Class B 398 182 EFG International AG 12,367 181 Vontobel Holding AG 4,312 162 Belimo Holding AG 57 158 DKSH Holding AG 2,307 157 Pargesa Holding SA 1,930 155 Straumann Holding AG 697 139 Valiant Holding AG 1,213 118 Burckhardt Compression Holding AG 251 113 Autoneum Holding AG 583 100 * Schmolz & Bickenbach AG 75,992 99 Schweiter Technologies AG 125 97 Banque Cantonale Vaudoise 177 96 Kudelski SA 6,259 96 * Gategroup Holding AG 3,127 93 Swissquote Group Holding SA 2,287 90 Rieter Holding AG 403 90 Tecan Group AG 810 89 St. Galler Kantonalbank AG 191 74 Basler Kantonalbank 852 71 Valora Holding AG 249 64 Huber & Suhner AG 1,157 62 Schweizerische National-Versicherungs-Gesellschaft AG 755 50 BKW AG 807 25 Zehnder Group AG 534 24 _____________
144,049
Taiwan (1.4%)
Taiwan Semiconductor Manufacturing Co. Ltd. 1,895,000 6,498 Taiwan Semiconductor Manufacturing Co. Ltd. ADR 230,272 3,896 Hon Hai Precision Industry Co. Ltd. 1,279,381 3,575 Chunghwa Telecom Co. Ltd. ADR 78,226 2,300 MediaTek Inc. 139,616 1,843 Formosa Chemicals & Fibre Corp. 557,283 1,461 Advanced Semiconductor Engineering Inc. ADR 315,613 1,427 Formosa Plastics Corp. 551,873 1,413 Nan Ya Plastics Corp. 615,423 1,333 Cathay Financial Holding Co. Ltd. 851,238 1,280 Delta Electronics Inc. 227,641 1,247 China Steel Corp. 1,370,657 1,179 Fubon Financial Holding Co. Ltd. 817,880 1,153 CTBC Financial Holding Co. Ltd. 1,461,071 962
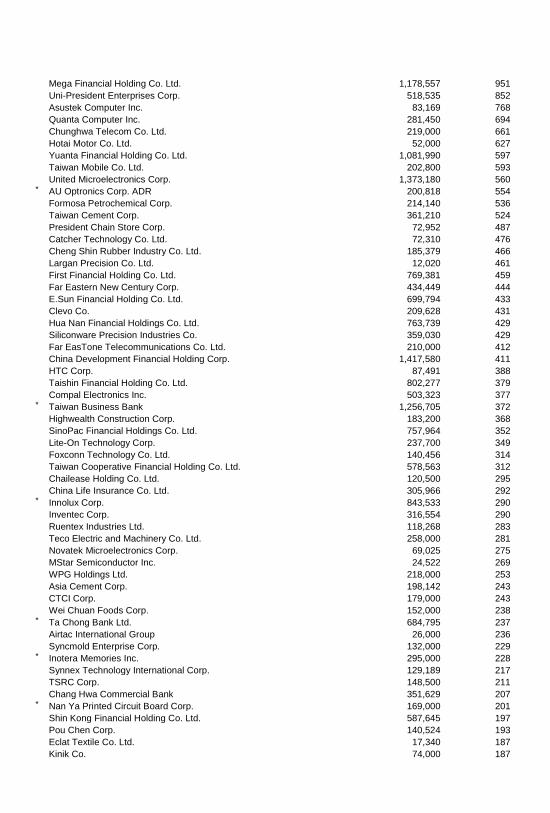
Mega Financial Holding Co. Ltd. 1,178,557 951 Uni-President Enterprises Corp. 518,535 852 Asustek Computer Inc. 83,169 768 Quanta Computer Inc. 281,450 694 Chunghwa Telecom Co. Ltd. 219,000 661 Hotai Motor Co. Ltd. 52,000 627 Yuanta Financial Holding Co. Ltd. 1,081,990 597 Taiwan Mobile Co. Ltd. 202,800 593 United Microelectronics Corp. 1,373,180 560 * AU Optronics Corp. ADR 200,818 554 Formosa Petrochemical Corp. 214,140 536 Taiwan Cement Corp. 361,210 524 President Chain Store Corp. 72,952 487 Catcher Technology Co. Ltd. 72,310 476 Cheng Shin Rubber Industry Co. Ltd. 185,379 466 Largan Precision Co. Ltd. 12,020 461 First Financial Holding Co. Ltd. 769,381 459 Far Eastern New Century Corp. 434,449 444 E.Sun Financial Holding Co. Ltd. 699,794 433 Clevo Co. 209,628 431 Hua Nan Financial Holdings Co. Ltd. 763,739 429 Siliconware Precision Industries Co. 359,030 429 Far EasTone Telecommunications Co. Ltd. 210,000 412 China Development Financial Holding Corp. 1,417,580 411 HTC Corp. 87,491 388 Taishin Financial Holding Co. Ltd. 802,277 379 Compal Electronics Inc. 503,323 377 * Taiwan Business Bank 1,256,705 372 Highwealth Construction Corp. 183,200 368 SinoPac Financial Holdings Co. Ltd. 757,964 352 Lite-On Technology Corp. 237,700 349 Foxconn Technology Co. Ltd. 140,456 314 Taiwan Cooperative Financial Holding Co. Ltd. 578,563 312 Chailease Holding Co. Ltd. 120,500 295 China Life Insurance Co. Ltd. 305,966 292 * Innolux Corp. 843,533 290 Inventec Corp. 316,554 290 Ruentex Industries Ltd. 118,268 283 Teco Electric and Machinery Co. Ltd. 258,000 281 Novatek Microelectronics Corp. 69,025 275 MStar Semiconductor Inc. 24,522 269 WPG Holdings Ltd. 218,000 253 Asia Cement Corp. 198,142 243 CTCI Corp. 179,000 243 Wei Chuan Foods Corp. 152,000 238 * Ta Chong Bank Ltd. 684,795 237 Airtac International Group 26,000 236 Syncmold Enterprise Corp. 132,000 229 * Inotera Memories Inc. 295,000 228 Synnex Technology International Corp. 129,189 217 TSRC Corp. 148,500 211 Chang Hwa Commercial Bank 351,629 207 * Nan Ya Printed Circuit Board Corp. 169,000 201 Shin Kong Financial Holding Co. Ltd. 587,645 197 Pou Chen Corp. 140,524 193 Eclat Textile Co. Ltd. 17,340 187 Kinik Co. 74,000 187
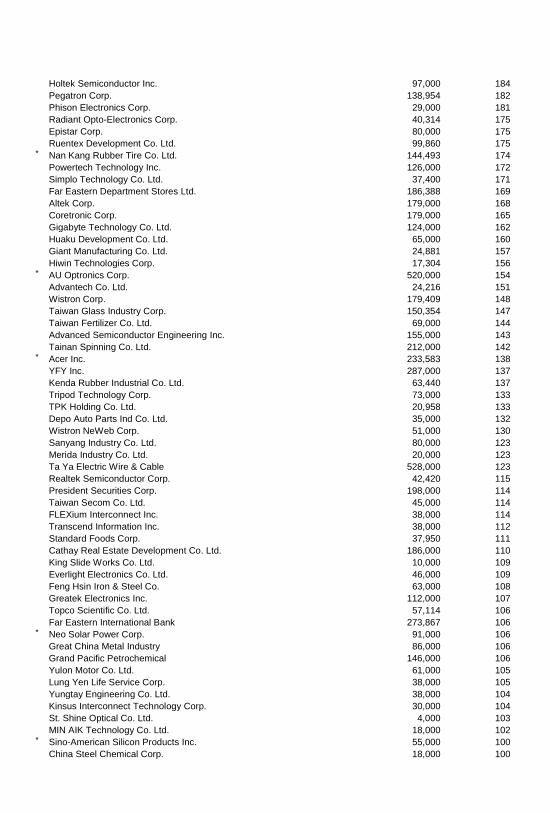
Holtek Semiconductor Inc. 97,000 184 Pegatron Corp. 138,954 182 Phison Electronics Corp. 29,000 181 Radiant Opto-Electronics Corp. 40,314 175 Epistar Corp. 80,000 175 Ruentex Development Co. Ltd. 99,860 175 * Nan Kang Rubber Tire Co. Ltd. 144,493 174 Powertech Technology Inc. 126,000 172 Simplo Technology Co. Ltd. 37,400 171 Far Eastern Department Stores Ltd. 186,388 169 Altek Corp. 179,000 168 Coretronic Corp. 179,000 165 Gigabyte Technology Co. Ltd. 124,000 162 Huaku Development Co. Ltd. 65,000 160 Giant Manufacturing Co. Ltd. 24,881 157 Hiwin Technologies Corp. 17,304 156 * AU Optronics Corp. 520,000 154 Advantech Co. Ltd. 24,216 151 Wistron Corp. 179,409 148 Taiwan Glass Industry Corp. 150,354 147 Taiwan Fertilizer Co. Ltd. 69,000 144 Advanced Semiconductor Engineering Inc. 155,000 143 Tainan Spinning Co. Ltd. 212,000 142 * Acer Inc. 233,583 138 YFY Inc. 287,000 137 Kenda Rubber Industrial Co. Ltd. 63,440 137 Tripod Technology Corp. 73,000 133 TPK Holding Co. Ltd. 20,958 133 Depo Auto Parts Ind Co. Ltd. 35,000 132 Wistron NeWeb Corp. 51,000 130 Sanyang Industry Co. Ltd. 80,000 123 Merida Industry Co. Ltd. 20,000 123 Ta Ya Electric Wire & Cable 528,000 123 Realtek Semiconductor Corp. 42,420 115 President Securities Corp. 198,000 114 Taiwan Secom Co. Ltd. 45,000 114 FLEXium Interconnect Inc. 38,000 114 Transcend Information Inc. 38,000 112 Standard Foods Corp. 37,950 111 Cathay Real Estate Development Co. Ltd. 186,000 110 King Slide Works Co. Ltd. 10,000 109 Everlight Electronics Co. Ltd. 46,000 109 Feng Hsin Iron & Steel Co. 63,000 108 Greatek Electronics Inc. 112,000 107 Topco Scientific Co. Ltd. 57,114 106 Far Eastern International Bank 273,867 106 * Neo Solar Power Corp. 91,000 106 Great China Metal Industry 86,000 106 Grand Pacific Petrochemical 146,000 106 Yulon Motor Co. Ltd. 61,000 105 Lung Yen Life Service Corp. 38,000 105 Yungtay Engineering Co. Ltd. 38,000 104 Kinsus Interconnect Technology Corp. 30,000 104 St. Shine Optical Co. Ltd. 4,000 103 MIN AIK Technology Co. Ltd. 18,000 102 * Sino-American Silicon Products Inc. 55,000 100 China Steel Chemical Corp. 18,000 100
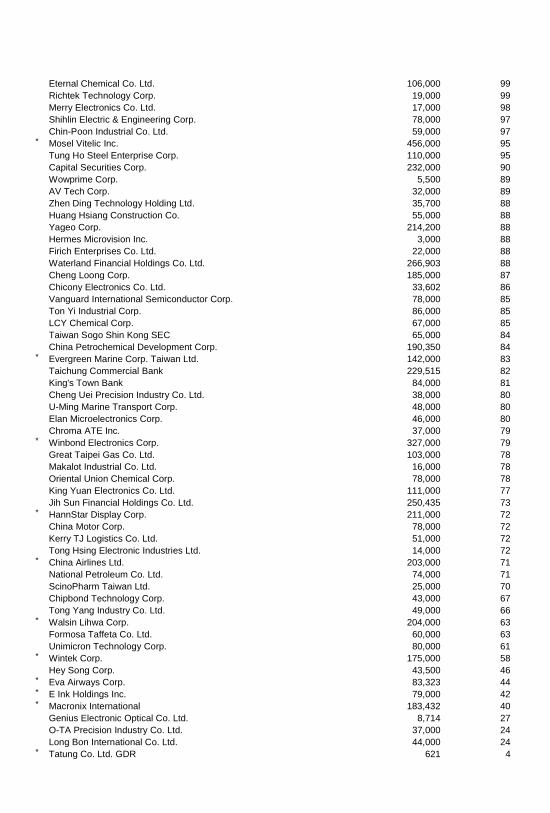
Eternal Chemical Co. Ltd. 106,000 99 Richtek Technology Corp. 19,000 99 Merry Electronics Co. Ltd. 17,000 98 Shihlin Electric & Engineering Corp. 78,000 97 Chin-Poon Industrial Co. Ltd. 59,000 97 * Mosel Vitelic Inc. 456,000 95 Tung Ho Steel Enterprise Corp. 110,000 95 Capital Securities Corp. 232,000 90 Wowprime Corp. 5,500 89 AV Tech Corp. 32,000 89 Zhen Ding Technology Holding Ltd. 35,700 88 Huang Hsiang Construction Co. 55,000 88 Yageo Corp. 214,200 88 Hermes Microvision Inc. 3,000 88 Firich Enterprises Co. Ltd. 22,000 88 Waterland Financial Holdings Co. Ltd. 266,903 88 Cheng Loong Corp. 185,000 87 Chicony Electronics Co. Ltd. 33,602 86 Vanguard International Semiconductor Corp. 78,000 85 Ton Yi Industrial Corp. 86,000 85 LCY Chemical Corp. 67,000 85 Taiwan Sogo Shin Kong SEC 65,000 84 China Petrochemical Development Corp. 190,350 84 * Evergreen Marine Corp. Taiwan Ltd. 142,000 83 Taichung Commercial Bank 229,515 82 King's Town Bank 84,000 81 Cheng Uei Precision Industry Co. Ltd. 38,000 80 U-Ming Marine Transport Corp. 48,000 80 Elan Microelectronics Corp. 46,000 80 Chroma ATE Inc. 37,000 79 * Winbond Electronics Corp. 327,000 79 Great Taipei Gas Co. Ltd. 103,000 78 Makalot Industrial Co. Ltd. 16,000 78 Oriental Union Chemical Corp. 78,000 78 King Yuan Electronics Co. Ltd. 111,000 77 Jih Sun Financial Holdings Co. Ltd. 250,435 73 * HannStar Display Corp. 211,000 72 China Motor Corp. 78,000 72 Kerry TJ Logistics Co. Ltd. 51,000 72 Tong Hsing Electronic Industries Ltd. 14,000 72 * China Airlines Ltd. 203,000 71 National Petroleum Co. Ltd. 74,000 71 ScinoPharm Taiwan Ltd. 25,000 70 Chipbond Technology Corp. 43,000 67 Tong Yang Industry Co. Ltd. 49,000 66 * Walsin Lihwa Corp. 204,000 63 Formosa Taffeta Co. Ltd. 60,000 63 Unimicron Technology Corp. 80,000 61 * Wintek Corp. 175,000 58 Hey Song Corp. 43,500 46 * Eva Airways Corp. 83,323 44 * E Ink Holdings Inc. 79,000 42 * Macronix International 183,432 40 Genius Electronic Optical Co. Ltd. 8,714 27 O-TA Precision Industry Co. Ltd. 37,000 24 Long Bon International Co. Ltd. 44,000 24 * Tatung Co. Ltd. GDR 621 4
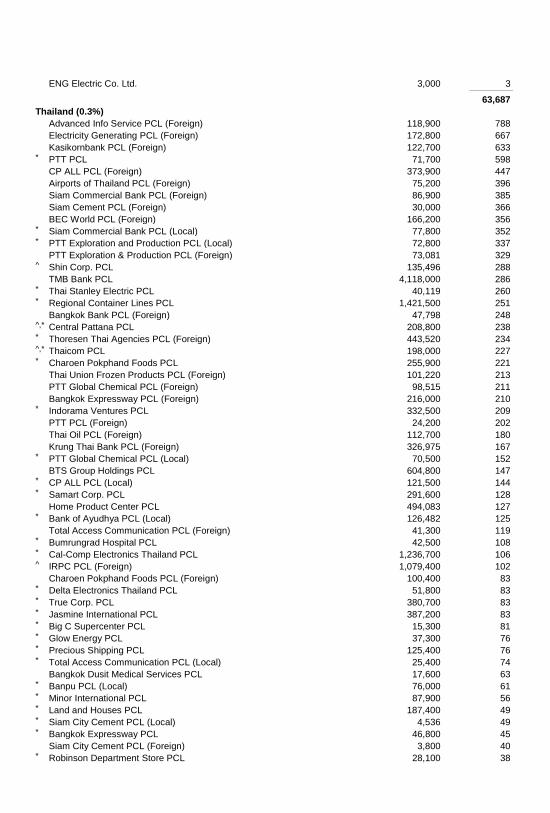
ENG Electric Co. Ltd. 3,000 3 _____________
63,687
Thailand (0.3%)
Advanced Info Service PCL (Foreign) 118,900 788 Electricity Generating PCL (Foreign) 172,800 667 Kasikornbank PCL (Foreign) 122,700 633 * PTT PCL 71,700 598 CP ALL PCL (Foreign) 373,900 447 Airports of Thailand PCL (Foreign) 75,200 396 Siam Commercial Bank PCL (Foreign) 86,900 385 Siam Cement PCL (Foreign) 30,000 366 BEC World PCL (Foreign) 166,200 356 * Siam Commercial Bank PCL (Local) 77,800 352 * PTT Exploration and Production PCL (Local) 72,800 337 PTT Exploration & Production PCL (Foreign) 73,081 329 ^ Shin Corp. PCL 135,496 288 TMB Bank PCL 4,118,000 286 * Thai Stanley Electric PCL 40,119 260 * Regional Container Lines PCL 1,421,500 251 Bangkok Bank PCL (Foreign) 47,798 248 ^,* Central Pattana PCL 208,800 238 * Thoresen Thai Agencies PCL (Foreign) 443,520 234 ^,* Thaicom PCL 198,000 227 * Charoen Pokphand Foods PCL 255,900 221 Thai Union Frozen Products PCL (Foreign) 101,220 213 PTT Global Chemical PCL (Foreign) 98,515 211 Bangkok Expressway PCL (Foreign) 216,000 210 * Indorama Ventures PCL 332,500 209 PTT PCL (Foreign) 24,200 202 Thai Oil PCL (Foreign) 112,700 180 Krung Thai Bank PCL (Foreign) 326,975 167 * PTT Global Chemical PCL (Local) 70,500 152 BTS Group Holdings PCL 604,800 147 * CP ALL PCL (Local) 121,500 144 * Samart Corp. PCL 291,600 128 Home Product Center PCL 494,083 127 * Bank of Ayudhya PCL (Local) 126,482 125 Total Access Communication PCL (Foreign) 41,300 119 * Bumrungrad Hospital PCL 42,500 108 * Cal-Comp Electronics Thailand PCL 1,236,700 106 ^ IRPC PCL (Foreign) 1,079,400 102 Charoen Pokphand Foods PCL (Foreign) 100,400 83 * Delta Electronics Thailand PCL 51,800 83 * True Corp. PCL 380,700 83 * Jasmine International PCL 387,200 83 * Big C Supercenter PCL 15,300 81 * Glow Energy PCL 37,300 76 * Precious Shipping PCL 125,400 76 * Total Access Communication PCL (Local) 25,400 74 Bangkok Dusit Medical Services PCL 17,600 63 * Banpu PCL (Local) 76,000 61 * Minor International PCL 87,900 56 * Land and Houses PCL 187,400 49 * Siam City Cement PCL (Local) 4,536 49 * Bangkok Expressway PCL 46,800 45 Siam City Cement PCL (Foreign) 3,800 40 * Robinson Department Store PCL 28,100 38
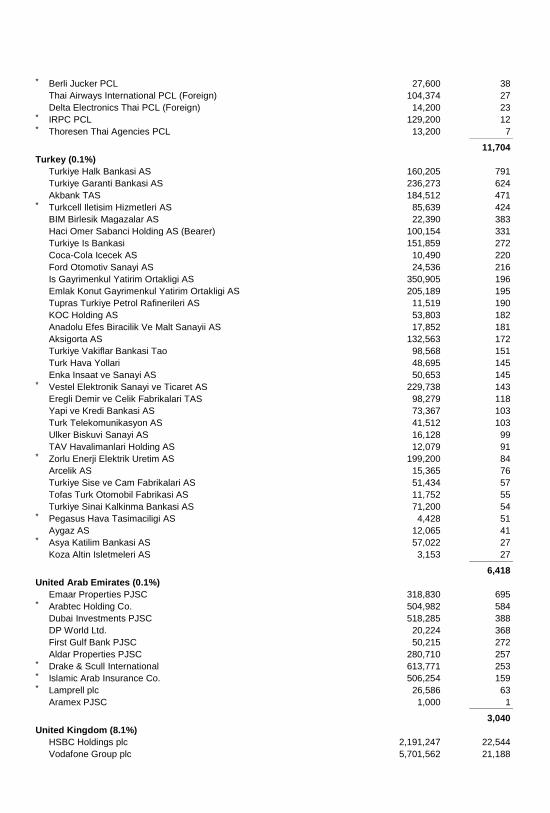
* Berli Jucker PCL 27,600 38 Thai Airways International PCL (Foreign) 104,374 27 Delta Electronics Thai PCL (Foreign) 14,200 23 * IRPC PCL 129,200 12 * Thoresen Thai Agencies PCL 13,200 7 _____________
11,704
Turkey (0.1%)
Turkiye Halk Bankasi AS 160,205 791 Turkiye Garanti Bankasi AS 236,273 624 Akbank TAS 184,512 471 * Turkcell Iletisim Hizmetleri AS 85,639 424 BIM Birlesik Magazalar AS 22,390 383 Haci Omer Sabanci Holding AS (Bearer) 100,154 331 Turkiye Is Bankasi 151,859 272 Coca-Cola Icecek AS 10,490 220 Ford Otomotiv Sanayi AS 24,536 216 Is Gayrimenkul Yatirim Ortakligi AS 350,905 196 Emlak Konut Gayrimenkul Yatirim Ortakligi AS 205,189 195 Tupras Turkiye Petrol Rafinerileri AS 11,519 190 KOC Holding AS 53,803 182 Anadolu Efes Biracilik Ve Malt Sanayii AS 17,852 181 Aksigorta AS 132,563 172 Turkiye Vakiflar Bankasi Tao 98,568 151 Turk Hava Yollari 48,695 145 Enka Insaat ve Sanayi AS 50,653 145 * Vestel Elektronik Sanayi ve Ticaret AS 229,738 143 Eregli Demir ve Celik Fabrikalari TAS 98,279 118 Yapi ve Kredi Bankasi AS 73,367 103 Turk Telekomunikasyon AS 41,512 103 Ulker Biskuvi Sanayi AS 16,128 99 TAV Havalimanlari Holding AS 12,079 91 * Zorlu Enerji Elektrik Uretim AS 199,200 84 Arcelik AS 15,365 76 Turkiye Sise ve Cam Fabrikalari AS 51,434 57 Tofas Turk Otomobil Fabrikasi AS 11,752 55 Turkiye Sinai Kalkinma Bankasi AS 71,200 54 * Pegasus Hava Tasimaciligi AS 4,428 51 Aygaz AS 12,065 41 * Asya Katilim Bankasi AS 57,022 27 Koza Altin Isletmeleri AS 3,153 27 _____________
6,418
United Arab Emirates (0.1%)
Emaar Properties PJSC 318,830 695 * Arabtec Holding Co. 504,982 584 Dubai Investments PJSC 518,285 388 DP World Ltd. 20,224 368 First Gulf Bank PJSC 50,215 272 Aldar Properties PJSC 280,710 257 * Drake & Scull International 613,771 253 * Islamic Arab Insurance Co. 506,254 159 * Lamprell plc 26,586 63 Aramex PJSC 1,000 1 _____________
3,040
United Kingdom (8.1%)
HSBC Holdings plc 2,191,247 22,544 Vodafone Group plc 5,701,562 21,188
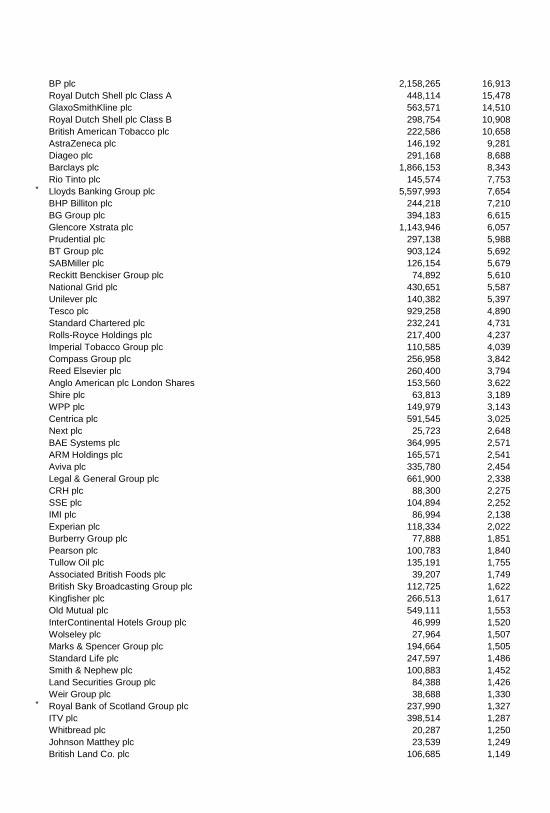
BP plc 2,158,265 16,913 Royal Dutch Shell plc Class A 448,114 15,478 GlaxoSmithKline plc 563,571 14,510 Royal Dutch Shell plc Class B 298,754 10,908 British American Tobacco plc 222,586 10,658 AstraZeneca plc 146,192 9,281 Diageo plc 291,168 8,688 Barclays plc 1,866,153 8,343 Rio Tinto plc 145,574 7,753 * Lloyds Banking Group plc 5,597,993 7,654 BHP Billiton plc 244,218 7,210 BG Group plc 394,183 6,615 Glencore Xstrata plc 1,143,946 6,057 Prudential plc 297,138 5,988 BT Group plc 903,124 5,692 SABMiller plc 126,154 5,679 Reckitt Benckiser Group plc 74,892 5,610 National Grid plc 430,651 5,587 Unilever plc 140,382 5,397 Tesco plc 929,258 4,890 Standard Chartered plc 232,241 4,731 Rolls-Royce Holdings plc 217,400 4,237 Imperial Tobacco Group plc 110,585 4,039 Compass Group plc 256,958 3,842 Reed Elsevier plc 260,400 3,794 Anglo American plc London Shares 153,560 3,622 Shire plc 63,813 3,189 WPP plc 149,979 3,143 Centrica plc 591,545 3,025 Next plc 25,723 2,648 BAE Systems plc 364,995 2,571 ARM Holdings plc 165,571 2,541 Aviva plc 335,780 2,454 Legal & General Group plc 661,900 2,338 CRH plc 88,300 2,275 SSE plc 104,894 2,252 IMI plc 86,994 2,138 Experian plc 118,334 2,022 Burberry Group plc 77,888 1,851 Pearson plc 100,783 1,840 Tullow Oil plc 135,191 1,755 Associated British Foods plc 39,207 1,749 British Sky Broadcasting Group plc 112,725 1,622 Kingfisher plc 266,513 1,617 Old Mutual plc 549,111 1,553 InterContinental Hotels Group plc 46,999 1,520 Wolseley plc 27,964 1,507 Marks & Spencer Group plc 194,664 1,505 Standard Life plc 247,597 1,486 Smith & Nephew plc 100,883 1,452 Land Securities Group plc 84,388 1,426 Weir Group plc 38,688 1,330 * Royal Bank of Scotland Group plc 237,990 1,327 ITV plc 398,514 1,287 Whitbread plc 20,287 1,250 Johnson Matthey plc 23,539 1,249 British Land Co. plc 106,685 1,149
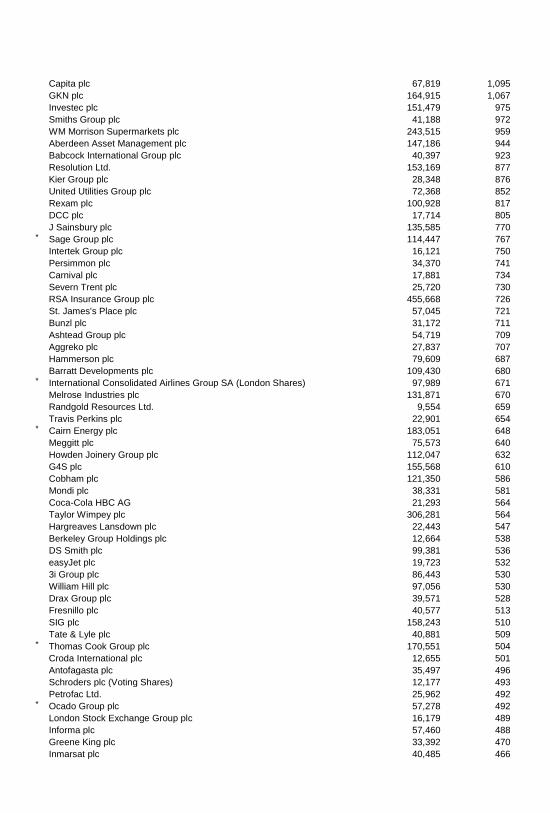
Capita plc 67,819 1,095 GKN plc 164,915 1,067 Investec plc 151,479 975 Smiths Group plc 41,188 972 WM Morrison Supermarkets plc 243,515 959 Aberdeen Asset Management plc 147,186 944 Babcock International Group plc 40,397 923 Resolution Ltd. 153,169 877 Kier Group plc 28,348 876 United Utilities Group plc 72,368 852 Rexam plc 100,928 817 DCC plc 17,714 805 J Sainsbury plc 135,585 770 * Sage Group plc 114,447 767 Intertek Group plc 16,121 750 Persimmon plc 34,370 741 Carnival plc 17,881 734 Severn Trent plc 25,720 730 RSA Insurance Group plc 455,668 726 St. James's Place plc 57,045 721 Bunzl plc 31,172 711 Ashtead Group plc 54,719 709 Aggreko plc 27,837 707 Hammerson plc 79,609 687 Barratt Developments plc 109,430 680 * International Consolidated Airlines Group SA (London Shares) 97,989 671 Melrose Industries plc 131,871 670 Randgold Resources Ltd. 9,554 659 Travis Perkins plc 22,901 654 * Cairn Energy plc 183,051 648 Meggitt plc 75,573 640 Howden Joinery Group plc 112,047 632 G4S plc 155,568 610 Cobham plc 121,350 586 Mondi plc 38,331 581 Coca-Cola HBC AG 21,293 564 Taylor Wimpey plc 306,281 564 Hargreaves Lansdown plc 22,443 547 Berkeley Group Holdings plc 12,664 538 DS Smith plc 99,381 536 easyJet plc 19,723 532 3i Group plc 86,443 530 William Hill plc 97,056 530 Drax Group plc 39,571 528 Fresnillo plc 40,577 513 SIG plc 158,243 510 Tate & Lyle plc 40,881 509 * Thomas Cook Group plc 170,551 504 Croda International plc 12,655 501 Antofagasta plc 35,497 496 Schroders plc (Voting Shares) 12,177 493 Petrofac Ltd. 25,962 492 * Ocado Group plc 57,278 492 London Stock Exchange Group plc 16,179 489 Informa plc 57,460 488 Greene King plc 33,392 470 Inmarsat plc 40,485 466
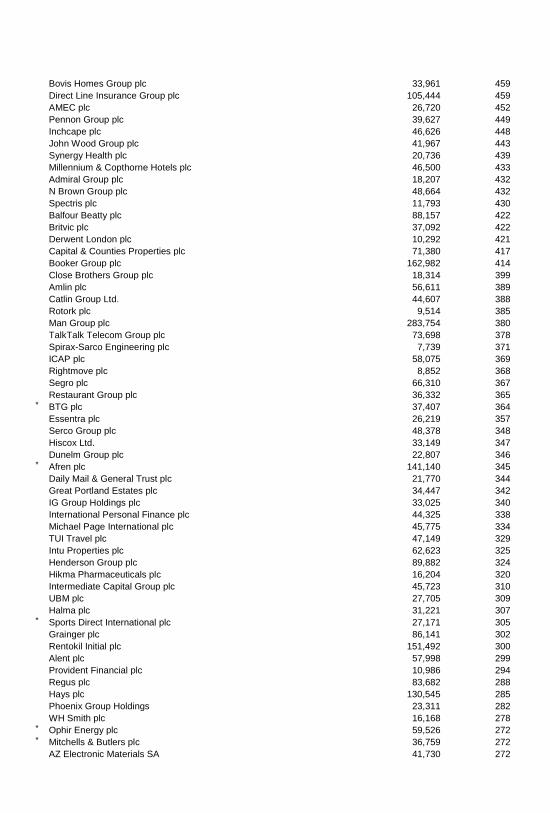
Bovis Homes Group plc 33,961 459 Direct Line Insurance Group plc 105,444 459 AMEC plc 26,720 452 Pennon Group plc 39,627 449 Inchcape plc 46,626 448 John Wood Group plc 41,967 443 Synergy Health plc 20,736 439 Millennium & Copthorne Hotels plc 46,500 433 Admiral Group plc 18,207 432 N Brown Group plc 48,664 432 Spectris plc 11,793 430 Balfour Beatty plc 88,157 422 Britvic plc 37,092 422 Derwent London plc 10,292 421 Capital & Counties Properties plc 71,380 417 Booker Group plc 162,982 414 Close Brothers Group plc 18,314 399 Amlin plc 56,611 389 Catlin Group Ltd. 44,607 388 Rotork plc 9,514 385 Man Group plc 283,754 380 TalkTalk Telecom Group plc 73,698 378 Spirax-Sarco Engineering plc 7,739 371 ICAP plc 58,075 369 Rightmove plc 8,852 368 Segro plc 66,310 367 Restaurant Group plc 36,332 365 * BTG plc 37,407 364 Essentra plc 26,219 357 Serco Group plc 48,378 348 Hiscox Ltd. 33,149 347 Dunelm Group plc 22,807 346 * Afren plc 141,140 345 Daily Mail & General Trust plc 21,770 344 Great Portland Estates plc 34,447 342 IG Group Holdings plc 33,025 340 International Personal Finance plc 44,325 338 Michael Page International plc 45,775 334 TUI Travel plc 47,149 329 Intu Properties plc 62,623 325 Henderson Group plc 89,882 324 Hikma Pharmaceuticals plc 16,204 320 Intermediate Capital Group plc 45,723 310 UBM plc 27,705 309 Halma plc 31,221 307 * Sports Direct International plc 27,171 305 Grainger plc 86,141 302 Rentokil Initial plc 151,492 300 Alent plc 57,998 299 Provident Financial plc 10,986 294 Regus plc 83,682 288 Hays plc 130,545 285 Phoenix Group Holdings 23,311 282 WH Smith plc 16,168 278 * Ophir Energy plc 59,526 272 * Mitchells & Butlers plc 36,759 272 AZ Electronic Materials SA 41,730 272
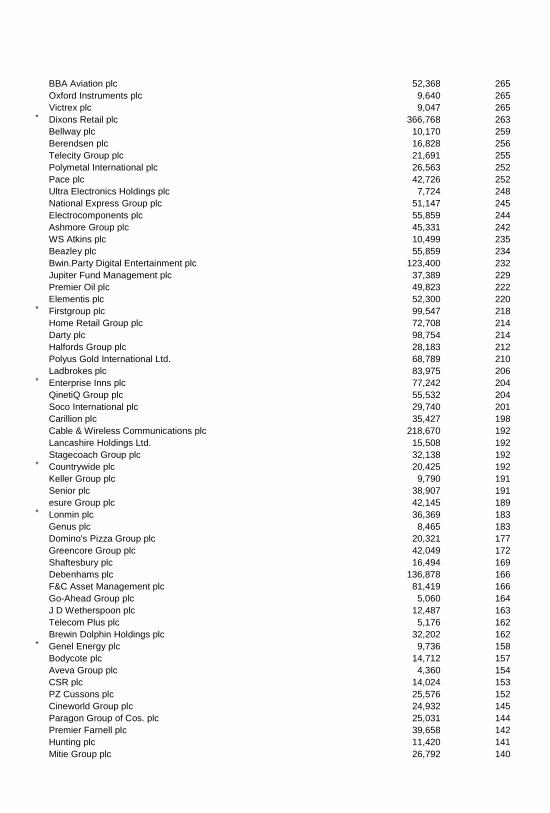
BBA Aviation plc 52,368 265 Oxford Instruments plc 9,640 265 Victrex plc 9,047 265 * Dixons Retail plc 366,768 263 Bellway plc 10,170 259 Berendsen plc 16,828 256 Telecity Group plc 21,691 255 Polymetal International plc 26,563 252 Pace plc 42,726 252 Ultra Electronics Holdings plc 7,724 248 National Express Group plc 51,147 245 Electrocomponents plc 55,859 244 Ashmore Group plc 45,331 242 WS Atkins plc 10,499 235 Beazley plc 55,859 234 Bwin.Party Digital Entertainment plc 123,400 232 Jupiter Fund Management plc 37,389 229 Premier Oil plc 49,823 222 Elementis plc 52,300 220 * Firstgroup plc 99,547 218 Home Retail Group plc 72,708 214 Darty plc 98,754 214 Halfords Group plc 28,183 212 Polyus Gold International Ltd. 68,789 210 Ladbrokes plc 83,975 206 * Enterprise Inns plc 77,242 204 QinetiQ Group plc 55,532 204 Soco International plc 29,740 201 Carillion plc 35,427 198 Cable & Wireless Communications plc 218,670 192 Lancashire Holdings Ltd. 15,508 192 Stagecoach Group plc 32,138 192 * Countrywide plc 20,425 192 Keller Group plc 9,790 191 Senior plc 38,907 191 esure Group plc 42,145 189 * Lonmin plc 36,369 183 Genus plc 8,465 183 Domino's Pizza Group plc 20,321 177 Greencore Group plc 42,049 172 Shaftesbury plc 16,494 169 Debenhams plc 136,878 166 F&C Asset Management plc 81,419 166 Go-Ahead Group plc 5,060 164 J D Wetherspoon plc 12,487 163 Telecom Plus plc 5,176 162 Brewin Dolphin Holdings plc 32,202 162 * Genel Energy plc 9,736 158 Bodycote plc 14,712 157 Aveva Group plc 4,360 154 CSR plc 14,024 153 PZ Cussons plc 25,576 152 Cineworld Group plc 24,932 145 Paragon Group of Cos. plc 25,031 144 Premier Farnell plc 39,658 142 Hunting plc 11,420 141 Mitie Group plc 26,792 140
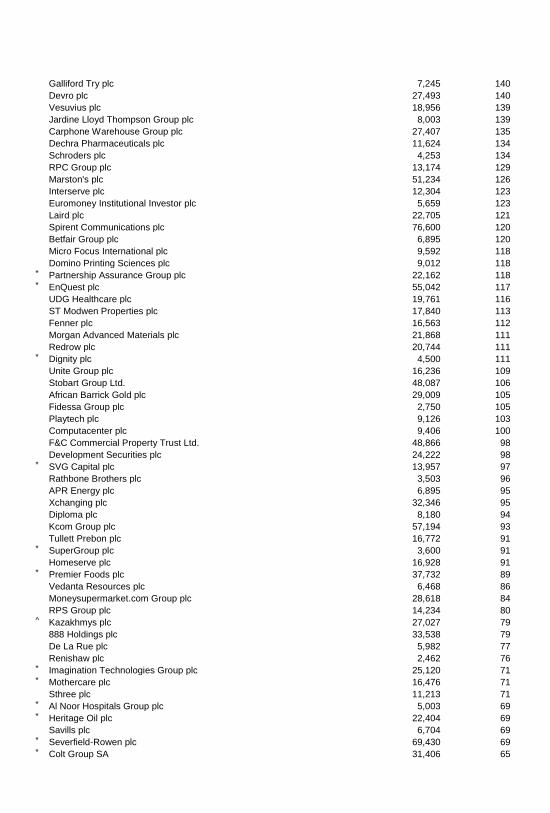
Galliford Try plc 7,245 140 Devro plc 27,493 140 Vesuvius plc 18,956 139 Jardine Lloyd Thompson Group plc 8,003 139 Carphone Warehouse Group plc 27,407 135 Dechra Pharmaceuticals plc 11,624 134 Schroders plc 4,253 134 RPC Group plc 13,174 129 Marston's plc 51,234 126 Interserve plc 12,304 123 Euromoney Institutional Investor plc 5,659 123 Laird plc 22,705 121 Spirent Communications plc 76,600 120 Betfair Group plc 6,895 120 Micro Focus International plc 9,592 118 Domino Printing Sciences plc 9,012 118 * Partnership Assurance Group plc 22,162 118 * EnQuest plc 55,042 117 UDG Healthcare plc 19,761 116 ST Modwen Properties plc 17,840 113 Fenner plc 16,563 112 Morgan Advanced Materials plc 21,868 111 Redrow plc 20,744 111 * Dignity plc 4,500 111 Unite Group plc 16,236 109 Stobart Group Ltd. 48,087 106 African Barrick Gold plc 29,009 105 Fidessa Group plc 2,750 105 Playtech plc 9,126 103 Computacenter plc 9,406 100 F&C Commercial Property Trust Ltd. 48,866 98 Development Securities plc 24,222 98 * SVG Capital plc 13,957 97 Rathbone Brothers plc 3,503 96 APR Energy plc 6,895 95 Xchanging plc 32,346 95 Diploma plc 8,180 94 Kcom Group plc 57,194 93 Tullett Prebon plc 16,772 91 * SuperGroup plc 3,600 91 Homeserve plc 16,928 91 * Premier Foods plc 37,732 89 Vedanta Resources plc 6,468 86 Moneysupermarket.com Group plc 28,618 84 RPS Group plc 14,234 80 ^ Kazakhmys plc 27,027 79 888 Holdings plc 33,538 79 De La Rue plc 5,982 77 Renishaw plc 2,462 76 * Imagination Technologies Group plc 25,120 71 * Mothercare plc 16,476 71 Sthree plc 11,213 71 * Al Noor Hospitals Group plc 5,003 69 * Heritage Oil plc 22,404 69 Savills plc 6,704 69 * Severfield-Rowen plc 69,430 69 * Colt Group SA 31,406 65
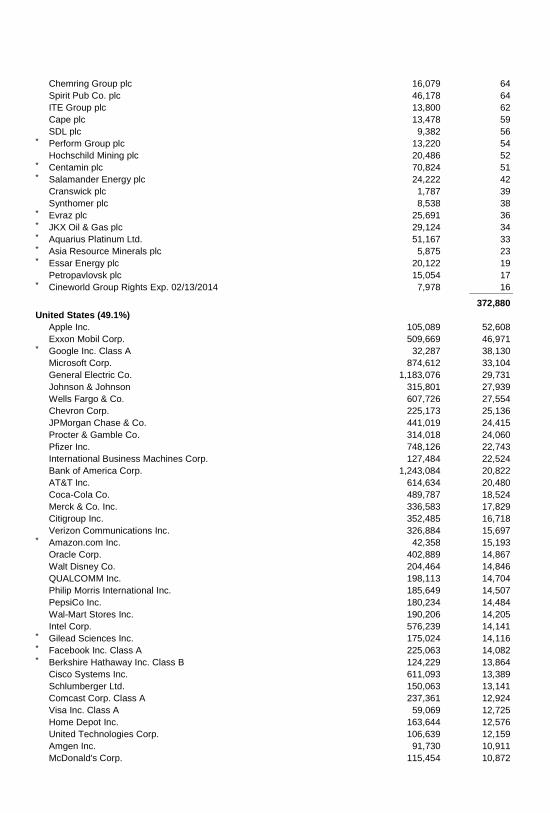
Chemring Group plc 16,079 64 Spirit Pub Co. plc 46,178 64 ITE Group plc 13,800 62 Cape plc 13,478 59 SDL plc 9,382 56 * Perform Group plc 13,220 54 Hochschild Mining plc 20,486 52 * Centamin plc 70,824 51 * Salamander Energy plc 24,222 42 Cranswick plc 1,787 39 Synthomer plc 8,538 38 * Evraz plc 25,691 36 * JKX Oil & Gas plc 29,124 34 * Aquarius Platinum Ltd. 51,167 33 * Asia Resource Minerals plc 5,875 23 * Essar Energy plc 20,122 19 Petropavlovsk plc 15,054 17 * Cineworld Group Rights Exp. 02/13/2014 7,978 16 _____________
372,880
United States (49.1%)
Apple Inc. 105,089 52,608 Exxon Mobil Corp. 509,669 46,971 * Google Inc. Class A 32,287 38,130 Microsoft Corp. 874,612 33,104 General Electric Co. 1,183,076 29,731 Johnson & Johnson 315,801 27,939 Wells Fargo & Co. 607,726 27,554 Chevron Corp. 225,173 25,136 JPMorgan Chase & Co. 441,019 24,415 Procter & Gamble Co. 314,018 24,060 Pfizer Inc. 748,126 22,743 International Business Machines Corp. 127,484 22,524 Bank of America Corp. 1,243,084 20,822 AT&T Inc. 614,634 20,480 Coca-Cola Co. 489,787 18,524 Merck & Co. Inc. 336,583 17,829 Citigroup Inc. 352,485 16,718 Verizon Communications Inc. 326,884 15,697 * Amazon.com Inc. 42,358 15,193 Oracle Corp. 402,889 14,867 Walt Disney Co. 204,464 14,846 QUALCOMM Inc. 198,113 14,704 Philip Morris International Inc. 185,649 14,507 PepsiCo Inc. 180,234 14,484 Wal-Mart Stores Inc. 190,206 14,205 Intel Corp. 576,239 14,141 * Gilead Sciences Inc. 175,024 14,116 * Facebook Inc. Class A 225,063 14,082 * Berkshire Hathaway Inc. Class B 124,229 13,864 Cisco Systems Inc. 611,093 13,389 Schlumberger Ltd. 150,063 13,141 Comcast Corp. Class A 237,361 12,924 Visa Inc. Class A 59,069 12,725 Home Depot Inc. 163,644 12,576 United Technologies Corp. 106,639 12,159 Amgen Inc. 91,730 10,911 McDonald's Corp. 115,454 10,872
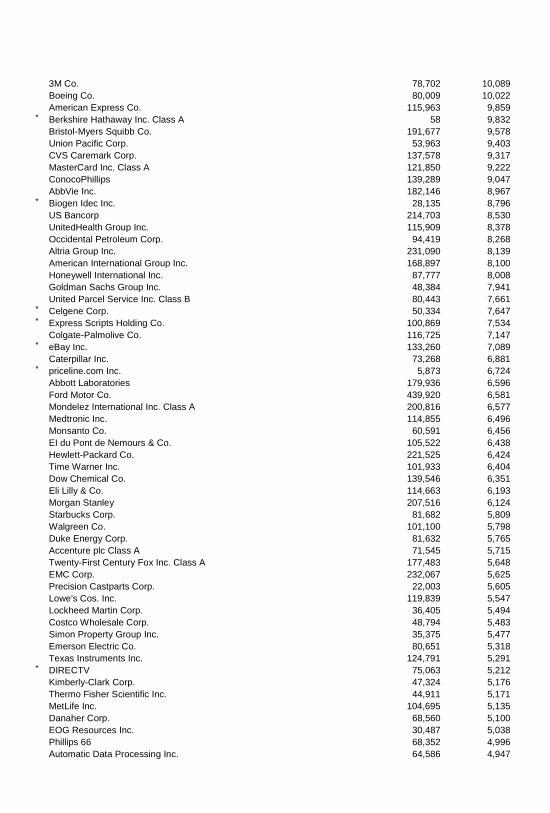
3M Co. 78,702 10,089 Boeing Co. 80,009 10,022 American Express Co. 115,963 9,859 * Berkshire Hathaway Inc. Class A 58 9,832 Bristol-Myers Squibb Co. 191,677 9,578 Union Pacific Corp. 53,963 9,403 CVS Caremark Corp. 137,578 9,317 MasterCard Inc. Class A 121,850 9,222 ConocoPhillips 139,289 9,047 AbbVie Inc. 182,146 8,967 * Biogen Idec Inc. 28,135 8,796 US Bancorp 214,703 8,530 UnitedHealth Group Inc. 115,909 8,378 Occidental Petroleum Corp. 94,419 8,268 Altria Group Inc. 231,090 8,139 American International Group Inc. 168,897 8,100 Honeywell International Inc. 87,777 8,008 Goldman Sachs Group Inc. 48,384 7,941 United Parcel Service Inc. Class B 80,443 7,661 * Celgene Corp. 50,334 7,647 * Express Scripts Holding Co. 100,869 7,534 Colgate-Palmolive Co. 116,725 7,147 * eBay Inc. 133,260 7,089 Caterpillar Inc. 73,268 6,881 * priceline.com Inc. 5,873 6,724 Abbott Laboratories 179,936 6,596 Ford Motor Co. 439,920 6,581 Mondelez International Inc. Class A 200,816 6,577 Medtronic Inc. 114,855 6,496 Monsanto Co. 60,591 6,456 EI du Pont de Nemours & Co. 105,522 6,438 Hewlett-Packard Co. 221,525 6,424 Time Warner Inc. 101,933 6,404 Dow Chemical Co. 139,546 6,351 Eli Lilly & Co. 114,663 6,193 Morgan Stanley 207,516 6,124 Starbucks Corp. 81,682 5,809 Walgreen Co. 101,100 5,798 Duke Energy Corp. 81,632 5,765 Accenture plc Class A 71,545 5,715 Twenty-First Century Fox Inc. Class A 177,483 5,648 EMC Corp. 232,067 5,625 Precision Castparts Corp. 22,003 5,605 Lowe's Cos. Inc. 119,839 5,547 Lockheed Martin Corp. 36,405 5,494 Costco Wholesale Corp. 48,794 5,483 Simon Property Group Inc. 35,375 5,477 Emerson Electric Co. 80,651 5,318 Texas Instruments Inc. 124,791 5,291 * DIRECTV 75,063 5,212 Kimberly-Clark Corp. 47,324 5,176 Thermo Fisher Scientific Inc. 44,911 5,171 MetLife Inc. 104,695 5,135 Danaher Corp. 68,560 5,100 EOG Resources Inc. 30,487 5,038 Phillips 66 68,352 4,996 Automatic Data Processing Inc. 64,586 4,947
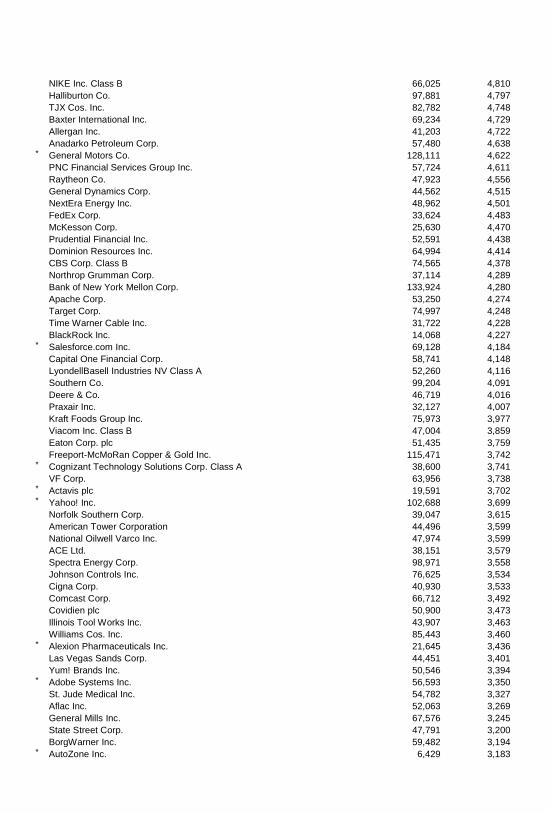
NIKE Inc. Class B 66,025 4,810 Halliburton Co. 97,881 4,797 TJX Cos. Inc. 82,782 4,748 Baxter International Inc. 69,234 4,729 Allergan Inc. 41,203 4,722 Anadarko Petroleum Corp. 57,480 4,638 * General Motors Co. 128,111 4,622 PNC Financial Services Group Inc. 57,724 4,611 Raytheon Co. 47,923 4,556 General Dynamics Corp. 44,562 4,515 NextEra Energy Inc. 48,962 4,501 FedEx Corp. 33,624 4,483 McKesson Corp. 25,630 4,470 Prudential Financial Inc. 52,591 4,438 Dominion Resources Inc. 64,994 4,414 CBS Corp. Class B 74,565 4,378 Northrop Grumman Corp. 37,114 4,289 Bank of New York Mellon Corp. 133,924 4,280 Apache Corp. 53,250 4,274 Target Corp. 74,997 4,248 Time Warner Cable Inc. 31,722 4,228 BlackRock Inc. 14,068 4,227 * Salesforce.com Inc. 69,128 4,184 Capital One Financial Corp. 58,741 4,148 LyondellBasell Industries NV Class A 52,260 4,116 Southern Co. 99,204 4,091 Deere & Co. 46,719 4,016 Praxair Inc. 32,127 4,007 Kraft Foods Group Inc. 75,973 3,977 Viacom Inc. Class B 47,004 3,859 Eaton Corp. plc 51,435 3,759 Freeport-McMoRan Copper & Gold Inc. 115,471 3,742 * Cognizant Technology Solutions Corp. Class A 38,600 3,741 VF Corp. 63,956 3,738 * Actavis plc 19,591 3,702 * Yahoo! Inc. 102,688 3,699 Norfolk Southern Corp. 39,047 3,615 American Tower Corporation 44,496 3,599 National Oilwell Varco Inc. 47,974 3,599 ACE Ltd. 38,151 3,579 Spectra Energy Corp. 98,971 3,558 Johnson Controls Inc. 76,625 3,534 Cigna Corp. 40,930 3,533 Comcast Corp. 66,712 3,492 Covidien plc 50,900 3,473 Illinois Tool Works Inc. 43,907 3,463 Williams Cos. Inc. 85,443 3,460 * Alexion Pharmaceuticals Inc. 21,645 3,436 Las Vegas Sands Corp. 44,451 3,401 Yum! Brands Inc. 50,546 3,394 * Adobe Systems Inc. 56,593 3,350 St. Jude Medical Inc. 54,782 3,327 Aflac Inc. 52,063 3,269 General Mills Inc. 67,576 3,245 State Street Corp. 47,791 3,200 BorgWarner Inc. 59,482 3,194 * AutoZone Inc. 6,429 3,183
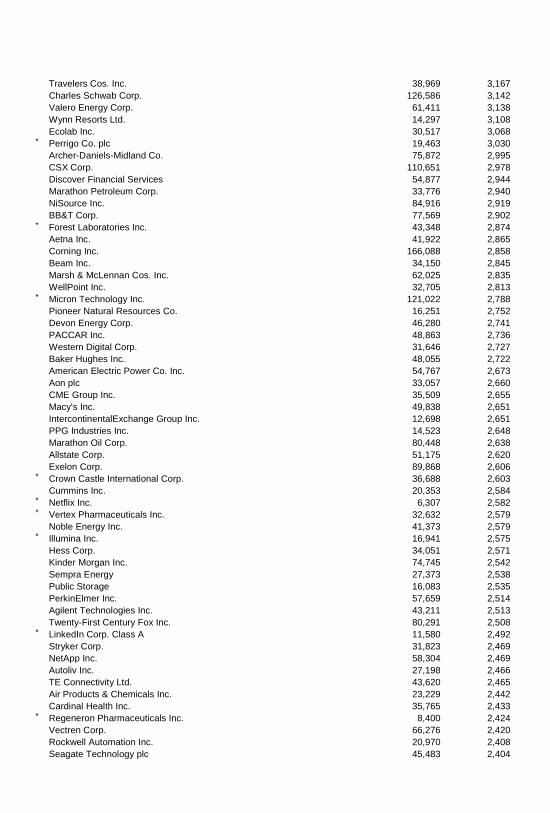
Travelers Cos. Inc. 38,969 3,167 Charles Schwab Corp. 126,586 3,142 Valero Energy Corp. 61,411 3,138 Wynn Resorts Ltd. 14,297 3,108 Ecolab Inc. 30,517 3,068 * Perrigo Co. plc 19,463 3,030 Archer-Daniels-Midland Co. 75,872 2,995 CSX Corp. 110,651 2,978 Discover Financial Services 54,877 2,944 Marathon Petroleum Corp. 33,776 2,940 NiSource Inc. 84,916 2,919 BB&T Corp. 77,569 2,902 * Forest Laboratories Inc. 43,348 2,874 Aetna Inc. 41,922 2,865 Corning Inc. 166,088 2,858 Beam Inc. 34,150 2,845 Marsh & McLennan Cos. Inc. 62,025 2,835 WellPoint Inc. 32,705 2,813 * Micron Technology Inc. 121,022 2,788 Pioneer Natural Resources Co. 16,251 2,752 Devon Energy Corp. 46,280 2,741 PACCAR Inc. 48,863 2,736 Western Digital Corp. 31,646 2,727 Baker Hughes Inc. 48,055 2,722 American Electric Power Co. Inc. 54,767 2,673 Aon plc 33,057 2,660 CME Group Inc. 35,509 2,655 Macy's Inc. 49,838 2,651 IntercontinentalExchange Group Inc. 12,698 2,651 PPG Industries Inc. 14,523 2,648 Marathon Oil Corp. 80,448 2,638 Allstate Corp. 51,175 2,620 Exelon Corp. 89,868 2,606 * Crown Castle International Corp. 36,688 2,603 Cummins Inc. 20,353 2,584 * Netflix Inc. 6,307 2,582 * Vertex Pharmaceuticals Inc. 32,632 2,579 Noble Energy Inc. 41,373 2,579 * Illumina Inc. 16,941 2,575 Hess Corp. 34,051 2,571 Kinder Morgan Inc. 74,745 2,542 Sempra Energy 27,373 2,538 Public Storage 16,083 2,535 PerkinElmer Inc. 57,659 2,514 Agilent Technologies Inc. 43,211 2,513 Twenty-First Century Fox Inc. 80,291 2,508 * LinkedIn Corp. Class A 11,580 2,492 Stryker Corp. 31,823 2,469 NetApp Inc. 58,304 2,469 Autoliv Inc. 27,198 2,466 TE Connectivity Ltd. 43,620 2,465 Air Products & Chemicals Inc. 23,229 2,442 Cardinal Health Inc. 35,765 2,433 * Regeneron Pharmaceuticals Inc. 8,400 2,424 Vectren Corp. 66,276 2,420 Rockwell Automation Inc. 20,970 2,408 Seagate Technology plc 45,483 2,404
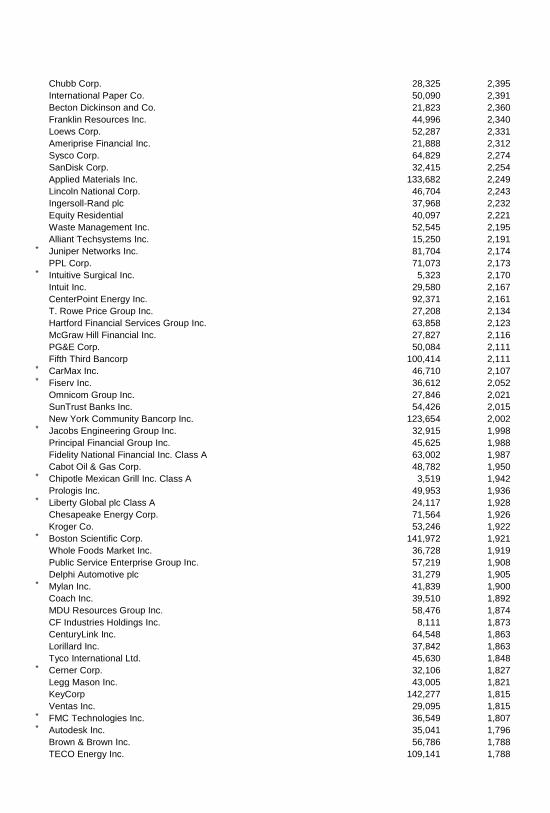
Chubb Corp. 28,325 2,395 International Paper Co. 50,090 2,391 Becton Dickinson and Co. 21,823 2,360 Franklin Resources Inc. 44,996 2,340 Loews Corp. 52,287 2,331 Ameriprise Financial Inc. 21,888 2,312 Sysco Corp. 64,829 2,274 SanDisk Corp. 32,415 2,254 Applied Materials Inc. 133,682 2,249 Lincoln National Corp. 46,704 2,243 Ingersoll-Rand plc 37,968 2,232 Equity Residential 40,097 2,221 Waste Management Inc. 52,545 2,195 Alliant Techsystems Inc. 15,250 2,191 * Juniper Networks Inc. 81,704 2,174 PPL Corp. 71,073 2,173 * Intuitive Surgical Inc. 5,323 2,170 Intuit Inc. 29,580 2,167 CenterPoint Energy Inc. 92,371 2,161 T. Rowe Price Group Inc. 27,208 2,134 Hartford Financial Services Group Inc. 63,858 2,123 McGraw Hill Financial Inc. 27,827 2,116 PG&E Corp. 50,084 2,111 Fifth Third Bancorp 100,414 2,111 * CarMax Inc. 46,710 2,107 * Fiserv Inc. 36,612 2,052 Omnicom Group Inc. 27,846 2,021 SunTrust Banks Inc. 54,426 2,015 New York Community Bancorp Inc. 123,654 2,002 * Jacobs Engineering Group Inc. 32,915 1,998 Principal Financial Group Inc. 45,625 1,988 Fidelity National Financial Inc. Class A 63,002 1,987 Cabot Oil & Gas Corp. 48,782 1,950 * Chipotle Mexican Grill Inc. Class A 3,519 1,942 Prologis Inc. 49,953 1,936 * Liberty Global plc Class A 24,117 1,928 Chesapeake Energy Corp. 71,564 1,926 Kroger Co. 53,246 1,922 * Boston Scientific Corp. 141,972 1,921 Whole Foods Market Inc. 36,728 1,919 Public Service Enterprise Group Inc. 57,219 1,908 Delphi Automotive plc 31,279 1,905 * Mylan Inc. 41,839 1,900 Coach Inc. 39,510 1,892 MDU Resources Group Inc. 58,476 1,874 CF Industries Holdings Inc. 8,111 1,873 CenturyLink Inc. 64,548 1,863 Lorillard Inc. 37,842 1,863 Tyco International Ltd. 45,630 1,848 * Cerner Corp. 32,106 1,827 Legg Mason Inc. 43,005 1,821 KeyCorp 142,277 1,815 Ventas Inc. 29,095 1,815 * FMC Technologies Inc. 36,549 1,807 * Autodesk Inc. 35,041 1,796 Brown & Brown Inc. 56,786 1,788 TECO Energy Inc. 109,141 1,788
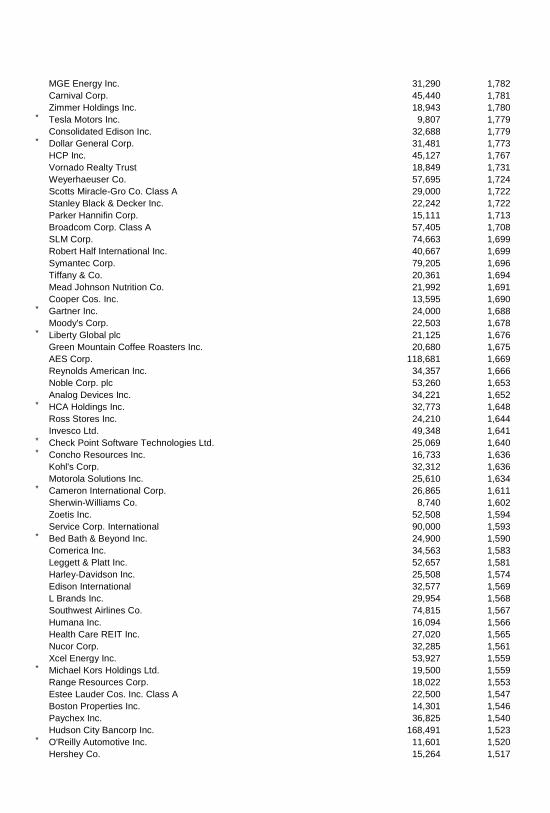
MGE Energy Inc. 31,290 1,782 Carnival Corp. 45,440 1,781 Zimmer Holdings Inc. 18,943 1,780 * Tesla Motors Inc. 9,807 1,779 Consolidated Edison Inc. 32,688 1,779 * Dollar General Corp. 31,481 1,773 HCP Inc. 45,127 1,767 Vornado Realty Trust 18,849 1,731 Weyerhaeuser Co. 57,695 1,724 Scotts Miracle-Gro Co. Class A 29,000 1,722 Stanley Black & Decker Inc. 22,242 1,722 Parker Hannifin Corp. 15,111 1,713 Broadcom Corp. Class A 57,405 1,708 SLM Corp. 74,663 1,699 Robert Half International Inc. 40,667 1,699 Symantec Corp. 79,205 1,696 Tiffany & Co. 20,361 1,694 Mead Johnson Nutrition Co. 21,992 1,691 Cooper Cos. Inc. 13,595 1,690 * Gartner Inc. 24,000 1,688 Moody's Corp. 22,503 1,678 * Liberty Global plc 21,125 1,676 Green Mountain Coffee Roasters Inc. 20,680 1,675 AES Corp. 118,681 1,669 Reynolds American Inc. 34,357 1,666 Noble Corp. plc 53,260 1,653 Analog Devices Inc. 34,221 1,652 * HCA Holdings Inc. 32,773 1,648 Ross Stores Inc. 24,210 1,644 Invesco Ltd. 49,348 1,641 * Check Point Software Technologies Ltd. 25,069 1,640 * Concho Resources Inc. 16,733 1,636 Kohl's Corp. 32,312 1,636 Motorola Solutions Inc. 25,610 1,634 * Cameron International Corp. 26,865 1,611 Sherwin-Williams Co. 8,740 1,602 Zoetis Inc. 52,508 1,594 Service Corp. International 90,000 1,593 * Bed Bath & Beyond Inc. 24,900 1,590 Comerica Inc. 34,563 1,583 Leggett & Platt Inc. 52,657 1,581 Harley-Davidson Inc. 25,508 1,574 Edison International 32,577 1,569 L Brands Inc. 29,954 1,568 Southwest Airlines Co. 74,815 1,567 Humana Inc. 16,094 1,566 Health Care REIT Inc. 27,020 1,565 Nucor Corp. 32,285 1,561 Xcel Energy Inc. 53,927 1,559 * Michael Kors Holdings Ltd. 19,500 1,559 Range Resources Corp. 18,022 1,553 Estee Lauder Cos. Inc. Class A 22,500 1,547 Boston Properties Inc. 14,301 1,546 Paychex Inc. 36,825 1,540 Hudson City Bancorp Inc. 168,491 1,523 * O'Reilly Automotive Inc. 11,601 1,520 Hershey Co. 15,264 1,517
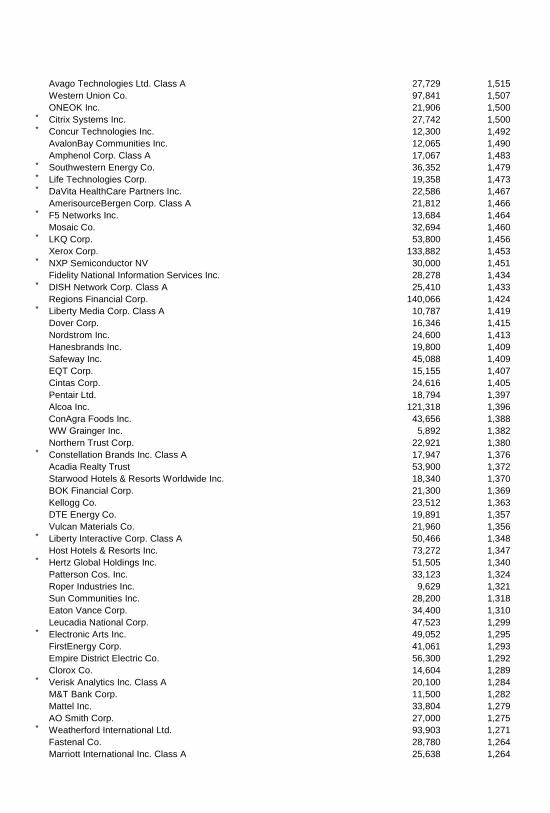
Avago Technologies Ltd. Class A 27,729 1,515 Western Union Co. 97,841 1,507 ONEOK Inc. 21,906 1,500 * Citrix Systems Inc. 27,742 1,500 * Concur Technologies Inc. 12,300 1,492 AvalonBay Communities Inc. 12,065 1,490 Amphenol Corp. Class A 17,067 1,483 * Southwestern Energy Co. 36,352 1,479 * Life Technologies Corp. 19,358 1,473 * DaVita HealthCare Partners Inc. 22,586 1,467 AmerisourceBergen Corp. Class A 21,812 1,466 * F5 Networks Inc. 13,684 1,464 Mosaic Co. 32,694 1,460 * LKQ Corp. 53,800 1,456 Xerox Corp. 133,882 1,453 * NXP Semiconductor NV 30,000 1,451 Fidelity National Information Services Inc. 28,278 1,434 * DISH Network Corp. Class A 25,410 1,433 Regions Financial Corp. 140,066 1,424 * Liberty Media Corp. Class A 10,787 1,419 Dover Corp. 16,346 1,415 Nordstrom Inc. 24,600 1,413 Hanesbrands Inc. 19,800 1,409 Safeway Inc. 45,088 1,409 EQT Corp. 15,155 1,407 Cintas Corp. 24,616 1,405 Pentair Ltd. 18,794 1,397 Alcoa Inc. 121,318 1,396 ConAgra Foods Inc. 43,656 1,388 WW Grainger Inc. 5,892 1,382 Northern Trust Corp. 22,921 1,380 * Constellation Brands Inc. Class A 17,947 1,376 Acadia Realty Trust 53,900 1,372 Starwood Hotels & Resorts Worldwide Inc. 18,340 1,370 BOK Financial Corp. 21,300 1,369 Kellogg Co. 23,512 1,363 DTE Energy Co. 19,891 1,357 Vulcan Materials Co. 21,960 1,356 * Liberty Interactive Corp. Class A 50,466 1,348 Host Hotels & Resorts Inc. 73,272 1,347 * Hertz Global Holdings Inc. 51,505 1,340 Patterson Cos. Inc. 33,123 1,324 Roper Industries Inc. 9,629 1,321 Sun Communities Inc. 28,200 1,318 Eaton Vance Corp. 34,400 1,310 Leucadia National Corp. 47,523 1,299 * Electronic Arts Inc. 49,052 1,295 FirstEnergy Corp. 41,061 1,293 Empire District Electric Co. 56,300 1,292 Clorox Co. 14,604 1,289 * Verisk Analytics Inc. Class A 20,100 1,284 M&T Bank Corp. 11,500 1,282 Mattel Inc. 33,804 1,279 AO Smith Corp. 27,000 1,275 * Weatherford International Ltd. 93,903 1,271 Fastenal Co. 28,780 1,264 Marriott International Inc. Class A 25,638 1,264
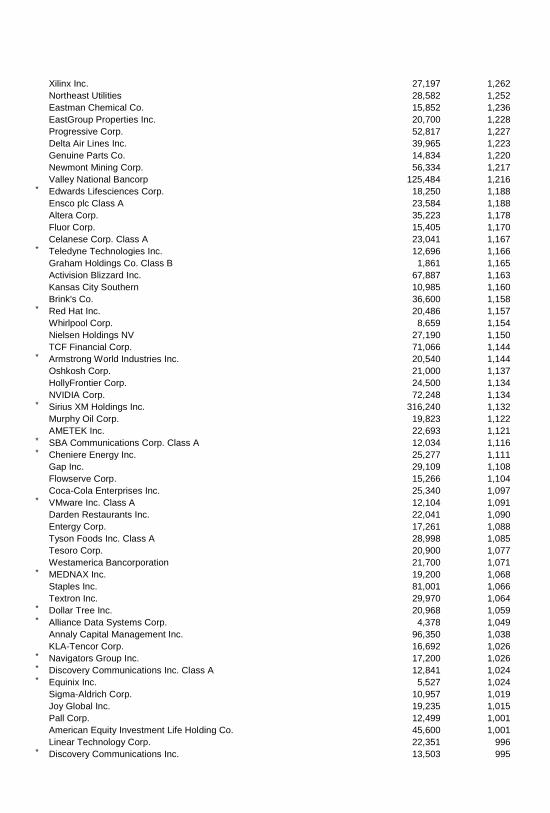
Xilinx Inc. 27,197 1,262 Northeast Utilities 28,582 1,252 Eastman Chemical Co. 15,852 1,236 EastGroup Properties Inc. 20,700 1,228 Progressive Corp. 52,817 1,227 Delta Air Lines Inc. 39,965 1,223 Genuine Parts Co. 14,834 1,220 Newmont Mining Corp. 56,334 1,217 Valley National Bancorp 125,484 1,216 * Edwards Lifesciences Corp. 18,250 1,188 Ensco plc Class A 23,584 1,188 Altera Corp. 35,223 1,178 Fluor Corp. 15,405 1,170 Celanese Corp. Class A 23,041 1,167 * Teledyne Technologies Inc. 12,696 1,166 Graham Holdings Co. Class B 1,861 1,165 Activision Blizzard Inc. 67,887 1,163 Kansas City Southern 10,985 1,160 Brink's Co. 36,600 1,158 * Red Hat Inc. 20,486 1,157 Whirlpool Corp. 8,659 1,154 Nielsen Holdings NV 27,190 1,150 TCF Financial Corp. 71,066 1,144 * Armstrong World Industries Inc. 20,540 1,144 Oshkosh Corp. 21,000 1,137 HollyFrontier Corp. 24,500 1,134 NVIDIA Corp. 72,248 1,134 * Sirius XM Holdings Inc. 316,240 1,132 Murphy Oil Corp. 19,823 1,122 AMETEK Inc. 22,693 1,121 * SBA Communications Corp. Class A 12,034 1,116 * Cheniere Energy Inc. 25,277 1,111 Gap Inc. 29,109 1,108 Flowserve Corp. 15,266 1,104 Coca-Cola Enterprises Inc. 25,340 1,097 * VMware Inc. Class A 12,104 1,091 Darden Restaurants Inc. 22,041 1,090 Entergy Corp. 17,261 1,088 Tyson Foods Inc. Class A 28,998 1,085 Tesoro Corp. 20,900 1,077 Westamerica Bancorporation 21,700 1,071 * MEDNAX Inc. 19,200 1,068 Staples Inc. 81,001 1,066 Textron Inc. 29,970 1,064 * Dollar Tree Inc. 20,968 1,059 * Alliance Data Systems Corp. 4,378 1,049 Annaly Capital Management Inc. 96,350 1,038 KLA-Tencor Corp. 16,692 1,026 * Navigators Group Inc. 17,200 1,026 * Discovery Communications Inc. Class A 12,841 1,024 * Equinix Inc. 5,527 1,024 Sigma-Aldrich Corp. 10,957 1,019 Joy Global Inc. 19,235 1,015 Pall Corp. 12,499 1,001 American Equity Investment Life Holding Co. 45,600 1,001 Linear Technology Corp. 22,351 996 * Discovery Communications Inc. 13,503 995
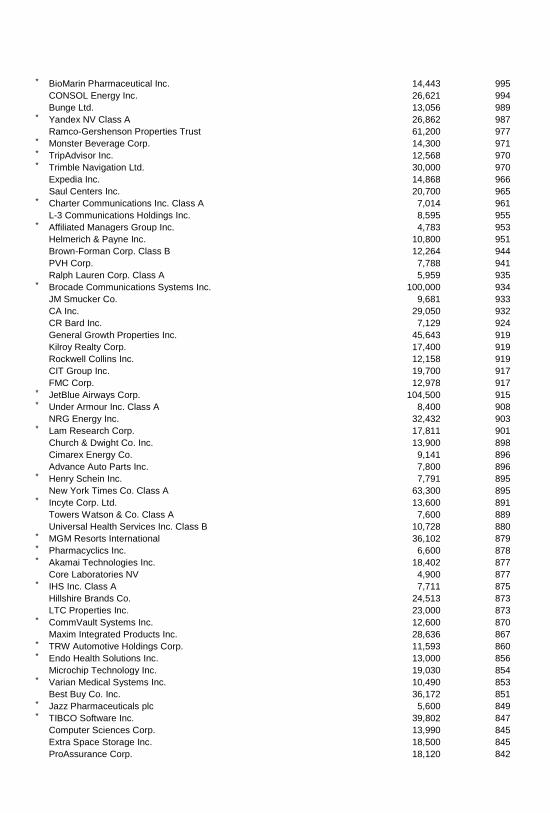
* BioMarin Pharmaceutical Inc. 14,443 995 CONSOL Energy Inc. 26,621 994 Bunge Ltd. 13,056 989 * Yandex NV Class A 26,862 987 Ramco-Gershenson Properties Trust 61,200 977 * Monster Beverage Corp. 14,300 971 * TripAdvisor Inc. 12,568 970 * Trimble Navigation Ltd. 30,000 970 Expedia Inc. 14,868 966 Saul Centers Inc. 20,700 965 * Charter Communications Inc. Class A 7,014 961 L-3 Communications Holdings Inc. 8,595 955 * Affiliated Managers Group Inc. 4,783 953 Helmerich & Payne Inc. 10,800 951 Brown-Forman Corp. Class B 12,264 944 PVH Corp. 7,788 941 Ralph Lauren Corp. Class A 5,959 935 * Brocade Communications Systems Inc. 100,000 934 JM Smucker Co. 9,681 933 CA Inc. 29,050 932 CR Bard Inc. 7,129 924 General Growth Properties Inc. 45,643 919 Kilroy Realty Corp. 17,400 919 Rockwell Collins Inc. 12,158 919 CIT Group Inc. 19,700 917 FMC Corp. 12,978 917 * JetBlue Airways Corp. 104,500 915 * Under Armour Inc. Class A 8,400 908 NRG Energy Inc. 32,432 903 * Lam Research Corp. 17,811 901 Church & Dwight Co. Inc. 13,900 898 Cimarex Energy Co. 9,141 896 Advance Auto Parts Inc. 7,800 896 * Henry Schein Inc. 7,791 895 New York Times Co. Class A 63,300 895 * Incyte Corp. Ltd. 13,600 891 Towers Watson & Co. Class A 7,600 889 Universal Health Services Inc. Class B 10,728 880 * MGM Resorts International 36,102 879 * Pharmacyclics Inc. 6,600 878 * Akamai Technologies Inc. 18,402 877 Core Laboratories NV 4,900 877 * IHS Inc. Class A 7,711 875 Hillshire Brands Co. 24,513 873 LTC Properties Inc. 23,000 873 * CommVault Systems Inc. 12,600 870 Maxim Integrated Products Inc. 28,636 867 * TRW Automotive Holdings Corp. 11,593 860 * Endo Health Solutions Inc. 13,000 856 Microchip Technology Inc. 19,030 854 * Varian Medical Systems Inc. 10,490 853 Best Buy Co. Inc. 36,172 851 * Jazz Pharmaceuticals plc 5,600 849 * TIBCO Software Inc. 39,802 847 Computer Sciences Corp. 13,990 845 Extra Space Storage Inc. 18,500 845 ProAssurance Corp. 18,120 842
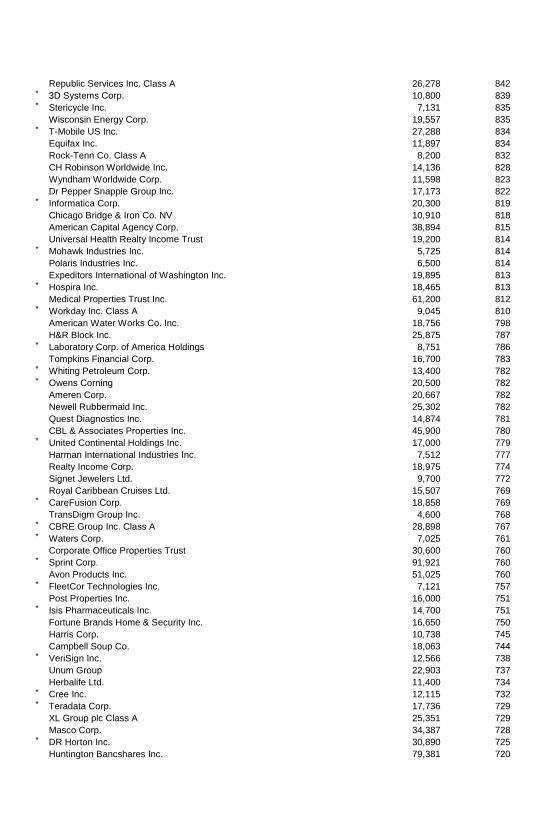
Republic Services Inc. Class A 26,278 842 * 3D Systems Corp. 10,800 839 * Stericycle Inc. 7,131 835 Wisconsin Energy Corp. 19,557 835 * T-Mobile US Inc. 27,288 834 Equifax Inc. 11,897 834 Rock-Tenn Co. Class A 8,200 832 CH Robinson Worldwide Inc. 14,136 828 Wyndham Worldwide Corp. 11,598 823 Dr Pepper Snapple Group Inc. 17,173 822 * Informatica Corp. 20,300 819 Chicago Bridge & Iron Co. NV 10,910 818 American Capital Agency Corp. 38,894 815 Universal Health Realty Income Trust 19,200 814 * Mohawk Industries Inc. 5,725 814 Polaris Industries Inc. 6,500 814 Expeditors International of Washington Inc. 19,895 813 * Hospira Inc. 18,465 813 Medical Properties Trust Inc. 61,200 812 * Workday Inc. Class A 9,045 810 American Water Works Co. Inc. 18,756 798 H&R Block Inc. 25,875 787 * Laboratory Corp. of America Holdings 8,751 786 Tompkins Financial Corp. 16,700 783 * Whiting Petroleum Corp. 13,400 782 * Owens Corning 20,500 782 Ameren Corp. 20,667 782 Newell Rubbermaid Inc. 25,302 782 Quest Diagnostics Inc. 14,874 781 CBL & Associates Properties Inc. 45,900 780 * United Continental Holdings Inc. 17,000 779 Harman International Industries Inc. 7,512 777 Realty Income Corp. 18,975 774 Signet Jewelers Ltd. 9,700 772 Royal Caribbean Cruises Ltd. 15,507 769 * CareFusion Corp. 18,858 769 TransDigm Group Inc. 4,600 768 * CBRE Group Inc. Class A 28,898 767 * Waters Corp. 7,025 761 Corporate Office Properties Trust 30,600 760 * Sprint Corp. 91,921 760 Avon Products Inc. 51,025 760 * FleetCor Technologies Inc. 7,121 757 Post Properties Inc. 16,000 751 * Isis Pharmaceuticals Inc. 14,700 751 Fortune Brands Home & Security Inc. 16,650 750 Harris Corp. 10,738 745 Campbell Soup Co. 18,063 744 * VeriSign Inc. 12,566 738 Unum Group 22,903 737 Herbalife Ltd. 11,400 734 * Cree Inc. 12,115 732 * Teradata Corp. 17,736 729 XL Group plc Class A 25,351 729 Masco Corp. 34,387 728 * DR Horton Inc. 30,890 725 Huntington Bancshares Inc. 79,381 720
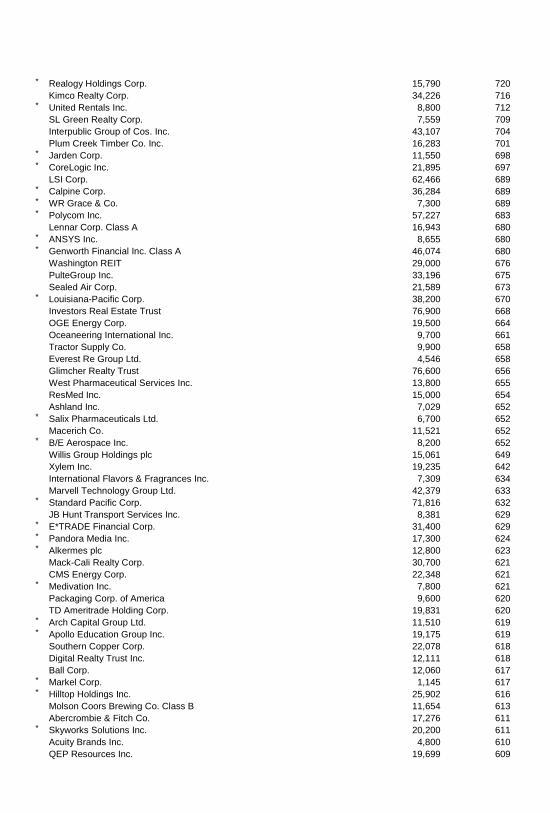
* Realogy Holdings Corp. 15,790 720 Kimco Realty Corp. 34,226 716 * United Rentals Inc. 8,800 712 SL Green Realty Corp. 7,559 709 Interpublic Group of Cos. Inc. 43,107 704 Plum Creek Timber Co. Inc. 16,283 701 * Jarden Corp. 11,550 698 * CoreLogic Inc. 21,895 697 LSI Corp. 62,466 689 * Calpine Corp. 36,284 689 * WR Grace & Co. 7,300 689 * Polycom Inc. 57,227 683 Lennar Corp. Class A 16,943 680 * ANSYS Inc. 8,655 680 * Genworth Financial Inc. Class A 46,074 680 Washington REIT 29,000 676 PulteGroup Inc. 33,196 675 Sealed Air Corp. 21,589 673 * Louisiana-Pacific Corp. 38,200 670 Investors Real Estate Trust 76,900 668 OGE Energy Corp. 19,500 664 Oceaneering International Inc. 9,700 661 Tractor Supply Co. 9,900 658 Everest Re Group Ltd. 4,546 658 Glimcher Realty Trust 76,600 656 West Pharmaceutical Services Inc. 13,800 655 ResMed Inc. 15,000 654 Ashland Inc. 7,029 652 * Salix Pharmaceuticals Ltd. 6,700 652 Macerich Co. 11,521 652 * B/E Aerospace Inc. 8,200 652 Willis Group Holdings plc 15,061 649 Xylem Inc. 19,235 642 International Flavors & Fragrances Inc. 7,309 634 Marvell Technology Group Ltd. 42,379 633 * Standard Pacific Corp. 71,816 632 JB Hunt Transport Services Inc. 8,381 629 * E*TRADE Financial Corp. 31,400 629 * Pandora Media Inc. 17,300 624 * Alkermes plc 12,800 623 Mack-Cali Realty Corp. 30,700 621 CMS Energy Corp. 22,348 621 * Medivation Inc. 7,800 621 Packaging Corp. of America 9,600 620 TD Ameritrade Holding Corp. 19,831 620 * Arch Capital Group Ltd. 11,510 619 * Apollo Education Group Inc. 19,175 619 Southern Copper Corp. 22,078 618 Digital Realty Trust Inc. 12,111 618 Ball Corp. 12,060 617 * Markel Corp. 1,145 617 * Hilltop Holdings Inc. 25,902 616 Molson Coors Brewing Co. Class B 11,654 613 Abercrombie & Fitch Co. 17,276 611 * Skyworks Solutions Inc. 20,200 611 Acuity Brands Inc. 4,800 610 QEP Resources Inc. 19,699 609
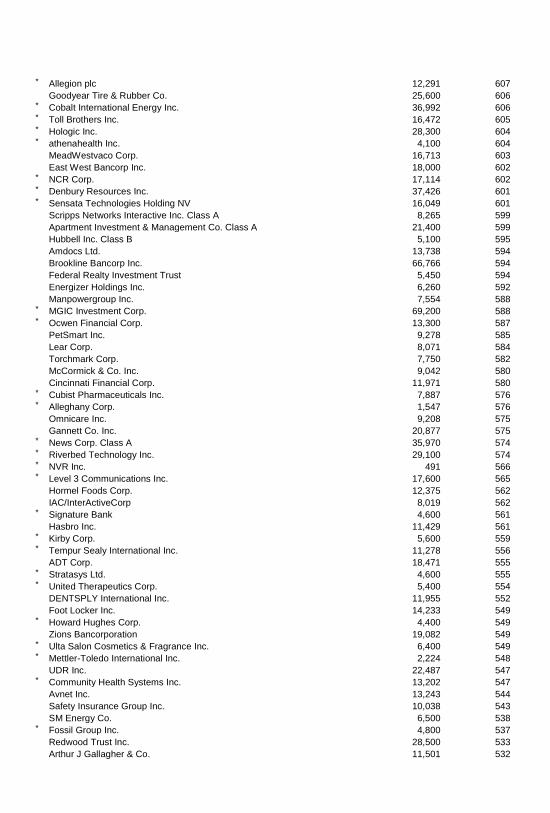
* Allegion plc 12,291 607 Goodyear Tire & Rubber Co. 25,600 606 * Cobalt International Energy Inc. 36,992 606 * Toll Brothers Inc. 16,472 605 * Hologic Inc. 28,300 604 * athenahealth Inc. 4,100 604 MeadWestvaco Corp. 16,713 603 East West Bancorp Inc. 18,000 602 * NCR Corp. 17,114 602 * Denbury Resources Inc. 37,426 601 * Sensata Technologies Holding NV 16,049 601 Scripps Networks Interactive Inc. Class A 8,265 599 Apartment Investment & Management Co. Class A 21,400 599 Hubbell Inc. Class B 5,100 595 Amdocs Ltd. 13,738 594 Brookline Bancorp Inc. 66,766 594 Federal Realty Investment Trust 5,450 594 Energizer Holdings Inc. 6,260 592 Manpowergroup Inc. 7,554 588 * MGIC Investment Corp. 69,200 588 * Ocwen Financial Corp. 13,300 587 PetSmart Inc. 9,278 585 Lear Corp. 8,071 584 Torchmark Corp. 7,750 582 McCormick & Co. Inc. 9,042 580 Cincinnati Financial Corp. 11,971 580 * Cubist Pharmaceuticals Inc. 7,887 576 * Alleghany Corp. 1,547 576 Omnicare Inc. 9,208 575 Gannett Co. Inc. 20,877 575 * News Corp. Class A 35,970 574 * Riverbed Technology Inc. 29,100 574 * NVR Inc. 491 566 * Level 3 Communications Inc. 17,600 565 Hormel Foods Corp. 12,375 562 IAC/InterActiveCorp 8,019 562 * Signature Bank 4,600 561 Hasbro Inc. 11,429 561 * Kirby Corp. 5,600 559 * Tempur Sealy International Inc. 11,278 556 ADT Corp. 18,471 555 * Stratasys Ltd. 4,600 555 * United Therapeutics Corp. 5,400 554 DENTSPLY International Inc. 11,955 552 Foot Locker Inc. 14,233 549 * Howard Hughes Corp. 4,400 549 Zions Bancorporation 19,082 549 * Ulta Salon Cosmetics & Fragrance Inc. 6,400 549 * Mettler-Toledo International Inc. 2,224 548 UDR Inc. 22,487 547 * Community Health Systems Inc. 13,202 547 Avnet Inc. 13,243 544 Safety Insurance Group Inc. 10,038 543 SM Energy Co. 6,500 538 * Fossil Group Inc. 4,800 537 Redwood Trust Inc. 28,500 533 Arthur J Gallagher & Co. 11,501 532
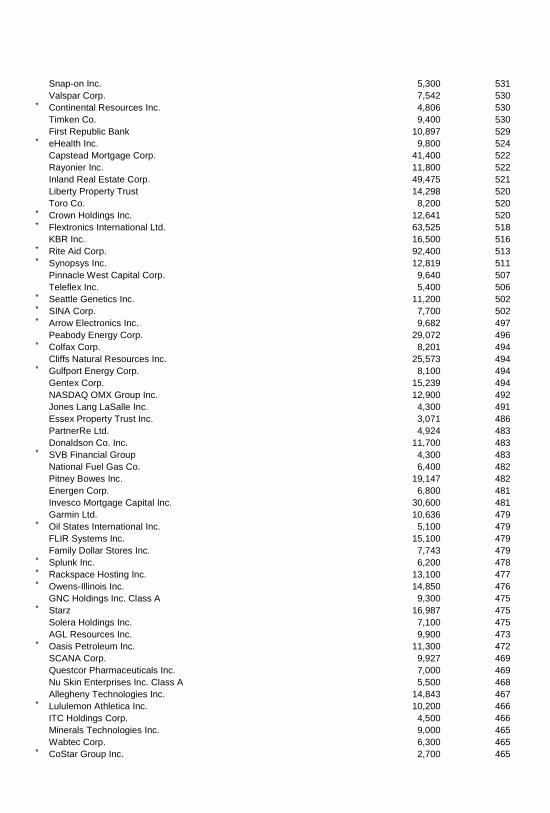
Snap-on Inc. 5,300 531 Valspar Corp. 7,542 530 * Continental Resources Inc. 4,806 530 Timken Co. 9,400 530 First Republic Bank 10,897 529 * eHealth Inc. 9,800 524 Capstead Mortgage Corp. 41,400 522 Rayonier Inc. 11,800 522 Inland Real Estate Corp. 49,475 521 Liberty Property Trust 14,298 520 Toro Co. 8,200 520 * Crown Holdings Inc. 12,641 520 * Flextronics International Ltd. 63,525 518 KBR Inc. 16,500 516 * Rite Aid Corp. 92,400 513 * Synopsys Inc. 12,819 511 Pinnacle West Capital Corp. 9,640 507 Teleflex Inc. 5,400 506 * Seattle Genetics Inc. 11,200 502 * SINA Corp. 7,700 502 * Arrow Electronics Inc. 9,682 497 Peabody Energy Corp. 29,072 496 * Colfax Corp. 8,201 494 Cliffs Natural Resources Inc. 25,573 494 * Gulfport Energy Corp. 8,100 494 Gentex Corp. 15,239 494 NASDAQ OMX Group Inc. 12,900 492 Jones Lang LaSalle Inc. 4,300 491 Essex Property Trust Inc. 3,071 486 PartnerRe Ltd. 4,924 483 Donaldson Co. Inc. 11,700 483 * SVB Financial Group 4,300 483 National Fuel Gas Co. 6,400 482 Pitney Bowes Inc. 19,147 482 Energen Corp. 6,800 481 Invesco Mortgage Capital Inc. 30,600 481 Garmin Ltd. 10,636 479 * Oil States International Inc. 5,100 479 FLIR Systems Inc. 15,100 479 Family Dollar Stores Inc. 7,743 479 * Splunk Inc. 6,200 478 * Rackspace Hosting Inc. 13,100 477 * Owens-Illinois Inc. 14,850 476 GNC Holdings Inc. Class A 9,300 475 * Starz 16,987 475 Solera Holdings Inc. 7,100 475 AGL Resources Inc. 9,900 473 * Oasis Petroleum Inc. 11,300 472 SCANA Corp. 9,927 469 Questcor Pharmaceuticals Inc. 7,000 469 Nu Skin Enterprises Inc. Class A 5,500 468 Allegheny Technologies Inc. 14,843 467 * Lululemon Athletica Inc. 10,200 466 ITC Holdings Corp. 4,500 466 Minerals Technologies Inc. 9,000 465 Wabtec Corp. 6,300 465 * CoStar Group Inc. 2,700 465
Raymond James Financial Inc. 9,100 463 * Medidata Solutions Inc. 7,300 461 United States Steel Corp. 17,631 460 GameStop Corp. Class A 13,116 460 * Graphic Packaging Holding Co. 48,247 458 * IDEXX Laboratories Inc. 4,000 457 * WABCO Holdings Inc. 5,300 457 * Panera Bread Co. Class A 2,700 456 BRE Properties Inc. 7,700 455 IDEX Corp. 6,300 454 AGCO Corp. 8,500 453 * PTC Inc. 12,700 453 Rockwood Holdings Inc. 6,600 452 Cullen/Frost Bankers Inc. 6,100 452 Iron Mountain Inc. 17,092 451 Lazard Ltd. Class A 10,500 449 * Tenet Healthcare Corp. 9,750 449 * WhiteWave Foods Co. Class A 18,422 446 * Cadence Design Systems Inc. 31,565 446 * Sally Beauty Holdings Inc. 15,700 446 Copa Holdings SA Class A 3,400 444 Axis Capital Holdings Ltd. 9,862 444 * Alnylam Pharmaceuticals Inc. 5,300 443 * Old Dominion Freight Line Inc. 8,150 442 Camden Property Trust 7,148 442 Jack Henry & Associates Inc. 7,900 441 * MSCI Inc. Class A 10,300 440 Geo Group Inc. 13,132 440 * Liberty Ventures Class A 3,785 439 * VeriFone Systems Inc. 15,100 438 CBOE Holdings Inc. 8,400 437 MSC Industrial Direct Co. Inc. Class A 5,200 437 Patterson-UTI Energy Inc. 16,959 436 CNO Financial Group Inc. 25,600 434 * Aspen Technology Inc. 9,500 433 Royal Gold Inc. 7,700 431 * tw telecom inc Class A 14,600 430 Albemarle Corp. 6,700 430 * DexCom Inc. 10,600 429 Starwood Property Trust Inc. 14,105 426 UNS Energy Corp. 7,100 425 PolyOne Corp. 11,900 423 * Hain Celestial Group Inc. 4,600 423 Terex Corp. 10,302 422 Regal-Beloit Corp. 5,700 422 Superior Energy Services Inc. 17,835 422 Huntington Ingalls Industries Inc. 4,429 421 * Nuance Communications Inc. 27,400 420 * Jack in the Box Inc. 8,300 420 * Middleby Corp. 1,700 419 * AOL Inc. 9,091 419 * Quanta Services Inc. 13,400 418 Nabors Industries Ltd. 24,411 417 * SunEdison Inc. 29,900 416 Sensient Technologies Corp. 8,500 416 * First Solar Inc. 8,170 413 Black Hills Corp. 7,500 411
Alaska Air Group Inc. 5,200 411 * Lumber Liquidators Holdings Inc. 4,600 409 * Ultimate Software Group Inc. 2,500 408 * Allscripts Healthcare Solutions Inc. 24,600 407 Airgas Inc. 3,937 406 Teekay Corp. 7,500 406 Alliant Energy Corp. 7,777 404 KAR Auction Services Inc. 14,504 404 Reinsurance Group of America Inc. Class A 5,400 403 * ON Semiconductor Corp. 48,067 402 * Euronet Worldwide Inc. 9,300 399 Brunswick Corp. 9,600 398 Windstream Holdings Inc. 53,196 398 * Vantiv Inc. Class A 13,110 398 Global Payments Inc. 6,000 397 SY Bancorp Inc. 13,400 397 IDACORP Inc. 7,500 395 Waddell & Reed Financial Inc. Class A 6,100 395 Ingredion Inc. 6,300 392 * WPX Energy Inc. 20,599 392 * Portfolio Recovery Associates Inc. 7,800 392 FactSet Research Systems Inc. 3,700 391 Flowers Foods Inc. 18,500 388 * Atmel Corp. 46,300 387 Manitowoc Co. Inc. 13,600 387 Westar Energy Inc. Class A 11,600 385 Trinity Industries Inc. 6,600 384 * Spirit Aerosystems Holdings Inc. Class A 11,300 383 * Align Technology Inc. 6,400 380 Waste Connections Inc. 9,300 380 SPX Corp. 3,799 378 * Neogen Corp. 9,000 378 Eagle Materials Inc. 4,800 378 Frontier Communications Corp. 80,302 377 Spirit Realty Capital Inc. 35,599 377 Dun & Bradstreet Corp. 3,430 377 Community Trust Bancorp Inc. 9,300 377 Alexandria Real Estate Equities Inc. 5,371 377 * Texas Industries Inc. 5,000 376 Avery Dennison Corp. 7,630 376 ING US Inc. 11,100 375 * JDS Uniphase Corp. 28,200 375 Pepco Holdings Inc. 19,195 373 * Dril-Quip Inc. 3,700 372 Duke Realty Corp. 23,652 372 Portland General Electric Co. 12,300 371 * NetSuite Inc. 3,519 370 * AMC Networks Inc. Class A 5,734 370 Belden Inc. 5,700 369 * Hyatt Hotels Corp. Class A 7,700 368 * Sirona Dental Systems Inc. 5,100 367 Regency Centers Corp. 7,586 365 * Teradyne Inc. 19,400 365 Reliance Steel & Aluminum Co. 5,200 364 ITT Corp. 8,867 363 Broadridge Financial Solutions Inc. 9,995 363 Ryder System Inc. 5,087 362
RPM International Inc. 9,100 361 Williams-Sonoma Inc. 6,600 360 * Hexcel Corp. 8,600 358 WD-40 Co. 5,200 357 NorthWestern Corp. 7,900 357 Senior Housing Properties Trust 15,859 357 * Visteon Corp. 4,400 356 Western Refining Inc. 9,100 356 * Avis Budget Group Inc. 9,400 354 * Darling International Inc. 18,100 354 HB Fuller Co. 7,600 354 * Iconix Brand Group Inc. 9,500 353 * AerCap Holdings NV 9,465 352 Taubman Centers Inc. 5,413 352 Dick's Sporting Goods Inc. 6,700 352 * Urban Outfitters Inc. 9,817 352 Questar Corp. 15,025 350 * Fifth & Pacific Cos. Inc. 12,200 350 Curtiss-Wright Corp. 5,700 350 * Covance Inc. 3,700 350 Hanover Insurance Group Inc. 6,300 350 * Kodiak Oil & Gas Corp. 32,800 348 Mid-America Apartment Communities Inc. 5,344 345 Assured Guaranty Ltd. 16,300 345 Worthington Industries Inc. 8,500 345 Exelis Inc. 17,535 344 LPL Financial Holdings Inc. 6,400 343 Integrys Energy Group Inc. 6,300 342 * Dresser-Rand Group Inc. 6,000 342 People's United Financial Inc. 24,024 341 DST Systems Inc. 3,747 341 RR Donnelley & Sons Co. 18,413 340 ALLETE Inc. 6,800 340 Weis Markets Inc. 6,900 340 * Centene Corp. 5,600 339 International Game Technology 23,505 339 Omega Healthcare Investors Inc. 10,600 339 Martin Marietta Materials Inc. 3,100 338 * United Natural Foods Inc. 5,000 338 Prosperity Bancshares Inc. 5,400 338 * WEX Inc. 4,100 338 Bristow Group Inc. 4,700 337 * Newfield Exploration Co. 13,601 337 * Volcano Corp. 16,029 336 Corrections Corp. of America 10,007 336 Dunkin' Brands Group Inc. 7,218 336 Great Plains Energy Inc. 13,600 336 * Cabela's Inc. 5,000 334 NorthStar Realty Finance Corp. 22,900 334 American National Insurance Co. 3,200 333 Cleco Corp. 6,800 332 DSW Inc. Class A 8,820 332 * Live Nation Entertainment Inc. 15,500 330 Hospitality Properties Trust 12,768 328 * Ingram Micro Inc. 13,100 328 Babcock & Wilcox Co. 9,550 327 URS Corp. 6,500 326
STERIS Corp. 7,100 326 Synovus Financial Corp. 97,200 326 Lincoln Electric Holdings Inc. 4,700 325 Kennametal Inc. 7,500 325 * Fortinet Inc. 15,300 324 * Laredo Petroleum Inc. 13,000 322 Tupperware Brands Corp. 4,100 321 Air Lease Corp. Class A 10,200 321 UGI Corp. 7,400 321 * Mallinckrodt plc 5,543 321 Montpelier Re Holdings Ltd. 11,500 321 * Acxiom Corp. 8,900 320 Huntsman Corp. 14,600 320 * Team Health Holdings Inc. 7,400 319 Allied World Assurance Co. Holdings AG 3,100 319 FEI Co. 3,400 319 * Atwood Oceanics Inc. 6,700 318 * Manhattan Associates Inc. 9,400 317 Assurant Inc. 4,838 316 * Rosetta Resources Inc. 7,400 315 City National Corp. 4,357 315 Protective Life Corp. 6,400 314 Generac Holdings Inc. 6,500 313 Aspen Insurance Holdings Ltd. 8,000 311 * SandRidge Energy Inc. 50,600 311 Deluxe Corp. 6,400 311 Telephone & Data Systems Inc. 11,473 310 National Retail Properties Inc. 9,305 309 Arrow Financial Corp. 12,386 309 * Copart Inc. 9,000 309 American Financial Group Inc. 5,600 308 Cracker Barrel Old Country Store Inc. 3,100 307 * Cepheid Inc. 5,800 307 BioMed Realty Trust Inc. 15,697 306 EMCOR Group Inc. 7,200 306 HCC Insurance Holdings Inc. 7,100 305 * Zynga Inc. Class A 69,200 304 Washington Federal Inc. 13,900 304 * Cognex Corp. 7,700 304 Applied Industrial Technologies Inc. 6,000 303 Lennox International Inc. 3,500 303 Leidos Holdings Inc. 6,669 302 MarketAxess Holdings Inc. 4,800 301 Domtar Corp. 2,800 301 Jabil Circuit Inc. 16,719 300 * Sprouts Farmers Market Inc. 8,400 300 CARBO Ceramics Inc. 2,600 299 MercadoLibre Inc. 3,100 299 * Esterline Technologies Corp. 2,900 299 * Genesee & Wyoming Inc. Class A 3,300 298 Total System Services Inc. 9,935 297 Cato Corp. Class A 10,600 296 * AECOM Technology Corp. 10,300 295 Axiall Corp. 7,400 295 * Tyler Technologies Inc. 2,800 295 RLJ Lodging Trust 11,800 295 Six Flags Entertainment Corp. 8,200 294
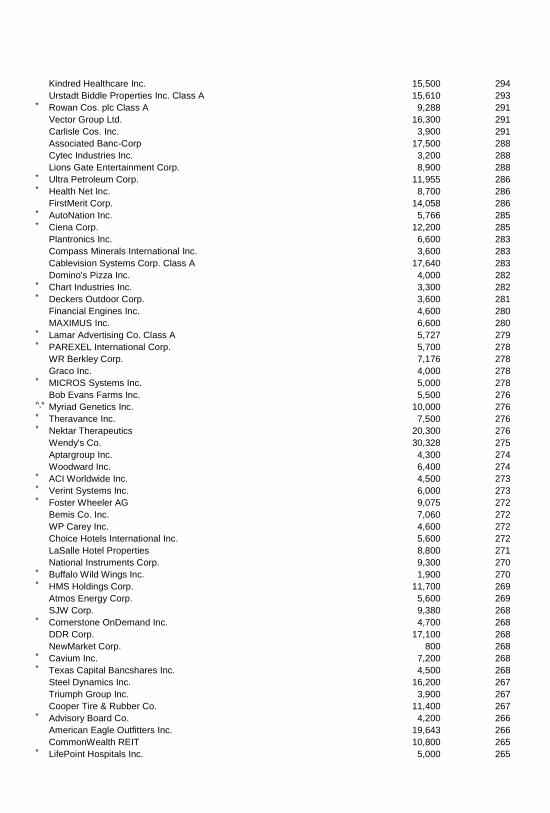
Kindred Healthcare Inc. 15,500 294 Urstadt Biddle Properties Inc. Class A 15,610 293 * Rowan Cos. plc Class A 9,288 291 Vector Group Ltd. 16,300 291 Carlisle Cos. Inc. 3,900 291 Associated Banc-Corp 17,500 288 Cytec Industries Inc. 3,200 288 Lions Gate Entertainment Corp. 8,900 288 * Ultra Petroleum Corp. 11,955 286 * Health Net Inc. 8,700 286 FirstMerit Corp. 14,058 286 * AutoNation Inc. 5,766 285 * Ciena Corp. 12,200 285 Plantronics Inc. 6,600 283 Compass Minerals International Inc. 3,600 283 Cablevision Systems Corp. Class A 17,640 283 Domino's Pizza Inc. 4,000 282 * Chart Industries Inc. 3,300 282 * Deckers Outdoor Corp. 3,600 281 Financial Engines Inc. 4,600 280 MAXIMUS Inc. 6,600 280 * Lamar Advertising Co. Class A 5,727 279 * PAREXEL International Corp. 5,700 278 WR Berkley Corp. 7,176 278 Graco Inc. 4,000 278 * MICROS Systems Inc. 5,000 278 Bob Evans Farms Inc. 5,500 276 ^,* Myriad Genetics Inc. 10,000 276 * Theravance Inc. 7,500 276 * Nektar Therapeutics 20,300 276 Wendy's Co. 30,328 275 Aptargroup Inc. 4,300 274 Woodward Inc. 6,400 274 * ACI Worldwide Inc. 4,500 273 * Verint Systems Inc. 6,000 273 * Foster Wheeler AG 9,075 272 Bemis Co. Inc. 7,060 272 WP Carey Inc. 4,600 272 Choice Hotels International Inc. 5,600 272 LaSalle Hotel Properties 8,800 271 National Instruments Corp. 9,300 270 * Buffalo Wild Wings Inc. 1,900 270 * HMS Holdings Corp. 11,700 269 Atmos Energy Corp. 5,600 269 SJW Corp. 9,380 268 * Cornerstone OnDemand Inc. 4,700 268 DDR Corp. 17,100 268 NewMarket Corp. 800 268 * Cavium Inc. 7,200 268 * Texas Capital Bancshares Inc. 4,500 268 Steel Dynamics Inc. 16,200 267 Triumph Group Inc. 3,900 267 Cooper Tire & Rubber Co. 11,400 267 * Advisory Board Co. 4,200 266 American Eagle Outfitters Inc. 19,643 266 CommonWealth REIT 10,800 265 * LifePoint Hospitals Inc. 5,000 265
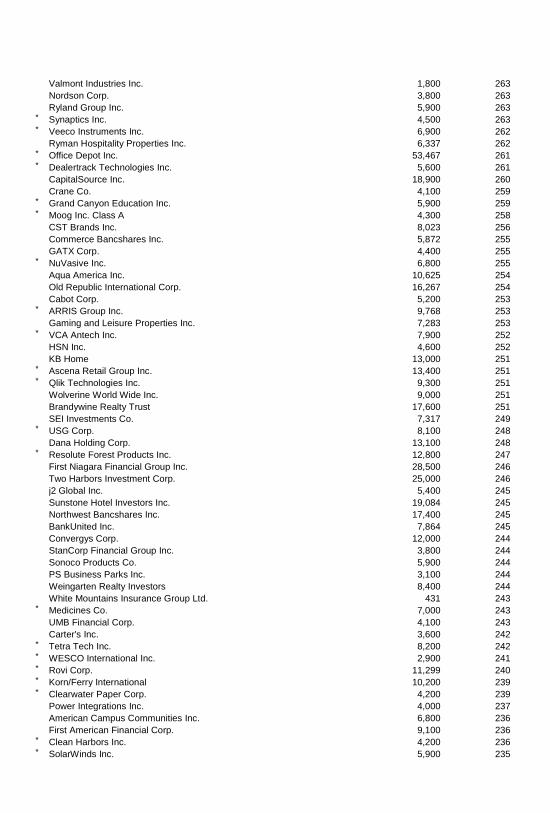
Valmont Industries Inc. 1,800 263 Nordson Corp. 3,800 263 Ryland Group Inc. 5,900 263 * Synaptics Inc. 4,500 263 * Veeco Instruments Inc. 6,900 262 Ryman Hospitality Properties Inc. 6,337 262 * Office Depot Inc. 53,467 261 * Dealertrack Technologies Inc. 5,600 261 CapitalSource Inc. 18,900 260 Crane Co. 4,100 259 * Grand Canyon Education Inc. 5,900 259 * Moog Inc. Class A 4,300 258 CST Brands Inc. 8,023 256 Commerce Bancshares Inc. 5,872 255 GATX Corp. 4,400 255 * NuVasive Inc. 6,800 255 Aqua America Inc. 10,625 254 Old Republic International Corp. 16,267 254 Cabot Corp. 5,200 253 * ARRIS Group Inc. 9,768 253 Gaming and Leisure Properties Inc. 7,283 253 * VCA Antech Inc. 7,900 252 HSN Inc. 4,600 252 KB Home 13,000 251 * Ascena Retail Group Inc. 13,400 251 * Qlik Technologies Inc. 9,300 251 Wolverine World Wide Inc. 9,000 251 Brandywine Realty Trust 17,600 251 SEI Investments Co. 7,317 249 * USG Corp. 8,100 248 Dana Holding Corp. 13,100 248 * Resolute Forest Products Inc. 12,800 247 First Niagara Financial Group Inc. 28,500 246 Two Harbors Investment Corp. 25,000 246 j2 Global Inc. 5,400 245 Sunstone Hotel Investors Inc. 19,084 245 Northwest Bancshares Inc. 17,400 245 BankUnited Inc. 7,864 245 Convergys Corp. 12,000 244 StanCorp Financial Group Inc. 3,800 244 Sonoco Products Co. 5,900 244 PS Business Parks Inc. 3,100 244 Weingarten Realty Investors 8,400 244 White Mountains Insurance Group Ltd. 431 243 * Medicines Co. 7,000 243 UMB Financial Corp. 4,100 243 Carter's Inc. 3,600 242 * Tetra Tech Inc. 8,200 242 * WESCO International Inc. 2,900 241 * Rovi Corp. 11,299 240 * Korn/Ferry International 10,200 239 * Clearwater Paper Corp. 4,200 239 Power Integrations Inc. 4,000 237 American Campus Communities Inc. 6,800 236 First American Financial Corp. 9,100 236 * Clean Harbors Inc. 4,200 236 * SolarWinds Inc. 5,900 235
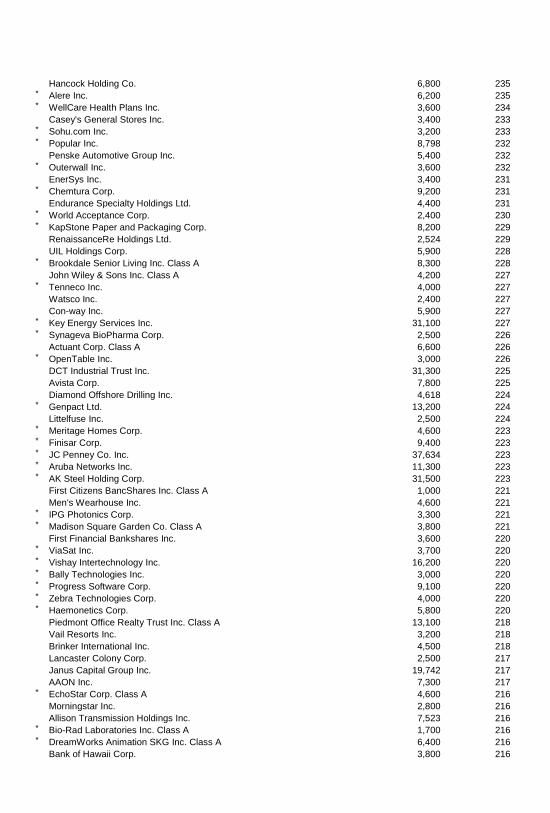
Hancock Holding Co. 6,800 235 * Alere Inc. 6,200 235 * WellCare Health Plans Inc. 3,600 234 Casey's General Stores Inc. 3,400 233 * Sohu.com Inc. 3,200 233 * Popular Inc. 8,798 232 Penske Automotive Group Inc. 5,400 232 * Outerwall Inc. 3,600 232 EnerSys Inc. 3,400 231 * Chemtura Corp. 9,200 231 Endurance Specialty Holdings Ltd. 4,400 231 * World Acceptance Corp. 2,400 230 * KapStone Paper and Packaging Corp. 8,200 229 RenaissanceRe Holdings Ltd. 2,524 229 UIL Holdings Corp. 5,900 228 * Brookdale Senior Living Inc. Class A 8,300 228 John Wiley & Sons Inc. Class A 4,200 227 * Tenneco Inc. 4,000 227 Watsco Inc. 2,400 227 Con-way Inc. 5,900 227 * Key Energy Services Inc. 31,100 227 * Synageva BioPharma Corp. 2,500 226 Actuant Corp. Class A 6,600 226 * OpenTable Inc. 3,000 226 DCT Industrial Trust Inc. 31,300 225 Avista Corp. 7,800 225 Diamond Offshore Drilling Inc. 4,618 224 * Genpact Ltd. 13,200 224 Littelfuse Inc. 2,500 224 * Meritage Homes Corp. 4,600 223 * Finisar Corp. 9,400 223 * JC Penney Co. Inc. 37,634 223 * Aruba Networks Inc. 11,300 223 * AK Steel Holding Corp. 31,500 223 First Citizens BancShares Inc. Class A 1,000 221 Men's Wearhouse Inc. 4,600 221 * IPG Photonics Corp. 3,300 221 * Madison Square Garden Co. Class A 3,800 221 First Financial Bankshares Inc. 3,600 220 * ViaSat Inc. 3,700 220 * Vishay Intertechnology Inc. 16,200 220 * Bally Technologies Inc. 3,000 220 * Progress Software Corp. 9,100 220 * Zebra Technologies Corp. 4,000 220 * Haemonetics Corp. 5,800 220 Piedmont Office Realty Trust Inc. Class A 13,100 218 Vail Resorts Inc. 3,200 218 Brinker International Inc. 4,500 218 Lancaster Colony Corp. 2,500 217 Janus Capital Group Inc. 19,742 217 AAON Inc. 7,300 217 * EchoStar Corp. Class A 4,600 216 Morningstar Inc. 2,800 216 Allison Transmission Holdings Inc. 7,523 216 * Bio-Rad Laboratories Inc. Class A 1,700 216 * DreamWorks Animation SKG Inc. Class A 6,400 216 Bank of Hawaii Corp. 3,800 216
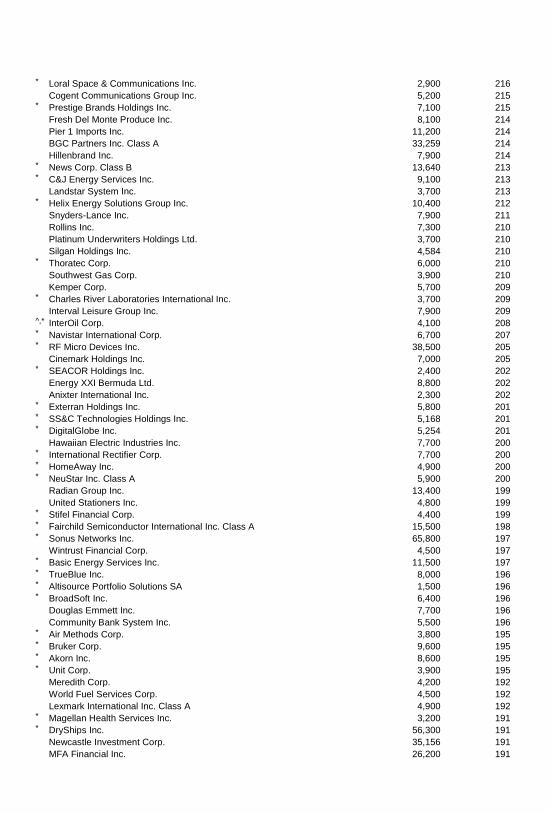
* Loral Space & Communications Inc. 2,900 216 Cogent Communications Group Inc. 5,200 215 * Prestige Brands Holdings Inc. 7,100 215 Fresh Del Monte Produce Inc. 8,100 214 Pier 1 Imports Inc. 11,200 214 BGC Partners Inc. Class A 33,259 214 Hillenbrand Inc. 7,900 214 * News Corp. Class B 13,640 213 * C&J Energy Services Inc. 9,100 213 Landstar System Inc. 3,700 213 * Helix Energy Solutions Group Inc. 10,400 212 Snyders-Lance Inc. 7,900 211 Rollins Inc. 7,300 210 Platinum Underwriters Holdings Ltd. 3,700 210 Silgan Holdings Inc. 4,584 210 * Thoratec Corp. 6,000 210 Southwest Gas Corp. 3,900 210 Kemper Corp. 5,700 209 * Charles River Laboratories International Inc. 3,700 209 Interval Leisure Group Inc. 7,900 209 ^,* InterOil Corp. 4,100 208 * Navistar International Corp. 6,700 207 * RF Micro Devices Inc. 38,500 205 Cinemark Holdings Inc. 7,000 205 * SEACOR Holdings Inc. 2,400 202 Energy XXI Bermuda Ltd. 8,800 202 Anixter International Inc. 2,300 202 * Exterran Holdings Inc. 5,800 201 * SS&C Technologies Holdings Inc. 5,168 201 * DigitalGlobe Inc. 5,254 201 Hawaiian Electric Industries Inc. 7,700 200 * International Rectifier Corp. 7,700 200 * HomeAway Inc. 4,900 200 * NeuStar Inc. Class A 5,900 200 Radian Group Inc. 13,400 199 United Stationers Inc. 4,800 199 * Stifel Financial Corp. 4,400 199 * Fairchild Semiconductor International Inc. Class A 15,500 198 * Sonus Networks Inc. 65,800 197 Wintrust Financial Corp. 4,500 197 * Basic Energy Services Inc. 11,500 197 * TrueBlue Inc. 8,000 196 * Altisource Portfolio Solutions SA 1,500 196 * BroadSoft Inc. 6,400 196 Douglas Emmett Inc. 7,700 196 Community Bank System Inc. 5,500 196 * Air Methods Corp. 3,800 195 * Bruker Corp. 9,600 195 * Akorn Inc. 8,600 195 * Unit Corp. 3,900 195 Meredith Corp. 4,200 192 World Fuel Services Corp. 4,500 192 Lexmark International Inc. Class A 4,900 192 * Magellan Health Services Inc. 3,200 191 * DryShips Inc. 56,300 191 Newcastle Investment Corp. 35,156 191 MFA Financial Inc. 26,200 191
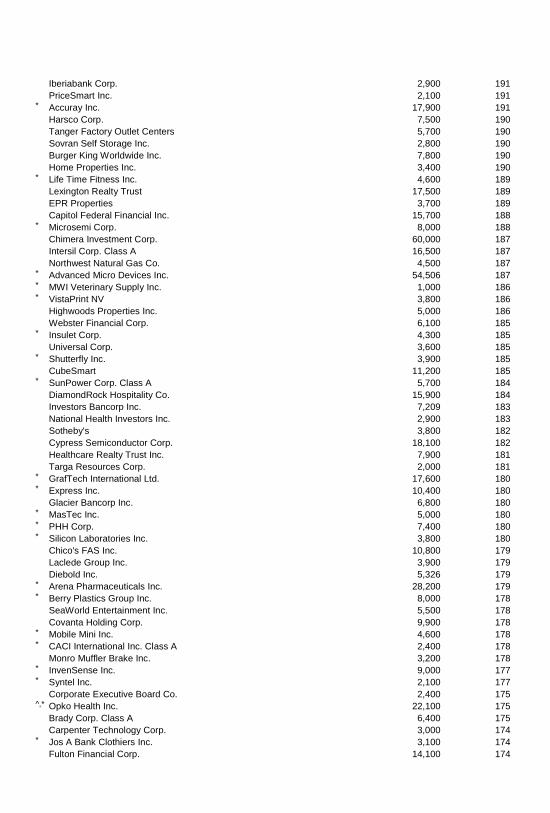
Iberiabank Corp. 2,900 191 PriceSmart Inc. 2,100 191 * Accuray Inc. 17,900 191 Harsco Corp. 7,500 190 Tanger Factory Outlet Centers 5,700 190 Sovran Self Storage Inc. 2,800 190 Burger King Worldwide Inc. 7,800 190 Home Properties Inc. 3,400 190 * Life Time Fitness Inc. 4,600 189 Lexington Realty Trust 17,500 189 EPR Properties 3,700 189 Capitol Federal Financial Inc. 15,700 188 * Microsemi Corp. 8,000 188 Chimera Investment Corp. 60,000 187 Intersil Corp. Class A 16,500 187 Northwest Natural Gas Co. 4,500 187 * Advanced Micro Devices Inc. 54,506 187 * MWI Veterinary Supply Inc. 1,000 186 * VistaPrint NV 3,800 186 Highwoods Properties Inc. 5,000 186 Webster Financial Corp. 6,100 185 * Insulet Corp. 4,300 185 Universal Corp. 3,600 185 * Shutterfly Inc. 3,900 185 CubeSmart 11,200 185 * SunPower Corp. Class A 5,700 184 DiamondRock Hospitality Co. 15,900 184 Investors Bancorp Inc. 7,209 183 National Health Investors Inc. 2,900 183 Sotheby's 3,800 182 Cypress Semiconductor Corp. 18,100 182 Healthcare Realty Trust Inc. 7,900 181 Targa Resources Corp. 2,000 181 * GrafTech International Ltd. 17,600 180 * Express Inc. 10,400 180 Glacier Bancorp Inc. 6,800 180 * MasTec Inc. 5,000 180 * PHH Corp. 7,400 180 * Silicon Laboratories Inc. 3,800 180 Chico's FAS Inc. 10,800 179 Laclede Group Inc. 3,900 179 Diebold Inc. 5,326 179 * Arena Pharmaceuticals Inc. 28,200 179 * Berry Plastics Group Inc. 8,000 178 SeaWorld Entertainment Inc. 5,500 178 Covanta Holding Corp. 9,900 178 * Mobile Mini Inc. 4,600 178 * CACI International Inc. Class A 2,400 178 Monro Muffler Brake Inc. 3,200 178 * InvenSense Inc. 9,000 177 * Syntel Inc. 2,100 177 Corporate Executive Board Co. 2,400 175 ^,* Opko Health Inc. 22,100 175 Brady Corp. Class A 6,400 175 Carpenter Technology Corp. 3,000 174 * Jos A Bank Clothiers Inc. 3,100 174 Fulton Financial Corp. 14,100 174
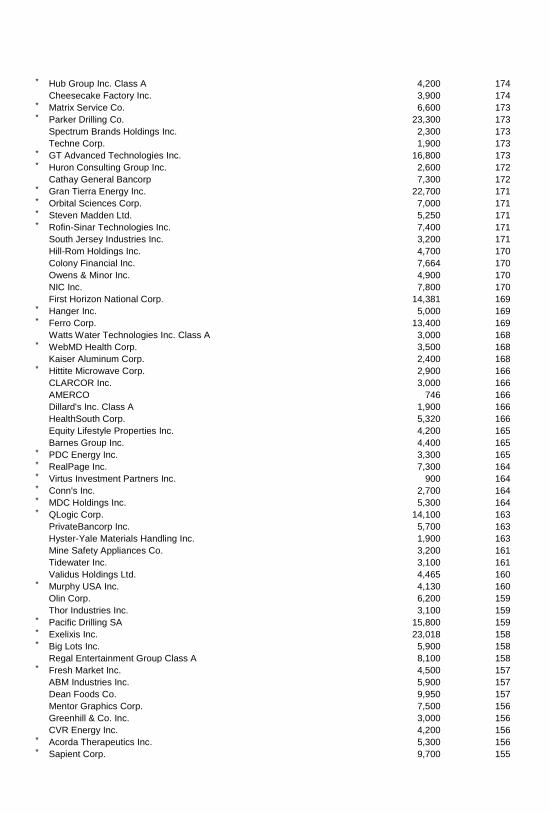
* Hub Group Inc. Class A 4,200 174 Cheesecake Factory Inc. 3,900 174 * Matrix Service Co. 6,600 173 * Parker Drilling Co. 23,300 173 Spectrum Brands Holdings Inc. 2,300 173 Techne Corp. 1,900 173 * GT Advanced Technologies Inc. 16,800 173 * Huron Consulting Group Inc. 2,600 172 Cathay General Bancorp 7,300 172 * Gran Tierra Energy Inc. 22,700 171 * Orbital Sciences Corp. 7,000 171 * Steven Madden Ltd. 5,250 171 * Rofin-Sinar Technologies Inc. 7,400 171 South Jersey Industries Inc. 3,200 171 Hill-Rom Holdings Inc. 4,700 170 Colony Financial Inc. 7,664 170 Owens & Minor Inc. 4,900 170 NIC Inc. 7,800 170 First Horizon National Corp. 14,381 169 * Hanger Inc. 5,000 169 * Ferro Corp. 13,400 169 Watts Water Technologies Inc. Class A 3,000 168 * WebMD Health Corp. 3,500 168 Kaiser Aluminum Corp. 2,400 168 * Hittite Microwave Corp. 2,900 166 CLARCOR Inc. 3,000 166 AMERCO 746 166 Dillard's Inc. Class A 1,900 166 HealthSouth Corp. 5,320 166 Equity Lifestyle Properties Inc. 4,200 165 Barnes Group Inc. 4,400 165 * PDC Energy Inc. 3,300 165 * RealPage Inc. 7,300 164 * Virtus Investment Partners Inc. 900 164 * Conn's Inc. 2,700 164 * MDC Holdings Inc. 5,300 164 * QLogic Corp. 14,100 163 PrivateBancorp Inc. 5,700 163 Hyster-Yale Materials Handling Inc. 1,900 163 Mine Safety Appliances Co. 3,200 161 Tidewater Inc. 3,100 161 Validus Holdings Ltd. 4,465 160 * Murphy USA Inc. 4,130 160 Olin Corp. 6,200 159 Thor Industries Inc. 3,100 159 * Pacific Drilling SA 15,800 159 * Exelixis Inc. 23,018 158 * Big Lots Inc. 5,900 158 Regal Entertainment Group Class A 8,100 158 * Fresh Market Inc. 4,500 157 ABM Industries Inc. 5,900 157 Dean Foods Co. 9,950 157 Mentor Graphics Corp. 7,500 156 Greenhill & Co. Inc. 3,000 156 CVR Energy Inc. 4,200 156 * Acorda Therapeutics Inc. 5,300 156 * Sapient Corp. 9,700 155
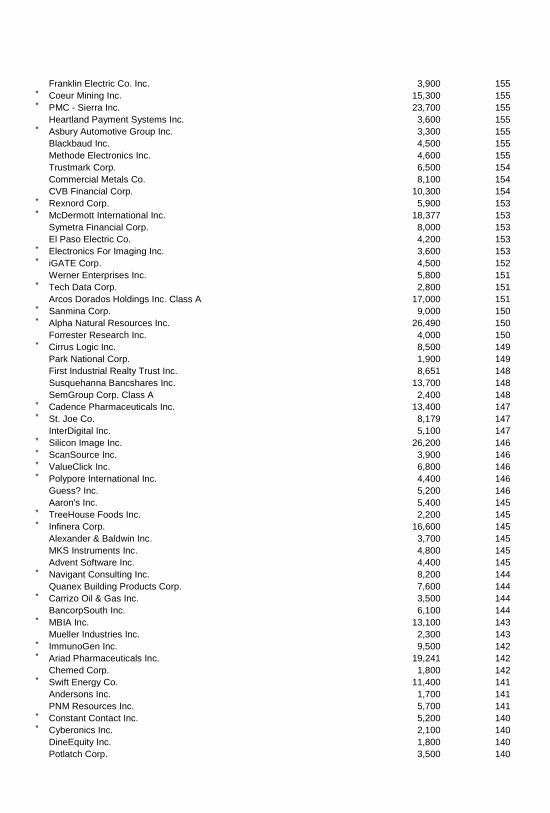
Franklin Electric Co. Inc. 3,900 155 * Coeur Mining Inc. 15,300 155 * PMC - Sierra Inc. 23,700 155 Heartland Payment Systems Inc. 3,600 155 * Asbury Automotive Group Inc. 3,300 155 Blackbaud Inc. 4,500 155 Methode Electronics Inc. 4,600 155 Trustmark Corp. 6,500 154 Commercial Metals Co. 8,100 154 CVB Financial Corp. 10,300 154 * Rexnord Corp. 5,900 153 * McDermott International Inc. 18,377 153 Symetra Financial Corp. 8,000 153 El Paso Electric Co. 4,200 153 * Electronics For Imaging Inc. 3,600 153 * iGATE Corp. 4,500 152 Werner Enterprises Inc. 5,800 151 * Tech Data Corp. 2,800 151 Arcos Dorados Holdings Inc. Class A 17,000 151 * Sanmina Corp. 9,000 150 * Alpha Natural Resources Inc. 26,490 150 Forrester Research Inc. 4,000 150 * Cirrus Logic Inc. 8,500 149 Park National Corp. 1,900 149 First Industrial Realty Trust Inc. 8,651 148 Susquehanna Bancshares Inc. 13,700 148 SemGroup Corp. Class A 2,400 148 * Cadence Pharmaceuticals Inc. 13,400 147 * St. Joe Co. 8,179 147 InterDigital Inc. 5,100 147 * Silicon Image Inc. 26,200 146 * ScanSource Inc. 3,900 146 * ValueClick Inc. 6,800 146 * Polypore International Inc. 4,400 146 Guess? Inc. 5,200 146 Aaron's Inc. 5,400 145 * TreeHouse Foods Inc. 2,200 145 * Infinera Corp. 16,600 145 Alexander & Baldwin Inc. 3,700 145 MKS Instruments Inc. 4,800 145 Advent Software Inc. 4,400 145 * Navigant Consulting Inc. 8,200 144 Quanex Building Products Corp. 7,600 144 * Carrizo Oil & Gas Inc. 3,500 144 BancorpSouth Inc. 6,100 144 * MBIA Inc. 13,100 143 Mueller Industries Inc. 2,300 143 * ImmunoGen Inc. 9,500 142 * Ariad Pharmaceuticals Inc. 19,241 142 Chemed Corp. 1,800 142 * Swift Energy Co. 11,400 141 Andersons Inc. 1,700 141 PNM Resources Inc. 5,700 141 * Constant Contact Inc. 5,200 140 * Cyberonics Inc. 2,100 140 DineEquity Inc. 1,800 140 Potlatch Corp. 3,500 140
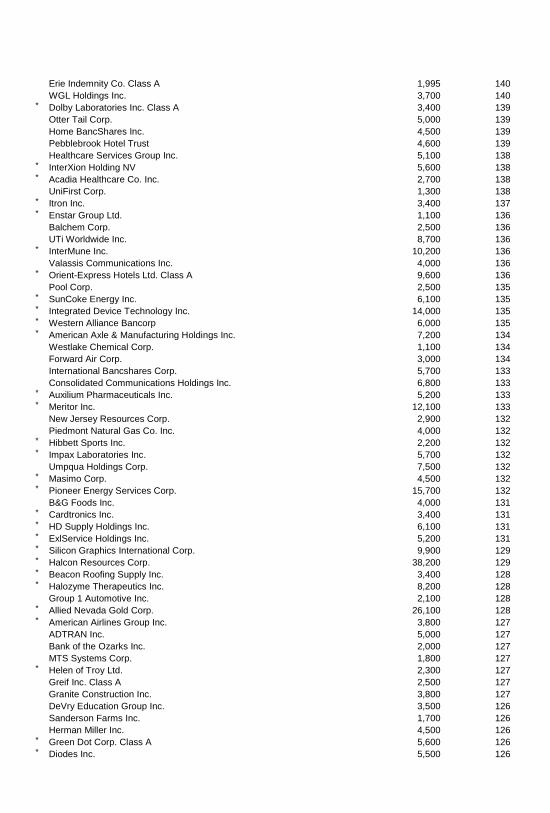
Erie Indemnity Co. Class A 1,995 140 WGL Holdings Inc. 3,700 140 * Dolby Laboratories Inc. Class A 3,400 139 Otter Tail Corp. 5,000 139 Home BancShares Inc. 4,500 139 Pebblebrook Hotel Trust 4,600 139 Healthcare Services Group Inc. 5,100 138 * InterXion Holding NV 5,600 138 * Acadia Healthcare Co. Inc. 2,700 138 UniFirst Corp. 1,300 138 * Itron Inc. 3,400 137 * Enstar Group Ltd. 1,100 136 Balchem Corp. 2,500 136 UTi Worldwide Inc. 8,700 136 * InterMune Inc. 10,200 136 Valassis Communications Inc. 4,000 136 * Orient-Express Hotels Ltd. Class A 9,600 136 Pool Corp. 2,500 135 * SunCoke Energy Inc. 6,100 135 * Integrated Device Technology Inc. 14,000 135 * Western Alliance Bancorp 6,000 135 * American Axle & Manufacturing Holdings Inc. 7,200 134 Westlake Chemical Corp. 1,100 134 Forward Air Corp. 3,000 134 International Bancshares Corp. 5,700 133 Consolidated Communications Holdings Inc. 6,800 133 * Auxilium Pharmaceuticals Inc. 5,200 133 * Meritor Inc. 12,100 133 New Jersey Resources Corp. 2,900 132 Piedmont Natural Gas Co. Inc. 4,000 132 * Hibbett Sports Inc. 2,200 132 * Impax Laboratories Inc. 5,700 132 Umpqua Holdings Corp. 7,500 132 * Masimo Corp. 4,500 132 * Pioneer Energy Services Corp. 15,700 132 B&G Foods Inc. 4,000 131 * Cardtronics Inc. 3,400 131 * HD Supply Holdings Inc. 6,100 131 * ExlService Holdings Inc. 5,200 131 * Silicon Graphics International Corp. 9,900 129 * Halcon Resources Corp. 38,200 129 * Beacon Roofing Supply Inc. 3,400 128 * Halozyme Therapeutics Inc. 8,200 128 Group 1 Automotive Inc. 2,100 128 * Allied Nevada Gold Corp. 26,100 128 * American Airlines Group Inc. 3,800 127 ADTRAN Inc. 5,000 127 Bank of the Ozarks Inc. 2,000 127 MTS Systems Corp. 1,800 127 * Helen of Troy Ltd. 2,300 127 Greif Inc. Class A 2,500 127 Granite Construction Inc. 3,800 127 DeVry Education Group Inc. 3,500 126 Sanderson Farms Inc. 1,700 126 Herman Miller Inc. 4,500 126 * Green Dot Corp. Class A 5,600 126 * Diodes Inc. 5,500 126
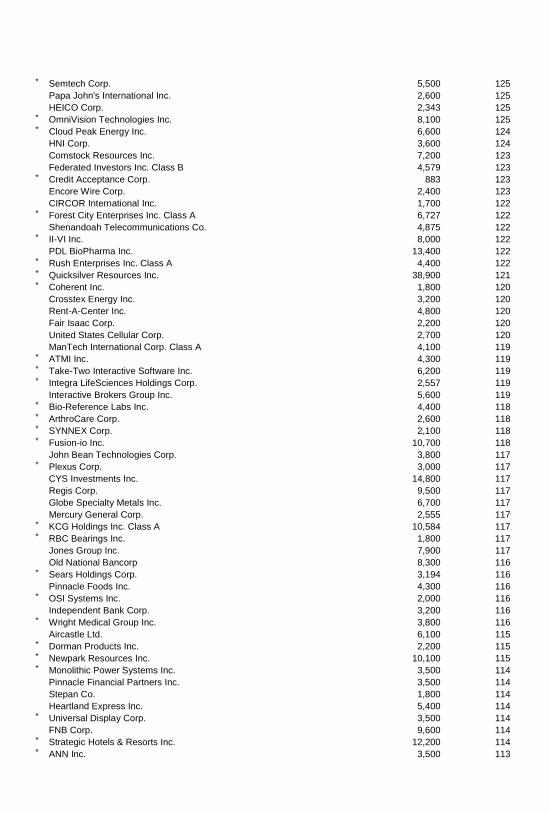
* Semtech Corp. 5,500 125 Papa John's International Inc. 2,600 125 HEICO Corp. 2,343 125 * OmniVision Technologies Inc. 8,100 125 * Cloud Peak Energy Inc. 6,600 124 HNI Corp. 3,600 124 Comstock Resources Inc. 7,200 123 Federated Investors Inc. Class B 4,579 123 * Credit Acceptance Corp. 883 123 Encore Wire Corp. 2,400 123 CIRCOR International Inc. 1,700 122 * Forest City Enterprises Inc. Class A 6,727 122 Shenandoah Telecommunications Co. 4,875 122 * II-VI Inc. 8,000 122 PDL BioPharma Inc. 13,400 122 * Rush Enterprises Inc. Class A 4,400 122 * Quicksilver Resources Inc. 38,900 121 * Coherent Inc. 1,800 120 Crosstex Energy Inc. 3,200 120 Rent-A-Center Inc. 4,800 120 Fair Isaac Corp. 2,200 120 United States Cellular Corp. 2,700 120 ManTech International Corp. Class A 4,100 119 * ATMI Inc. 4,300 119 * Take-Two Interactive Software Inc. 6,200 119 * Integra LifeSciences Holdings Corp. 2,557 119 Interactive Brokers Group Inc. 5,600 119 * Bio-Reference Labs Inc. 4,400 118 * ArthroCare Corp. 2,600 118 * SYNNEX Corp. 2,100 118 * Fusion-io Inc. 10,700 118 John Bean Technologies Corp. 3,800 117 * Plexus Corp. 3,000 117 CYS Investments Inc. 14,800 117 Regis Corp. 9,500 117 Globe Specialty Metals Inc. 6,700 117 Mercury General Corp. 2,555 117 * KCG Holdings Inc. Class A 10,584 117 * RBC Bearings Inc. 1,800 117 Jones Group Inc. 7,900 117 Old National Bancorp 8,300 116 * Sears Holdings Corp. 3,194 116 Pinnacle Foods Inc. 4,300 116 * OSI Systems Inc. 2,000 116 Independent Bank Corp. 3,200 116 * Wright Medical Group Inc. 3,800 116 Aircastle Ltd. 6,100 115 * Dorman Products Inc. 2,200 115 * Newpark Resources Inc. 10,100 115 * Monolithic Power Systems Inc. 3,500 114 Pinnacle Financial Partners Inc. 3,500 114 Stepan Co. 1,800 114 Heartland Express Inc. 5,400 114 * Universal Display Corp. 3,500 114 FNB Corp. 9,600 114 * Strategic Hotels & Resorts Inc. 12,200 114 * ANN Inc. 3,500 113
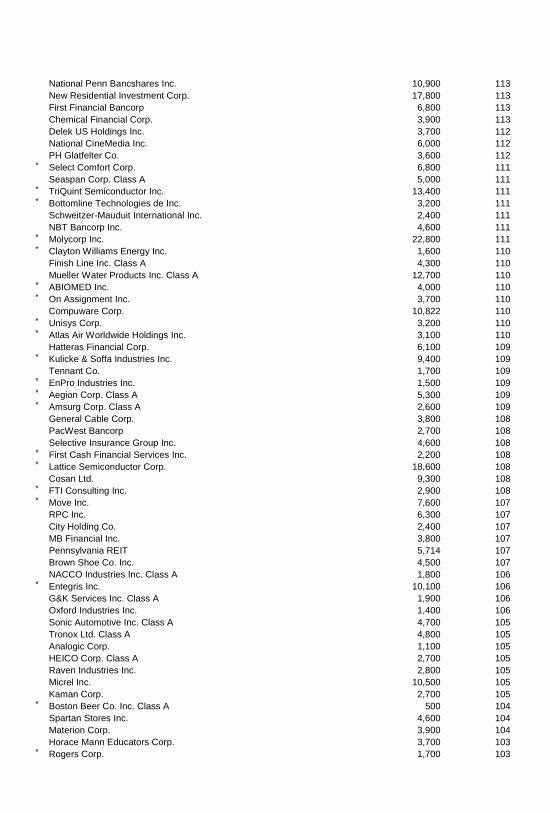
National Penn Bancshares Inc. 10,900 113 New Residential Investment Corp. 17,800 113 First Financial Bancorp 6,800 113 Chemical Financial Corp. 3,900 113 Delek US Holdings Inc. 3,700 112 National CineMedia Inc. 6,000 112 PH Glatfelter Co. 3,600 112 * Select Comfort Corp. 6,800 111 Seaspan Corp. Class A 5,000 111 * TriQuint Semiconductor Inc. 13,400 111 * Bottomline Technologies de Inc. 3,200 111 Schweitzer-Mauduit International Inc. 2,400 111 NBT Bancorp Inc. 4,600 111 * Molycorp Inc. 22,800 111 * Clayton Williams Energy Inc. 1,600 110 Finish Line Inc. Class A 4,300 110 Mueller Water Products Inc. Class A 12,700 110 * ABIOMED Inc. 4,000 110 * On Assignment Inc. 3,700 110 Compuware Corp. 10,822 110 * Unisys Corp. 3,200 110 * Atlas Air Worldwide Holdings Inc. 3,100 110 Hatteras Financial Corp. 6,100 109 * Kulicke & Soffa Industries Inc. 9,400 109 Tennant Co. 1,700 109 * EnPro Industries Inc. 1,500 109 * Aegion Corp. Class A 5,300 109 * Amsurg Corp. Class A 2,600 109 General Cable Corp. 3,800 108 PacWest Bancorp 2,700 108 Selective Insurance Group Inc. 4,600 108 * First Cash Financial Services Inc. 2,200 108 * Lattice Semiconductor Corp. 18,600 108 Cosan Ltd. 9,300 108 * FTI Consulting Inc. 2,900 108 * Move Inc. 7,600 107 RPC Inc. 6,300 107 City Holding Co. 2,400 107 MB Financial Inc. 3,800 107 Pennsylvania REIT 5,714 107 Brown Shoe Co. Inc. 4,500 107 NACCO Industries Inc. Class A 1,800 106 * Entegris Inc. 10,100 106 G&K Services Inc. Class A 1,900 106 Oxford Industries Inc. 1,400 106 Sonic Automotive Inc. Class A 4,700 105 Tronox Ltd. Class A 4,800 105 Analogic Corp. 1,100 105 HEICO Corp. Class A 2,700 105 Raven Industries Inc. 2,800 105 Micrel Inc. 10,500 105 Kaman Corp. 2,700 105 * Boston Beer Co. Inc. Class A 500 104 Spartan Stores Inc. 4,600 104 Materion Corp. 3,900 104 Horace Mann Educators Corp. 3,700 103 * Rogers Corp. 1,700 103
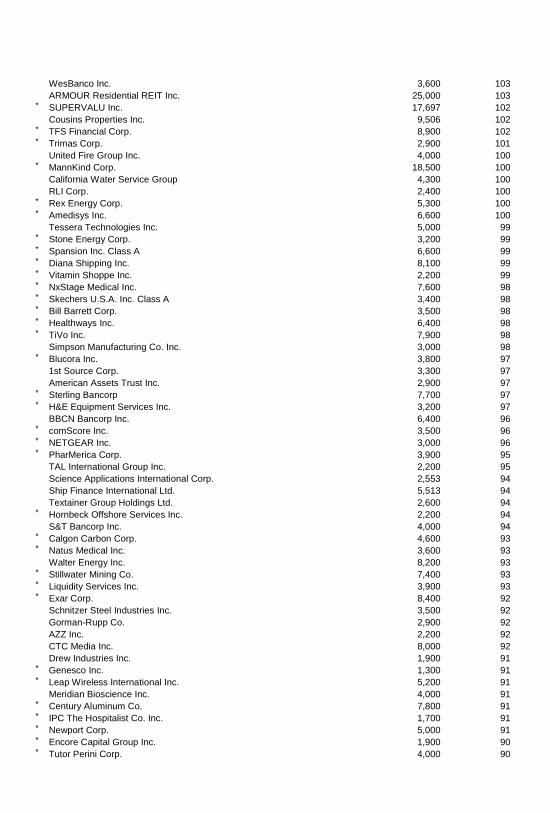
WesBanco Inc. 3,600 103 ARMOUR Residential REIT Inc. 25,000 103 * SUPERVALU Inc. 17,697 102 Cousins Properties Inc. 9,506 102 * TFS Financial Corp. 8,900 102 * Trimas Corp. 2,900 101 United Fire Group Inc. 4,000 100 * MannKind Corp. 18,500 100 California Water Service Group 4,300 100 RLI Corp. 2,400 100 * Rex Energy Corp. 5,300 100 * Amedisys Inc. 6,600 100 Tessera Technologies Inc. 5,000 99 * Stone Energy Corp. 3,200 99 * Spansion Inc. Class A 6,600 99 * Diana Shipping Inc. 8,100 99 * Vitamin Shoppe Inc. 2,200 99 * NxStage Medical Inc. 7,600 98 * Skechers U.S.A. Inc. Class A 3,400 98 * Bill Barrett Corp. 3,500 98 * Healthways Inc. 6,400 98 * TiVo Inc. 7,900 98 Simpson Manufacturing Co. Inc. 3,000 98 * Blucora Inc. 3,800 97 1st Source Corp. 3,300 97 American Assets Trust Inc. 2,900 97 * Sterling Bancorp 7,700 97 * H&E Equipment Services Inc. 3,200 97 BBCN Bancorp Inc. 6,400 96 * comScore Inc. 3,500 96 * NETGEAR Inc. 3,000 96 * PharMerica Corp. 3,900 95 TAL International Group Inc. 2,200 95 Science Applications International Corp. 2,553 94 Ship Finance International Ltd. 5,513 94 Textainer Group Holdings Ltd. 2,600 94 * Hornbeck Offshore Services Inc. 2,200 94 S&T Bancorp Inc. 4,000 94 * Calgon Carbon Corp. 4,600 93 * Natus Medical Inc. 3,600 93 Walter Energy Inc. 8,200 93 * Stillwater Mining Co. 7,400 93 * Liquidity Services Inc. 3,900 93 * Exar Corp. 8,400 92 Schnitzer Steel Industries Inc. 3,500 92 Gorman-Rupp Co. 2,900 92 AZZ Inc. 2,200 92 CTC Media Inc. 8,000 92 Drew Industries Inc. 1,900 91 * Genesco Inc. 1,300 91 * Leap Wireless International Inc. 5,200 91 Meridian Bioscience Inc. 4,000 91 * Century Aluminum Co. 7,800 91 * IPC The Hospitalist Co. Inc. 1,700 91 * Newport Corp. 5,000 91 * Encore Capital Group Inc. 1,900 90 * Tutor Perini Corp. 4,000 90

* Perficient Inc. 4,400 90 * Accretive Health Inc. 9,800 90 * Advanced Energy Industries Inc. 3,300 90 * Taser International Inc. 5,600 90 * HeartWare International Inc. 900 89 * Beneficial Mutual Bancorp Inc. 7,500 89 * Amkor Technology Inc. 16,800 89 American Science & Engineering Inc. 1,300 89 Matson Inc. 3,700 89 * GenCorp Inc. 5,200 89 * MedAssets Inc. 4,000 88 Gulf Island Fabrication Inc. 4,351 88 * Contango Oil & Gas Co. 2,100 88 * FARO Technologies Inc. 1,700 88 CSG Systems International Inc. 2,900 87 * TETRA Technologies Inc. 8,400 87 United Bankshares Inc. 2,900 87 Oritani Financial Corp. 5,500 87 * Insight Enterprises Inc. 4,100 87 Pegasystems Inc. 1,900 86 * Norwegian Cruise Line Holdings Ltd. 2,461 86 * Goodrich Petroleum Corp. 5,000 86 US Ecology Inc. 2,400 86 * Tejon Ranch Co. 2,500 85 American States Water Co. 3,000 85 Gulfmark Offshore Inc. 2,000 85 Sterling Financial Corp. 2,700 85 * Netscout Systems Inc. 2,400 85 Cash America International Inc. 2,300 84 * Marriott Vacations Worldwide Corp. 1,763 84 Navios Maritime Holdings Inc. 8,900 84 * Children's Place Retail Stores Inc. 1,600 84 Buckle Inc. 1,900 84 * Winnebago Industries Inc. 3,500 84 Deltic Timber Corp. 1,300 84 Employers Holdings Inc. 3,400 84 * Walter Investment Management Corp. 2,700 83 * Bankrate Inc. 5,000 83 FelCor Lodging Trust Inc. 10,000 82 * AMAG Pharmaceuticals Inc. 3,800 82 DuPont Fabros Technology Inc. 3,100 81 ESCO Technologies Inc. 2,300 80 PennyMac Mortgage Investment Trust 3,400 80 * Geospace Technologies Corp. 1,000 80 Innophos Holdings Inc. 1,700 79 * Boyd Gaming Corp. 7,500 79 Government Properties Income Trust 3,200 79 * Rambus Inc. 8,800 78 * Approach Resources Inc. 3,900 78 Sabra Health Care REIT Inc. 2,700 78 * Intrepid Potash Inc. 5,300 78 Infinity Property & Casualty Corp. 1,100 78 * Federal Signal Corp. 6,300 78 Frank's International NV 3,300 77 * Cabot Microelectronics Corp. 1,900 77 Lindsay Corp. 900 77 * Diamond Foods Inc. 2,900 76
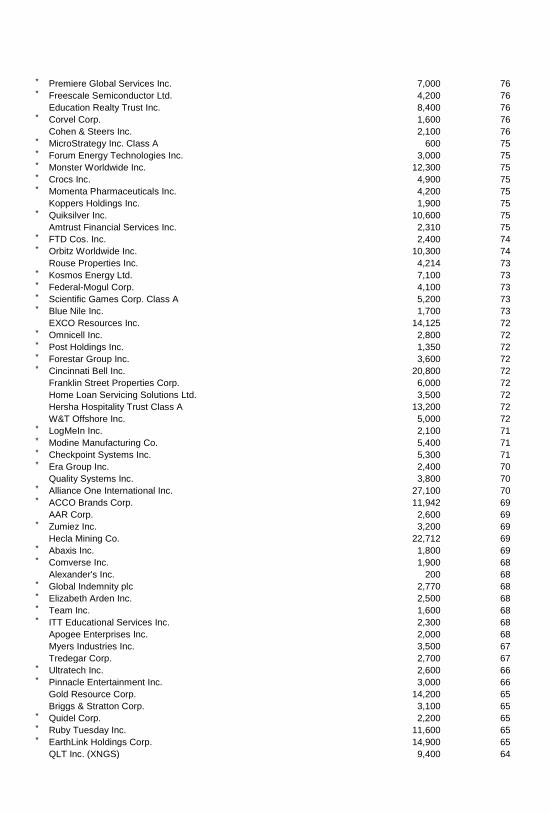
* Premiere Global Services Inc. 7,000 76 * Freescale Semiconductor Ltd. 4,200 76 Education Realty Trust Inc. 8,400 76 * Corvel Corp. 1,600 76 Cohen & Steers Inc. 2,100 76 * MicroStrategy Inc. Class A 600 75 * Forum Energy Technologies Inc. 3,000 75 * Monster Worldwide Inc. 12,300 75 * Crocs Inc. 4,900 75 * Momenta Pharmaceuticals Inc. 4,200 75 Koppers Holdings Inc. 1,900 75 * Quiksilver Inc. 10,600 75 Amtrust Financial Services Inc. 2,310 75 * FTD Cos. Inc. 2,400 74 * Orbitz Worldwide Inc. 10,300 74 Rouse Properties Inc. 4,214 73 * Kosmos Energy Ltd. 7,100 73 * Federal-Mogul Corp. 4,100 73 * Scientific Games Corp. Class A 5,200 73 * Blue Nile Inc. 1,700 73 EXCO Resources Inc. 14,125 72 * Omnicell Inc. 2,800 72 * Post Holdings Inc. 1,350 72 * Forestar Group Inc. 3,600 72 * Cincinnati Bell Inc. 20,800 72 Franklin Street Properties Corp. 6,000 72 Home Loan Servicing Solutions Ltd. 3,500 72 Hersha Hospitality Trust Class A 13,200 72 W&T Offshore Inc. 5,000 72 * LogMeIn Inc. 2,100 71 * Modine Manufacturing Co. 5,400 71 * Checkpoint Systems Inc. 5,300 71 * Era Group Inc. 2,400 70 Quality Systems Inc. 3,800 70 * Alliance One International Inc. 27,100 70 * ACCO Brands Corp. 11,942 69 AAR Corp. 2,600 69 * Zumiez Inc. 3,200 69 Hecla Mining Co. 22,712 69 * Abaxis Inc. 1,800 69 * Comverse Inc. 1,900 68 Alexander's Inc. 200 68 * Global Indemnity plc 2,770 68 * Elizabeth Arden Inc. 2,500 68 * Team Inc. 1,600 68 * ITT Educational Services Inc. 2,300 68 Apogee Enterprises Inc. 2,000 68 Myers Industries Inc. 3,500 67 Tredegar Corp. 2,700 67 * Ultratech Inc. 2,600 66 * Pinnacle Entertainment Inc. 3,000 66 Gold Resource Corp. 14,200 65 Briggs & Stratton Corp. 3,100 65 * Quidel Corp. 2,200 65 * Ruby Tuesday Inc. 11,600 65 * EarthLink Holdings Corp. 14,900 65 QLT Inc. (XNGS) 9,400 64
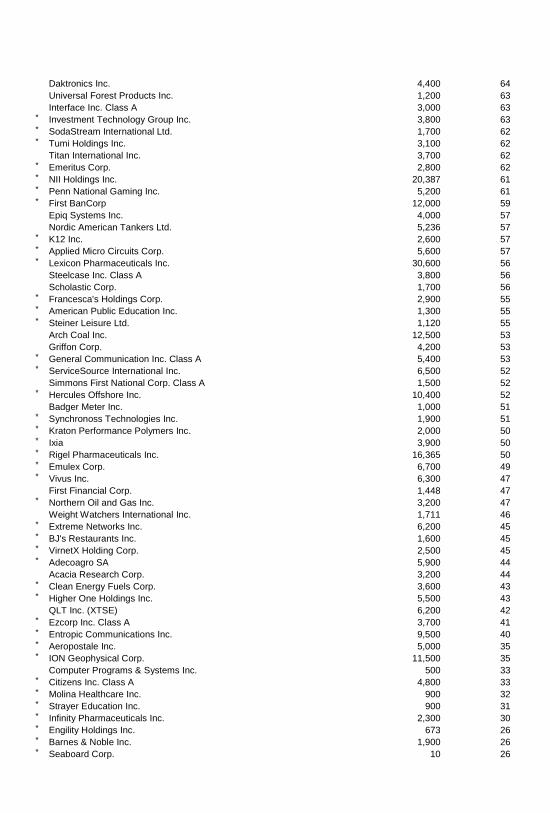
Daktronics Inc. 4,400 64 Universal Forest Products Inc. 1,200 63 Interface Inc. Class A 3,000 63 * Investment Technology Group Inc. 3,800 63 * SodaStream International Ltd. 1,700 62 * Tumi Holdings Inc. 3,100 62 Titan International Inc. 3,700 62 * Emeritus Corp. 2,800 62 * NII Holdings Inc. 20,387 61 * Penn National Gaming Inc. 5,200 61 * First BanCorp 12,000 59 Epiq Systems Inc. 4,000 57 Nordic American Tankers Ltd. 5,236 57 * K12 Inc. 2,600 57 * Applied Micro Circuits Corp. 5,600 57 * Lexicon Pharmaceuticals Inc. 30,600 56 Steelcase Inc. Class A 3,800 56 Scholastic Corp. 1,700 56 * Francesca's Holdings Corp. 2,900 55 * American Public Education Inc. 1,300 55 * Steiner Leisure Ltd. 1,120 55 Arch Coal Inc. 12,500 53 Griffon Corp. 4,200 53 * General Communication Inc. Class A 5,400 53 * ServiceSource International Inc. 6,500 52 Simmons First National Corp. Class A 1,500 52 * Hercules Offshore Inc. 10,400 52 Badger Meter Inc. 1,000 51 * Synchronoss Technologies Inc. 1,900 51 * Kraton Performance Polymers Inc. 2,000 50 * Ixia 3,900 50 * Rigel Pharmaceuticals Inc. 16,365 50 * Emulex Corp. 6,700 49 * Vivus Inc. 6,300 47 First Financial Corp. 1,448 47 * Northern Oil and Gas Inc. 3,200 47 Weight Watchers International Inc. 1,711 46 * Extreme Networks Inc. 6,200 45 * BJ's Restaurants Inc. 1,600 45 * VirnetX Holding Corp. 2,500 45 * Adecoagro SA 5,900 44 Acacia Research Corp. 3,200 44 * Clean Energy Fuels Corp. 3,600 43 * Higher One Holdings Inc. 5,500 43 QLT Inc. (XTSE) 6,200 42 * Ezcorp Inc. Class A 3,700 41 * Entropic Communications Inc. 9,500 40 * Aeropostale Inc. 5,000 35 * ION Geophysical Corp. 11,500 35 Computer Programs & Systems Inc. 500 33 * Citizens Inc. Class A 4,800 33 * Molina Healthcare Inc. 900 32 * Strayer Education Inc. 900 31 * Infinity Pharmaceuticals Inc. 2,300 30 * Engility Holdings Inc. 673 26 * Barnes & Noble Inc. 1,900 26 * Seaboard Corp. 10 26
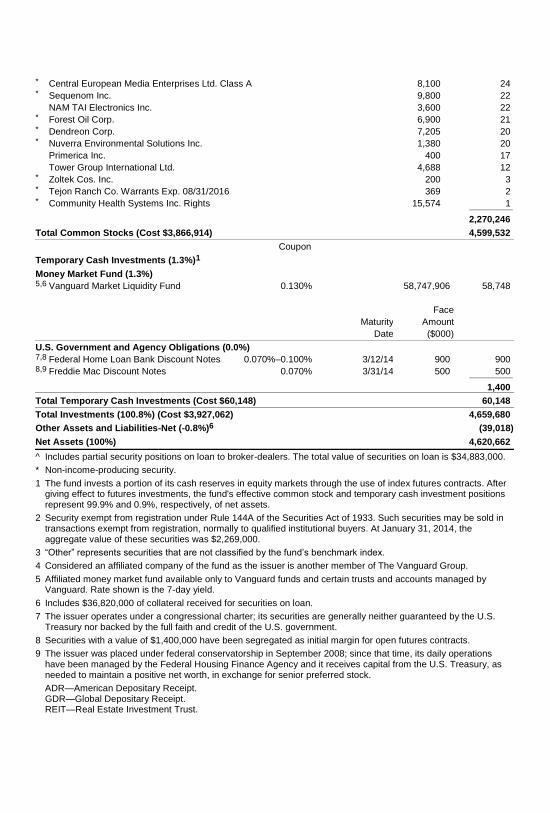
* Central European Media Enterprises Ltd. Class A 8,100 24 * Sequenom Inc. 9,800 22 NAM TAI Electronics Inc. 3,600 22 * Forest Oil Corp. 6,900 21 * Dendreon Corp. 7,205 20 * Nuverra Environmental Solutions Inc. 1,380 20 Primerica Inc. 400 17 Tower Group International Ltd. 4,688 12 * Zoltek Cos. Inc. 200 3 * Tejon Ranch Co. Warrants Exp. 08/31/2016 369 2 * Community Health Systems Inc. Rights 15,574 1 _____________
2,270,246
Total Common Stocks (Cost $3,866,914) 4,599,532
Coupon
Temporary Cash Investments (1.3%)1
Money Market Fund (1.3%) 5,6 Vanguard Market Liquidity Fund 0.130% 58,747,906 58,748
Maturity
Date
Face
Amount
($000)
U.S. Government and Agency Obligations (0.0%)
7,8 Federal Home Loan Bank Discount Notes 0.070%–0.100% 3/12/14 900 900 8,9 Freddie Mac Discount Notes 0.070% 3/31/14 500 500 _____________
1,400
Total Temporary Cash Investments (Cost $60,148) 60,148
Total Investments (100.8%) (Cost $3,927,062) 4,659,680
Other Assets and Liabilities-Net (-0.8%)6 (39,018)
Net Assets (100%) 4,620,662
^ Includes partial security positions on loan to broker-dealers. The total value of securities on loan is $34,883,000.
* Non-income-producing security.
1 The fund invests a portion of its cash reserves in equity markets through the use of index futures contracts. After giving effect to futures investments, the fund's effective common stock and temporary cash investment positions represent 99.9% and 0.9%, respectively, of net assets.
2 Security exempt from registration under Rule 144A of the Securities Act of 1933. Such securities may be sold in transactions exempt from registration, normally to qualified institutional buyers. At January 31, 2014, the aggregate value of these securities was $2,269,000.
3 “Other” represents securities that are not classified by the fund’s benchmark index.
4 Considered an affiliated company of the fund as the issuer is another member of The Vanguard Group.
5 Affiliated money market fund available only to Vanguard funds and certain trusts and accounts managed by Vanguard. Rate shown is the 7-day yield.
6 Includes $36,820,000 of collateral received for securities on loan.
7 The issuer operates under a congressional charter; its securities are generally neither guaranteed by the U.S. Treasury nor backed by the full faith and credit of the U.S. government.
8 Securities with a value of $1,400,000 have been segregated as initial margin for open futures contracts.
9 The issuer was placed under federal conservatorship in September 2008; since that time, its daily operations have been managed by the Federal Housing Finance Agency and it receives capital from the U.S. Treasury, as needed to maintain a positive net worth, in exchange for senior preferred stock.
ADR—American Depositary Receipt. GDR—Global Depositary Receipt. REIT—Real Estate Investment Trust.
Total World Stock Index Fund
A. Security Valuation: Securities are valued as of the close of trading on the New York Stock
Exchange (generally 4 p.m., Eastern time) on the valuation date. Equity securities are valued at the
latest quoted sales prices or official closing prices taken from the primary market in which each
security trades; such securities not traded on the valuation date are valued at the mean of the latest
quoted bid and asked prices. Securities for which market quotations are not readily available, or
whose values have been affected by events occurring before the fund's pricing time but after the
close of the securities’ primary markets, are valued at their fair values calculated according to
procedures adopted by the board of trustees. These procedures include obtaining quotations from an
independent pricing service, monitoring news to identify significant market- or security-specific events,
and evaluating changes in the values of foreign market proxies (for example, ADRs, futures contracts,
or exchange-traded funds), between the time the foreign markets close and the fund's pricing time.
When fair-value pricing is employed, the prices of securities used by a fund to calculate its net asset
value may differ from quoted or published prices for the same securities. Investments in Vanguard
Market Liquidity Fund are valued at that fund’s net asset value. Temporary cash investments acquired
over 60 days to maturity are valued using the latest bid prices or using valuations based on a matrix
system (which considers such factors as security prices, yields, maturities, and ratings), both as
furnished by independent pricing services. Other temporary cash investments are valued at amortized
cost, which approximates market value.
B. Foreign Currency: Securities and other assets and liabilities denominated in foreign currencies are
translated into U.S. dollars using exchange rates obtained from an independent third party as of the
fund's pricing time on the valuation date. Realized gains (losses) and unrealized appreciation
(depreciation) on investment securities include the effects of changes in exchange rates since the
securities were purchased, combined with the effects of changes in security prices. Fluctuations in the
value of other assets and liabilities resulting from changes in exchange rates are recorded as
unrealized foreign currency gains (losses) until the assets or liabilities are settled in cash, at which
time they are recorded as realized foreign currency gains (losses).
C. Various inputs may be used to determine the value of the fund's investments. These inputs are
summarized in three broad levels for financial statement purposes. The inputs or methodologies used
to value securities are not necessarily an indication of the risk associated with investing in those
securities.
Level 1—Quoted prices in active markets for identical securities.
Level 2—Other significant observable inputs (including quoted prices for similar securities, interest
rates, prepayment speeds, credit risk, etc.).
Level 3—Significant unobservable inputs (including the fund's own assumptions used to determine
the fair value of investments).
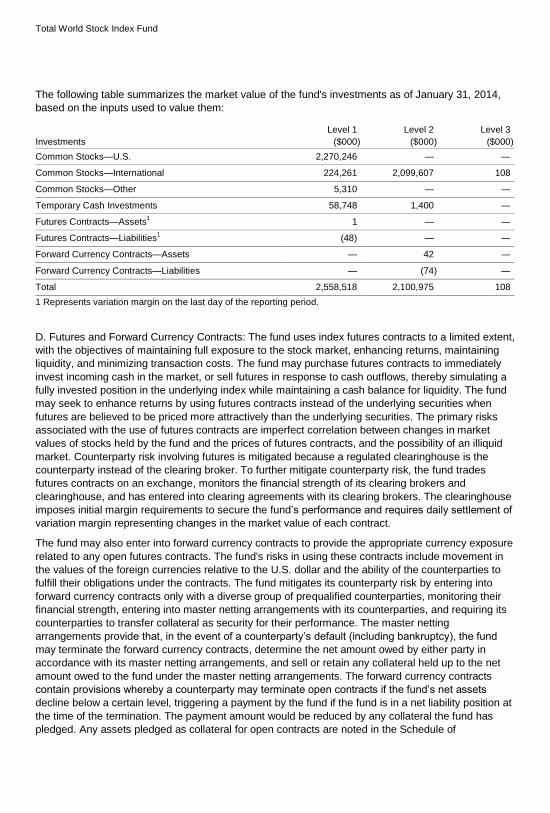
Total World Stock Index Fund
The following table summarizes the market value of the fund's investments as of January 31, 2014,
based on the inputs used to value them:
Investments
Level 1
($000 )
Level 2
($000 )
Level 3
($000 )
Common Stocks—U.S. 2,270,246 — —
Common Stocks—International 224,261 2,099,607 108
Common Stocks—Other 5,310 — —
Temporary Cash Investments 58,748 1,400 —
Futures Contracts—Assets1 1 — —
Futures Contracts—Liabilities1 (48) — —
Forward Currency Contracts—Assets — 42 —
Forward Currency Contracts—Liabilities — (74 ) —
Total 2,558,518 2,100,975 108
1 Represents variation margin on the last day of the reporting period.
D. Futures and Forward Currency Contracts: The fund uses index futures contracts to a limited extent,
with the objectives of maintaining full exposure to the stock market, enhancing returns, maintaining
liquidity, and minimizing transaction costs. The fund may purchase futures contracts to immediately
invest incoming cash in the market, or sell futures in response to cash outflows, thereby simulating a
fully invested position in the underlying index while maintaining a cash balance for liquidity. The fund
may seek to enhance returns by using futures contracts instead of the underlying securities when
futures are believed to be priced more attractively than the underlying securities. The primary risks
associated with the use of futures contracts are imperfect correlation between changes in market
values of stocks held by the fund and the prices of futures contracts, and the possibility of an illiquid
market. Counterparty risk involving futures is mitigated because a regulated clearinghouse is the
counterparty instead of the clearing broker. To further mitigate counterparty risk, the fund trades
futures contracts on an exchange, monitors the financial strength of its clearing brokers and
clearinghouse, and has entered into clearing agreements with its clearing brokers. The clearinghouse
imposes initial margin requirements to secure the fund’s performance and requires daily settlement of
variation margin representing changes in the market value of each contract.
The fund may also enter into forward currency contracts to provide the appropriate currency exposure
related to any open futures contracts. The fund's risks in using these contracts include movement in
the values of the foreign currencies relative to the U.S. dollar and the ability of the counterparties to
fulfill their obligations under the contracts. The fund mitigates its counterparty risk by entering into
forward currency contracts only with a diverse group of prequalified counterparties, monitoring their
financial strength, entering into master netting arrangements with its counterparties, and requiring its
counterparties to transfer collateral as security for their performance. The master netting
arrangements provide that, in the event of a counterparty’s default (including bankruptcy), the fund
may terminate the forward currency contracts, determine the net amount owed by either party in
accordance with its master netting arrangements, and sell or retain any collateral held up to the net
amount owed to the fund under the master netting arrangements. The forward currency contracts
contain provisions whereby a counterparty may terminate open contracts if the fund’s net assets
decline below a certain level, triggering a payment by the fund if the fund is in a net liability position at
the time of the termination. The payment amount would be reduced by any collateral the fund has
pledged. Any assets pledged as collateral for open contracts are noted in the Schedule of

Total World Stock Index Fund
Investments. The value of collateral received or pledged is compared daily to the value of the forward
currency contracts exposure with each counterparty, and any difference, if in excess of a specified
minimum transfer amount, is adjusted and settled within two business days.
Futures contracts are valued at their quoted daily settlement prices. Forward currency contracts are
valued at their quoted daily prices obtained from an independent third party, adjusted for currency risk
based on the expiration date of each contract. The aggregate notional amounts of the contracts are
not recorded in the Schedule of Investments. Fluctuations in the value of the contracts are recorded in
the Schedule of Investments as an asset (liability).
At January 31, 2014, the aggregate settlement value of open futures contracts and the related
unrealized appreciation (depreciation) were:
($000 )
Futures Contracts Expiration
Number of
Long (Short
Contracts
)
Aggregate
Settlement
Value Long
(Short)
Unrealized
Appreciation
(Depreciation )
E-mini S&P 500 Index March 2014 56 4,974 (143 )
S&P 500 Index March 2014 10 4,442 16
Dow Jones EURO STOXX 50 Index March 2014 62 2,523 8
FTSE 100 Index March 2014 21 2,229 (32 )
E-mini S&P Mid-Cap 400 Index March 2014 17 2,228 3
Topix Index March 2014 15 1,787 (80 )
S&P ASX 200 Index March 2014 8 897 (9 )
(237 )
Unrealized appreciation (depreciation) on open E-mini S&P 500 Index, S&P 500 Index, Dow Jones
EURO STOXX 50 Index, FTSE 100 Index, and E-mini S&P Mid-Cap 400 Index futures contracts is
required to be treated as realized gain (loss) for tax purposes.
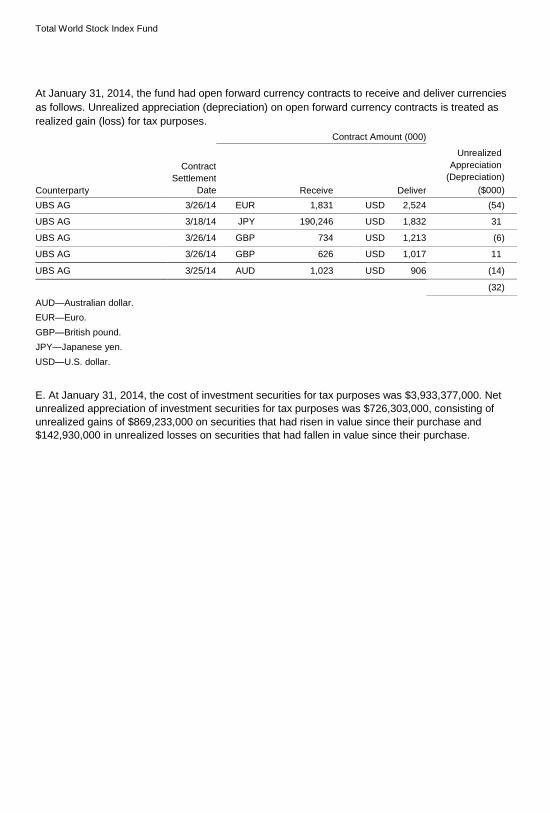
Total World Stock Index Fund
At January 31, 2014, the fund had open forward currency contracts to receive and deliver currencies
as follows. Unrealized appreciation (depreciation) on open forward currency contracts is treated as
realized gain (loss) for tax purposes. Contract Amount (000)
Counterparty
Contract
Settlement
Date Receive Deliver
Unrealized
Appreciation
(Depreciation
($000
)
)
UBS AG 3/26/14 EUR 1,831 USD 2,524 (54 )
UBS AG 3/18/14 JPY 190,246 USD 1,832 31
UBS AG 3/26/14 GBP 734 USD 1,213 (6 )
UBS AG 3/26/14 GBP 626 USD 1,017 11
UBS AG 3/25/14 AUD 1,023 USD 906 (14 )
(32 )
AUD—Australian dollar.
EUR—Euro.
GBP—British pound.
JPY—Japanese yen.
USD—U.S. dollar.
E. At January 31, 2014, the cost of investment securities for tax purposes was $3,933,377,000. Net
unrealized appreciation of investment securities for tax purposes was $726,303,000, consisting of
unrealized gains of $869,233,000 on securities that had risen in value since their purchase and
$142,930,000 in unrealized losses on securities that had fallen in value since their purchase.
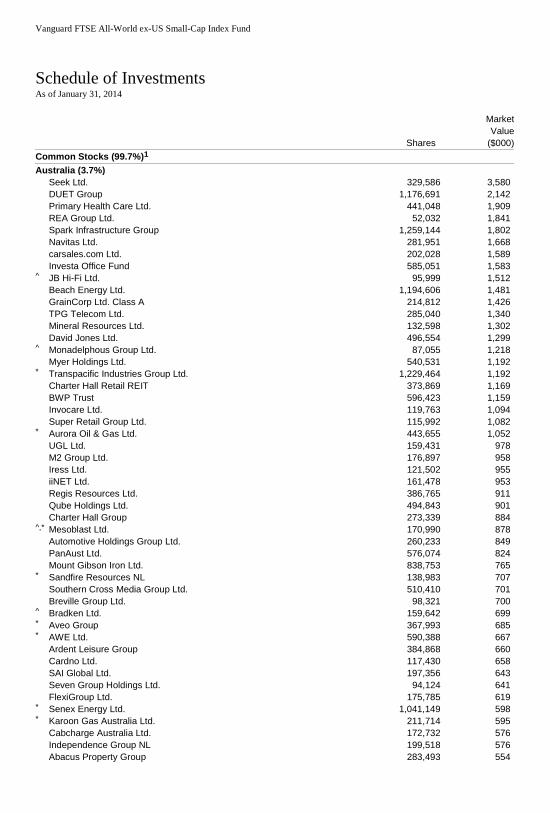
Vanguard FTSE All-World ex-US Small-Cap Index Fund
Schedule of Investments As of January 31, 2014
Shares
Market
Value
($000)
Common Stocks (99.7%)1
Australia (3.7%)
Seek Ltd. 329,586 3,580 DUET Group 1,176,691 2,142 Primary Health Care Ltd. 441,048 1,909 REA Group Ltd. 52,032 1,841 Spark Infrastructure Group 1,259,144 1,802 Navitas Ltd. 281,951 1,668 carsales.com Ltd. 202,028 1,589 Investa Office Fund 585,051 1,583 ^ JB Hi-Fi Ltd. 95,999 1,512 Beach Energy Ltd. 1,194,606 1,481 GrainCorp Ltd. Class A 214,812 1,426 TPG Telecom Ltd. 285,040 1,340 Mineral Resources Ltd. 132,598 1,302 David Jones Ltd. 496,554 1,299 ^ Monadelphous Group Ltd. 87,055 1,218 Myer Holdings Ltd. 540,531 1,192 * Transpacific Industries Group Ltd. 1,229,464 1,192 Charter Hall Retail REIT 373,869 1,169 BWP Trust 596,423 1,159 Invocare Ltd. 119,763 1,094 Super Retail Group Ltd. 115,992 1,082 * Aurora Oil & Gas Ltd. 443,655 1,052 UGL Ltd. 159,431 978 M2 Group Ltd. 176,897 958 Iress Ltd. 121,502 955 iiNET Ltd. 161,478 953 Regis Resources Ltd. 386,765 911 Qube Holdings Ltd. 494,843 901 Charter Hall Group 273,339 884 ^,* Mesoblast Ltd. 170,990 878 Automotive Holdings Group Ltd. 260,233 849 PanAust Ltd. 576,074 824 Mount Gibson Iron Ltd. 838,753 765 * Sandfire Resources NL 138,983 707 Southern Cross Media Group Ltd. 510,410 701 Breville Group Ltd. 98,321 700 ^ Bradken Ltd. 159,642 699 * Aveo Group 367,993 685 * AWE Ltd. 590,388 667 Ardent Leisure Group 384,868 660 Cardno Ltd. 117,430 658 SAI Global Ltd. 197,356 643 Seven Group Holdings Ltd. 94,124 641 FlexiGroup Ltd. 175,785 619 * Senex Energy Ltd. 1,041,149 598 * Karoon Gas Australia Ltd. 211,714 595 Cabcharge Australia Ltd. 172,732 576 Independence Group NL 199,518 576 Abacus Property Group 283,493 554
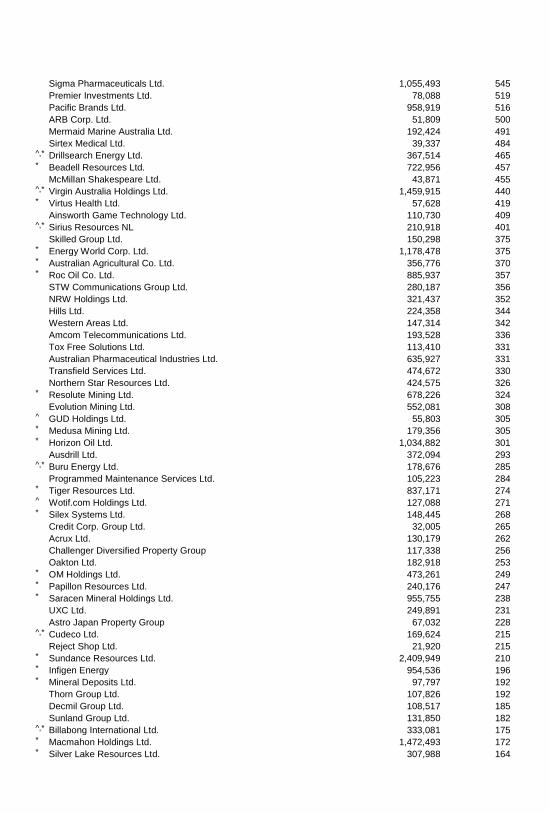
Sigma Pharmaceuticals Ltd. 1,055,493 545 Premier Investments Ltd. 78,088 519 Pacific Brands Ltd. 958,919 516 ARB Corp. Ltd. 51,809 500 Mermaid Marine Australia Ltd. 192,424 491 Sirtex Medical Ltd. 39,337 484 ^,* Drillsearch Energy Ltd. 367,514 465 * Beadell Resources Ltd. 722,956 457 McMillan Shakespeare Ltd. 43,871 455 ^,* Virgin Australia Holdings Ltd. 1,459,915 440 * Virtus Health Ltd. 57,628 419 Ainsworth Game Technology Ltd. 110,730 409 ^,* Sirius Resources NL 210,918 401 Skilled Group Ltd. 150,298 375 * Energy World Corp. Ltd. 1,178,478 375 * Australian Agricultural Co. Ltd. 356,776 370 * Roc Oil Co. Ltd. 885,937 357 STW Communications Group Ltd. 280,187 356 NRW Holdings Ltd. 321,437 352 Hills Ltd. 224,358 344 Western Areas Ltd. 147,314 342 Amcom Telecommunications Ltd. 193,528 336 Tox Free Solutions Ltd. 113,410 331 Australian Pharmaceutical Industries Ltd. 635,927 331 Transfield Services Ltd. 474,672 330 Northern Star Resources Ltd. 424,575 326 * Resolute Mining Ltd. 678,226 324 Evolution Mining Ltd. 552,081 308 ^ GUD Holdings Ltd. 55,803 305 * Medusa Mining Ltd. 179,356 305 * Horizon Oil Ltd. 1,034,882 301 Ausdrill Ltd. 372,094 293 ^,* Buru Energy Ltd. 178,676 285 Programmed Maintenance Services Ltd. 105,223 284 * Tiger Resources Ltd. 837,171 274 ^ Wotif.com Holdings Ltd. 127,088 271 * Silex Systems Ltd. 148,445 268 Credit Corp. Group Ltd. 32,005 265 Acrux Ltd. 130,179 262 Challenger Diversified Property Group 117,338 256 Oakton Ltd. 182,918 253 * OM Holdings Ltd. 473,261 249 * Papillon Resources Ltd. 240,176 247 * Saracen Mineral Holdings Ltd. 955,755 238 UXC Ltd. 249,891 231 Astro Japan Property Group 67,032 228 ^,* Cudeco Ltd. 169,624 215 Reject Shop Ltd. 21,920 215 * Sundance Resources Ltd. 2,409,949 210 * Infigen Energy 954,536 196 * Mineral Deposits Ltd. 97,797 192 Thorn Group Ltd. 107,826 192 Decmil Group Ltd. 108,517 185 Sunland Group Ltd. 131,850 182 ^,* Billabong International Ltd. 333,081 175 * Macmahon Holdings Ltd. 1,472,493 172 * Silver Lake Resources Ltd. 307,988 164
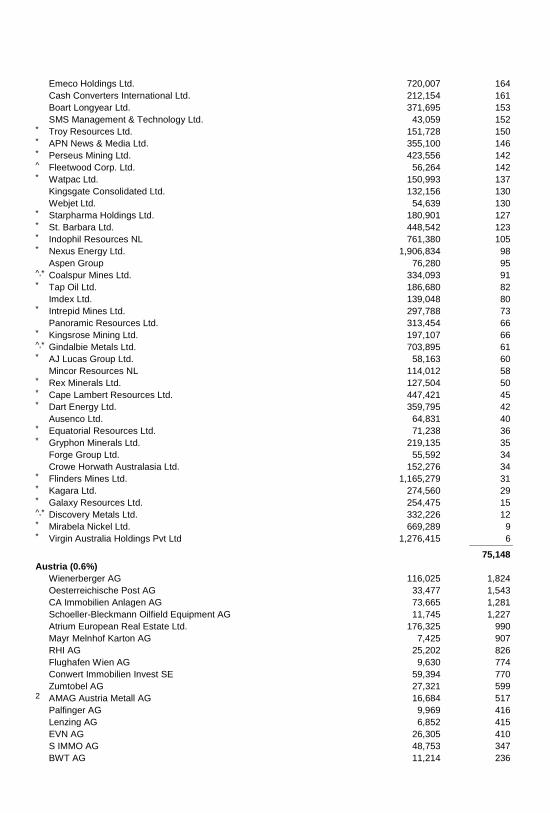
Emeco Holdings Ltd. 720,007 164 Cash Converters International Ltd. 212,154 161 Boart Longyear Ltd. 371,695 153 SMS Management & Technology Ltd. 43,059 152 * Troy Resources Ltd. 151,728 150 * APN News & Media Ltd. 355,100 146 * Perseus Mining Ltd. 423,556 142 ^ Fleetwood Corp. Ltd. 56,264 142 * Watpac Ltd. 150,993 137 Kingsgate Consolidated Ltd. 132,156 130 Webjet Ltd. 54,639 130 * Starpharma Holdings Ltd. 180,901 127 * St. Barbara Ltd. 448,542 123 * Indophil Resources NL 761,380 105 * Nexus Energy Ltd. 1,906,834 98 Aspen Group 76,280 95 ^,* Coalspur Mines Ltd. 334,093 91 * Tap Oil Ltd. 186,680 82 Imdex Ltd. 139,048 80 * Intrepid Mines Ltd. 297,788 73 Panoramic Resources Ltd. 313,454 66 * Kingsrose Mining Ltd. 197,107 66 ^,* Gindalbie Metals Ltd. 703,895 61 * AJ Lucas Group Ltd. 58,163 60 Mincor Resources NL 114,012 58 * Rex Minerals Ltd. 127,504 50 * Cape Lambert Resources Ltd. 447,421 45 * Dart Energy Ltd. 359,795 42 Ausenco Ltd. 64,831 40 * Equatorial Resources Ltd. 71,238 36 * Gryphon Minerals Ltd. 219,135 35 Forge Group Ltd. 55,592 34 Crowe Horwath Australasia Ltd. 152,276 34 * Flinders Mines Ltd. 1,165,279 31 * Kagara Ltd. 274,560 29 * Galaxy Resources Ltd. 254,475 15 ^,* Discovery Metals Ltd. 332,226 12 * Mirabela Nickel Ltd. 669,289 9 * Virgin Australia Holdings Pvt Ltd 1,276,415 6 _____________
75,148
Austria (0.6%)
Wienerberger AG 116,025 1,824 Oesterreichische Post AG 33,477 1,543 CA Immobilien Anlagen AG 73,665 1,281 Schoeller-Bleckmann Oilfield Equipment AG 11,745 1,227 Atrium European Real Estate Ltd. 176,325 990 Mayr Melnhof Karton AG 7,425 907 RHI AG 25,202 826 Flughafen Wien AG 9,630 774 Conwert Immobilien Invest SE 59,394 770 Zumtobel AG 27,321 599 2 AMAG Austria Metall AG 16,684 517 Palfinger AG 9,969 416 Lenzing AG 6,852 415 EVN AG 26,305 410 S IMMO AG 48,753 347 BWT AG 11,214 236
Kapsch TrafficCom AG 3,047 168 _____________
13,250
Belgium (1.2%)
Ackermans & van Haaren NV 23,965 2,592 Cofinimmo 16,855 1,961 Sofina SA 16,317 1,883 * bpost SA 96,190 1,874 D'ieteren SA/NV 25,577 1,226 NV Bekaert SA 34,953 1,205 Elia System Operator SA/NV 24,841 1,144 Befimmo SA 14,887 1,013 Gimv NV 17,881 889 Warehouses De Pauw SCA 11,485 819 Melexis NV 22,610 784 ^,* ThromboGenics NV 28,740 724 Cie Maritime Belge SA 22,428 640 Cie d'Entreprises CFE 7,251 634 ^ Nyrstar (Voting Shares) 164,073 629 * KBC Ancora 15,276 580 Sipef SA 7,464 577 Mobistar SA 29,366 555 Barco NV 7,256 550 Tessenderlo Chemie NV (Voting Shares) 19,920 519 EVS Broadcast Equipment SA 8,005 479 * AGFA-Gevaert NV 152,786 451 * Viohalco SA 82,549 418 * RHJ International 78,725 391 * Euronav NV 25,663 335 Van de Velde NV 6,050 303 Wereldhave Belgium NV 1,621 187 * Ion Beam Applications 13,429 135 Intervest Offices & Warehouses 4,222 112 _____________
23,609
Brazil (1.7%)
Kroton Educacional SA 177,200 2,698 Estacio Participacoes SA 231,800 1,800 Anhanguera Educacional Participacoes SA 332,708 1,750 * Qualicorp SA 204,100 1,728 Diagnosticos da America SA 236,920 1,456 Suzano Papel e Celulose SA Prior Pfd. Class A 297,052 1,170 Marcopolo SA Prior Pfd. 509,216 1,094 Equatorial Energia SA 117,500 1,079 Odontoprev SA 246,627 921 Mills Estruturas e Servicos de Engenharia SA 77,978 902 Cia de Saneamento de Minas Gerais-COPASA 60,998 797 Banco do Estado do Rio Grande do Sul SA Prior Pfd. 172,946 753 Iochpe-Maxion SA 71,950 725 Valid Solucoes e Servicos de Seguranca em Meios de Pagamento e
Identificacao S.A 55,700 693 Fleury SA 82,330 628 Alpargatas SA Prior Pfd. 118,184 618 * B2W Cia Digital 63,527 610 Ez Tec Empreendimentos e Participacoes SA 53,300 594 Smiles SA 41,093 571 Gafisa SA 438,982 557 Aliansce Shopping Centers SA 80,579 546
Even Construtora e Incorporadora SA 182,522 541 Iguatemi Empresa de Shopping Centers SA 62,000 514 Sao Martinho SA 48,400 496 Brasil Insurance Participacoes e Administracao SA 61,427 483 Grendene SA 72,764 481 Arezzo Industria e Comercio SA 44,600 478 Randon Participacoes SA Prior Pfd. 122,876 475 * Marfrig Global Foods SA 271,912 468 JSL SA 83,600 463 Cia Energetica do Ceara Prior Pfd. 22,600 450 Magnesita Refratarios SA 207,401 449 * Alupar Investimento SA 66,100 426 QGEP Participacoes SA 115,400 424 Mahle-Metal Leve SA Industria e Comercio 41,000 416 * International Meal Co. Holdings SA 52,800 383 Direcional Engenharia SA 87,300 382 * Prumo Logistica SA 938,752 375 Helbor Empreendimentos SA 128,300 371 * Gol Linhas Aereas Inteligentes SA Prior Pfd. 91,800 360 LPS Brasil Consultoria de Imoveis SA 66,806 348 Brasil Brokers Participacoes SA 156,600 329 SLC Agricola SA 43,900 327 Santos Brasil Participacoes SA 42,946 291 * Brasil Pharma SA 138,900 289 Eletropaulo Metropolitana Eletricidade de Sao Paulo SA Prior Pfd. 78,018 283 * Contax Participacoes SA 34,353 282 Marisa Lojas SA 41,600 272 Abril Educacao SA 22,700 270 * Tecnisa SA 78,100 251 * Rossi Residencial SA 300,115 241 * Paranapanema SA 136,200 237 Tereos Internacional SA 239,159 210 * Magazine Luiza SA 56,100 183 JHSF Participacoes SA 95,400 158 Tegma Gestao Logistica 19,900 153 Sonae Sierra Brasil SA 22,400 144 * Brookfield Incorporacoes SA 238,607 131 _____________
34,524
Canada (12.3%)
* Tourmaline Oil Corp. 160,827 6,800 Gildan Activewear Inc. 118,302 6,307 Open Text Corp. 57,076 5,656 Methanex Corp. 92,077 5,507 ^ Vermilion Energy Inc. 88,292 4,861 Dollarama Inc. 62,199 4,691 Onex Corp. 89,397 4,607 Keyera Corp. 76,160 4,513 ^ Baytex Energy Corp. 120,102 4,385 AltaGas Ltd. 117,813 4,381 Industrial Alliance Insurance & Financial Services Inc. 94,114 3,746 Peyto Exploration & Development Corp. 123,711 3,626 ^ Enerplus Corp. 194,842 3,527 Atco Ltd. 74,302 3,326 ^ Pengrowth Energy Corp. 511,999 3,310 Constellation Software Inc. 15,016 3,227 Empire Co. Ltd. 49,891 3,185 CAE Inc. 249,271 3,158
Gibson Energy Inc. 118,930 2,892 Aimia Inc. 165,900 2,878 West Fraser Timber Co. Ltd. 55,918 2,871 * New Gold Inc. 485,428 2,785 * Athabasca Oil Corp. 372,393 2,672 ^ Veresen Inc. 197,725 2,649 Progressive Waste Solutions Ltd. 112,230 2,580 Stantec Inc. 42,051 2,559 Canadian Western Bank 76,095 2,489 MacDonald Dettwiler & Associates Ltd. 34,753 2,469 * Osisko Mining Corp. 411,064 2,465 Precision Drilling Corp. 275,137 2,463 H&R REIT 129,637 2,462 ^ Bonavista Energy Corp. 180,680 2,381 ^ Home Capital Group Inc. Class B 33,650 2,332 * Canfor Corp. 85,988 2,213 Cineplex Inc. 60,571 2,201 CCL Industries Inc. Class B 30,261 2,183 Mullen Group Ltd. 83,297 2,019 ^ Ritchie Bros Auctioneers Inc. 86,404 1,986 ShawCor Ltd. 54,331 1,984 Whitecap Resources Inc. 187,003 1,983 Linamar Corp. 51,435 1,976 TransForce Inc. 91,476 1,960 Davis & Henderson Corp. 77,126 1,938 Pan American Silver Corp. 153,636 1,934 Ensign Energy Services Inc. 126,872 1,874 Westshore Terminals Investment Corp. 58,790 1,870 * Imax Corp. 66,896 1,851 * Paramount Resources Ltd. Class A 47,708 1,795 * Lundin Mining Corp. 410,207 1,794 Quebecor Inc. Class B 83,286 1,774 Corus Entertainment Inc. Class B 75,714 1,681 Trican Well Service Ltd. 143,106 1,638 TMX Group Ltd. 35,430 1,609 Toromont Industries Ltd. 69,405 1,603 Capital Power Corp. 77,645 1,589 * Celestica Inc. 159,531 1,583 * WSP Global Inc. 51,352 1,539 ^ Russel Metals Inc. 57,467 1,480 * Tahoe Resources Inc. 81,758 1,452 ^ Canadian REIT 37,631 1,437 Secure Energy Services Inc. 98,454 1,434 Pason Systems Inc. 62,891 1,420 ^ Trilogy Energy Corp. 61,499 1,413 * B2Gold Corp. 596,751 1,409 RONA Inc. 125,305 1,405 Superior Plus Corp. 127,334 1,399 Genworth MI Canada Inc. 46,235 1,383 * Paladin Labs Inc. 12,346 1,375 Jean Coutu Group PJC Inc. Class A 79,007 1,368 HudBay Minerals Inc. 169,970 1,349 Calloway REIT 60,212 1,343 Dundee REIT Class A 49,920 1,314 Laurentian Bank of Canada 31,838 1,307 FirstService Corp. 32,197 1,299 Bonterra Energy Corp. 26,910 1,240
First Capital Realty Inc. 76,779 1,206 Boardwalk REIT 22,872 1,201 * First Majestic Silver Corp. 111,071 1,160 * Dominion Diamond Corp. 79,393 1,156 ^ Northland Power Inc. 78,674 1,151 Alamos Gold Inc. 122,887 1,128 Lightstream Resources Ltd. 198,461 1,107 Trinidad Drilling Ltd. 131,133 1,089 * ATS Automation Tooling Systems Inc. 84,939 1,060 ^ AuRico Gold Inc. 227,833 1,045 Maple Leaf Foods Inc. 73,291 1,036 Algonquin Power & Utilities Corp. 157,693 1,032 ^ Parkland Fuel Corp. 63,359 1,023 Enerflex Ltd. 73,011 1,016 North West Co. Inc. 43,995 1,004 Canadian Apartment Properties REIT 51,852 987 AGF Management Ltd. Class B 96,203 985 * NuVista Energy Ltd. 127,994 947 Manitoba Telecom Services Inc. 35,116 934 Stella-Jones Inc. 39,885 933 Innergex Renewable Energy Inc. 98,824 928 Cominar REIT 55,344 923 ^ Allied Properties REIT 31,382 921 * Bankers Petroleum Ltd. 238,210 915 * Capstone Mining Corp. 350,877 910 ^ Emera Inc. 32,267 909 ^,* Westport Innovations Inc. 51,528 878 Calfrac Well Services Ltd. 32,786 878 ^ Artis REIT 63,890 866 Sherritt International Corp. 277,445 857 Dorel Industries Inc. Class B 23,526 855 ^ Just Energy Group Inc. 120,502 845 * Detour Gold Corp. 130,150 837 * Birchcliff Energy Ltd. 109,584 831 Granite REIT 24,200 830 * Imperial Metals Corp. 54,702 826 Chartwell Retirement Residences 84,898 812 * China Gold International Resources Corp. Ltd. 283,000 808 * Kelt Exploration Ltd. 82,530 800 Aecon Group Inc. 56,143 780 Norbord Inc. 27,634 775 Transcontinental Inc. Class A 60,557 763 Savanna Energy Services Corp. 107,218 759 SEMAFO Inc. 228,889 738 * Crew Energy Inc. 113,115 736 Canexus Corp. 140,853 727 * Legacy Oil & Gas Inc. 141,100 713 Martinrea International Inc. 83,038 694 ^,* NovaGold Resources Inc. 236,137 689 Cott Corp. 85,494 672 * Torex Gold Resources Inc. 640,743 662 * Dream Unlimited Corp. 45,630 650 * Dundee Corp. Class A 39,330 648 * Nordion Inc. 67,080 640 * Great Canadian Gaming Corp. 50,530 628 Nevsun Resources Ltd. 170,431 626 * Endeavour Silver Corp. 140,652 612
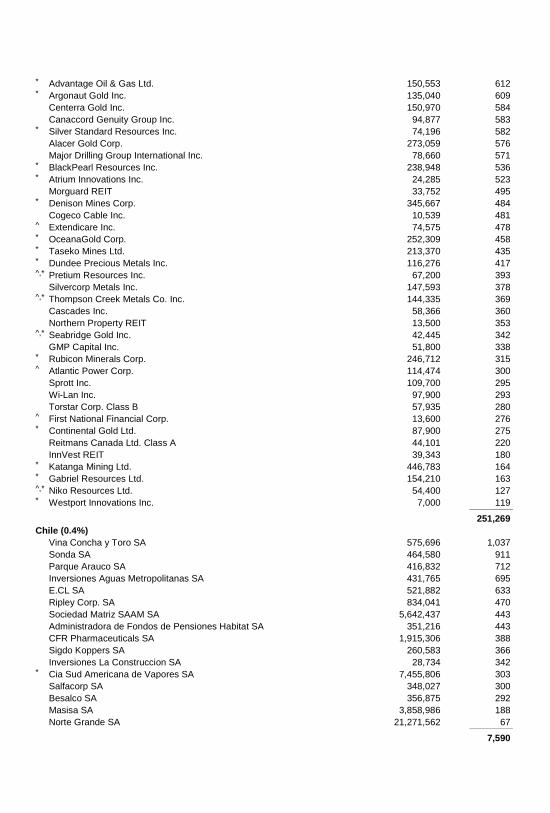
* Advantage Oil & Gas Ltd. 150,553 612 * Argonaut Gold Inc. 135,040 609 Centerra Gold Inc. 150,970 584 Canaccord Genuity Group Inc. 94,877 583 * Silver Standard Resources Inc. 74,196 582 Alacer Gold Corp. 273,059 576 Major Drilling Group International Inc. 78,660 571 * BlackPearl Resources Inc. 238,948 536 * Atrium Innovations Inc. 24,285 523 Morguard REIT 33,752 495 * Denison Mines Corp. 345,667 484 Cogeco Cable Inc. 10,539 481 ^ Extendicare Inc. 74,575 478 * OceanaGold Corp. 252,309 458 * Taseko Mines Ltd. 213,370 435 * Dundee Precious Metals Inc. 116,276 417 ^,* Pretium Resources Inc. 67,200 393 Silvercorp Metals Inc. 147,593 378 ^,* Thompson Creek Metals Co. Inc. 144,335 369 Cascades Inc. 58,366 360 Northern Property REIT 13,500 353 ^,* Seabridge Gold Inc. 42,445 342 GMP Capital Inc. 51,800 338 * Rubicon Minerals Corp. 246,712 315 ^ Atlantic Power Corp. 114,474 300 Sprott Inc. 109,700 295 Wi-Lan Inc. 97,900 293 Torstar Corp. Class B 57,935 280 ^ First National Financial Corp. 13,600 276 * Continental Gold Ltd. 87,900 275 Reitmans Canada Ltd. Class A 44,101 220 InnVest REIT 39,343 180 * Katanga Mining Ltd. 446,783 164 * Gabriel Resources Ltd. 154,210 163 ^,* Niko Resources Ltd. 54,400 127 * Westport Innovations Inc. 7,000 119 _____________
251,269
Chile (0.4%)
Vina Concha y Toro SA 575,696 1,037 Sonda SA 464,580 911 Parque Arauco SA 416,832 712 Inversiones Aguas Metropolitanas SA 431,765 695 E.CL SA 521,882 633 Ripley Corp. SA 834,041 470 Sociedad Matriz SAAM SA 5,642,437 443 Administradora de Fondos de Pensiones Habitat SA 351,216 443 CFR Pharmaceuticals SA 1,915,306 388 Sigdo Koppers SA 260,583 366 Inversiones La Construccion SA 28,734 342 * Cia Sud Americana de Vapores SA 7,455,806 303 Salfacorp SA 348,027 300 Besalco SA 356,875 292 Masisa SA 3,858,986 188 Norte Grande SA 21,271,562 67 _____________
7,590
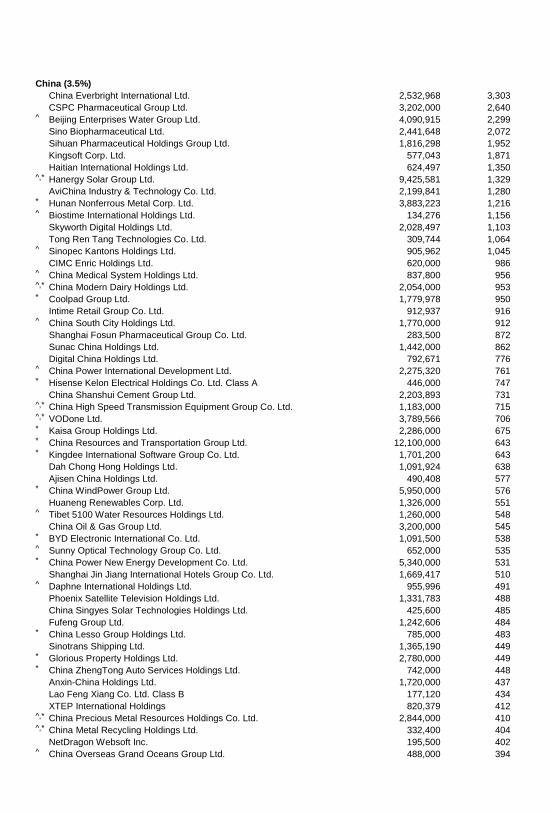
China (3.5%)
China Everbright International Ltd. 2,532,968 3,303 CSPC Pharmaceutical Group Ltd. 3,202,000 2,640 ^ Beijing Enterprises Water Group Ltd. 4,090,915 2,299 Sino Biopharmaceutical Ltd. 2,441,648 2,072 Sihuan Pharmaceutical Holdings Group Ltd. 1,816,298 1,952 Kingsoft Corp. Ltd. 577,043 1,871 Haitian International Holdings Ltd. 624,497 1,350 ^,* Hanergy Solar Group Ltd. 9,425,581 1,329 AviChina Industry & Technology Co. Ltd. 2,199,841 1,280 * Hunan Nonferrous Metal Corp. Ltd. 3,883,223 1,216 ^ Biostime International Holdings Ltd. 134,276 1,156 Skyworth Digital Holdings Ltd. 2,028,497 1,103 Tong Ren Tang Technologies Co. Ltd. 309,744 1,064 ^ Sinopec Kantons Holdings Ltd. 905,962 1,045 CIMC Enric Holdings Ltd. 620,000 986 ^ China Medical System Holdings Ltd. 837,800 956 ^,* China Modern Dairy Holdings Ltd. 2,054,000 953 * Coolpad Group Ltd. 1,779,978 950 Intime Retail Group Co. Ltd. 912,937 916 ^ China South City Holdings Ltd. 1,770,000 912 Shanghai Fosun Pharmaceutical Group Co. Ltd. 283,500 872 Sunac China Holdings Ltd. 1,442,000 862 Digital China Holdings Ltd. 792,671 776 ^ China Power International Development Ltd. 2,275,320 761 * Hisense Kelon Electrical Holdings Co. Ltd. Class A 446,000 747 China Shanshui Cement Group Ltd. 2,203,893 731 ^,* China High Speed Transmission Equipment Group Co. Ltd. 1,183,000 715 ^,* VODone Ltd. 3,789,566 706 * Kaisa Group Holdings Ltd. 2,286,000 675 * China Resources and Transportation Group Ltd. 12,100,000 643 * Kingdee International Software Group Co. Ltd. 1,701,200 643 Dah Chong Hong Holdings Ltd. 1,091,924 638 Ajisen China Holdings Ltd. 490,408 577 * China WindPower Group Ltd. 5,950,000 576 Huaneng Renewables Corp. Ltd. 1,326,000 551 ^ Tibet 5100 Water Resources Holdings Ltd. 1,260,000 548 China Oil & Gas Group Ltd. 3,200,000 545 * BYD Electronic International Co. Ltd. 1,091,500 538 ^ Sunny Optical Technology Group Co. Ltd. 652,000 535 * China Power New Energy Development Co. Ltd. 5,340,000 531 Shanghai Jin Jiang International Hotels Group Co. Ltd. 1,669,417 510 ^ Daphne International Holdings Ltd. 955,996 491 Phoenix Satellite Television Holdings Ltd. 1,331,783 488 China Singyes Solar Technologies Holdings Ltd. 425,600 485 Fufeng Group Ltd. 1,242,606 484 * China Lesso Group Holdings Ltd. 785,000 483 Sinotrans Shipping Ltd. 1,365,190 449 * Glorious Property Holdings Ltd. 2,780,000 449 * China ZhengTong Auto Services Holdings Ltd. 742,000 448 Anxin-China Holdings Ltd. 1,720,000 437 Lao Feng Xiang Co. Ltd. Class B 177,120 434 XTEP International Holdings 820,379 412 ^,* China Precious Metal Resources Holdings Co. Ltd. 2,844,000 410 ^,* China Metal Recycling Holdings Ltd. 332,400 404 NetDragon Websoft Inc. 195,500 402 ^ China Overseas Grand Oceans Group Ltd. 488,000 394
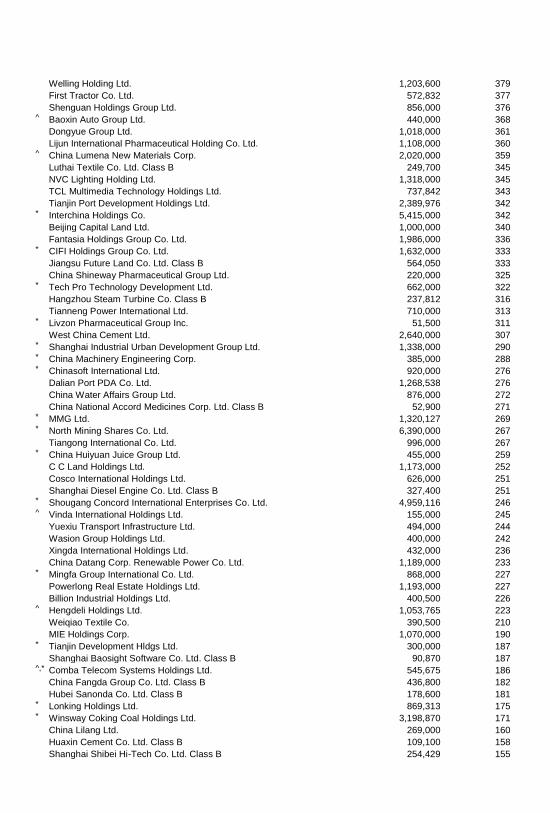
Welling Holding Ltd. 1,203,600 379 First Tractor Co. Ltd. 572,832 377 Shenguan Holdings Group Ltd. 856,000 376 ^ Baoxin Auto Group Ltd. 440,000 368 Dongyue Group Ltd. 1,018,000 361 Lijun International Pharmaceutical Holding Co. Ltd. 1,108,000 360 ^ China Lumena New Materials Corp. 2,020,000 359 Luthai Textile Co. Ltd. Class B 249,700 345 NVC Lighting Holding Ltd. 1,318,000 345 TCL Multimedia Technology Holdings Ltd. 737,842 343 Tianjin Port Development Holdings Ltd. 2,389,976 342 * Interchina Holdings Co. 5,415,000 342 Beijing Capital Land Ltd. 1,000,000 340 Fantasia Holdings Group Co. Ltd. 1,986,000 336 * CIFI Holdings Group Co. Ltd. 1,632,000 333 Jiangsu Future Land Co. Ltd. Class B 564,050 333 China Shineway Pharmaceutical Group Ltd. 220,000 325 * Tech Pro Technology Development Ltd. 662,000 322 Hangzhou Steam Turbine Co. Class B 237,812 316 Tianneng Power International Ltd. 710,000 313 * Livzon Pharmaceutical Group Inc. 51,500 311 West China Cement Ltd. 2,640,000 307 * Shanghai Industrial Urban Development Group Ltd. 1,338,000 290 * China Machinery Engineering Corp. 385,000 288 * Chinasoft International Ltd. 920,000 276 Dalian Port PDA Co. Ltd. 1,268,538 276 China Water Affairs Group Ltd. 876,000 272 China National Accord Medicines Corp. Ltd. Class B 52,900 271 * MMG Ltd. 1,320,127 269 * North Mining Shares Co. Ltd. 6,390,000 267 Tiangong International Co. Ltd. 996,000 267 * China Huiyuan Juice Group Ltd. 455,000 259 C C Land Holdings Ltd. 1,173,000 252 Cosco International Holdings Ltd. 626,000 251 Shanghai Diesel Engine Co. Ltd. Class B 327,400 251 * Shougang Concord International Enterprises Co. Ltd. 4,959,116 246 ^ Vinda International Holdings Ltd. 155,000 245 Yuexiu Transport Infrastructure Ltd. 494,000 244 Wasion Group Holdings Ltd. 400,000 242 Xingda International Holdings Ltd. 432,000 236 China Datang Corp. Renewable Power Co. Ltd. 1,189,000 233 * Mingfa Group International Co. Ltd. 868,000 227 Powerlong Real Estate Holdings Ltd. 1,193,000 227 Billion Industrial Holdings Ltd. 400,500 226 ^ Hengdeli Holdings Ltd. 1,053,765 223 Weiqiao Textile Co. 390,500 210 MIE Holdings Corp. 1,070,000 190 * Tianjin Development Hldgs Ltd. 300,000 187 Shanghai Baosight Software Co. Ltd. Class B 90,870 187 ^,* Comba Telecom Systems Holdings Ltd. 545,675 186 China Fangda Group Co. Ltd. Class B 436,800 182 Hubei Sanonda Co. Ltd. Class B 178,600 181 * Lonking Holdings Ltd. 869,313 175 * Winsway Coking Coal Holdings Ltd. 3,198,870 171 China Lilang Ltd. 269,000 160 Huaxin Cement Co. Ltd. Class B 109,100 158 Shanghai Shibei Hi-Tech Co. Ltd. Class B 254,429 155
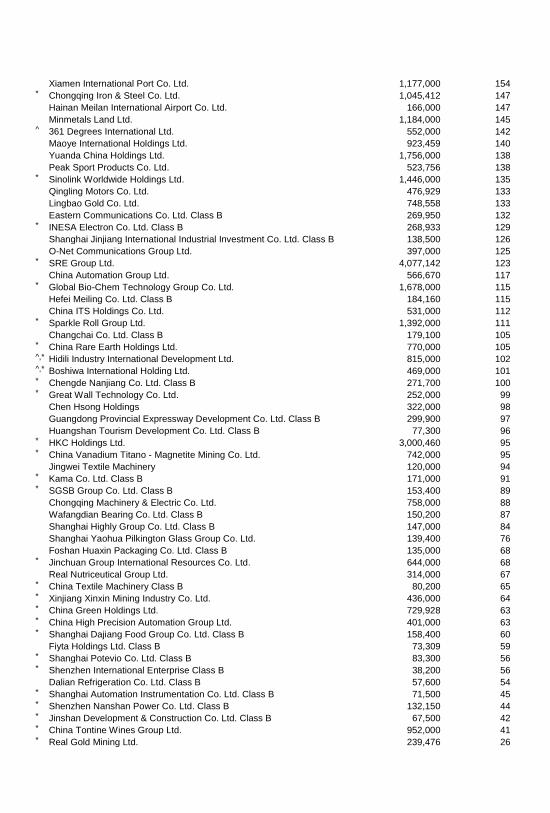
Xiamen International Port Co. Ltd. 1,177,000 154 * Chongqing Iron & Steel Co. Ltd. 1,045,412 147 Hainan Meilan International Airport Co. Ltd. 166,000 147 Minmetals Land Ltd. 1,184,000 145 ^ 361 Degrees International Ltd. 552,000 142 Maoye International Holdings Ltd. 923,459 140 Yuanda China Holdings Ltd. 1,756,000 138 Peak Sport Products Co. Ltd. 523,756 138 * Sinolink Worldwide Holdings Ltd. 1,446,000 135 Qingling Motors Co. Ltd. 476,929 133 Lingbao Gold Co. Ltd. 748,558 133 Eastern Communications Co. Ltd. Class B 269,950 132 * INESA Electron Co. Ltd. Class B 268,933 129 Shanghai Jinjiang International Industrial Investment Co. Ltd. Class B 138,500 126 O-Net Communications Group Ltd. 397,000 125 * SRE Group Ltd. 4,077,142 123 China Automation Group Ltd. 566,670 117 * Global Bio-Chem Technology Group Co. Ltd. 1,678,000 115 Hefei Meiling Co. Ltd. Class B 184,160 115 China ITS Holdings Co. Ltd. 531,000 112 * Sparkle Roll Group Ltd. 1,392,000 111 Changchai Co. Ltd. Class B 179,100 105 * China Rare Earth Holdings Ltd. 770,000 105 ^,* Hidili Industry International Development Ltd. 815,000 102 ^,* Boshiwa International Holding Ltd. 469,000 101 * Chengde Nanjiang Co. Ltd. Class B 271,700 100 * Great Wall Technology Co. Ltd. 252,000 99 Chen Hsong Holdings 322,000 98 Guangdong Provincial Expressway Development Co. Ltd. Class B 299,900 97 Huangshan Tourism Development Co. Ltd. Class B 77,300 96 * HKC Holdings Ltd. 3,000,460 95 * China Vanadium Titano - Magnetite Mining Co. Ltd. 742,000 95 Jingwei Textile Machinery 120,000 94 * Kama Co. Ltd. Class B 171,000 91 * SGSB Group Co. Ltd. Class B 153,400 89 Chongqing Machinery & Electric Co. Ltd. 758,000 88 Wafangdian Bearing Co. Ltd. Class B 150,200 87 Shanghai Highly Group Co. Ltd. Class B 147,000 84 Shanghai Yaohua Pilkington Glass Group Co. Ltd. 139,400 76 Foshan Huaxin Packaging Co. Ltd. Class B 135,000 68 * Jinchuan Group International Resources Co. Ltd. 644,000 68 Real Nutriceutical Group Ltd. 314,000 67 * China Textile Machinery Class B 80,200 65 * Xinjiang Xinxin Mining Industry Co. Ltd. 436,000 64 * China Green Holdings Ltd. 729,928 63 * China High Precision Automation Group Ltd. 401,000 63 * Shanghai Dajiang Food Group Co. Ltd. Class B 158,400 60 Fiyta Holdings Ltd. Class B 73,309 59 * Shanghai Potevio Co. Ltd. Class B 83,300 56 * Shenzhen International Enterprise Class B 38,200 56 Dalian Refrigeration Co. Ltd. Class B 57,600 54 * Shanghai Automation Instrumentation Co. Ltd. Class B 71,500 45 * Shenzhen Nanshan Power Co. Ltd. Class B 132,150 44 * Jinshan Development & Construction Co. Ltd. Class B 67,500 42 * China Tontine Wines Group Ltd. 952,000 41 * Real Gold Mining Ltd. 239,476 26
* Chigo Holding Ltd. 1,038,000 25 _____________
70,641
Colombia (0.1%)
Banco Davivienda SA Prior Pfd. 102,306 1,086
Denmark (1.7%)
* Vestas Wind Systems A/S 199,668 6,589 Pandora A/S 102,958 5,881 GN Store Nord A/S 166,797 3,958 * Jyske Bank A/S 68,951 3,529 Topdanmark A/S 90,880 2,399 * Sydbank A/S 73,149 1,862 * Genmab A/S 44,393 1,759 NKT Holding A/S 23,228 1,351 * SimCorp A/S 36,270 1,326 Royal UNIBREW 8,063 1,019 * Matas A/S 35,677 963 ALK-Abello A/S 6,408 837 Schouw & Co. 10,765 473 * Alm Brand A/S 100,333 472 D/S Norden A/S 8,002 374 Solar A/S Class B 4,444 287 * Bang & Olufsen A/S 24,421 249 * Auriga Industries Class B 7,220 227 * Bavarian Nordic A/S 11,876 206 _____________
33,761
Egypt (0.1%)
Orascom Telecom Media And Technology Holding SAE 1,850,079 308 * Six of October Development & Investment 66,991 221 * Palm Hills Developments SAE 435,649 195 * Medinet Nasr Housing 51,733 176 * Amer Group Holding 1,017,108 168 Arab Cotton Ginning 184,483 121 Oriental Weavers 23,058 119 * Egyptian Resorts Co. 494,654 107 Heliopolis Co. for Housing and Construction SAE 26,698 96 * Egyptian Financial & Industrial Co. 43,090 76 * Maridive & Oil Services SAE 71,848 75 * Abu Dhabi Islamic Bank 53,172 63 * Nile Cotton Ginning 31,192 29 _____________
1,754
Finland (1.8%)
Elisa Oyj 161,551 4,145 Pohjola Bank plc Class A 180,272 3,544 Huhtamaki Oyj 104,425 2,591 Orion Oyj Class B 97,294 2,541 Amer Sports Oyj 118,814 2,451 Konecranes Oyj 60,694 2,138 ^ Outotec Oyj 172,468 1,758 YIT Oyj 122,513 1,539 Tieto Oyj 69,105 1,517 Cargotec Oyj Class B 40,452 1,438 * Caverion Corp. 122,377 1,192 Sponda Oyj 234,636 1,135 Kemira Oyj 74,936 1,042 Uponor Oyj 55,341 887
Ramirent Oyj 71,201 844 Metsa Board Oyj 211,306 840 Rautaruukki Oyj 69,281 820 Sanoma Oyj 98,949 781 Raisio plc 125,198 759 Citycon Oyj 220,203 751 Lassila & Tikanoja Oyj 33,557 666 ^,* Outokumpu Oyj 965,337 561 Cramo Oyj 25,473 505 Stockmann OYJ Abp Class B 27,984 425 Oriola-KD Oyj 81,211 288 Finnair Oyj 62,595 235 * Poyry Oyj 31,862 180 F-Secure Oyj 54,452 157 HKScan Oyj 22,851 114 _____________
35,844
France (2.5%)
^ Ingenico 41,256 3,545 Teleperformance 53,440 3,126 ^ Neopost SA 33,724 2,857 Eurofins Scientific SE 7,922 2,016 Orpea 36,683 2,010 Rubis SCA 29,866 1,940 Havas SA 240,214 1,880 * Faurecia 45,709 1,803 Nexans SA 31,028 1,453 Plastic Omnium SA 53,403 1,381 Metropole Television SA 62,606 1,357 IPSOS 31,296 1,342 * UBISOFT Entertainment 95,554 1,334 Etablissements Maurel et Prom 82,377 1,332 Bourbon SA 45,533 1,257 * Technicolor SA 251,053 1,245 Medica SA 39,761 1,139 Altran Technologies SA 115,176 1,053 Vicat 14,882 1,040 Virbac SA 4,411 985 Nexity SA 23,131 923 Alten SA 19,542 882 Saft Groupe SA 23,212 813 Rallye SA 20,005 785 Mercialys SA 37,203 762 * GameLoft SE 80,744 737 Sartorius Stedim Biotech 3,809 680 Vilmorin & Cie SA 5,072 664 Sopra Group SA 5,831 641 LISI 3,423 574 Boiron SA 7,802 552 * Beneteau SA 32,760 500 Societe d'Edition de Canal & 62,415 494 * Derichebourg SA 142,870 492 * Club Mediterranee SA 20,870 489 April 20,185 454 Faiveley Transport SA 5,908 431 ALBIOMA 17,520 427 Groupe Steria SCA 19,959 403 * FFP 6,439 373
Mersen 11,733 367 Ciments Francais SA 4,617 365 Jacquet Metal Service 19,501 356 Bonduelle S.C.A. 13,824 351 * Bull 64,342 320 ^,* SOITEC 154,069 307 * Groupe Fnac 9,148 283 MPI 72,195 283 * Euro Disney SCA 46,641 269 Societe de la Tour Eiffel 3,899 261 Esso SA Francaise 4,577 256 * Trigano SA 8,932 227 Assystem 7,796 217 * Parrot SA 7,881 217 Stallergenes SA 2,818 215 * Boursorama 18,049 211 ^,* Solocal Group 107,918 192 Seche Environnement SA 4,100 183 Manitou BF SA 9,233 162 Guerbet 4,184 144 * Haulotte Group SA 9,244 137 GL Events 5,304 120 ^ Maisons France Confort 2,157 88 Union Financiere de France BQE SA 3,200 78 * Etablissements Maurel et Prom Warrants Exp. 06/30/2014 38,916 6 _____________
51,786
Germany (4.7%)
* ProSiebenSat.1 Media AG 209,363 9,383 Symrise AG 106,334 4,845 Wirecard AG 102,118 4,459 * Sky Deutschland AG 453,192 4,119 Freenet AG 106,769 3,257 Deutsche Wohnen AG 165,531 3,098 LEG Immobilien AG 47,666 2,838 Stada Arzneimittel AG 56,942 2,714 Aurubis AG 43,314 2,508 Leoni AG 31,182 2,419 * MorphoSys AG 25,696 2,249 * Deutsche Wohnen AG 120,085 2,183 Rhoen Klinikum AG 71,042 2,093 Gerresheimer AG 30,799 2,070 Wincor Nixdorf AG 28,233 2,005 DMG MORI SEIKI AG 59,995 1,939 Deutsche Euroshop AG 44,931 1,896 * GAGFAH SA 124,289 1,784 Norma Group SE 31,235 1,688 * Aareal Bank AG 44,166 1,626 ^ SGL Carbon SE 42,258 1,578 * KION Group AG 31,020 1,420 KUKA AG 29,088 1,392 * Dialog Semiconductor plc 69,817 1,357 TAG Immobilien AG 112,035 1,356 * Kloeckner & Co. SE 83,714 1,246 Rational AG 4,028 1,238 * Aixtron SE 78,734 1,200 ElringKlinger AG 31,985 1,180 Gerry Weber International AG 26,493 1,178
Jungheinrich AG Prior Pfd. 15,818 1,152 Duerr AG 13,553 1,141 Pfeiffer Vacuum Technology AG 9,412 1,118 Krones AG 13,380 1,070 Alstria Office REIT-AG 78,810 1,023 Bechtle AG 11,901 876 * Deutz AG 86,946 863 Vossloh AG 8,917 847 CTS Eventim AG 16,106 822 * Nordex SE 59,080 789 KWS Saat AG 2,251 757 Biotest AG Prior Pfd. 6,507 725 Draegerwerk AG & Co. KGaA Prior Pfd. 5,904 719 Indus Holding AG 18,003 713 Jenoptik AG 42,162 709 Rheinmetall AG 10,992 705 BayWa AG 13,458 702 * Heidelberger Druckmaschinen AG 165,624 681 KSB AG Prior Pfd. 1,105 661 Sixt SE Prior Pfd. 22,563 617 Bertrandt AG 4,101 610 Grenkeleasing AG 6,323 589 * DIC Asset AG 59,405 535 GFK SE 9,411 517 Takkt AG 25,446 479 CAT Oil AG 20,245 460 Carl Zeiss Meditec AG 15,332 449 Hamburger Hafen und Logistik AG 16,872 421 Kontron AG 54,723 379 Sixt SE 11,452 376 SMA Solar Technology AG 8,955 375 Bauer AG 13,441 343 QSC AG 56,381 307 * Deutsche Beteiligungs AG 9,994 299 Draegerwerk AG & Co. KGaA 2,797 283 * Patrizia Immobilien AG 25,654 267 * H&R AG 19,756 233 Comdirect Bank AG 17,837 203 ^,* Air Berlin plc 63,732 172 Delticom AG 3,695 160 CropEnergies AG 10,226 79 _____________
96,544
Greece (0.9%)
OPAP SA 207,215 2,672 Piraeus Bank SA 957,016 2,225 National Bank of Greece SA 389,400 1,727 * JUMBO SA 89,771 1,523 * Alpha Bank AE 1,644,192 1,487 Public Power Corp. SA 101,245 1,353 * Titan Cement Co. SA 49,623 1,333 * Alpha Bank Warrants Exp. 12/10/2017 618,995 1,077 * Folli Follie SA 32,816 989 Motor Oil Hellas Corinth Refineries SA 58,459 673 Hellenic Exchanges SA 63,027 620 * Mytilineos Holdings SA 76,853 602 * Ellaktor SA 107,389 486 * Eurobank Properties Real Estate Investment Co. 41,275 421
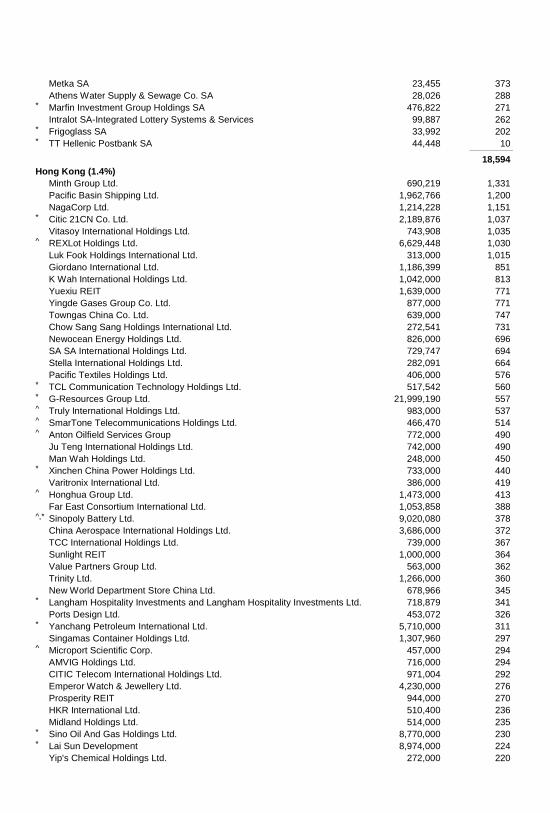
Metka SA 23,455 373 Athens Water Supply & Sewage Co. SA 28,026 288 * Marfin Investment Group Holdings SA 476,822 271 Intralot SA-Integrated Lottery Systems & Services 99,887 262 * Frigoglass SA 33,992 202 * TT Hellenic Postbank SA 44,448 10 _____________
18,594
Hong Kong (1.4%)
Minth Group Ltd. 690,219 1,331 Pacific Basin Shipping Ltd. 1,962,766 1,200 NagaCorp Ltd. 1,214,228 1,151 * Citic 21CN Co. Ltd. 2,189,876 1,037 Vitasoy International Holdings Ltd. 743,908 1,035 ^ REXLot Holdings Ltd. 6,629,448 1,030 Luk Fook Holdings International Ltd. 313,000 1,015 Giordano International Ltd. 1,186,399 851 K Wah International Holdings Ltd. 1,042,000 813 Yuexiu REIT 1,639,000 771 Yingde Gases Group Co. Ltd. 877,000 771 Towngas China Co. Ltd. 639,000 747 Chow Sang Sang Holdings International Ltd. 272,541 731 Newocean Energy Holdings Ltd. 826,000 696 SA SA International Holdings Ltd. 729,747 694 Stella International Holdings Ltd. 282,091 664 Pacific Textiles Holdings Ltd. 406,000 576 * TCL Communication Technology Holdings Ltd. 517,542 560 * G-Resources Group Ltd. 21,999,190 557 ^ Truly International Holdings Ltd. 983,000 537 ^ SmarTone Telecommunications Holdings Ltd. 466,470 514 ^ Anton Oilfield Services Group 772,000 490 Ju Teng International Holdings Ltd. 742,000 490 Man Wah Holdings Ltd. 248,000 450 * Xinchen China Power Holdings Ltd. 733,000 440 Varitronix International Ltd. 386,000 419 ^ Honghua Group Ltd. 1,473,000 413 Far East Consortium International Ltd. 1,053,858 388 ^,* Sinopoly Battery Ltd. 9,020,080 378 China Aerospace International Holdings Ltd. 3,686,000 372 TCC International Holdings Ltd. 739,000 367 Sunlight REIT 1,000,000 364 Value Partners Group Ltd. 563,000 362 Trinity Ltd. 1,266,000 360 New World Department Store China Ltd. 678,966 345 * Langham Hospitality Investments and Langham Hospitality Investments Ltd. 718,879 341 Ports Design Ltd. 453,072 326 * Yanchang Petroleum International Ltd. 5,710,000 311 Singamas Container Holdings Ltd. 1,307,960 297 ^ Microport Scientific Corp. 457,000 294 AMVIG Holdings Ltd. 716,000 294 CITIC Telecom International Holdings Ltd. 971,004 292 Emperor Watch & Jewellery Ltd. 4,230,000 276 Prosperity REIT 944,000 270 HKR International Ltd. 510,400 236 Midland Holdings Ltd. 514,000 235 * Sino Oil And Gas Holdings Ltd. 8,770,000 230 * Lai Sun Development 8,974,000 224 Yip's Chemical Holdings Ltd. 272,000 220
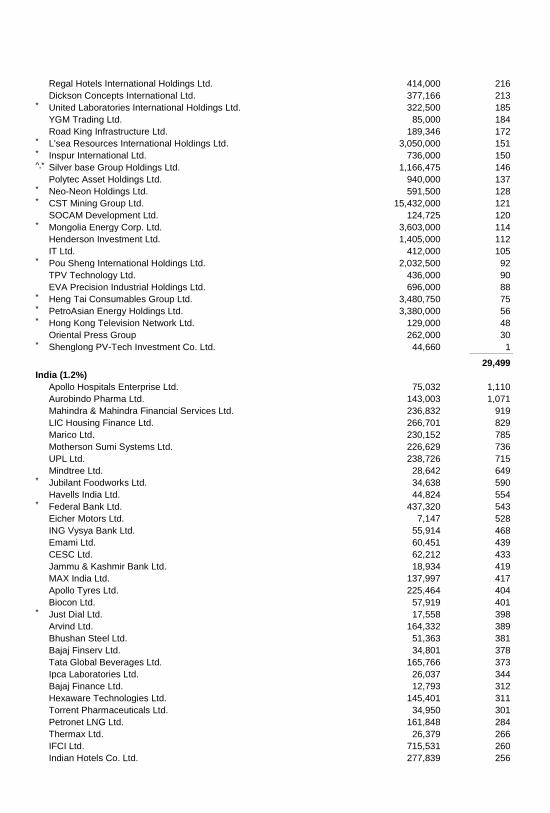
Regal Hotels International Holdings Ltd. 414,000 216 Dickson Concepts International Ltd. 377,166 213 * United Laboratories International Holdings Ltd. 322,500 185 YGM Trading Ltd. 85,000 184 Road King Infrastructure Ltd. 189,346 172 * L'sea Resources International Holdings Ltd. 3,050,000 151 * Inspur International Ltd. 736,000 150 ^,* Silver base Group Holdings Ltd. 1,166,475 146 Polytec Asset Holdings Ltd. 940,000 137 * Neo-Neon Holdings Ltd. 591,500 128 * CST Mining Group Ltd. 15,432,000 121 SOCAM Development Ltd. 124,725 120 * Mongolia Energy Corp. Ltd. 3,603,000 114 Henderson Investment Ltd. 1,405,000 112 IT Ltd. 412,000 105 * Pou Sheng International Holdings Ltd. 2,032,500 92 TPV Technology Ltd. 436,000 90 EVA Precision Industrial Holdings Ltd. 696,000 88 * Heng Tai Consumables Group Ltd. 3,480,750 75 * PetroAsian Energy Holdings Ltd. 3,380,000 56 * Hong Kong Television Network Ltd. 129,000 48 Oriental Press Group 262,000 30 * Shenglong PV-Tech Investment Co. Ltd. 44,660 1 _____________
29,499
India (1.2%)
Apollo Hospitals Enterprise Ltd. 75,032 1,110 Aurobindo Pharma Ltd. 143,003 1,071 Mahindra & Mahindra Financial Services Ltd. 236,832 919 LIC Housing Finance Ltd. 266,701 829 Marico Ltd. 230,152 785 Motherson Sumi Systems Ltd. 226,629 736 UPL Ltd. 238,726 715 Mindtree Ltd. 28,642 649 * Jubilant Foodworks Ltd. 34,638 590 Havells India Ltd. 44,824 554 * Federal Bank Ltd. 437,320 543 Eicher Motors Ltd. 7,147 528 ING Vysya Bank Ltd. 55,914 468 Emami Ltd. 60,451 439 CESC Ltd. 62,212 433 Jammu & Kashmir Bank Ltd. 18,934 419 MAX India Ltd. 137,997 417 Apollo Tyres Ltd. 225,464 404 Biocon Ltd. 57,919 401 * Just Dial Ltd. 17,558 398 Arvind Ltd. 164,332 389 Bhushan Steel Ltd. 51,363 381 Bajaj Finserv Ltd. 34,801 378 Tata Global Beverages Ltd. 165,766 373 Ipca Laboratories Ltd. 26,037 344 Bajaj Finance Ltd. 12,793 312 Hexaware Technologies Ltd. 145,401 311 Torrent Pharmaceuticals Ltd. 34,950 301 Petronet LNG Ltd. 161,848 284 Thermax Ltd. 26,379 266 IFCI Ltd. 715,531 260 Indian Hotels Co. Ltd. 277,839 256
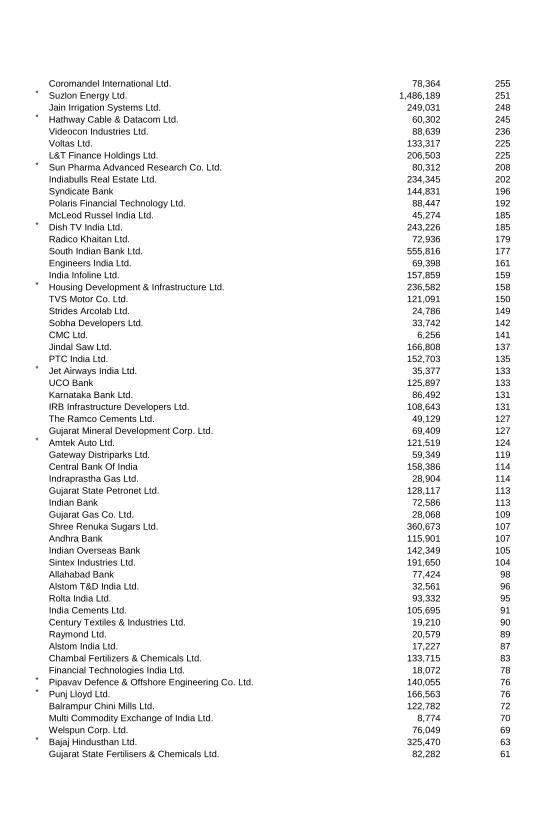
Coromandel International Ltd. 78,364 255 * Suzlon Energy Ltd. 1,486,189 251 Jain Irrigation Systems Ltd. 249,031 248 * Hathway Cable & Datacom Ltd. 60,302 245 Videocon Industries Ltd. 88,639 236 Voltas Ltd. 133,317 225 L&T Finance Holdings Ltd. 206,503 225 * Sun Pharma Advanced Research Co. Ltd. 80,312 208 Indiabulls Real Estate Ltd. 234,345 202 Syndicate Bank 144,831 196 Polaris Financial Technology Ltd. 88,447 192 McLeod Russel India Ltd. 45,274 185 * Dish TV India Ltd. 243,226 185 Radico Khaitan Ltd. 72,936 179 South Indian Bank Ltd. 555,816 177 Engineers India Ltd. 69,398 161 India Infoline Ltd. 157,859 159 * Housing Development & Infrastructure Ltd. 236,582 158 TVS Motor Co. Ltd. 121,091 150 Strides Arcolab Ltd. 24,786 149 Sobha Developers Ltd. 33,742 142 CMC Ltd. 6,256 141 Jindal Saw Ltd. 166,808 137 PTC India Ltd. 152,703 135 * Jet Airways India Ltd. 35,377 133 UCO Bank 125,897 133 Karnataka Bank Ltd. 86,492 131 IRB Infrastructure Developers Ltd. 108,643 131 The Ramco Cements Ltd. 49,129 127 Gujarat Mineral Development Corp. Ltd. 69,409 127 * Amtek Auto Ltd. 121,519 124 Gateway Distriparks Ltd. 59,349 119 Central Bank Of India 158,386 114 Indraprastha Gas Ltd. 28,904 114 Gujarat State Petronet Ltd. 128,117 113 Indian Bank 72,586 113 Gujarat Gas Co. Ltd. 28,068 109 Shree Renuka Sugars Ltd. 360,673 107 Andhra Bank 115,901 107 Indian Overseas Bank 142,349 105 Sintex Industries Ltd. 191,650 104 Allahabad Bank 77,424 98 Alstom T&D India Ltd. 32,561 96 Rolta India Ltd. 93,332 95 India Cements Ltd. 105,695 91 Century Textiles & Industries Ltd. 19,210 90 Raymond Ltd. 20,579 89 Alstom India Ltd. 17,227 87 Chambal Fertilizers & Chemicals Ltd. 133,715 83 Financial Technologies India Ltd. 18,072 78 * Pipavav Defence & Offshore Engineering Co. Ltd. 140,055 76 * Punj Lloyd Ltd. 166,563 76 Balrampur Chini Mills Ltd. 122,782 72 Multi Commodity Exchange of India Ltd. 8,774 70 Welspun Corp. Ltd. 76,049 69 * Bajaj Hindusthan Ltd. 325,470 63 Gujarat State Fertilisers & Chemicals Ltd. 82,282 61
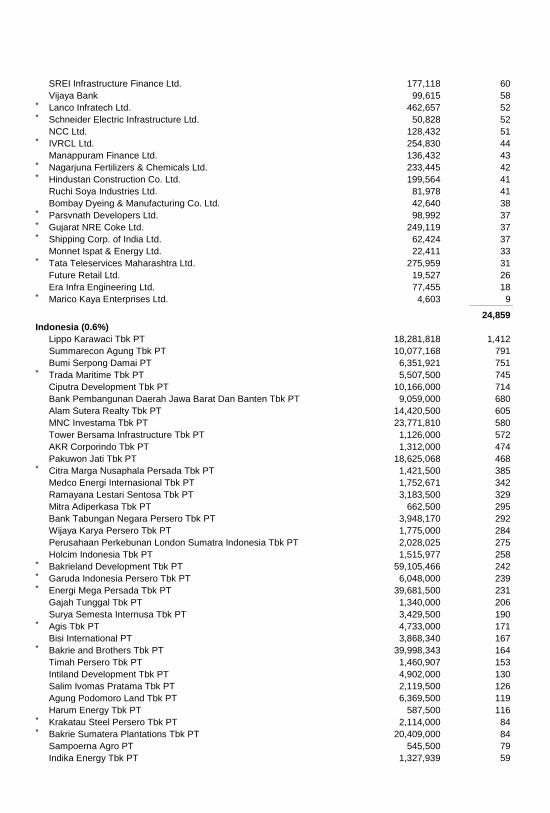
SREI Infrastructure Finance Ltd. 177,118 60 Vijaya Bank 99,615 58 * Lanco Infratech Ltd. 462,657 52 * Schneider Electric Infrastructure Ltd. 50,828 52 NCC Ltd. 128,432 51 * IVRCL Ltd. 254,830 44 Manappuram Finance Ltd. 136,432 43 * Nagarjuna Fertilizers & Chemicals Ltd. 233,445 42 * Hindustan Construction Co. Ltd. 199,564 41 Ruchi Soya Industries Ltd. 81,978 41 Bombay Dyeing & Manufacturing Co. Ltd. 42,640 38 * Parsvnath Developers Ltd. 98,992 37 * Gujarat NRE Coke Ltd. 249,119 37 * Shipping Corp. of India Ltd. 62,424 37 Monnet Ispat & Energy Ltd. 22,411 33 * Tata Teleservices Maharashtra Ltd. 275,959 31 Future Retail Ltd. 19,527 26 Era Infra Engineering Ltd. 77,455 18 * Marico Kaya Enterprises Ltd. 4,603 9 _____________
24,859
Indonesia (0.6%)
Lippo Karawaci Tbk PT 18,281,818 1,412 Summarecon Agung Tbk PT 10,077,168 791 Bumi Serpong Damai PT 6,351,921 751 * Trada Maritime Tbk PT 5,507,500 745 Ciputra Development Tbk PT 10,166,000 714 Bank Pembangunan Daerah Jawa Barat Dan Banten Tbk PT 9,059,000 680 Alam Sutera Realty Tbk PT 14,420,500 605 MNC Investama Tbk PT 23,771,810 580 Tower Bersama Infrastructure Tbk PT 1,126,000 572 AKR Corporindo Tbk PT 1,312,000 474 Pakuwon Jati Tbk PT 18,625,068 468 * Citra Marga Nusaphala Persada Tbk PT 1,421,500 385 Medco Energi Internasional Tbk PT 1,752,671 342 Ramayana Lestari Sentosa Tbk PT 3,183,500 329 Mitra Adiperkasa Tbk PT 662,500 295 Bank Tabungan Negara Persero Tbk PT 3,948,170 292 Wijaya Karya Persero Tbk PT 1,775,000 284 Perusahaan Perkebunan London Sumatra Indonesia Tbk PT 2,028,025 275 Holcim Indonesia Tbk PT 1,515,977 258 * Bakrieland Development Tbk PT 59,105,466 242 * Garuda Indonesia Persero Tbk PT 6,048,000 239 * Energi Mega Persada Tbk PT 39,681,500 231 Gajah Tunggal Tbk PT 1,340,000 206 Surya Semesta Internusa Tbk PT 3,429,500 190 * Agis Tbk PT 4,733,000 171 Bisi International PT 3,868,340 167 * Bakrie and Brothers Tbk PT 39,998,343 164 Timah Persero Tbk PT 1,460,907 153 Intiland Development Tbk PT 4,902,000 130 Salim Ivomas Pratama Tbk PT 2,119,500 126 Agung Podomoro Land Tbk PT 6,369,500 119 Harum Energy Tbk PT 587,500 116 * Krakatau Steel Persero Tbk PT 2,114,000 84 * Bakrie Sumatera Plantations Tbk PT 20,409,000 84 Sampoerna Agro PT 545,500 79 Indika Energy Tbk PT 1,327,939 59
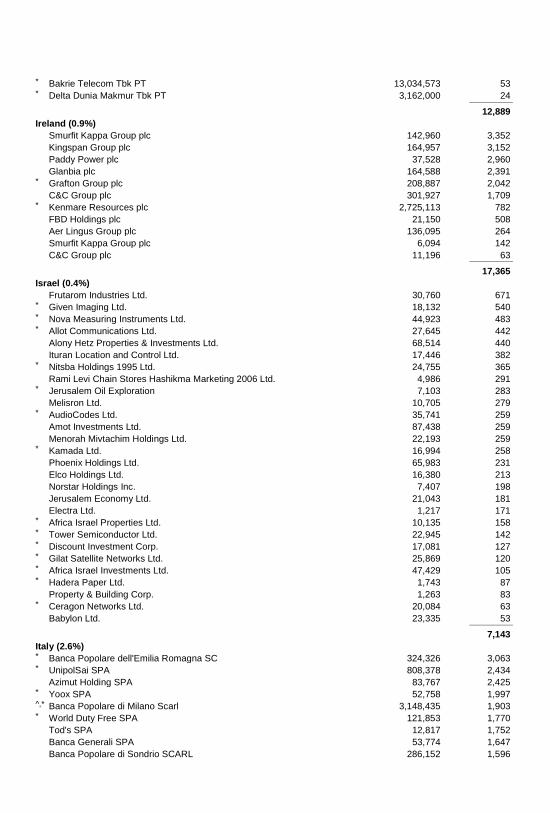
* Bakrie Telecom Tbk PT 13,034,573 53 * Delta Dunia Makmur Tbk PT 3,162,000 24 _____________
12,889
Ireland (0.9%)
Smurfit Kappa Group plc 142,960 3,352 Kingspan Group plc 164,957 3,152 Paddy Power plc 37,528 2,960 Glanbia plc 164,588 2,391 * Grafton Group plc 208,887 2,042 C&C Group plc 301,927 1,709 * Kenmare Resources plc 2,725,113 782 FBD Holdings plc 21,150 508 Aer Lingus Group plc 136,095 264 Smurfit Kappa Group plc 6,094 142 C&C Group plc 11,196 63 _____________
17,365
Israel (0.4%)
Frutarom Industries Ltd. 30,760 671 * Given Imaging Ltd. 18,132 540 * Nova Measuring Instruments Ltd. 44,923 483 * Allot Communications Ltd. 27,645 442 Alony Hetz Properties & Investments Ltd. 68,514 440 Ituran Location and Control Ltd. 17,446 382 * Nitsba Holdings 1995 Ltd. 24,755 365 Rami Levi Chain Stores Hashikma Marketing 2006 Ltd. 4,986 291 * Jerusalem Oil Exploration 7,103 283 Melisron Ltd. 10,705 279 * AudioCodes Ltd. 35,741 259 Amot Investments Ltd. 87,438 259 Menorah Mivtachim Holdings Ltd. 22,193 259 * Kamada Ltd. 16,994 258 Phoenix Holdings Ltd. 65,983 231 Elco Holdings Ltd. 16,380 213 Norstar Holdings Inc. 7,407 198 Jerusalem Economy Ltd. 21,043 181 Electra Ltd. 1,217 171 * Africa Israel Properties Ltd. 10,135 158 * Tower Semiconductor Ltd. 22,945 142 * Discount Investment Corp. 17,081 127 * Gilat Satellite Networks Ltd. 25,869 120 * Africa Israel Investments Ltd. 47,429 105 * Hadera Paper Ltd. 1,743 87 Property & Building Corp. 1,263 83 * Ceragon Networks Ltd. 20,084 63 Babylon Ltd. 23,335 53 _____________
7,143
Italy (2.6%)
* Banca Popolare dell'Emilia Romagna SC 324,326 3,063 * UnipolSai SPA 808,378 2,434 Azimut Holding SPA 83,767 2,425 * Yoox SPA 52,758 1,997 ^,* Banca Popolare di Milano Scarl 3,148,435 1,903 * World Duty Free SPA 121,853 1,770 Tod's SPA 12,817 1,752 Banca Generali SPA 53,774 1,647 Banca Popolare di Sondrio SCARL 286,152 1,596
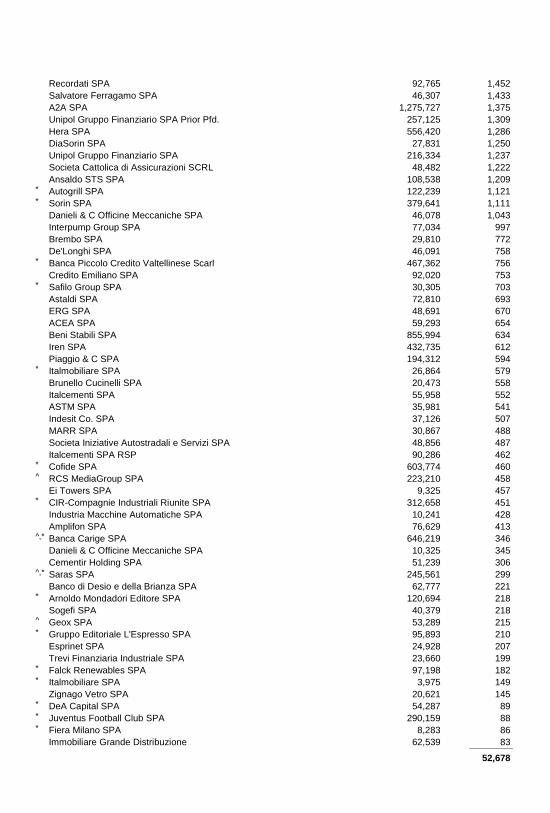
Recordati SPA 92,765 1,452 Salvatore Ferragamo SPA 46,307 1,433 A2A SPA 1,275,727 1,375 Unipol Gruppo Finanziario SPA Prior Pfd. 257,125 1,309 Hera SPA 556,420 1,286 DiaSorin SPA 27,831 1,250 Unipol Gruppo Finanziario SPA 216,334 1,237 Societa Cattolica di Assicurazioni SCRL 48,482 1,222 Ansaldo STS SPA 108,538 1,209 * Autogrill SPA 122,239 1,121 * Sorin SPA 379,641 1,111 Danieli & C Officine Meccaniche SPA 46,078 1,043 Interpump Group SPA 77,034 997 Brembo SPA 29,810 772 De'Longhi SPA 46,091 758 * Banca Piccolo Credito Valtellinese Scarl 467,362 756 Credito Emiliano SPA 92,020 753 * Safilo Group SPA 30,305 703 Astaldi SPA 72,810 693 ERG SPA 48,691 670 ACEA SPA 59,293 654 Beni Stabili SPA 855,994 634 Iren SPA 432,735 612 Piaggio & C SPA 194,312 594 * Italmobiliare SPA 26,864 579 Brunello Cucinelli SPA 20,473 558 Italcementi SPA 55,958 552 ASTM SPA 35,981 541 Indesit Co. SPA 37,126 507 MARR SPA 30,867 488 Societa Iniziative Autostradali e Servizi SPA 48,856 487 Italcementi SPA RSP 90,286 462 * Cofide SPA 603,774 460 ^ RCS MediaGroup SPA 223,210 458 Ei Towers SPA 9,325 457 * CIR-Compagnie Industriali Riunite SPA 312,658 451 Industria Macchine Automatiche SPA 10,241 428 Amplifon SPA 76,629 413 ^,* Banca Carige SPA 646,219 346 Danieli & C Officine Meccaniche SPA 10,325 345 Cementir Holding SPA 51,239 306 ^,* Saras SPA 245,561 299 Banco di Desio e della Brianza SPA 62,777 221 * Arnoldo Mondadori Editore SPA 120,694 218 Sogefi SPA 40,379 218 ^ Geox SPA 53,289 215 * Gruppo Editoriale L'Espresso SPA 95,893 210 Esprinet SPA 24,928 207 Trevi Finanziaria Industriale SPA 23,660 199 * Falck Renewables SPA 97,198 182 * Italmobiliare SPA 3,975 149 Zignago Vetro SPA 20,621 145 * DeA Capital SPA 54,287 89 * Juventus Football Club SPA 290,159 88 * Fiera Milano SPA 8,283 86 Immobiliare Grande Distribuzione 62,539 83 _____________
52,678
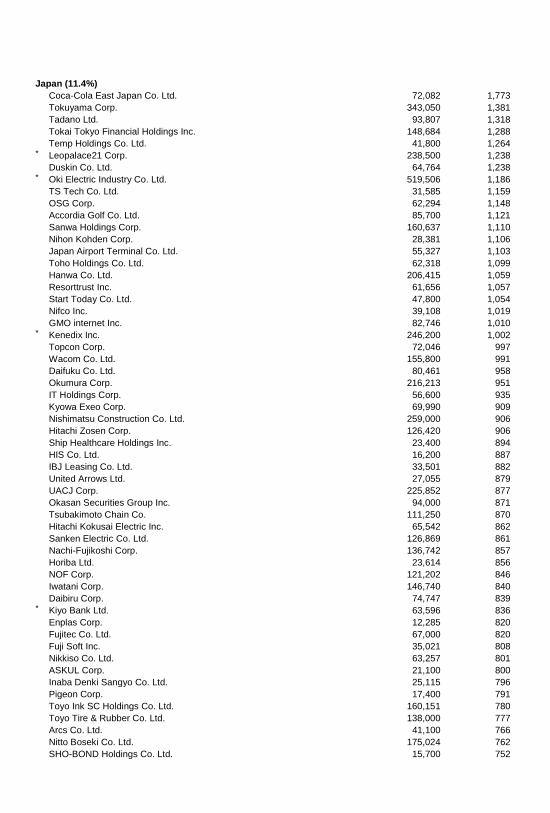
Japan (11.4%)
Coca-Cola East Japan Co. Ltd. 72,082 1,773 Tokuyama Corp. 343,050 1,381 Tadano Ltd. 93,807 1,318 Tokai Tokyo Financial Holdings Inc. 148,684 1,288 Temp Holdings Co. Ltd. 41,800 1,264 * Leopalace21 Corp. 238,500 1,238 Duskin Co. Ltd. 64,764 1,238 * Oki Electric Industry Co. Ltd. 519,506 1,186 TS Tech Co. Ltd. 31,585 1,159 OSG Corp. 62,294 1,148 Accordia Golf Co. Ltd. 85,700 1,121 Sanwa Holdings Corp. 160,637 1,110 Nihon Kohden Corp. 28,381 1,106 Japan Airport Terminal Co. Ltd. 55,327 1,103 Toho Holdings Co. Ltd. 62,318 1,099 Hanwa Co. Ltd. 206,415 1,059 Resorttrust Inc. 61,656 1,057 Start Today Co. Ltd. 47,800 1,054 Nifco Inc. 39,108 1,019 GMO internet Inc. 82,746 1,010 * Kenedix Inc. 246,200 1,002 Topcon Corp. 72,046 997 Wacom Co. Ltd. 155,800 991 Daifuku Co. Ltd. 80,461 958 Okumura Corp. 216,213 951 IT Holdings Corp. 56,600 935 Kyowa Exeo Corp. 69,990 909 Nishimatsu Construction Co. Ltd. 259,000 906 Hitachi Zosen Corp. 126,420 906 Ship Healthcare Holdings Inc. 23,400 894 HIS Co. Ltd. 16,200 887 IBJ Leasing Co. Ltd. 33,501 882 United Arrows Ltd. 27,055 879 UACJ Corp. 225,852 877 Okasan Securities Group Inc. 94,000 871 Tsubakimoto Chain Co. 111,250 870 Hitachi Kokusai Electric Inc. 65,542 862 Sanken Electric Co. Ltd. 126,869 861 Nachi-Fujikoshi Corp. 136,742 857 Horiba Ltd. 23,614 856 NOF Corp. 121,202 846 Iwatani Corp. 146,740 840 Daibiru Corp. 74,747 839 * Kiyo Bank Ltd. 63,596 836 Enplas Corp. 12,285 820 Fujitec Co. Ltd. 67,000 820 Fuji Soft Inc. 35,021 808 Nikkiso Co. Ltd. 63,257 801 ASKUL Corp. 21,100 800 Inaba Denki Sangyo Co. Ltd. 25,115 796 Pigeon Corp. 17,400 791 Toyo Ink SC Holdings Co. Ltd. 160,151 780 Toyo Tire & Rubber Co. Ltd. 138,000 777 Arcs Co. Ltd. 41,100 766 Nitto Boseki Co. Ltd. 175,024 762 SHO-BOND Holdings Co. Ltd. 15,700 752
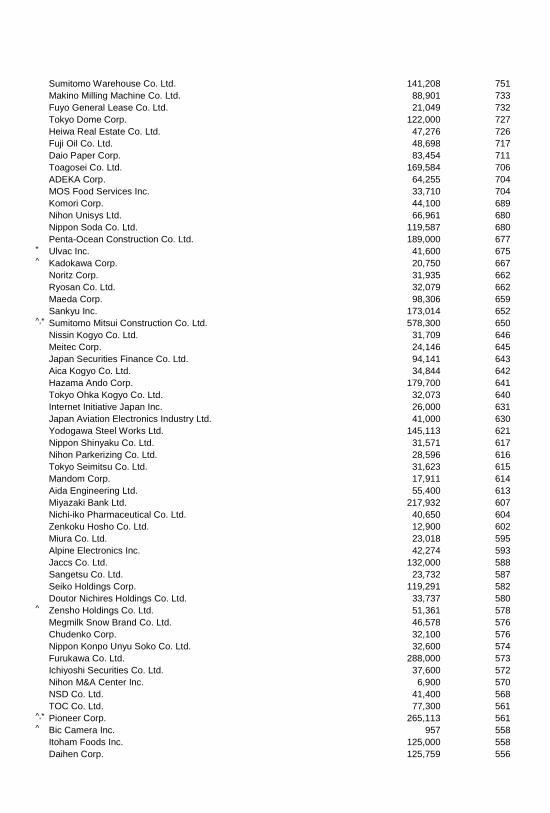
Sumitomo Warehouse Co. Ltd. 141,208 751 Makino Milling Machine Co. Ltd. 88,901 733 Fuyo General Lease Co. Ltd. 21,049 732 Tokyo Dome Corp. 122,000 727 Heiwa Real Estate Co. Ltd. 47,276 726 Fuji Oil Co. Ltd. 48,698 717 Daio Paper Corp. 83,454 711 Toagosei Co. Ltd. 169,584 706 ADEKA Corp. 64,255 704 MOS Food Services Inc. 33,710 704 Komori Corp. 44,100 689 Nihon Unisys Ltd. 66,961 680 Nippon Soda Co. Ltd. 119,587 680 Penta-Ocean Construction Co. Ltd. 189,000 677 * Ulvac Inc. 41,600 675 ^ Kadokawa Corp. 20,750 667 Noritz Corp. 31,935 662 Ryosan Co. Ltd. 32,079 662 Maeda Corp. 98,306 659 Sankyu Inc. 173,014 652 ^,* Sumitomo Mitsui Construction Co. Ltd. 578,300 650 Nissin Kogyo Co. Ltd. 31,709 646 Meitec Corp. 24,146 645 Japan Securities Finance Co. Ltd. 94,141 643 Aica Kogyo Co. Ltd. 34,844 642 Hazama Ando Corp. 179,700 641 Tokyo Ohka Kogyo Co. Ltd. 32,073 640 Internet Initiative Japan Inc. 26,000 631 Japan Aviation Electronics Industry Ltd. 41,000 630 Yodogawa Steel Works Ltd. 145,113 621 Nippon Shinyaku Co. Ltd. 31,571 617 Nihon Parkerizing Co. Ltd. 28,596 616 Tokyo Seimitsu Co. Ltd. 31,623 615 Mandom Corp. 17,911 614 Aida Engineering Ltd. 55,400 613 Miyazaki Bank Ltd. 217,932 607 Nichi-iko Pharmaceutical Co. Ltd. 40,650 604 Zenkoku Hosho Co. Ltd. 12,900 602 Miura Co. Ltd. 23,018 595 Alpine Electronics Inc. 42,274 593 Jaccs Co. Ltd. 132,000 588 Sangetsu Co. Ltd. 23,732 587 Seiko Holdings Corp. 119,291 582 Doutor Nichires Holdings Co. Ltd. 33,737 580 ^ Zensho Holdings Co. Ltd. 51,361 578 Megmilk Snow Brand Co. Ltd. 46,578 576 Chudenko Corp. 32,100 576 Nippon Konpo Unyu Soko Co. Ltd. 32,600 574 Furukawa Co. Ltd. 288,000 573 Ichiyoshi Securities Co. Ltd. 37,600 572 Nihon M&A Center Inc. 6,900 570 NSD Co. Ltd. 41,400 568 TOC Co. Ltd. 77,300 561 ^,* Pioneer Corp. 265,113 561 ^ Bic Camera Inc. 957 558 Itoham Foods Inc. 125,000 558 Daihen Corp. 125,759 556
Showa Corp. 41,800 554 Okabe Co. Ltd. 44,000 550 Xebio Co. Ltd. 27,508 549 Kyoei Steel Ltd. 27,200 546 ^ Dwango Co. Ltd. 21,800 545 Bank of Okinawa Ltd. 14,804 543 Hogy Medical Co. Ltd. 10,450 543 CKD Corp. 54,000 542 Bank of Iwate Ltd. 12,124 537 Nichicon Corp. 62,787 536 Akebono Brake Industry Co. Ltd. 115,757 535 * Mitsumi Electric Co. Ltd. 75,300 535 AOKI Holdings Inc. 32,276 532 Iino Kaiun Kaisha Ltd. 96,800 530 Nihon Nohyaku Co. Ltd. 38,000 529 MonotaRO Co. Ltd. 24,600 528 Asahi Intecc Co. Ltd. 13,000 526 Meidensha Corp. 129,919 520 Amano Corp. 49,956 519 TSI Holdings Co. Ltd. 86,700 517 Ariake Japan Co. Ltd. 20,200 514 Kyudenko Corp. 66,000 513 Taikisha Ltd. 23,663 513 * Nippon Chemi-Con Corp. 156,696 512 Colowide Co. Ltd. 48,500 509 Ain Pharmaciez Inc. 10,200 504 Nippon Steel & Sumikin Bussan Corp. 133,920 502 Sanyo Special Steel Co. Ltd. 111,472 501 Central Glass Co. Ltd. 160,015 500 Yamanashi Chuo Bank Ltd. 117,311 499 Toei Co. Ltd. 81,648 499 Sanyo Chemical Industries Ltd. 71,274 498 FCC Co. Ltd. 25,843 497 Mirait Holdings Corp. 56,200 494 ZERIA Pharmaceutical Co. Ltd. 18,700 493 Daiseki Co. Ltd. 26,787 489 Monex Group Inc. 116,600 488 Toho Bank Ltd. 159,664 488 Nippon Flour Mills Co. Ltd. 97,459 486 Fujitsu General Ltd. 41,000 484 Takuma Co. Ltd. 54,000 483 Shinmaywa Industries Ltd. 56,000 480 Morinaga Milk Industry Co. Ltd. 162,678 478 Keihin Corp. 32,349 478 Hokuto Corp. 25,824 477 Relo Holdings Inc. 9,100 476 Transcosmos Inc. 22,700 473 Daikyo Inc. 193,000 471 Maruha Nichiro Holdings Inc. 283,212 469 Fuji Seal International Inc. 14,000 465 Yaoko Co. Ltd. 11,200 464 Kureha Corp. 101,338 462 Sakata Seed Corp. 36,056 460 Yoshinoya Holdings Co. Ltd. 32,300 460 Okinawa Electric Power Co. Inc. 14,540 458 ^,* Kumagai Gumi Co. Ltd. 177,000 457 Nitto Kogyo Corp. 26,387 456
Seikagaku Corp. 30,564 455 Iseki & Co. Ltd. 162,000 453 Valor Co. Ltd. 34,000 453 Avex Group Holdings Inc. 19,900 452 Oiles Corp. 19,390 451 NEC Networks & System Integration Corp. 19,300 450 * Tokyo Steel Manufacturing Co. Ltd. 89,400 449 ^,* Nissha Printing Co. Ltd. 30,600 444 Nippon Densetsu Kogyo Co. Ltd. 34,403 444 San-A Co. Ltd. 15,644 443 Earth Chemical Co. Ltd. 13,143 442 ^ Mizuno Corp. 87,782 441 Welcia Holdings Co. Ltd. 7,600 441 Kanamoto Co. Ltd. 17,000 440 Kanematsu Corp. 257,000 438 Musashi Seimitsu Industry Co. Ltd. 22,215 438 Aderans Co. Ltd. 40,309 434 Yachiyo Bank Ltd. 16,400 432 Joshin Denki Co. Ltd. 56,653 431 Cocokara fine Inc. 17,389 431 Nippon Signal Co. Ltd. 49,200 431 Yamagata Bank Ltd. 109,426 430 Oita Bank Ltd. 106,435 429 Akita Bank Ltd. 161,000 429 Bank of the Ryukyus Ltd. 34,419 429 Yokogawa Bridge Holdings Corp. 31,000 426 Ricoh Leasing Co. Ltd. 16,006 426 Toshiba Plant Systems & Services Corp. 28,524 425 Asahi Diamond Industrial Co. Ltd. 39,722 423 Aomori Bank Ltd. 161,000 423 Pilot Corp. 13,800 422 Takasago Thermal Engineering Co. Ltd. 47,016 422 Kitz Corp. 89,136 415 Sanden Corp. 87,000 413 Towa Pharmaceutical Co. Ltd. 10,218 413 Fancl Corp. 37,504 412 ^ Tamron Co. Ltd. 17,000 410 * Toa Corp. 187,000 407 Nichias Corp. 58,855 407 Japan Wool Textile Co. Ltd. 56,189 406 Ai Holdings Corp. 30,200 405 Nippon Light Metal Holdings Co. Ltd. 287,023 404 Takara Standard Co. Ltd. 56,098 403 Kisoji Co. Ltd. 21,900 403 Kintetsu World Express Inc. 10,200 402 Star Micronics Co. Ltd. 34,700 401 Toho Zinc Co. Ltd. 113,758 401 Senshukai Co. Ltd. 48,000 400 Gunze Ltd. 154,079 399 T-Gaia Corp. 32,400 398 Futaba Corp. 32,080 397 Nippon Seiki Co. Ltd. 21,000 397 Aichi Steel Corp. 99,029 395 Hokuetsu Kishu Paper Co. Ltd. 90,221 392 Nippon Synthetic Chemical Industry Co. Ltd. 44,000 392 Chiyoda Co. Ltd. 20,000 390 Saizeriya Co. Ltd. 32,921 389
Saibu Gas Co. Ltd. 164,734 389 Totetsu Kogyo Co. Ltd. 19,300 389 Kyokuto Kaihatsu Kogyo Co. Ltd. 28,300 388 Mitsui-Soko Co. Ltd. 88,762 388 Aeon Delight Co. Ltd. 19,300 388 Shima Seiki Manufacturing Ltd. 23,600 386 Mitsui Sugar Co. Ltd. 91,000 384 Broadleaf Co. Ltd. 23,700 384 Mitsuba Corp. 23,000 384 Denki Kogyo Co. Ltd. 58,400 379 DTS Corp. 20,000 379 Gurunavi Inc. 13,400 377 Goldcrest Co. Ltd. 15,180 376 Daiwabo Holdings Co. Ltd. 190,761 375 Sintokogio Ltd. 49,000 374 * Nippon Suisan Kaisha Ltd. 182,562 374 Unipres Corp. 20,800 373 Kyokuto Securities Co. Ltd. 19,800 368 Morinaga & Co. Ltd. 170,518 367 Bank of Nagoya Ltd. 112,121 367 EDION Corp. 65,933 366 Seiren Co. Ltd. 47,500 366 Toyo Engineering Corp. 84,000 366 Nagaileben Co. Ltd. 22,200 365 ^ Sato Holdings Corp. 16,500 364 Inabata & Co. Ltd. 32,600 363 Chofu Seisakusho Co. Ltd. 16,300 362 Daisan Bank Ltd. 211,037 359 Paltac Corp. 26,900 358 Round One Corp. 38,400 358 Hosiden Corp. 71,067 357 ^ Dr Ci:Labo Co. Ltd. 11,700 357 Sankyo Tateyama Inc. 15,300 357 Paramount Bed Holdings Co. Ltd. 10,900 354 Shikoku Bank Ltd. 160,003 352 Tokai Corp. 11,800 352 Tokyotokeiba Co. Ltd. 102,000 351 TOMONY Holdings Inc. 87,200 343 Heiwado Co. Ltd. 24,700 343 Sanki Engineering Co. Ltd. 55,767 342 Tomy Co. Ltd. 75,817 341 TPR Co. Ltd. 20,100 340 Okamura Corp. 41,000 340 Kurabo Industries Ltd. 189,000 340 Moshi Moshi Hotline Inc. 32,500 340 Nisshin Oillio Group Ltd. 102,262 338 Marudai Food Co. Ltd. 112,591 338 * Ishihara Sangyo Kaisha Ltd. 291,000 338 Nitta Corp. 14,800 335 Kato Works Co. Ltd. 57,205 335 Misawa Homes Co. Ltd. 23,600 333 DCM Holdings Co. Ltd. 49,152 330 Ryobi Ltd. 80,435 328 ^,* Nippon Yakin Kogyo Co. Ltd. 112,500 326 Wakita & Co. Ltd. 29,000 325 Osaka Steel Co. Ltd. 19,200 325 JCR Pharmaceuticals Co. Ltd. 15,100 324
Namura Shipbuilding Co. Ltd. 23,800 323 Tokyo Tomin Bank Ltd. 32,300 323 Nishio Rent All Co. Ltd. 12,100 321 Yorozu Corp. 17,344 319 Kumiai Chemical Industry Co. Ltd. 55,000 318 Nichiden Corp. 14,600 318 Mitsuboshi Belting Co. Ltd. 57,000 318 Japan Vilene Co. Ltd. 49,889 316 Tsugami Corp. 55,000 315 Marusan Securities Co. Ltd. 34,295 313 Toyo Tanso Co. Ltd. 16,010 312 Ehime Bank Ltd. 145,000 312 Torii Pharmaceutical Co. Ltd. 10,300 311 Kuroda Electric Co. Ltd. 20,300 311 Eagle Industry Co. Ltd. 19,000 311 Canon Electronics Inc. 16,294 310 * Daiei Inc. 106,450 309 Sekisui Jushi Corp. 22,000 308 Geo Holdings Corp. 32,400 308 Hokuetsu Bank Ltd. 155,870 304 ^ NET One Systems Co. Ltd. 48,800 303 Fujimi Inc. 24,547 302 Plenus Co. Ltd. 12,900 302 Nippon Denko Co. Ltd. 103,990 300 Alpen Co. Ltd. 16,200 299 Izumiya Co. Ltd. 67,969 298 ^ Japan Drilling Co. Ltd. 5,800 297 Shinko Plantech Co. Ltd. 39,200 294 TOKAI Holdings Corp. 91,100 294 Tecmo Koei Holdings Co. Ltd. 24,100 293 Gulliver International Co. Ltd. 40,700 293 Nitto Kohki Co. Ltd. 16,400 292 kabu.com Securities Co. Ltd. 52,900 291 ^ Fuji Kyuko Co. Ltd. 35,000 291 PGM Holdings K K 31,500 290 Nippon Thompson Co. Ltd. 59,000 289 Max Co. Ltd. 26,000 289 Minato Bank Ltd. 171,000 288 ^,* Tekken Corp. 103,000 288 Kato Sangyo Co. Ltd. 15,700 285 Prima Meat Packers Ltd. 156,000 284 Kurimoto Ltd. 122,000 281 Japan Pure Chemical Co. Ltd. 129 280 Noritake Co. Ltd. 114,000 280 Ryoyo Electro Corp. 26,342 276 Itochu Enex Co. Ltd. 47,600 276 Nippon Road Co. Ltd. 51,000 273 Token Corp. 5,862 272 Eighteenth Bank Ltd. 123,000 271 Megachips Corp. 19,973 271 Shizuoka Gas Co. Ltd. 45,800 270 Aiphone Co. Ltd. 16,500 270 ^ COOKPAD Inc. 8,200 269 Oyo Corp. 17,000 266 Shindengen Electric Manufacturing Co. Ltd. 43,000 265 * Unitika Ltd. 419,000 263 Fujimori Kogyo Co. Ltd. 11,300 262

Descente Ltd. 40,000 262 Topre Corp. 20,300 261 Wood One Co. Ltd. 83,000 261 Noevir Holdings Co. Ltd. 14,200 261 Higashi-Nippon Bank Ltd. 102,660 261 Godo Steel Ltd. 154,000 260 Obara Group Inc. 8,300 260 Milbon Co. Ltd. 7,260 259 Modec Inc. 9,500 259 Fukui Bank Ltd. 112,769 258 Toshiba Machine Co. Ltd. 48,000 257 Daido Metal Co. Ltd. 24,000 257 Nichii Gakkan Co. 30,200 255 Taiyo Holdings Co. Ltd. 7,900 255 Showa Sangyo Co. Ltd. 79,000 253 Takara Leben Co. Ltd. 78,000 250 Riso Kagaku Corp. 12,600 250 Ministop Co. Ltd. 15,500 248 Mitsubishi Pencil Co. Ltd. 10,600 247 Michinoku Bank Ltd. 124,000 244 * Tokyo Rope Manufacturing Co. Ltd. 154,000 244 ^ Kappa Create Holdings Co. Ltd. 12,494 243 As One Corp. 10,700 242 Mani Inc. 6,300 241 Sanyo Shokai Ltd. 89,423 240 Atsugi Co. Ltd. 210,000 238 Tachi-S Co. Ltd. 17,600 238 ^ WATAMI Co. Ltd. 17,100 237 Trusco Nakayama Corp. 10,200 237 Mitsubishi Steel Manufacturing Co. Ltd. 96,000 237 Nippon Gas Co. Ltd. 22,400 235 Okamoto Industries Inc. 71,000 233 * SWCC Showa Holdings Co. Ltd. 217,000 233 Bunka Shutter Co. Ltd. 38,000 232 Koa Corp. 21,300 232 Asahi Holdings Inc. 12,300 230 Fuji Co. Ltd. 13,700 229 Raito Kogyo Co. Ltd. 33,900 229 Sakai Chemical Industry Co. Ltd. 74,522 226 Riken Corp. 48,000 225 Shibusawa Warehouse Co. Ltd. 63,549 225 SMK Corp. 47,000 224 Senko Co. Ltd. 45,000 221 Toyo Kanetsu KK 80,000 220 Arcland Sakamoto Co. Ltd. 13,000 219 TKC Corp. 11,749 219 Toyo Construction Co. Ltd. 60,800 217 Eizo Corp. 8,600 216 FIDEA Holdings Co. Ltd. 109,100 213 Shiroki Corp. 95,689 213 * Chiba Kogyo Bank Ltd. 31,100 213 Topy Industries Ltd. 121,795 213 JVC Kenwood Corp. 113,640 213 Sumitomo Seika Chemicals Co. Ltd. 27,000 212 * Sasebo Heavy Industries Co. Ltd. 162,000 212 Royal Holdings Co. Ltd. 14,600 212 Yuasa Trading Co. Ltd. 102,000 211
Yokohama Reito Co. Ltd. 26,800 211 Towa Bank Ltd. 216,000 210 Bando Chemical Industries Ltd. 53,000 210 Nittetsu Mining Co. Ltd. 45,000 209 Daikokutenbussan Co. Ltd. 7,500 208 Konoike Transport Co. Ltd. 14,000 208 Mie Bank Ltd. 94,104 207 Sumitomo Densetsu Co. Ltd. 14,100 206 Mitsubishi Paper Mills Ltd. 215,000 206 Tokushu Tokai Paper Co. Ltd. 100,000 206 Japan Cash Machine Co. Ltd. 10,700 205 Optex Co. Ltd. 13,200 204 Nihon Dempa Kogyo Co. Ltd. 24,290 204 Press Kogyo Co. Ltd. 48,000 204 Morita Holdings Corp. 26,154 203 Tsukuba Bank Ltd. 57,100 201 Chugoku Marine Paints Ltd. 37,000 201 ^ Gun-Ei Chemical Industry Co. Ltd. 48,000 200 Jeol Ltd. 43,000 200 ^ Toho Titanium Co. Ltd. 30,700 199 Melco Holdings Inc. 12,100 199 Fujibo Holdings Inc. 96,000 199 Takasago International Corp. 36,000 198 Vital KSK Holdings Inc. 29,200 197 Yamazen Corp. 33,500 197 Nippon Koei Co. Ltd. 44,000 195 Ines Corp. 26,500 194 ^ Japan Bridge Corp. 105,388 194 CREATE SD HOLDINGS Co. Ltd. 5,706 193 Macnica Inc. 6,500 193 Toko Inc. 58,000 192 Nippon Coke & Engineering Co. Ltd. 143,000 192 Ichibanya Co. Ltd. 5,284 192 * Clarion Co. Ltd. 132,000 190 Sakata INX Corp. 21,000 190 Yahagi Construction Co. Ltd. 20,300 190 Japan Pulp & Paper Co. Ltd. 60,000 189 Bank of Saga Ltd. 87,000 189 Tsukui Corp. 20,000 188 Nippon Beet Sugar Manufacturing Co. Ltd. 97,000 187 Sanyo Denki Co. Ltd. 28,000 186 Shimizu Bank Ltd. 7,300 184 Foster Electric Co. Ltd. 11,285 182 Mars Engineering Corp. 9,500 180 Mitsui Matsushima Co. Ltd. 115,000 179 Goldwin Inc. 40,000 179 * Japan Radio Co. Ltd. 53,000 179 Nomura Co. Ltd. 21,000 179 OBIC Business Consultants Ltd. 5,300 178 Meiko Network Japan Co. Ltd. 16,263 178 Riken Technos Corp. 30,000 177 YAMABIKO Corp. 5,000 176 Keihanshin Building Co. Ltd. 34,100 176 Nohmi Bosai Ltd. 17,000 174 Macromill Inc. 23,000 173 Roland Corp. 13,000 173 Aichi Bank Ltd. 3,700 172
Tsutsumi Jewelry Co. Ltd. 7,500 172 Warabeya Nichiyo Co. Ltd. 8,700 172 Doshisha Co. Ltd. 12,800 172 Krosaki Harima Corp. 76,000 171 Dydo Drinco Inc. 4,244 171 Paris Miki Holdings Inc. 38,200 171 Piolax Inc. 4,500 170 Riso Kyoiku Co. Ltd. 31,030 170 Konishi Co. Ltd. 9,000 169 * Juki Corp. 85,000 166 Hibiya Engineering Ltd. 14,300 166 Idec Corp. 19,100 165 Toli Corp. 81,101 164 Toa Corp. 17,000 163 Weathernews Inc. 6,400 163 Arata Corp. 49,797 163 ^,* Matsuya Co. Ltd. 16,700 163 Funai Electric Co. Ltd. 13,300 162 Tsukishima Kikai Co. Ltd. 16,000 161 * Tokyu Construction Co. Ltd. 37,000 160 Sankyo Seiko Co. Ltd. 45,097 160 * K&O Energy Group Inc. 11,000 159 Kitagawa Iron Works Co. Ltd. 87,000 159 Asahi Organic Chemicals Industry Co. Ltd. 74,555 158 Kasumi Co. Ltd. 23,700 157 Tsurumi Manufacturing Co. Ltd. 13,000 157 Cosel Co. Ltd. 13,600 156 Toyo Securities Co. Ltd. 43,000 156 CONEXIO Corp. 18,800 154 Osaki Electric Co. Ltd. 26,000 153 Roland DG Corp. 4,700 153 UKC Holdings Corp. 9,500 152 Denyo Co. Ltd. 11,200 152 Sodick Co. Ltd. 34,900 150 Tenma Corp. 11,000 150 Kohnan Shoji Co. Ltd. 14,200 150 ^ Atom Corp. 28,400 149 Nippon Parking Development Co. Ltd. 114,200 148 Ohsho Food Service Corp. 4,474 147 Takaoka Toko Holdings Co. Ltd. 8,400 147 Union Tool Co. 5,800 147 Nippon Carbon Co. Ltd. 80,000 146 Kinugawa Rubber Industrial Co. Ltd. 30,000 144 Mitsubishi Research Institute Inc. 6,800 143 Hosokawa Micron Corp. 23,000 143 Belluna Co. Ltd. 29,800 143 Torishima Pump Manufacturing Co. Ltd. 13,200 140 Yellow Hat Ltd. 7,500 139 Tocalo Co. Ltd. 8,300 139 Daiwa Industries Ltd. 21,000 138 Gakken Holdings Co. Ltd. 47,000 138 Kusuri No Aoki Co. Ltd. 2,600 138 Shikoku Chemicals Corp. 18,000 138 Fujiya Co. Ltd. 74,000 136 Ringer Hut Co. Ltd. 9,300 135 Tatsuta Electric Wire and Cable Co. Ltd. 23,000 134 St. Marc Holdings Co. Ltd. 2,800 134
Kura Corp. 8,000 134 Shin-Etsu Polymer Co. Ltd. 36,000 133 Pressance Corp. 4,787 133 Parco Co. Ltd. 14,400 132 Yomiuri Land Co. Ltd. 21,000 131 France Bed Holdings Co. Ltd. 68,000 129 Toyo Corp. 12,617 129 Ohara Inc. 21,930 129 Eiken Chemical Co. Ltd. 7,100 129 Nichiha Corp. 9,400 129 Endo Lighting Corp. 7,100 128 Fujicco Co. Ltd. 11,205 128 T RAD Co. Ltd. 47,000 127 ASKA Pharmaceutical Co. Ltd. 16,000 127 BML Inc. 3,700 126 Nissin Electric Co. Ltd. 24,000 126 Katakura Industries Co. Ltd. 11,000 125 * Uniden Corp. 41,000 123 Aisan Industry Co. Ltd. 13,200 122 Onoken Co. Ltd. 10,000 121 Dainichiseika Color & Chemicals Manufacturing Co. Ltd. 27,000 120 Takiron Co. Ltd. 28,000 120 * Janome Sewing Machine Co. Ltd. 141,000 120 Pronexus Inc. 18,735 120 EPS Corp. 102 118 Nippon Chemiphar Co. Ltd. 26,000 118 Fuji Oil Co. Ltd. 35,900 117 NEC Capital Solutions Ltd. 5,000 117 Daiso Co. Ltd. 33,000 117 Kyodo Printing Co. Ltd. 42,000 117 Achilles Corp. 82,000 116 Nidec Copal Electronics Corp. 15,200 114 Chiyoda Integre Co. Ltd. 6,000 114 Siix Corp. 8,100 114 Tomoku Co. Ltd. 35,000 113 Taihei Dengyo Kaisha Ltd. 18,000 113 Rock Field Co. Ltd. 6,434 113 Kyokuyo Co. Ltd. 43,000 112 Kamei Corp. 15,000 112 Toenec Corp. 18,000 112 Japan Digital Laboratory Co. Ltd. 7,500 112 Yushin Precision Equipment Co. Ltd. 5,100 110 Tochigi Bank Ltd. 28,000 110 Tosho Printing Co. Ltd. 28,000 110 Airport Facilities Co. Ltd. 14,000 110 Toyo Kohan Co. Ltd. 24,000 110 Shinwa Co. Ltd. 9,300 110 KEY Coffee Inc. 7,193 110 Sagami Chain Co. Ltd. 12,000 110 Hisaka Works Ltd. 11,000 108 * NS United Kaiun Kaisha Ltd. 41,000 108 Nippon Ceramic Co. Ltd. 7,000 107 Seika Corp. 45,000 106 Kyoritsu Maintenance Co. Ltd. 3,000 106 Ryoden Trading Co. Ltd. 15,000 106 Maruwa Co. Ltd. 3,100 106 Tokyo Rakutenchi Co. Ltd. 23,000 105
Fuso Pharmaceutical Industries Ltd. 31,000 104 Takamatsu Construction Group Co. Ltd. 5,900 103 Komatsu Seiren Co. Ltd. 21,000 103 NEC Fielding Ltd. 7,300 102 Japan Transcity Corp. 32,192 102 Hamakyorex Co. Ltd. 3,500 102 Kaga Electronics Co. Ltd. 8,200 102 JSP Corp. 6,900 101 Kanaden Corp. 15,000 101 ^,* Yamada SxL Home Co. Ltd. 81,000 101 T Hasegawa Co. Ltd. 7,200 100 * FDK Corp. 66,921 100 Toridoll.corp 11,600 100 Daiichi Jitsugyo Co. Ltd. 22,000 100 GCA Savvian Corp. 11,300 99 Maezawa Kasei Industries Co. Ltd. 9,600 98 Future Architect Inc. 15,900 98 Cawachi Ltd. 5,100 97 Nishimatsuya Chain Co. Ltd. 12,200 97 Asahi Co. Ltd. 7,100 96 Sanoh Industrial Co. Ltd. 13,800 96 Neturen Co. Ltd. 12,700 96 Kitano Construction Corp. 38,000 96 Pacific Industrial Co. Ltd. 15,000 95 * Fudo Tetra Corp. 57,900 95 Kita-Nippon Bank Ltd. 4,000 95 Arakawa Chemical Industries Ltd. 10,700 94 Zenrin Co. Ltd. 10,000 94 Stella Chemifa Corp. 6,200 93 Kanematsu Electronics Ltd. 7,000 93 Chori Co. Ltd. 8,200 93 Fuji Electronics Co. Ltd. 6,700 92 ESPEC Corp. 11,408 92 J-Oil Mills Inc. 33,000 92 Tv Tokyo Holdings Corp. 5,600 91 San-Ai Oil Co. Ltd. 19,000 91 Advan Co. Ltd. 8,000 91 Fujikura Kasei Co. Ltd. 16,000 91 CAC Corp. 10,000 90 Nissin Corp. 33,000 90 Futaba Industrial Co. Ltd. 23,600 90 Koatsu Gas Kogyo Co. Ltd. 16,000 89 Matsuya Foods Co. Ltd. 5,000 89 Fujitsu Frontech Ltd. 6,400 89 Rhythm Watch Co. Ltd. 66,000 88 Dunlop Sports Co. Ltd. 7,000 87 Panasonic Industrial Devices SUNX Co. Ltd. 19,100 87 Maruetsu Inc. 25,000 87 Organo Corp. 19,000 87 Pack Corp. 5,000 87 Mitsuuroko Group Holdings Co. Ltd. 15,700 87 Mitsui High-Tec Inc. 13,000 87 Information Services International-Dentsu Ltd. 8,000 86 Okuwa Co. Ltd. 10,000 86 Mory Industries Inc. 21,000 85 Nippon Valqua Industries Ltd. 31,000 84 NIFTY Corp. 6,500 84
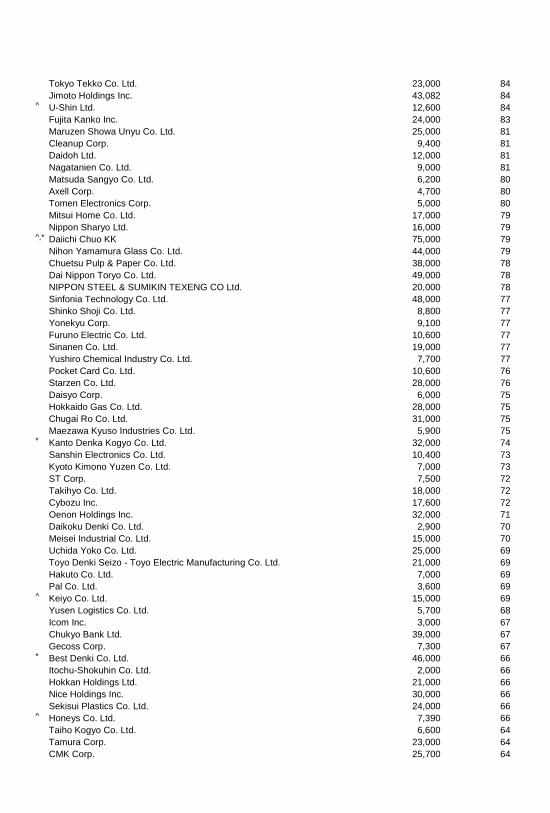
Tokyo Tekko Co. Ltd. 23,000 84 Jimoto Holdings Inc. 43,082 84 ^ U-Shin Ltd. 12,600 84 Fujita Kanko Inc. 24,000 83 Maruzen Showa Unyu Co. Ltd. 25,000 81 Cleanup Corp. 9,400 81 Daidoh Ltd. 12,000 81 Nagatanien Co. Ltd. 9,000 81 Matsuda Sangyo Co. Ltd. 6,200 80 Axell Corp. 4,700 80 Tomen Electronics Corp. 5,000 80 Mitsui Home Co. Ltd. 17,000 79 Nippon Sharyo Ltd. 16,000 79 ^,* Daiichi Chuo KK 75,000 79 Nihon Yamamura Glass Co. Ltd. 44,000 79 Chuetsu Pulp & Paper Co. Ltd. 38,000 78 Dai Nippon Toryo Co. Ltd. 49,000 78 NIPPON STEEL & SUMIKIN TEXENG CO Ltd. 20,000 78 Sinfonia Technology Co. Ltd. 48,000 77 Shinko Shoji Co. Ltd. 8,800 77 Yonekyu Corp. 9,100 77 Furuno Electric Co. Ltd. 10,600 77 Sinanen Co. Ltd. 19,000 77 Yushiro Chemical Industry Co. Ltd. 7,700 77 Pocket Card Co. Ltd. 10,600 76 Starzen Co. Ltd. 28,000 76 Daisyo Corp. 6,000 75 Hokkaido Gas Co. Ltd. 28,000 75 Chugai Ro Co. Ltd. 31,000 75 Maezawa Kyuso Industries Co. Ltd. 5,900 75 * Kanto Denka Kogyo Co. Ltd. 32,000 74 Sanshin Electronics Co. Ltd. 10,400 73 Kyoto Kimono Yuzen Co. Ltd. 7,000 73 ST Corp. 7,500 72 Takihyo Co. Ltd. 18,000 72 Cybozu Inc. 17,600 72 Oenon Holdings Inc. 32,000 71 Daikoku Denki Co. Ltd. 2,900 70 Meisei Industrial Co. Ltd. 15,000 70 Uchida Yoko Co. Ltd. 25,000 69 Toyo Denki Seizo - Toyo Electric Manufacturing Co. Ltd. 21,000 69 Hakuto Co. Ltd. 7,000 69 Pal Co. Ltd. 3,600 69 ^ Keiyo Co. Ltd. 15,000 69 Yusen Logistics Co. Ltd. 5,700 68 Icom Inc. 3,000 67 Chukyo Bank Ltd. 39,000 67 Gecoss Corp. 7,300 67 * Best Denki Co. Ltd. 46,000 66 Itochu-Shokuhin Co. Ltd. 2,000 66 Hokkan Holdings Ltd. 21,000 66 Nice Holdings Inc. 30,000 66 Sekisui Plastics Co. Ltd. 24,000 66 ^ Honeys Co. Ltd. 7,390 66 Taiho Kogyo Co. Ltd. 6,600 64 Tamura Corp. 23,000 64 CMK Corp. 25,700 64
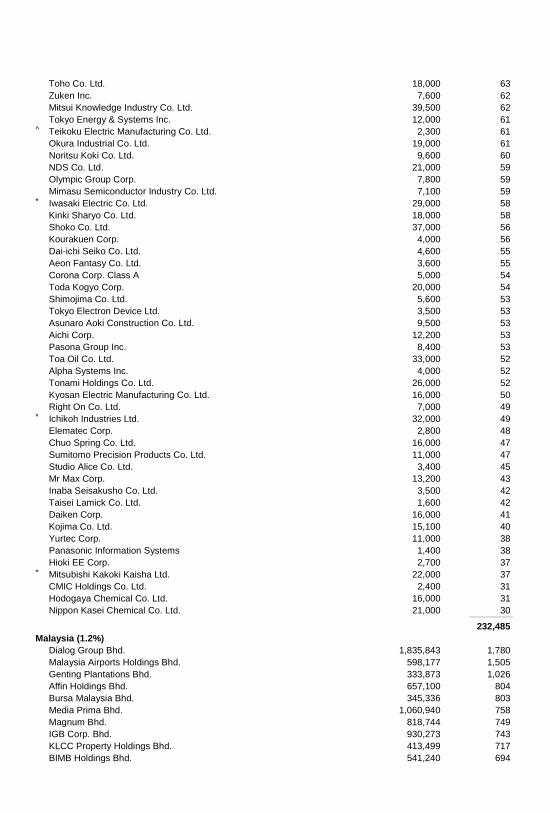
Toho Co. Ltd. 18,000 63 Zuken Inc. 7,600 62 Mitsui Knowledge Industry Co. Ltd. 39,500 62 Tokyo Energy & Systems Inc. 12,000 61 ^ Teikoku Electric Manufacturing Co. Ltd. 2,300 61 Okura Industrial Co. Ltd. 19,000 61 Noritsu Koki Co. Ltd. 9,600 60 NDS Co. Ltd. 21,000 59 Olympic Group Corp. 7,800 59 Mimasu Semiconductor Industry Co. Ltd. 7,100 59 * Iwasaki Electric Co. Ltd. 29,000 58 Kinki Sharyo Co. Ltd. 18,000 58 Shoko Co. Ltd. 37,000 56 Kourakuen Corp. 4,000 56 Dai-ichi Seiko Co. Ltd. 4,600 55 Aeon Fantasy Co. Ltd. 3,600 55 Corona Corp. Class A 5,000 54 Toda Kogyo Corp. 20,000 54 Shimojima Co. Ltd. 5,600 53 Tokyo Electron Device Ltd. 3,500 53 Asunaro Aoki Construction Co. Ltd. 9,500 53 Aichi Corp. 12,200 53 Pasona Group Inc. 8,400 53 Toa Oil Co. Ltd. 33,000 52 Alpha Systems Inc. 4,000 52 Tonami Holdings Co. Ltd. 26,000 52 Kyosan Electric Manufacturing Co. Ltd. 16,000 50 Right On Co. Ltd. 7,000 49 * Ichikoh Industries Ltd. 32,000 49 Elematec Corp. 2,800 48 Chuo Spring Co. Ltd. 16,000 47 Sumitomo Precision Products Co. Ltd. 11,000 47 Studio Alice Co. Ltd. 3,400 45 Mr Max Corp. 13,200 43 Inaba Seisakusho Co. Ltd. 3,500 42 Taisei Lamick Co. Ltd. 1,600 42 Daiken Corp. 16,000 41 Kojima Co. Ltd. 15,100 40 Yurtec Corp. 11,000 38 Panasonic Information Systems 1,400 38 Hioki EE Corp. 2,700 37 * Mitsubishi Kakoki Kaisha Ltd. 22,000 37 CMIC Holdings Co. Ltd. 2,400 31 Hodogaya Chemical Co. Ltd. 16,000 31 Nippon Kasei Chemical Co. Ltd. 21,000 30 _____________
232,485
Malaysia (1.2%)
Dialog Group Bhd. 1,835,843 1,780 Malaysia Airports Holdings Bhd. 598,177 1,505 Genting Plantations Bhd. 333,873 1,026 Affin Holdings Bhd. 657,100 804 Bursa Malaysia Bhd. 345,336 803 Media Prima Bhd. 1,060,940 758 Magnum Bhd. 818,744 749 IGB Corp. Bhd. 930,273 743 KLCC Property Holdings Bhd. 413,499 717 BIMB Holdings Bhd. 541,240 694
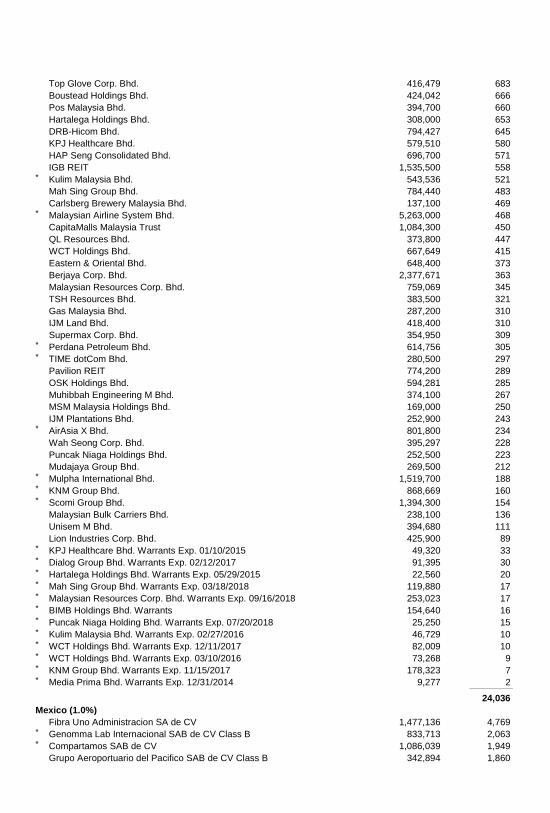
Top Glove Corp. Bhd. 416,479 683 Boustead Holdings Bhd. 424,042 666 Pos Malaysia Bhd. 394,700 660 Hartalega Holdings Bhd. 308,000 653 DRB-Hicom Bhd. 794,427 645 KPJ Healthcare Bhd. 579,510 580 HAP Seng Consolidated Bhd. 696,700 571 IGB REIT 1,535,500 558 * Kulim Malaysia Bhd. 543,536 521 Mah Sing Group Bhd. 784,440 483 Carlsberg Brewery Malaysia Bhd. 137,100 469 * Malaysian Airline System Bhd. 5,263,000 468 CapitaMalls Malaysia Trust 1,084,300 450 QL Resources Bhd. 373,800 447 WCT Holdings Bhd. 667,649 415 Eastern & Oriental Bhd. 648,400 373 Berjaya Corp. Bhd. 2,377,671 363 Malaysian Resources Corp. Bhd. 759,069 345 TSH Resources Bhd. 383,500 321 Gas Malaysia Bhd. 287,200 310 IJM Land Bhd. 418,400 310 Supermax Corp. Bhd. 354,950 309 * Perdana Petroleum Bhd. 614,756 305 * TIME dotCom Bhd. 280,500 297 Pavilion REIT 774,200 289 OSK Holdings Bhd. 594,281 285 Muhibbah Engineering M Bhd. 374,100 267 MSM Malaysia Holdings Bhd. 169,000 250 IJM Plantations Bhd. 252,900 243 * AirAsia X Bhd. 801,800 234 Wah Seong Corp. Bhd. 395,297 228 Puncak Niaga Holdings Bhd. 252,500 223 Mudajaya Group Bhd. 269,500 212 * Mulpha International Bhd. 1,519,700 188 * KNM Group Bhd. 868,669 160 * Scomi Group Bhd. 1,394,300 154 Malaysian Bulk Carriers Bhd. 238,100 136 Unisem M Bhd. 394,680 111 Lion Industries Corp. Bhd. 425,900 89 * KPJ Healthcare Bhd. Warrants Exp. 01/10/2015 49,320 33 * Dialog Group Bhd. Warrants Exp. 02/12/2017 91,395 30 * Hartalega Holdings Bhd. Warrants Exp. 05/29/2015 22,560 20 * Mah Sing Group Bhd. Warrants Exp. 03/18/2018 119,880 17 * Malaysian Resources Corp. Bhd. Warrants Exp. 09/16/2018 253,023 17 * BIMB Holdings Bhd. Warrants 154,640 16 * Puncak Niaga Holding Bhd. Warrants Exp. 07/20/2018 25,250 15 * Kulim Malaysia Bhd. Warrants Exp. 02/27/2016 46,729 10 * WCT Holdings Bhd. Warrants Exp. 12/11/2017 82,009 10 * WCT Holdings Bhd. Warrants Exp. 03/10/2016 73,268 9 * KNM Group Bhd. Warrants Exp. 11/15/2017 178,323 7 * Media Prima Bhd. Warrants Exp. 12/31/2014 9,277 2 _____________
24,036
Mexico (1.0%)
Fibra Uno Administracion SA de CV 1,477,136 4,769 * Genomma Lab Internacional SAB de CV Class B 833,713 2,063 * Compartamos SAB de CV 1,086,039 1,949 Grupo Aeroportuario del Pacifico SAB de CV Class B 342,894 1,860
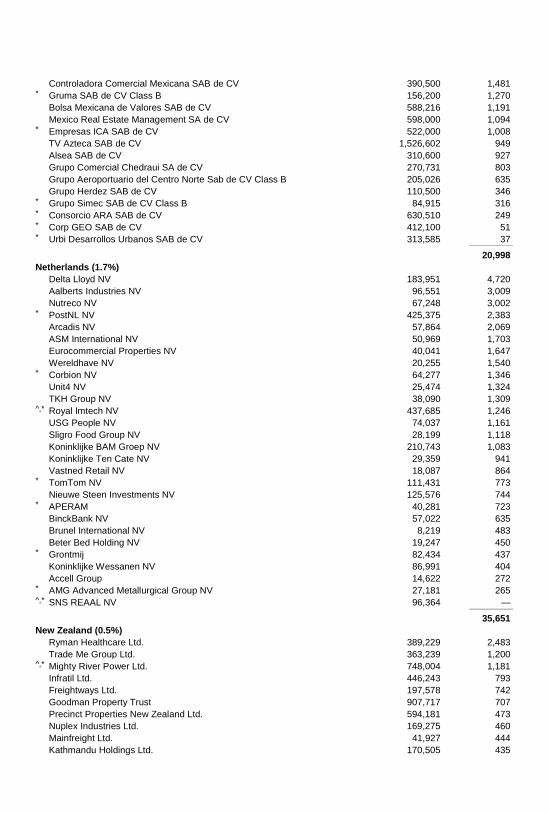
Controladora Comercial Mexicana SAB de CV 390,500 1,481 * Gruma SAB de CV Class B 156,200 1,270 Bolsa Mexicana de Valores SAB de CV 588,216 1,191 Mexico Real Estate Management SA de CV 598,000 1,094 * Empresas ICA SAB de CV 522,000 1,008 TV Azteca SAB de CV 1,526,602 949 Alsea SAB de CV 310,600 927 Grupo Comercial Chedraui SA de CV 270,731 803 Grupo Aeroportuario del Centro Norte Sab de CV Class B 205,026 635 Grupo Herdez SAB de CV 110,500 346 * Grupo Simec SAB de CV Class B 84,915 316 * Consorcio ARA SAB de CV 630,510 249 * Corp GEO SAB de CV 412,100 51 * Urbi Desarrollos Urbanos SAB de CV 313,585 37 _____________
20,998
Netherlands (1.7%)
Delta Lloyd NV 183,951 4,720 Aalberts Industries NV 96,551 3,009 Nutreco NV 67,248 3,002 * PostNL NV 425,375 2,383 Arcadis NV 57,864 2,069 ASM International NV 50,969 1,703 Eurocommercial Properties NV 40,041 1,647 Wereldhave NV 20,255 1,540 * Corbion NV 64,277 1,346 Unit4 NV 25,474 1,324 TKH Group NV 38,090 1,309 ^,* Royal Imtech NV 437,685 1,246 USG People NV 74,037 1,161 Sligro Food Group NV 28,199 1,118 Koninklijke BAM Groep NV 210,743 1,083 Koninklijke Ten Cate NV 29,359 941 Vastned Retail NV 18,087 864 * TomTom NV 111,431 773 Nieuwe Steen Investments NV 125,576 744 * APERAM 40,281 723 BinckBank NV 57,022 635 Brunel International NV 8,219 483 Beter Bed Holding NV 19,247 450 * Grontmij 82,434 437 Koninklijke Wessanen NV 86,991 404 Accell Group 14,622 272 * AMG Advanced Metallurgical Group NV 27,181 265 ^,* SNS REAAL NV 96,364 — _____________
35,651
New Zealand (0.5%)
Ryman Healthcare Ltd. 389,229 2,483 Trade Me Group Ltd. 363,239 1,200 ^,* Mighty River Power Ltd. 748,004 1,181 Infratil Ltd. 446,243 793 Freightways Ltd. 197,578 742 Goodman Property Trust 907,717 707 Precinct Properties New Zealand Ltd. 594,181 473 Nuplex Industries Ltd. 169,275 460 Mainfreight Ltd. 41,927 444 Kathmandu Holdings Ltd. 170,505 435
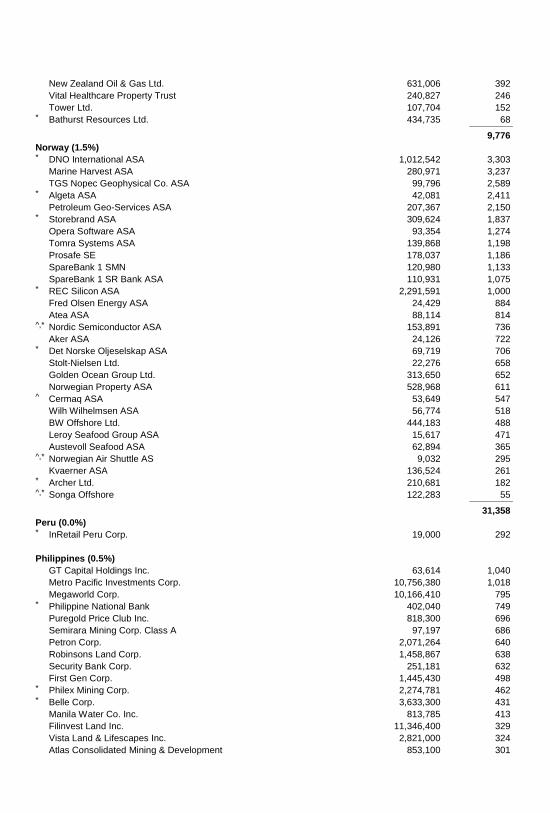
New Zealand Oil & Gas Ltd. 631,006 392 Vital Healthcare Property Trust 240,827 246 Tower Ltd. 107,704 152 * Bathurst Resources Ltd. 434,735 68 _____________
9,776
Norway (1.5%)
* DNO International ASA 1,012,542 3,303 Marine Harvest ASA 280,971 3,237 TGS Nopec Geophysical Co. ASA 99,796 2,589 * Algeta ASA 42,081 2,411 Petroleum Geo-Services ASA 207,367 2,150 * Storebrand ASA 309,624 1,837 Opera Software ASA 93,354 1,274 Tomra Systems ASA 139,868 1,198 Prosafe SE 178,037 1,186 SpareBank 1 SMN 120,980 1,133 SpareBank 1 SR Bank ASA 110,931 1,075 * REC Silicon ASA 2,291,591 1,000 Fred Olsen Energy ASA 24,429 884 Atea ASA 88,114 814 ^,* Nordic Semiconductor ASA 153,891 736 Aker ASA 24,126 722 * Det Norske Oljeselskap ASA 69,719 706 Stolt-Nielsen Ltd. 22,276 658 Golden Ocean Group Ltd. 313,650 652 Norwegian Property ASA 528,968 611 ^ Cermaq ASA 53,649 547 Wilh Wilhelmsen ASA 56,774 518 BW Offshore Ltd. 444,183 488 Leroy Seafood Group ASA 15,617 471 Austevoll Seafood ASA 62,894 365 ^,* Norwegian Air Shuttle AS 9,032 295 Kvaerner ASA 136,524 261 * Archer Ltd. 210,681 182 ^,* Songa Offshore 122,283 55 _____________
31,358
Peru (0.0%)
* InRetail Peru Corp. 19,000 292
Philippines (0.5%)
GT Capital Holdings Inc. 63,614 1,040 Metro Pacific Investments Corp. 10,756,380 1,018 Megaworld Corp. 10,166,410 795 * Philippine National Bank 402,040 749 Puregold Price Club Inc. 818,300 696 Semirara Mining Corp. Class A 97,197 686 Petron Corp. 2,071,264 640 Robinsons Land Corp. 1,458,867 638 Security Bank Corp. 251,181 632 First Gen Corp. 1,445,430 498 * Philex Mining Corp. 2,274,781 462 * Belle Corp. 3,633,300 431 Manila Water Co. Inc. 813,785 413 Filinvest Land Inc. 11,346,400 329 Vista Land & Lifescapes Inc. 2,821,000 324 Atlas Consolidated Mining & Development 853,100 301
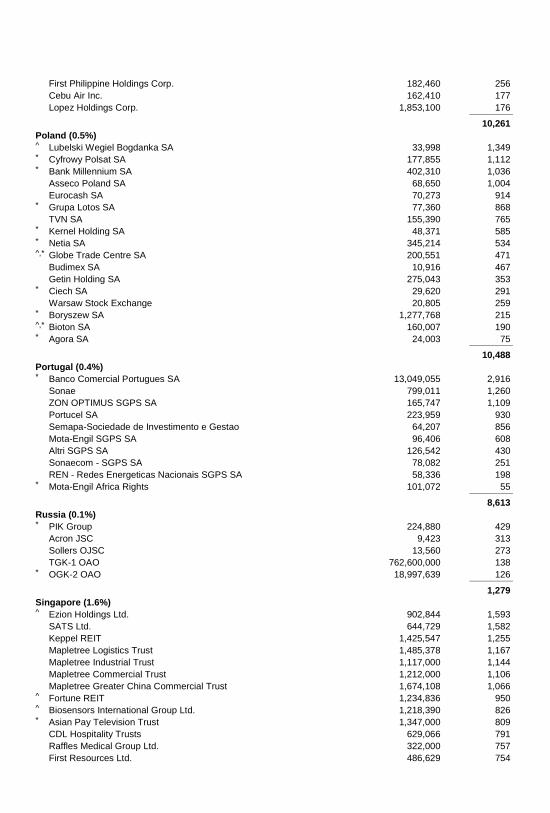
First Philippine Holdings Corp. 182,460 256 Cebu Air Inc. 162,410 177 Lopez Holdings Corp. 1,853,100 176 _____________
10,261
Poland (0.5%)
^ Lubelski Wegiel Bogdanka SA 33,998 1,349 * Cyfrowy Polsat SA 177,855 1,112 * Bank Millennium SA 402,310 1,036 Asseco Poland SA 68,650 1,004 Eurocash SA 70,273 914 * Grupa Lotos SA 77,360 868 TVN SA 155,390 765 * Kernel Holding SA 48,371 585 * Netia SA 345,214 534 ^,* Globe Trade Centre SA 200,551 471 Budimex SA 10,916 467 Getin Holding SA 275,043 353 * Ciech SA 29,620 291 Warsaw Stock Exchange 20,805 259 * Boryszew SA 1,277,768 215 ^,* Bioton SA 160,007 190 * Agora SA 24,003 75 _____________
10,488
Portugal (0.4%)
* Banco Comercial Portugues SA 13,049,055 2,916 Sonae 799,011 1,260 ZON OPTIMUS SGPS SA 165,747 1,109 Portucel SA 223,959 930 Semapa-Sociedade de Investimento e Gestao 64,207 856 Mota-Engil SGPS SA 96,406 608 Altri SGPS SA 126,542 430 Sonaecom - SGPS SA 78,082 251 REN - Redes Energeticas Nacionais SGPS SA 58,336 198 * Mota-Engil Africa Rights 101,072 55 _____________
8,613
Russia (0.1%)
* PIK Group 224,880 429 Acron JSC 9,423 313 Sollers OJSC 13,560 273 TGK-1 OAO 762,600,000 138 * OGK-2 OAO 18,997,639 126 _____________
1,279
Singapore (1.6%)
^ Ezion Holdings Ltd. 902,844 1,593 SATS Ltd. 644,729 1,582 Keppel REIT 1,425,547 1,255 Mapletree Logistics Trust 1,485,378 1,167 Mapletree Industrial Trust 1,117,000 1,144 Mapletree Commercial Trust 1,212,000 1,106 Mapletree Greater China Commercial Trust 1,674,108 1,066 ^ Fortune REIT 1,234,836 950 ^ Biosensors International Group Ltd. 1,218,390 826 * Asian Pay Television Trust 1,347,000 809 CDL Hospitality Trusts 629,066 791 Raffles Medical Group Ltd. 322,000 757 First Resources Ltd. 486,629 754
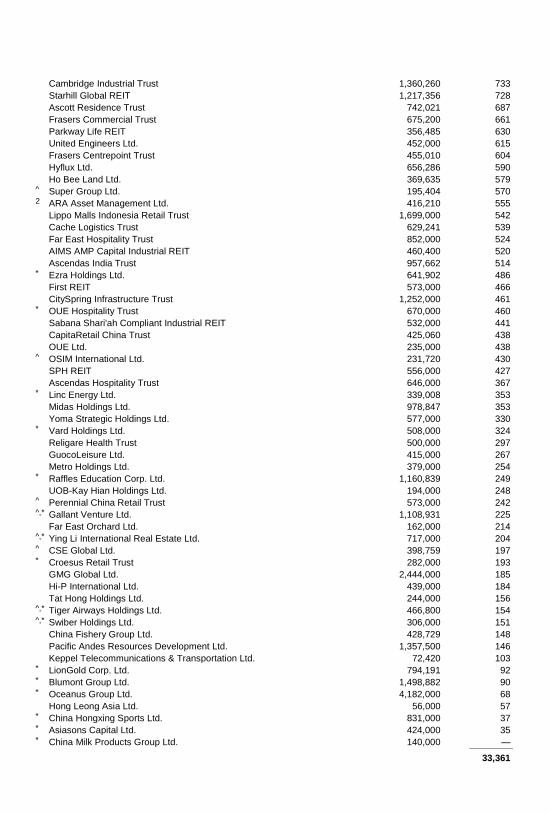
Cambridge Industrial Trust 1,360,260 733 Starhill Global REIT 1,217,356 728 Ascott Residence Trust 742,021 687 Frasers Commercial Trust 675,200 661 Parkway Life REIT 356,485 630 United Engineers Ltd. 452,000 615 Frasers Centrepoint Trust 455,010 604 Hyflux Ltd. 656,286 590 Ho Bee Land Ltd. 369,635 579 ^ Super Group Ltd. 195,404 570 2 ARA Asset Management Ltd. 416,210 555 Lippo Malls Indonesia Retail Trust 1,699,000 542 Cache Logistics Trust 629,241 539 Far East Hospitality Trust 852,000 524 AIMS AMP Capital Industrial REIT 460,400 520 Ascendas India Trust 957,662 514 * Ezra Holdings Ltd. 641,902 486 First REIT 573,000 466 CitySpring Infrastructure Trust 1,252,000 461 * OUE Hospitality Trust 670,000 460 Sabana Shari'ah Compliant Industrial REIT 532,000 441 CapitaRetail China Trust 425,060 438 OUE Ltd. 235,000 438 ^ OSIM International Ltd. 231,720 430 SPH REIT 556,000 427 Ascendas Hospitality Trust 646,000 367 * Linc Energy Ltd. 339,008 353 Midas Holdings Ltd. 978,847 353 Yoma Strategic Holdings Ltd. 577,000 330 * Vard Holdings Ltd. 508,000 324 Religare Health Trust 500,000 297 GuocoLeisure Ltd. 415,000 267 Metro Holdings Ltd. 379,000 254 * Raffles Education Corp. Ltd. 1,160,839 249 UOB-Kay Hian Holdings Ltd. 194,000 248 ^ Perennial China Retail Trust 573,000 242 ^,* Gallant Venture Ltd. 1,108,931 225 Far East Orchard Ltd. 162,000 214 ^,* Ying Li International Real Estate Ltd. 717,000 204 ^ CSE Global Ltd. 398,759 197 * Croesus Retail Trust 282,000 193 GMG Global Ltd. 2,444,000 185 Hi-P International Ltd. 439,000 184 Tat Hong Holdings Ltd. 244,000 156 ^,* Tiger Airways Holdings Ltd. 466,800 154 ^,* Swiber Holdings Ltd. 306,000 151 China Fishery Group Ltd. 428,729 148 Pacific Andes Resources Development Ltd. 1,357,500 146 Keppel Telecommunications & Transportation Ltd. 72,420 103 * LionGold Corp. Ltd. 794,191 92 * Blumont Group Ltd. 1,498,882 90 * Oceanus Group Ltd. 4,182,000 68 Hong Leong Asia Ltd. 56,000 57 * China Hongxing Sports Ltd. 831,000 37 * Asiasons Capital Ltd. 424,000 35 * China Milk Products Group Ltd. 140,000 — _____________
33,361
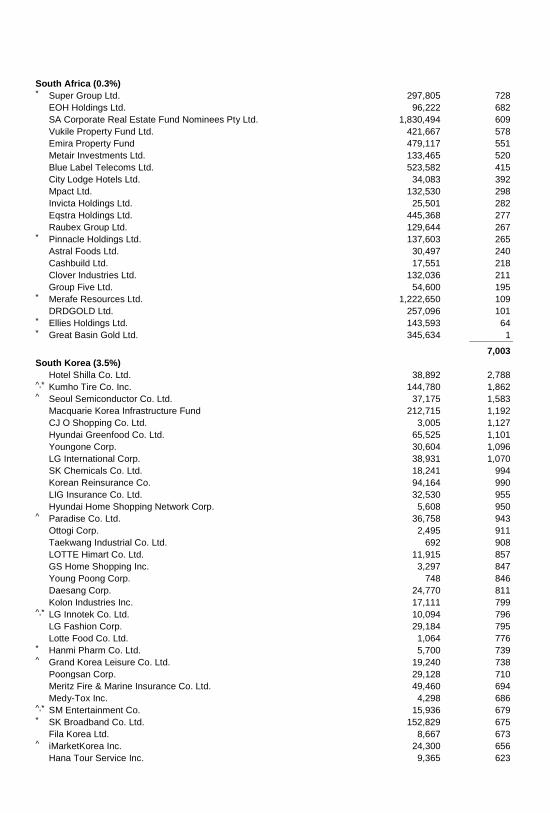
South Africa (0.3%)
* Super Group Ltd. 297,805 728 EOH Holdings Ltd. 96,222 682 SA Corporate Real Estate Fund Nominees Pty Ltd. 1,830,494 609 Vukile Property Fund Ltd. 421,667 578 Emira Property Fund 479,117 551 Metair Investments Ltd. 133,465 520 Blue Label Telecoms Ltd. 523,582 415 City Lodge Hotels Ltd. 34,083 392 Mpact Ltd. 132,530 298 Invicta Holdings Ltd. 25,501 282 Eqstra Holdings Ltd. 445,368 277 Raubex Group Ltd. 129,644 267 * Pinnacle Holdings Ltd. 137,603 265 Astral Foods Ltd. 30,497 240 Cashbuild Ltd. 17,551 218 Clover Industries Ltd. 132,036 211 Group Five Ltd. 54,600 195 * Merafe Resources Ltd. 1,222,650 109 DRDGOLD Ltd. 257,096 101 * Ellies Holdings Ltd. 143,593 64 * Great Basin Gold Ltd. 345,634 1 _____________
7,003
South Korea (3.5%)
Hotel Shilla Co. Ltd. 38,892 2,788 ^,* Kumho Tire Co. Inc. 144,780 1,862 ^ Seoul Semiconductor Co. Ltd. 37,175 1,583 Macquarie Korea Infrastructure Fund 212,715 1,192 CJ O Shopping Co. Ltd. 3,005 1,127 Hyundai Greenfood Co. Ltd. 65,525 1,101 Youngone Corp. 30,604 1,096 LG International Corp. 38,931 1,070 SK Chemicals Co. Ltd. 18,241 994 Korean Reinsurance Co. 94,164 990 LIG Insurance Co. Ltd. 32,530 955 Hyundai Home Shopping Network Corp. 5,608 950 ^ Paradise Co. Ltd. 36,758 943 Ottogi Corp. 2,495 911 Taekwang Industrial Co. Ltd. 692 908 LOTTE Himart Co. Ltd. 11,915 857 GS Home Shopping Inc. 3,297 847 Young Poong Corp. 748 846 Daesang Corp. 24,770 811 Kolon Industries Inc. 17,111 799 ^,* LG Innotek Co. Ltd. 10,094 796 LG Fashion Corp. 29,184 795 Lotte Food Co. Ltd. 1,064 776 * Hanmi Pharm Co. Ltd. 5,700 739 ^ Grand Korea Leisure Co. Ltd. 19,240 738 Poongsan Corp. 29,128 710 Meritz Fire & Marine Insurance Co. Ltd. 49,460 694 Medy-Tox Inc. 4,298 686 ^,* SM Entertainment Co. 15,936 679 * SK Broadband Co. Ltd. 152,829 675 Fila Korea Ltd. 8,667 673 ^ iMarketKorea Inc. 24,300 656 Hana Tour Service Inc. 9,365 623
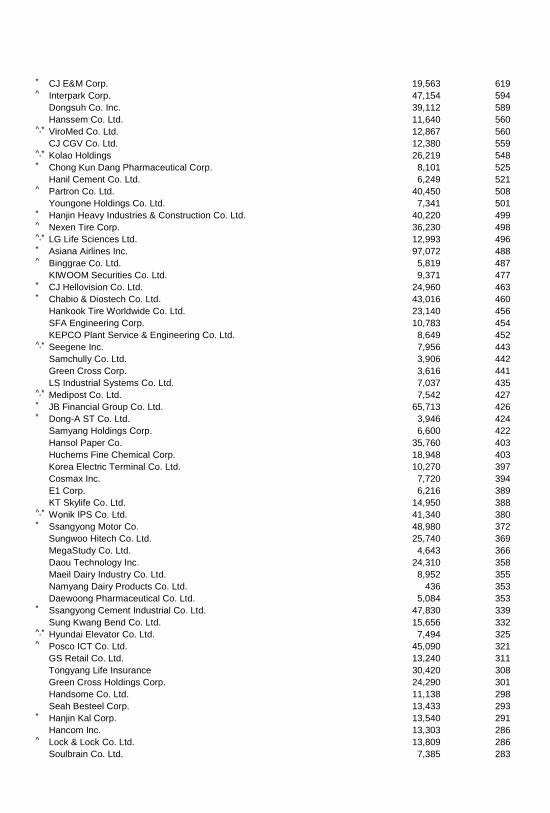
* CJ E&M Corp. 19,563 619 ^ Interpark Corp. 47,154 594 Dongsuh Co. Inc. 39,112 589 Hanssem Co. Ltd. 11,640 560 ^,* ViroMed Co. Ltd. 12,867 560 CJ CGV Co. Ltd. 12,380 559 ^,* Kolao Holdings 26,219 548 * Chong Kun Dang Pharmaceutical Corp. 8,101 525 Hanil Cement Co. Ltd. 6,249 521 ^ Partron Co. Ltd. 40,450 508 Youngone Holdings Co. Ltd. 7,341 501 * Hanjin Heavy Industries & Construction Co. Ltd. 40,220 499 ^ Nexen Tire Corp. 36,230 498 ^,* LG Life Sciences Ltd. 12,993 496 * Asiana Airlines Inc. 97,072 488 ^ Binggrae Co. Ltd. 5,819 487 KIWOOM Securities Co. Ltd. 9,371 477 * CJ Hellovision Co. Ltd. 24,960 463 * Chabio & Diostech Co. Ltd. 43,016 460 Hankook Tire Worldwide Co. Ltd. 23,140 456 SFA Engineering Corp. 10,783 454 KEPCO Plant Service & Engineering Co. Ltd. 8,649 452 ^,* Seegene Inc. 7,956 443 Samchully Co. Ltd. 3,906 442 Green Cross Corp. 3,616 441 LS Industrial Systems Co. Ltd. 7,037 435 ^,* Medipost Co. Ltd. 7,542 427 * JB Financial Group Co. Ltd. 65,713 426 * Dong-A ST Co. Ltd. 3,946 424 Samyang Holdings Corp. 6,600 422 Hansol Paper Co. 35,760 403 Huchems Fine Chemical Corp. 18,948 403 Korea Electric Terminal Co. Ltd. 10,270 397 Cosmax Inc. 7,720 394 E1 Corp. 6,216 389 KT Skylife Co. Ltd. 14,950 388 ^,* Wonik IPS Co. Ltd. 41,340 380 * Ssangyong Motor Co. 48,980 372 Sungwoo Hitech Co. Ltd. 25,740 369 MegaStudy Co. Ltd. 4,643 366 Daou Technology Inc. 24,310 358 Maeil Dairy Industry Co. Ltd. 8,952 355 Namyang Dairy Products Co. Ltd. 436 353 Daewoong Pharmaceutical Co. Ltd. 5,084 353 * Ssangyong Cement Industrial Co. Ltd. 47,830 339 Sung Kwang Bend Co. Ltd. 15,656 332 ^,* Hyundai Elevator Co. Ltd. 7,494 325 ^ Posco ICT Co. Ltd. 45,090 321 GS Retail Co. Ltd. 13,240 311 Tongyang Life Insurance 30,420 308 Green Cross Holdings Corp. 24,290 301 Handsome Co. Ltd. 11,138 298 Seah Besteel Corp. 13,433 293 * Hanjin Kal Corp. 13,540 291 Hancom Inc. 13,303 286 ^ Lock & Lock Co. Ltd. 13,809 286 Soulbrain Co. Ltd. 7,385 283
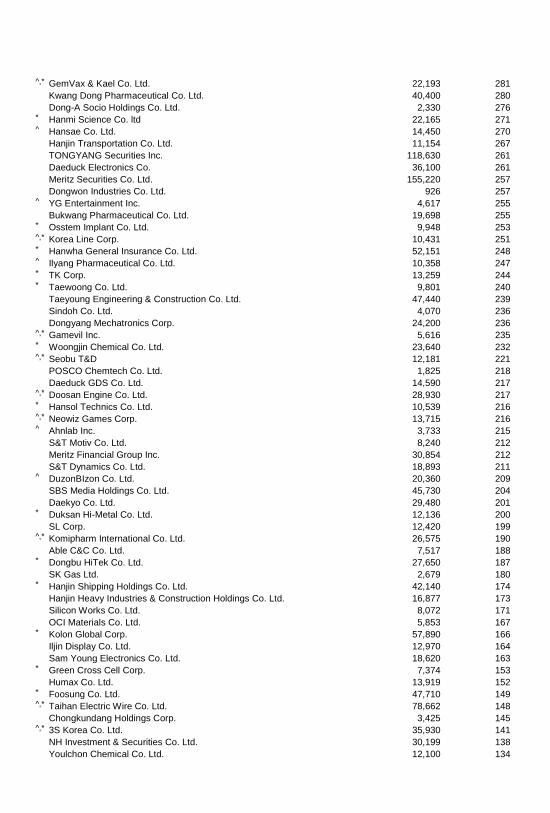
^,* GemVax & Kael Co. Ltd. 22,193 281 Kwang Dong Pharmaceutical Co. Ltd. 40,400 280 Dong-A Socio Holdings Co. Ltd. 2,330 276 * Hanmi Science Co. ltd 22,165 271 ^ Hansae Co. Ltd. 14,450 270 Hanjin Transportation Co. Ltd. 11,154 267 TONGYANG Securities Inc. 118,630 261 Daeduck Electronics Co. 36,100 261 Meritz Securities Co. Ltd. 155,220 257 Dongwon Industries Co. Ltd. 926 257 ^ YG Entertainment Inc. 4,617 255 Bukwang Pharmaceutical Co. Ltd. 19,698 255 * Osstem Implant Co. Ltd. 9,948 253 ^,* Korea Line Corp. 10,431 251 * Hanwha General Insurance Co. Ltd. 52,151 248 ^ Ilyang Pharmaceutical Co. Ltd. 10,358 247 * TK Corp. 13,259 244 * Taewoong Co. Ltd. 9,801 240 Taeyoung Engineering & Construction Co. Ltd. 47,440 239 Sindoh Co. Ltd. 4,070 236 Dongyang Mechatronics Corp. 24,200 236 ^,* Gamevil Inc. 5,616 235 * Woongjin Chemical Co. Ltd. 23,640 232 ^,* Seobu T&D 12,181 221 POSCO Chemtech Co. Ltd. 1,825 218 Daeduck GDS Co. Ltd. 14,590 217 ^,* Doosan Engine Co. Ltd. 28,930 217 * Hansol Technics Co. Ltd. 10,539 216 ^,* Neowiz Games Corp. 13,715 216 ^ Ahnlab Inc. 3,733 215 S&T Motiv Co. Ltd. 8,240 212 Meritz Financial Group Inc. 30,854 212 S&T Dynamics Co. Ltd. 18,893 211 ^ DuzonBIzon Co. Ltd. 20,360 209 SBS Media Holdings Co. Ltd. 45,730 204 Daekyo Co. Ltd. 29,480 201 * Duksan Hi-Metal Co. Ltd. 12,136 200 SL Corp. 12,420 199 ^,* Komipharm International Co. Ltd. 26,575 190 Able C&C Co. Ltd. 7,517 188 * Dongbu HiTek Co. Ltd. 27,650 187 SK Gas Ltd. 2,679 180 * Hanjin Shipping Holdings Co. Ltd. 42,140 174 Hanjin Heavy Industries & Construction Holdings Co. Ltd. 16,877 173 Silicon Works Co. Ltd. 8,072 171 OCI Materials Co. Ltd. 5,853 167 * Kolon Global Corp. 57,890 166 Iljin Display Co. Ltd. 12,970 164 Sam Young Electronics Co. Ltd. 18,620 163 * Green Cross Cell Corp. 7,374 153 Humax Co. Ltd. 13,919 152 * Foosung Co. Ltd. 47,710 149 ^,* Taihan Electric Wire Co. Ltd. 78,662 148 Chongkundang Holdings Corp. 3,425 145 ^,* 3S Korea Co. Ltd. 35,930 141 NH Investment & Securities Co. Ltd. 30,199 138 Youlchon Chemical Co. Ltd. 12,100 134
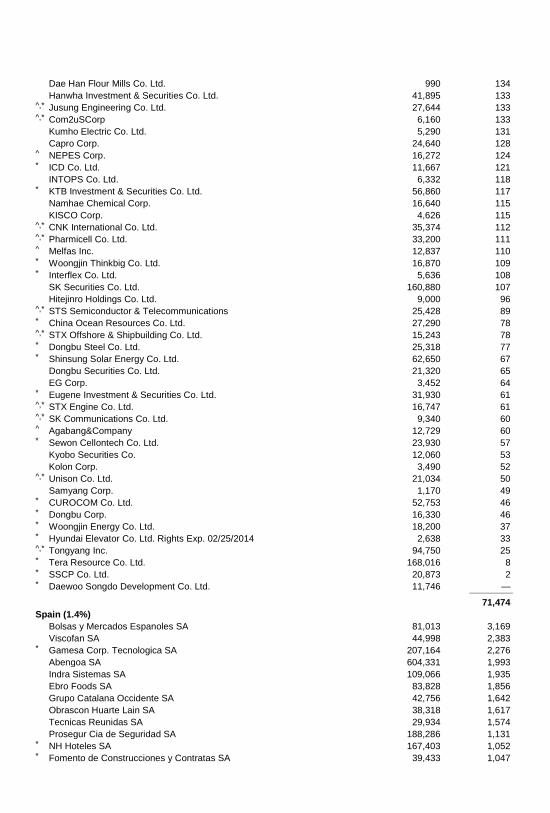
Dae Han Flour Mills Co. Ltd. 990 134 Hanwha Investment & Securities Co. Ltd. 41,895 133 ^,* Jusung Engineering Co. Ltd. 27,644 133 ^,* Com2uSCorp 6,160 133 Kumho Electric Co. Ltd. 5,290 131 Capro Corp. 24,640 128 ^ NEPES Corp. 16,272 124 * ICD Co. Ltd. 11,667 121 INTOPS Co. Ltd. 6,332 118 * KTB Investment & Securities Co. Ltd. 56,860 117 Namhae Chemical Corp. 16,640 115 KISCO Corp. 4,626 115 ^,* CNK International Co. Ltd. 35,374 112 ^,* Pharmicell Co. Ltd. 33,200 111 ^ Melfas Inc. 12,837 110 * Woongjin Thinkbig Co. Ltd. 16,870 109 * Interflex Co. Ltd. 5,636 108 SK Securities Co. Ltd. 160,880 107 Hitejinro Holdings Co. Ltd. 9,000 96 ^,* STS Semiconductor & Telecommunications 25,428 89 * China Ocean Resources Co. Ltd. 27,290 78 ^,* STX Offshore & Shipbuilding Co. Ltd. 15,243 78 * Dongbu Steel Co. Ltd. 25,318 77 * Shinsung Solar Energy Co. Ltd. 62,650 67 Dongbu Securities Co. Ltd. 21,320 65 EG Corp. 3,452 64 * Eugene Investment & Securities Co. Ltd. 31,930 61 ^,* STX Engine Co. Ltd. 16,747 61 ^,* SK Communications Co. Ltd. 9,340 60 ^ Agabang&Company 12,729 60 * Sewon Cellontech Co. Ltd. 23,930 57 Kyobo Securities Co. 12,060 53 Kolon Corp. 3,490 52 ^,* Unison Co. Ltd. 21,034 50 Samyang Corp. 1,170 49 * CUROCOM Co. Ltd. 52,753 46 * Dongbu Corp. 16,330 46 * Woongjin Energy Co. Ltd. 18,200 37 * Hyundai Elevator Co. Ltd. Rights Exp. 02/25/2014 2,638 33 ^,* Tongyang Inc. 94,750 25 * Tera Resource Co. Ltd. 168,016 8 * SSCP Co. Ltd. 20,873 2 * Daewoo Songdo Development Co. Ltd. 11,746 — _____________
71,474
Spain (1.4%)
Bolsas y Mercados Espanoles SA 81,013 3,169 Viscofan SA 44,998 2,383 * Gamesa Corp. Tecnologica SA 207,164 2,276 Abengoa SA 604,331 1,993 Indra Sistemas SA 109,066 1,935 Ebro Foods SA 83,828 1,856 Grupo Catalana Occidente SA 42,756 1,642 Obrascon Huarte Lain SA 38,318 1,617 Tecnicas Reunidas SA 29,934 1,574 Prosegur Cia de Seguridad SA 188,286 1,131 * NH Hoteles SA 167,403 1,052 * Fomento de Construcciones y Contratas SA 39,433 1,047
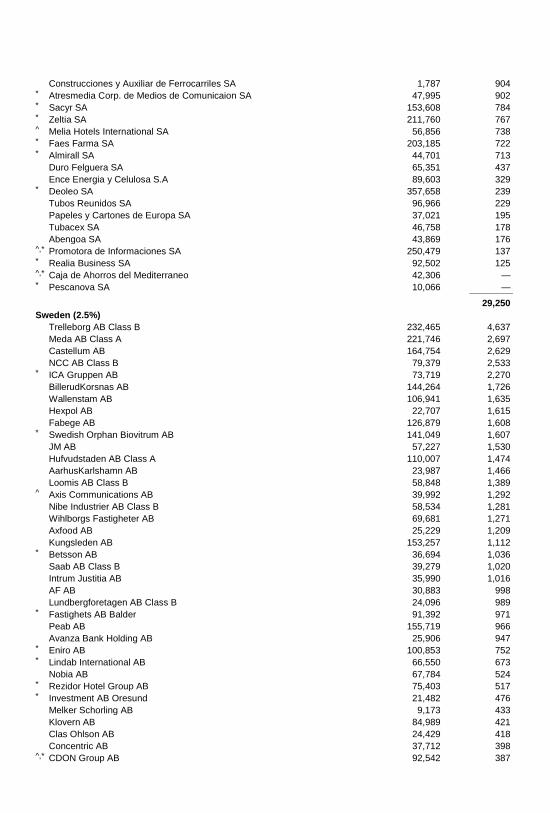
Construcciones y Auxiliar de Ferrocarriles SA 1,787 904 * Atresmedia Corp. de Medios de Comunicaion SA 47,995 902 * Sacyr SA 153,608 784 * Zeltia SA 211,760 767 ^ Melia Hotels International SA 56,856 738 * Faes Farma SA 203,185 722 * Almirall SA 44,701 713 Duro Felguera SA 65,351 437 Ence Energia y Celulosa S.A 89,603 329 * Deoleo SA 357,658 239 Tubos Reunidos SA 96,966 229 Papeles y Cartones de Europa SA 37,021 195 Tubacex SA 46,758 178 Abengoa SA 43,869 176 ^,* Promotora de Informaciones SA 250,479 137 * Realia Business SA 92,502 125 ^,* Caja de Ahorros del Mediterraneo 42,306 — * Pescanova SA 10,066 — _____________
29,250
Sweden (2.5%)
Trelleborg AB Class B 232,465 4,637 Meda AB Class A 221,746 2,697 Castellum AB 164,754 2,629 NCC AB Class B 79,379 2,533 * ICA Gruppen AB 73,719 2,270 BillerudKorsnas AB 144,264 1,726 Wallenstam AB 106,941 1,635 Hexpol AB 22,707 1,615 Fabege AB 126,879 1,608 * Swedish Orphan Biovitrum AB 141,049 1,607 JM AB 57,227 1,530 Hufvudstaden AB Class A 110,007 1,474 AarhusKarlshamn AB 23,987 1,466 Loomis AB Class B 58,848 1,389 ^ Axis Communications AB 39,992 1,292 Nibe Industrier AB Class B 58,534 1,281 Wihlborgs Fastigheter AB 69,681 1,271 Axfood AB 25,229 1,209 Kungsleden AB 153,257 1,112 * Betsson AB 36,694 1,036 Saab AB Class B 39,279 1,020 Intrum Justitia AB 35,990 1,016 AF AB 30,883 998 Lundbergforetagen AB Class B 24,096 989 * Fastighets AB Balder 91,392 971 Peab AB 155,719 966 Avanza Bank Holding AB 25,906 947 * Eniro AB 100,853 752 * Lindab International AB 66,550 673 Nobia AB 67,784 524 * Rezidor Hotel Group AB 75,403 517 * Investment AB Oresund 21,482 476 Melker Schorling AB 9,173 433 Klovern AB 84,989 421 Clas Ohlson AB 24,429 418 Concentric AB 37,712 398 ^,* CDON Group AB 92,542 387
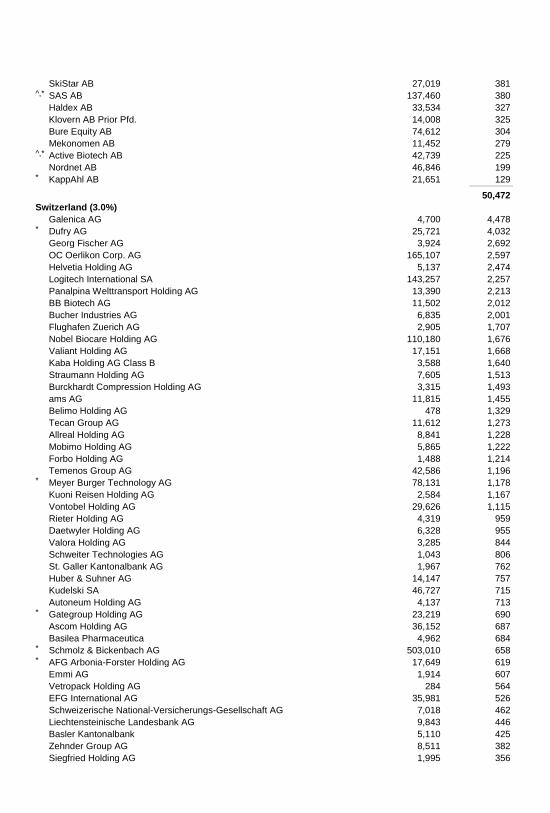
SkiStar AB 27,019 381 ^,* SAS AB 137,460 380 Haldex AB 33,534 327 Klovern AB Prior Pfd. 14,008 325 Bure Equity AB 74,612 304 Mekonomen AB 11,452 279 ^,* Active Biotech AB 42,739 225 Nordnet AB 46,846 199 * KappAhl AB 21,651 129 _____________
50,472
Switzerland (3.0%)
Galenica AG 4,700 4,478 * Dufry AG 25,721 4,032 Georg Fischer AG 3,924 2,692 OC Oerlikon Corp. AG 165,107 2,597 Helvetia Holding AG 5,137 2,474 Logitech International SA 143,257 2,257 Panalpina Welttransport Holding AG 13,390 2,213 BB Biotech AG 11,502 2,012 Bucher Industries AG 6,835 2,001 Flughafen Zuerich AG 2,905 1,707 Nobel Biocare Holding AG 110,180 1,676 Valiant Holding AG 17,151 1,668 Kaba Holding AG Class B 3,588 1,640 Straumann Holding AG 7,605 1,513 Burckhardt Compression Holding AG 3,315 1,493 ams AG 11,815 1,455 Belimo Holding AG 478 1,329 Tecan Group AG 11,612 1,273 Allreal Holding AG 8,841 1,228 Mobimo Holding AG 5,865 1,222 Forbo Holding AG 1,488 1,214 Temenos Group AG 42,586 1,196 * Meyer Burger Technology AG 78,131 1,178 Kuoni Reisen Holding AG 2,584 1,167 Vontobel Holding AG 29,626 1,115 Rieter Holding AG 4,319 959 Daetwyler Holding AG 6,328 955 Valora Holding AG 3,285 844 Schweiter Technologies AG 1,043 806 St. Galler Kantonalbank AG 1,967 762 Huber & Suhner AG 14,147 757 Kudelski SA 46,727 715 Autoneum Holding AG 4,137 713 * Gategroup Holding AG 23,219 690 Ascom Holding AG 36,152 687 Basilea Pharmaceutica 4,962 684 * Schmolz & Bickenbach AG 503,010 658 * AFG Arbonia-Forster Holding AG 17,649 619 Emmi AG 1,914 607 Vetropack Holding AG 284 564 EFG International AG 35,981 526 Schweizerische National-Versicherungs-Gesellschaft AG 7,018 462 Liechtensteinische Landesbank AG 9,843 446 Basler Kantonalbank 5,110 425 Zehnder Group AG 8,511 382 Siegfried Holding AG 1,995 356
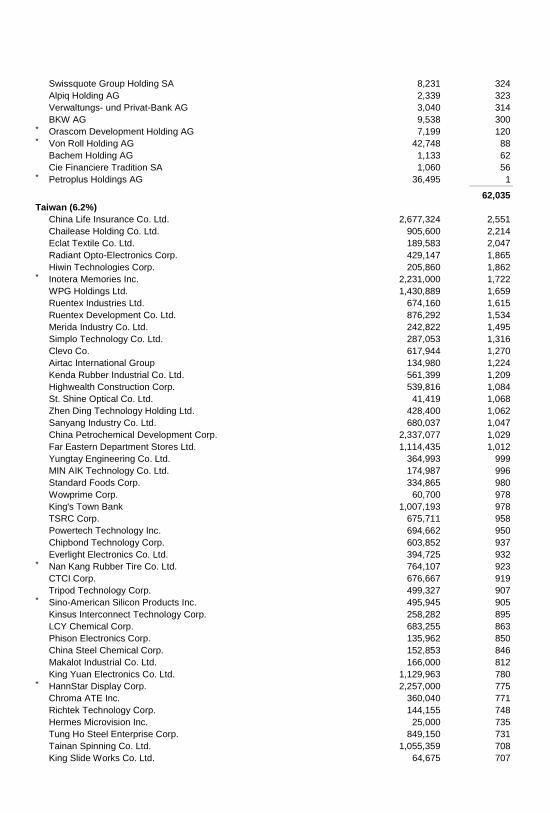
Swissquote Group Holding SA 8,231 324 Alpiq Holding AG 2,339 323 Verwaltungs- und Privat-Bank AG 3,040 314 BKW AG 9,538 300 * Orascom Development Holding AG 7,199 120 * Von Roll Holding AG 42,748 88 Bachem Holding AG 1,133 62 Cie Financiere Tradition SA 1,060 56 * Petroplus Holdings AG 36,495 1 _____________
62,035
Taiwan (6.2%)
China Life Insurance Co. Ltd. 2,677,324 2,551 Chailease Holding Co. Ltd. 905,600 2,214 Eclat Textile Co. Ltd. 189,583 2,047 Radiant Opto-Electronics Corp. 429,147 1,865 Hiwin Technologies Corp. 205,860 1,862 * Inotera Memories Inc. 2,231,000 1,722 WPG Holdings Ltd. 1,430,889 1,659 Ruentex Industries Ltd. 674,160 1,615 Ruentex Development Co. Ltd. 876,292 1,534 Merida Industry Co. Ltd. 242,822 1,495 Simplo Technology Co. Ltd. 287,053 1,316 Clevo Co. 617,944 1,270 Airtac International Group 134,980 1,224 Kenda Rubber Industrial Co. Ltd. 561,399 1,209 Highwealth Construction Corp. 539,816 1,084 St. Shine Optical Co. Ltd. 41,419 1,068 Zhen Ding Technology Holding Ltd. 428,400 1,062 Sanyang Industry Co. Ltd. 680,037 1,047 China Petrochemical Development Corp. 2,337,077 1,029 Far Eastern Department Stores Ltd. 1,114,435 1,012 Yungtay Engineering Co. Ltd. 364,993 999 MIN AIK Technology Co. Ltd. 174,987 996 Standard Foods Corp. 334,865 980 Wowprime Corp. 60,700 978 King's Town Bank 1,007,193 978 TSRC Corp. 675,711 958 Powertech Technology Inc. 694,662 950 Chipbond Technology Corp. 603,852 937 Everlight Electronics Co. Ltd. 394,725 932 * Nan Kang Rubber Tire Co. Ltd. 764,107 923 CTCI Corp. 676,667 919 Tripod Technology Corp. 499,327 907 * Sino-American Silicon Products Inc. 495,945 905 Kinsus Interconnect Technology Corp. 258,282 895 LCY Chemical Corp. 683,255 863 Phison Electronics Corp. 135,962 850 China Steel Chemical Corp. 152,853 846 Makalot Industrial Co. Ltd. 166,000 812 King Yuan Electronics Co. Ltd. 1,129,963 780 * HannStar Display Corp. 2,257,000 775 Chroma ATE Inc. 360,040 771 Richtek Technology Corp. 144,155 748 Hermes Microvision Inc. 25,000 735 Tung Ho Steel Enterprise Corp. 849,150 731 Tainan Spinning Co. Ltd. 1,055,359 708 King Slide Works Co. Ltd. 64,675 707
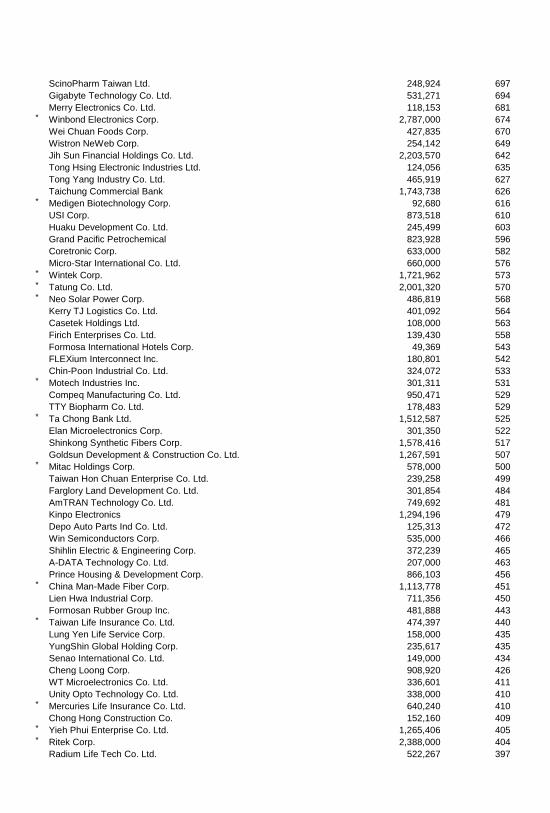
ScinoPharm Taiwan Ltd. 248,924 697 Gigabyte Technology Co. Ltd. 531,271 694 Merry Electronics Co. Ltd. 118,153 681 * Winbond Electronics Corp. 2,787,000 674 Wei Chuan Foods Corp. 427,835 670 Wistron NeWeb Corp. 254,142 649 Jih Sun Financial Holdings Co. Ltd. 2,203,570 642 Tong Hsing Electronic Industries Ltd. 124,056 635 Tong Yang Industry Co. Ltd. 465,919 627 Taichung Commercial Bank 1,743,738 626 * Medigen Biotechnology Corp. 92,680 616 USI Corp. 873,518 610 Huaku Development Co. Ltd. 245,499 603 Grand Pacific Petrochemical 823,928 596 Coretronic Corp. 633,000 582 Micro-Star International Co. Ltd. 660,000 576 * Wintek Corp. 1,721,962 573 * Tatung Co. Ltd. 2,001,320 570 * Neo Solar Power Corp. 486,819 568 Kerry TJ Logistics Co. Ltd. 401,092 564 Casetek Holdings Ltd. 108,000 563 Firich Enterprises Co. Ltd. 139,430 558 Formosa International Hotels Corp. 49,369 543 FLEXium Interconnect Inc. 180,801 542 Chin-Poon Industrial Co. Ltd. 324,072 533 * Motech Industries Inc. 301,311 531 Compeq Manufacturing Co. Ltd. 950,471 529 TTY Biopharm Co. Ltd. 178,483 529 * Ta Chong Bank Ltd. 1,512,587 525 Elan Microelectronics Corp. 301,350 522 Shinkong Synthetic Fibers Corp. 1,578,416 517 Goldsun Development & Construction Co. Ltd. 1,267,591 507 * Mitac Holdings Corp. 578,000 500 Taiwan Hon Chuan Enterprise Co. Ltd. 239,258 499 Farglory Land Development Co. Ltd. 301,854 484 AmTRAN Technology Co. Ltd. 749,692 481 Kinpo Electronics 1,294,196 479 Depo Auto Parts Ind Co. Ltd. 125,313 472 Win Semiconductors Corp. 535,000 466 Shihlin Electric & Engineering Corp. 372,239 465 A-DATA Technology Co. Ltd. 207,000 463 Prince Housing & Development Corp. 866,103 456 * China Man-Made Fiber Corp. 1,113,778 451 Lien Hwa Industrial Corp. 711,356 450 Formosan Rubber Group Inc. 481,888 443 * Taiwan Life Insurance Co. Ltd. 474,397 440 Lung Yen Life Service Corp. 158,000 435 YungShin Global Holding Corp. 235,617 435 Senao International Co. Ltd. 149,000 434 Cheng Loong Corp. 908,920 426 WT Microelectronics Co. Ltd. 336,601 411 Unity Opto Technology Co. Ltd. 338,000 410 * Mercuries Life Insurance Co. Ltd. 640,240 410 Chong Hong Construction Co. 152,160 409 * Yieh Phui Enterprise Co. Ltd. 1,265,406 405 * Ritek Corp. 2,388,000 404 Radium Life Tech Co. Ltd. 522,267 397
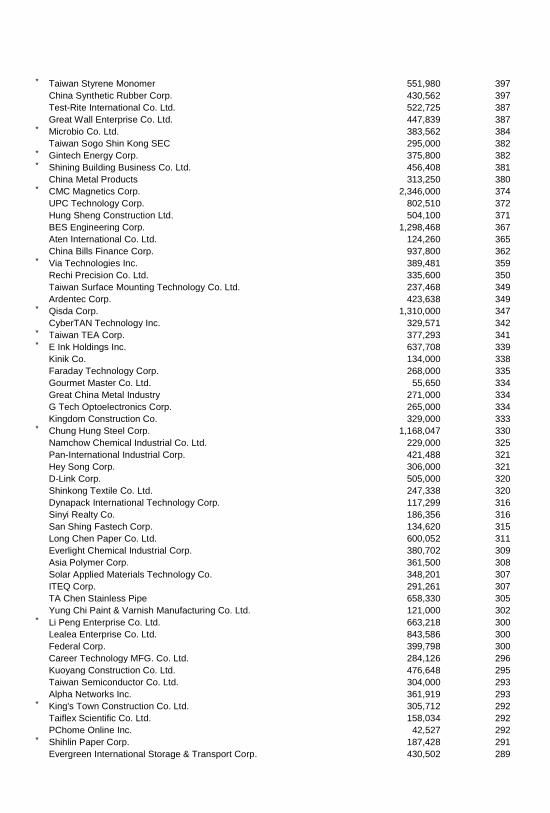
* Taiwan Styrene Monomer 551,980 397 China Synthetic Rubber Corp. 430,562 397 Test-Rite International Co. Ltd. 522,725 387 Great Wall Enterprise Co. Ltd. 447,839 387 * Microbio Co. Ltd. 383,562 384 Taiwan Sogo Shin Kong SEC 295,000 382 * Gintech Energy Corp. 375,800 382 * Shining Building Business Co. Ltd. 456,408 381 China Metal Products 313,250 380 * CMC Magnetics Corp. 2,346,000 374 UPC Technology Corp. 802,510 372 Hung Sheng Construction Ltd. 504,100 371 BES Engineering Corp. 1,298,468 367 Aten International Co. Ltd. 124,260 365 China Bills Finance Corp. 937,800 362 * Via Technologies Inc. 389,481 359 Rechi Precision Co. Ltd. 335,600 350 Taiwan Surface Mounting Technology Co. Ltd. 237,468 349 Ardentec Corp. 423,638 349 * Qisda Corp. 1,310,000 347 CyberTAN Technology Inc. 329,571 342 * Taiwan TEA Corp. 377,293 341 * E Ink Holdings Inc. 637,708 339 Kinik Co. 134,000 338 Faraday Technology Corp. 268,000 335 Gourmet Master Co. Ltd. 55,650 334 Great China Metal Industry 271,000 334 G Tech Optoelectronics Corp. 265,000 334 Kingdom Construction Co. 329,000 333 * Chung Hung Steel Corp. 1,168,047 330 Namchow Chemical Industrial Co. Ltd. 229,000 325 Pan-International Industrial Corp. 421,488 321 Hey Song Corp. 306,000 321 D-Link Corp. 505,000 320 Shinkong Textile Co. Ltd. 247,338 320 Dynapack International Technology Corp. 117,299 316 Sinyi Realty Co. 186,356 316 San Shing Fastech Corp. 134,620 315 Long Chen Paper Co. Ltd. 600,052 311 Everlight Chemical Industrial Corp. 380,702 309 Asia Polymer Corp. 361,500 308 Solar Applied Materials Technology Co. 348,201 307 ITEQ Corp. 291,261 307 TA Chen Stainless Pipe 658,330 305 Yung Chi Paint & Varnish Manufacturing Co. Ltd. 121,000 302 * Li Peng Enterprise Co. Ltd. 663,218 300 Lealea Enterprise Co. Ltd. 843,586 300 Federal Corp. 399,798 300 Career Technology MFG. Co. Ltd. 284,126 296 Kuoyang Construction Co. Ltd. 476,648 295 Taiwan Semiconductor Co. Ltd. 304,000 293 Alpha Networks Inc. 361,919 293 * King's Town Construction Co. Ltd. 305,712 292 Taiflex Scientific Co. Ltd. 158,034 292 PChome Online Inc. 42,527 292 * Shihlin Paper Corp. 187,428 291 Evergreen International Storage & Transport Corp. 430,502 289
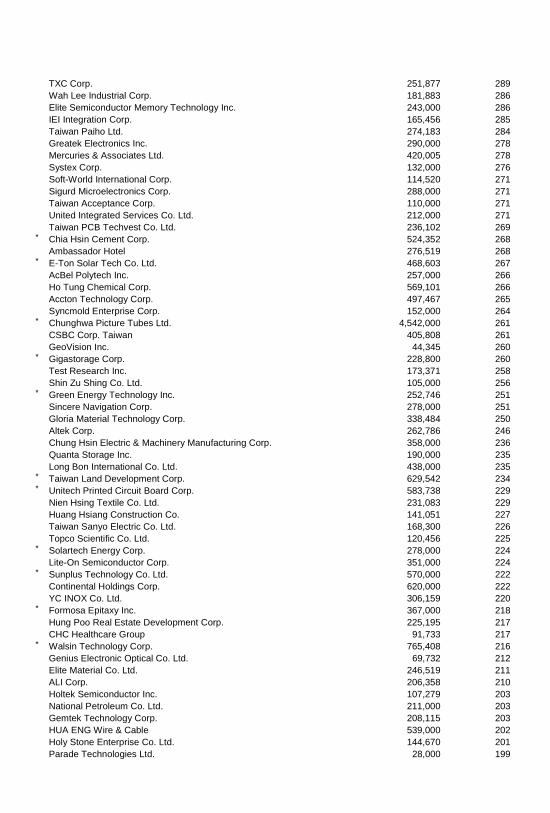
TXC Corp. 251,877 289 Wah Lee Industrial Corp. 181,883 286 Elite Semiconductor Memory Technology Inc. 243,000 286 IEI Integration Corp. 165,456 285 Taiwan Paiho Ltd. 274,183 284 Greatek Electronics Inc. 290,000 278 Mercuries & Associates Ltd. 420,005 278 Systex Corp. 132,000 276 Soft-World International Corp. 114,520 271 Sigurd Microelectronics Corp. 288,000 271 Taiwan Acceptance Corp. 110,000 271 United Integrated Services Co. Ltd. 212,000 271 Taiwan PCB Techvest Co. Ltd. 236,102 269 * Chia Hsin Cement Corp. 524,352 268 Ambassador Hotel 276,519 268 * E-Ton Solar Tech Co. Ltd. 468,603 267 AcBel Polytech Inc. 257,000 266 Ho Tung Chemical Corp. 569,101 266 Accton Technology Corp. 497,467 265 Syncmold Enterprise Corp. 152,000 264 * Chunghwa Picture Tubes Ltd. 4,542,000 261 CSBC Corp. Taiwan 405,808 261 GeoVision Inc. 44,345 260 * Gigastorage Corp. 228,800 260 Test Research Inc. 173,371 258 Shin Zu Shing Co. Ltd. 105,000 256 * Green Energy Technology Inc. 252,746 251 Sincere Navigation Corp. 278,000 251 Gloria Material Technology Corp. 338,484 250 Altek Corp. 262,786 246 Chung Hsin Electric & Machinery Manufacturing Corp. 358,000 236 Quanta Storage Inc. 190,000 235 Long Bon International Co. Ltd. 438,000 235 * Taiwan Land Development Corp. 629,542 234 * Unitech Printed Circuit Board Corp. 583,738 229 Nien Hsing Textile Co. Ltd. 231,083 229 Huang Hsiang Construction Co. 141,051 227 Taiwan Sanyo Electric Co. Ltd. 168,300 226 Topco Scientific Co. Ltd. 120,456 225 * Solartech Energy Corp. 278,000 224 Lite-On Semiconductor Corp. 351,000 224 * Sunplus Technology Co. Ltd. 570,000 222 Continental Holdings Corp. 620,000 222 YC INOX Co. Ltd. 306,159 220 * Formosa Epitaxy Inc. 367,000 218 Hung Poo Real Estate Development Corp. 225,195 217 CHC Healthcare Group 91,733 217 * Walsin Technology Corp. 765,408 216 Genius Electronic Optical Co. Ltd. 69,732 212 Elite Material Co. Ltd. 246,519 211 ALI Corp. 206,358 210 Holtek Semiconductor Inc. 107,279 203 National Petroleum Co. Ltd. 211,000 203 Gemtek Technology Corp. 208,115 203 HUA ENG Wire & Cable 539,000 202 Holy Stone Enterprise Co. Ltd. 144,670 201 Parade Technologies Ltd. 28,000 199
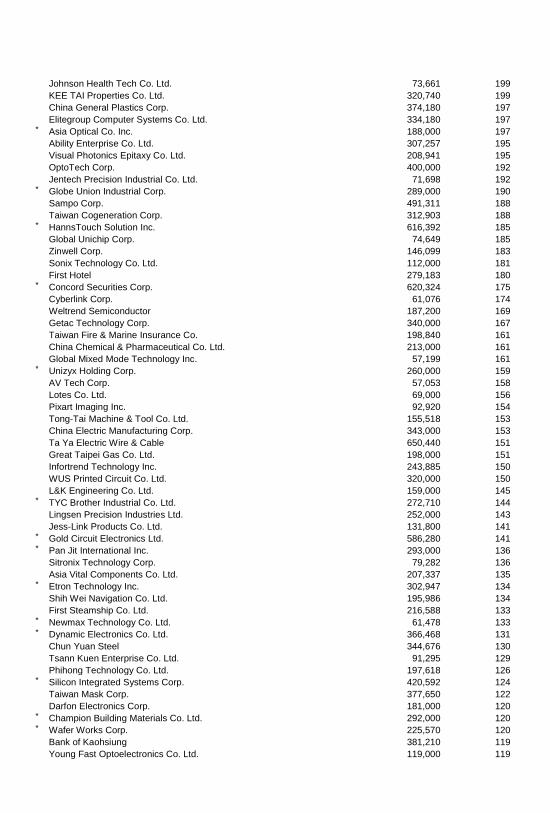
Johnson Health Tech Co. Ltd. 73,661 199 KEE TAI Properties Co. Ltd. 320,740 199 China General Plastics Corp. 374,180 197 Elitegroup Computer Systems Co. Ltd. 334,180 197 * Asia Optical Co. Inc. 188,000 197 Ability Enterprise Co. Ltd. 307,257 195 Visual Photonics Epitaxy Co. Ltd. 208,941 195 OptoTech Corp. 400,000 192 Jentech Precision Industrial Co. Ltd. 71,698 192 * Globe Union Industrial Corp. 289,000 190 Sampo Corp. 491,311 188 Taiwan Cogeneration Corp. 312,903 188 * HannsTouch Solution Inc. 616,392 185 Global Unichip Corp. 74,649 185 Zinwell Corp. 146,099 183 Sonix Technology Co. Ltd. 112,000 181 First Hotel 279,183 180 * Concord Securities Corp. 620,324 175 Cyberlink Corp. 61,076 174 Weltrend Semiconductor 187,200 169 Getac Technology Corp. 340,000 167 Taiwan Fire & Marine Insurance Co. 198,840 161 China Chemical & Pharmaceutical Co. Ltd. 213,000 161 Global Mixed Mode Technology Inc. 57,199 161 * Unizyx Holding Corp. 260,000 159 AV Tech Corp. 57,053 158 Lotes Co. Ltd. 69,000 156 Pixart Imaging Inc. 92,920 154 Tong-Tai Machine & Tool Co. Ltd. 155,518 153 China Electric Manufacturing Corp. 343,000 153 Ta Ya Electric Wire & Cable 650,440 151 Great Taipei Gas Co. Ltd. 198,000 151 Infortrend Technology Inc. 243,885 150 WUS Printed Circuit Co. Ltd. 320,000 150 L&K Engineering Co. Ltd. 159,000 145 * TYC Brother Industrial Co. Ltd. 272,710 144 Lingsen Precision Industries Ltd. 252,000 143 Jess-Link Products Co. Ltd. 131,800 141 * Gold Circuit Electronics Ltd. 586,280 141 * Pan Jit International Inc. 293,000 136 Sitronix Technology Corp. 79,282 136 Asia Vital Components Co. Ltd. 207,337 135 * Etron Technology Inc. 302,947 134 Shih Wei Navigation Co. Ltd. 195,986 134 First Steamship Co. Ltd. 216,588 133 * Newmax Technology Co. Ltd. 61,478 133 * Dynamic Electronics Co. Ltd. 366,468 131 Chun Yuan Steel 344,676 130 Tsann Kuen Enterprise Co. Ltd. 91,295 129 Phihong Technology Co. Ltd. 197,618 126 * Silicon Integrated Systems Corp. 420,592 124 Taiwan Mask Corp. 377,650 122 Darfon Electronics Corp. 181,000 120 * Champion Building Materials Co. Ltd. 292,000 120 * Wafer Works Corp. 225,570 120 Bank of Kaohsiung 381,210 119 Young Fast Optoelectronics Co. Ltd. 119,000 119
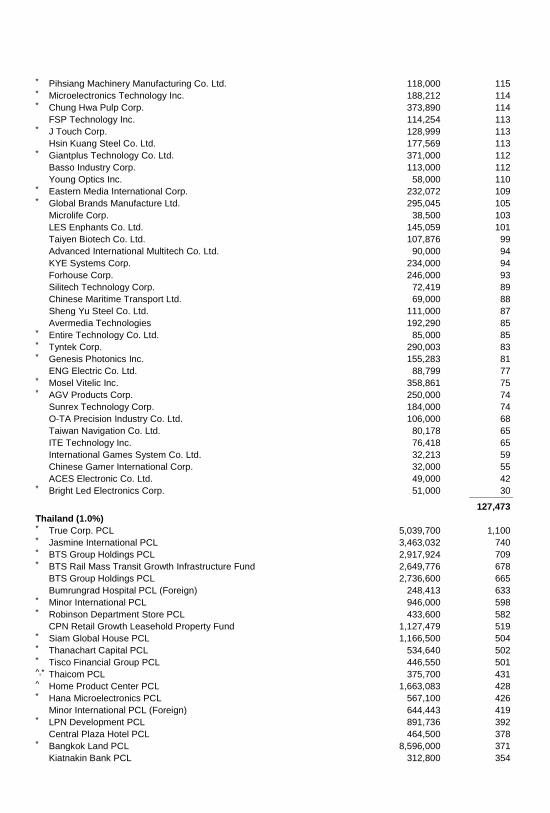
* Pihsiang Machinery Manufacturing Co. Ltd. 118,000 115 * Microelectronics Technology Inc. 188,212 114 * Chung Hwa Pulp Corp. 373,890 114 FSP Technology Inc. 114,254 113 * J Touch Corp. 128,999 113 Hsin Kuang Steel Co. Ltd. 177,569 113 * Giantplus Technology Co. Ltd. 371,000 112 Basso Industry Corp. 113,000 112 Young Optics Inc. 58,000 110 * Eastern Media International Corp. 232,072 109 * Global Brands Manufacture Ltd. 295,045 105 Microlife Corp. 38,500 103 LES Enphants Co. Ltd. 145,059 101 Taiyen Biotech Co. Ltd. 107,876 99 Advanced International Multitech Co. Ltd. 90,000 94 KYE Systems Corp. 234,000 94 Forhouse Corp. 246,000 93 Silitech Technology Corp. 72,419 89 Chinese Maritime Transport Ltd. 69,000 88 Sheng Yu Steel Co. Ltd. 111,000 87 Avermedia Technologies 192,290 85 * Entire Technology Co. Ltd. 85,000 85 * Tyntek Corp. 290,003 83 * Genesis Photonics Inc. 155,283 81 ENG Electric Co. Ltd. 88,799 77 * Mosel Vitelic Inc. 358,861 75 * AGV Products Corp. 250,000 74 Sunrex Technology Corp. 184,000 74 O-TA Precision Industry Co. Ltd. 106,000 68 Taiwan Navigation Co. Ltd. 80,178 65 ITE Technology Inc. 76,418 65 International Games System Co. Ltd. 32,213 59 Chinese Gamer International Corp. 32,000 55 ACES Electronic Co. Ltd. 49,000 42 * Bright Led Electronics Corp. 51,000 30 _____________
127,473
Thailand (1.0%)
* True Corp. PCL 5,039,700 1,100 * Jasmine International PCL 3,463,032 740 * BTS Group Holdings PCL 2,917,924 709 * BTS Rail Mass Transit Growth Infrastructure Fund 2,649,776 678 BTS Group Holdings PCL 2,736,600 665 Bumrungrad Hospital PCL (Foreign) 248,413 633 * Minor International PCL 946,000 598 * Robinson Department Store PCL 433,600 582 CPN Retail Growth Leasehold Property Fund 1,127,479 519 * Siam Global House PCL 1,166,500 504 * Thanachart Capital PCL 534,640 502 * Tisco Financial Group PCL 446,550 501 ^,* Thaicom PCL 375,700 431 ^ Home Product Center PCL 1,663,083 428 * Hana Microelectronics PCL 567,100 426 Minor International PCL (Foreign) 644,443 419 * LPN Development PCL 891,736 392 Central Plaza Hotel PCL 464,500 378 * Bangkok Land PCL 8,596,000 371 Kiatnakin Bank PCL 312,800 354
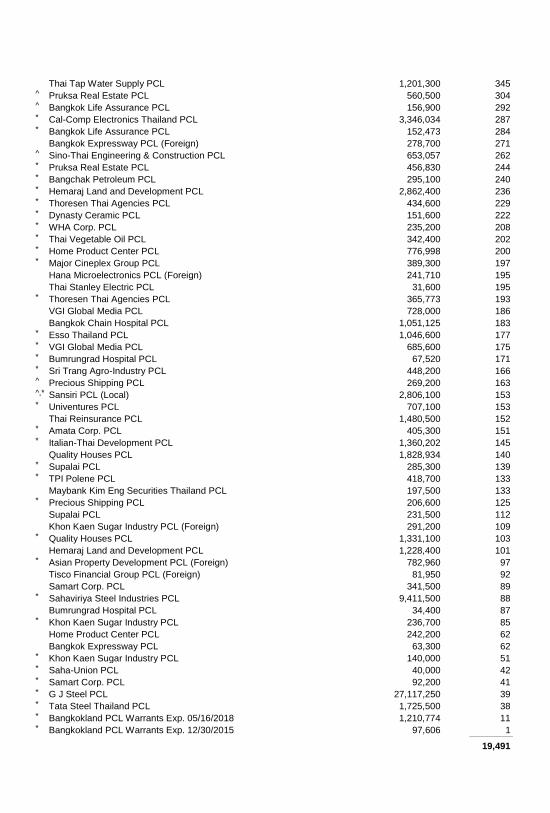
Thai Tap Water Supply PCL 1,201,300 345 ^ Pruksa Real Estate PCL 560,500 304 ^ Bangkok Life Assurance PCL 156,900 292 * Cal-Comp Electronics Thailand PCL 3,346,034 287 * Bangkok Life Assurance PCL 152,473 284 Bangkok Expressway PCL (Foreign) 278,700 271 ^ Sino-Thai Engineering & Construction PCL 653,057 262 * Pruksa Real Estate PCL 456,830 244 * Bangchak Petroleum PCL 295,100 240 * Hemaraj Land and Development PCL 2,862,400 236 * Thoresen Thai Agencies PCL 434,600 229 * Dynasty Ceramic PCL 151,600 222 * WHA Corp. PCL 235,200 208 * Thai Vegetable Oil PCL 342,400 202 * Home Product Center PCL 776,998 200 * Major Cineplex Group PCL 389,300 197 Hana Microelectronics PCL (Foreign) 241,710 195 Thai Stanley Electric PCL 31,600 195 * Thoresen Thai Agencies PCL 365,773 193 VGI Global Media PCL 728,000 186 Bangkok Chain Hospital PCL 1,051,125 183 * Esso Thailand PCL 1,046,600 177 * VGI Global Media PCL 685,600 175 * Bumrungrad Hospital PCL 67,520 171 * Sri Trang Agro-Industry PCL 448,200 166 ^ Precious Shipping PCL 269,200 163 ^,* Sansiri PCL (Local) 2,806,100 153 * Univentures PCL 707,100 153 Thai Reinsurance PCL 1,480,500 152 * Amata Corp. PCL 405,300 151 * Italian-Thai Development PCL 1,360,202 145 Quality Houses PCL 1,828,934 140 * Supalai PCL 285,300 139 * TPI Polene PCL 418,700 133 Maybank Kim Eng Securities Thailand PCL 197,500 133 * Precious Shipping PCL 206,600 125 Supalai PCL 231,500 112 Khon Kaen Sugar Industry PCL (Foreign) 291,200 109 * Quality Houses PCL 1,331,100 103 Hemaraj Land and Development PCL 1,228,400 101 * Asian Property Development PCL (Foreign) 782,960 97 Tisco Financial Group PCL (Foreign) 81,950 92 Samart Corp. PCL 341,500 89 * Sahaviriya Steel Industries PCL 9,411,500 88 Bumrungrad Hospital PCL 34,400 87 * Khon Kaen Sugar Industry PCL 236,700 85 Home Product Center PCL 242,200 62 Bangkok Expressway PCL 63,300 62 * Khon Kaen Sugar Industry PCL 140,000 51 * Saha-Union PCL 40,000 42 * Samart Corp. PCL 92,200 41 * G J Steel PCL 27,117,250 39 * Tata Steel Thailand PCL 1,725,500 38 * Bangkokland PCL Warrants Exp. 05/16/2018 1,210,774 11 * Bangkokland PCL Warrants Exp. 12/30/2015 97,606 1 _____________
19,491
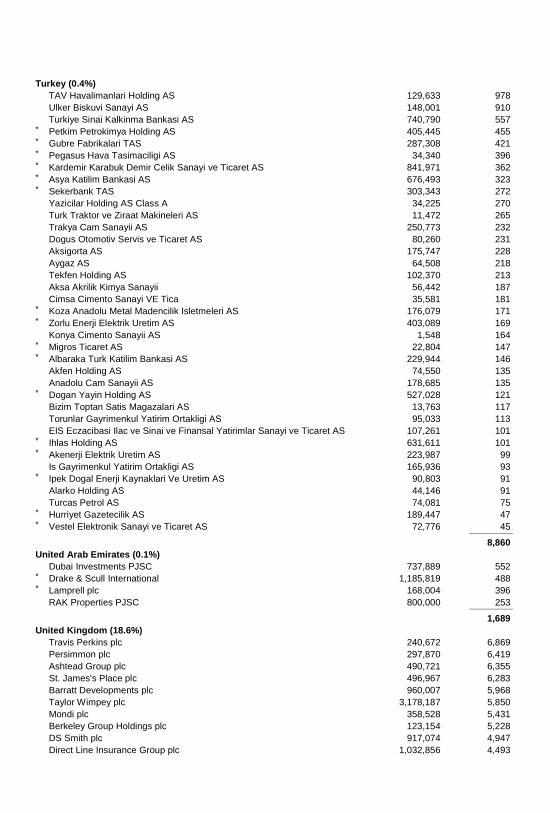
Turkey (0.4%)
TAV Havalimanlari Holding AS 129,633 978 Ulker Biskuvi Sanayi AS 148,001 910 Turkiye Sinai Kalkinma Bankasi AS 740,790 557 * Petkim Petrokimya Holding AS 405,445 455 * Gubre Fabrikalari TAS 287,308 421 * Pegasus Hava Tasimaciligi AS 34,340 396 * Kardemir Karabuk Demir Celik Sanayi ve Ticaret AS 841,971 362 * Asya Katilim Bankasi AS 676,493 323 * Sekerbank TAS 303,343 272 Yazicilar Holding AS Class A 34,225 270 Turk Traktor ve Ziraat Makineleri AS 11,472 265 Trakya Cam Sanayii AS 250,773 232 Dogus Otomotiv Servis ve Ticaret AS 80,260 231 Aksigorta AS 175,747 228 Aygaz AS 64,508 218 Tekfen Holding AS 102,370 213 Aksa Akrilik Kimya Sanayii 56,442 187 Cimsa Cimento Sanayi VE Tica 35,581 181 * Koza Anadolu Metal Madencilik Isletmeleri AS 176,079 171 * Zorlu Enerji Elektrik Uretim AS 403,089 169 Konya Cimento Sanayii AS 1,548 164 * Migros Ticaret AS 22,804 147 * Albaraka Turk Katilim Bankasi AS 229,944 146 Akfen Holding AS 74,550 135 Anadolu Cam Sanayii AS 178,685 135 * Dogan Yayin Holding AS 527,028 121 Bizim Toptan Satis Magazalari AS 13,763 117 Torunlar Gayrimenkul Yatirim Ortakligi AS 95,033 113 EIS Eczacibasi Ilac ve Sinai ve Finansal Yatirimlar Sanayi ve Ticaret AS 107,261 101 * Ihlas Holding AS 631,611 101 * Akenerji Elektrik Uretim AS 223,987 99 Is Gayrimenkul Yatirim Ortakligi AS 165,936 93 * Ipek Dogal Enerji Kaynaklari Ve Uretim AS 90,803 91 Alarko Holding AS 44,146 91 Turcas Petrol AS 74,081 75 * Hurriyet Gazetecilik AS 189,447 47 * Vestel Elektronik Sanayi ve Ticaret AS 72,776 45 _____________
8,860
United Arab Emirates (0.1%)
Dubai Investments PJSC 737,889 552 * Drake & Scull International 1,185,819 488 * Lamprell plc 168,004 396 RAK Properties PJSC 800,000 253 _____________
1,689
United Kingdom (18.6%)
Travis Perkins plc 240,672 6,869 Persimmon plc 297,870 6,419 Ashtead Group plc 490,721 6,355 St. James's Place plc 496,967 6,283 Barratt Developments plc 960,007 5,968 Taylor Wimpey plc 3,178,187 5,850 Mondi plc 358,528 5,431 Berkeley Group Holdings plc 123,154 5,228 DS Smith plc 917,074 4,947 Direct Line Insurance Group plc 1,032,856 4,493
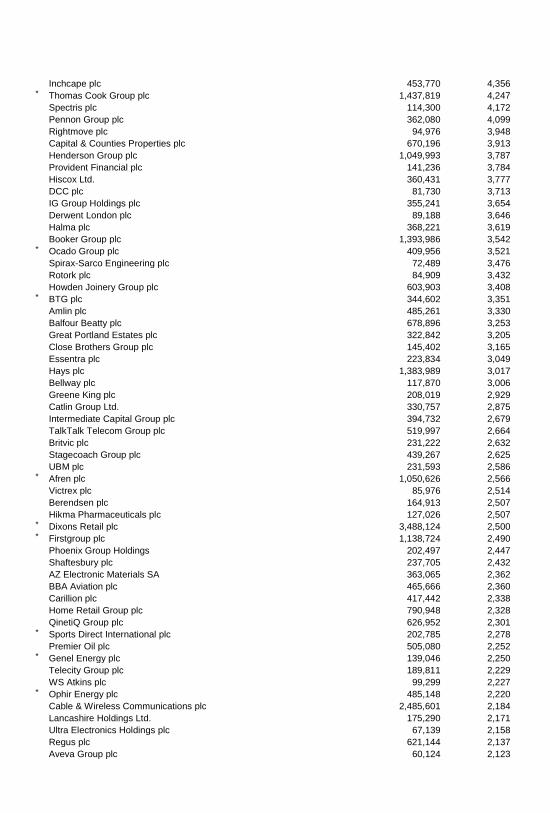
Inchcape plc 453,770 4,356 * Thomas Cook Group plc 1,437,819 4,247 Spectris plc 114,300 4,172 Pennon Group plc 362,080 4,099 Rightmove plc 94,976 3,948 Capital & Counties Properties plc 670,196 3,913 Henderson Group plc 1,049,993 3,787 Provident Financial plc 141,236 3,784 Hiscox Ltd. 360,431 3,777 DCC plc 81,730 3,713 IG Group Holdings plc 355,241 3,654 Derwent London plc 89,188 3,646 Halma plc 368,221 3,619 Booker Group plc 1,393,986 3,542 * Ocado Group plc 409,956 3,521 Spirax-Sarco Engineering plc 72,489 3,476 Rotork plc 84,909 3,432 Howden Joinery Group plc 603,903 3,408 * BTG plc 344,602 3,351 Amlin plc 485,261 3,330 Balfour Beatty plc 678,896 3,253 Great Portland Estates plc 322,842 3,205 Close Brothers Group plc 145,402 3,165 Essentra plc 223,834 3,049 Hays plc 1,383,989 3,017 Bellway plc 117,870 3,006 Greene King plc 208,019 2,929 Catlin Group Ltd. 330,757 2,875 Intermediate Capital Group plc 394,732 2,679 TalkTalk Telecom Group plc 519,997 2,664 Britvic plc 231,222 2,632 Stagecoach Group plc 439,267 2,625 UBM plc 231,593 2,586 * Afren plc 1,050,626 2,566 Victrex plc 85,976 2,514 Berendsen plc 164,913 2,507 Hikma Pharmaceuticals plc 127,026 2,507 * Dixons Retail plc 3,488,124 2,500 * Firstgroup plc 1,138,724 2,490 Phoenix Group Holdings 202,497 2,447 Shaftesbury plc 237,705 2,432 AZ Electronic Materials SA 363,065 2,362 BBA Aviation plc 465,666 2,360 Carillion plc 417,442 2,338 Home Retail Group plc 790,948 2,328 QinetiQ Group plc 626,952 2,301 * Sports Direct International plc 202,785 2,278 Premier Oil plc 505,080 2,252 * Genel Energy plc 139,046 2,250 Telecity Group plc 189,811 2,229 WS Atkins plc 99,299 2,227 * Ophir Energy plc 485,148 2,220 Cable & Wireless Communications plc 2,485,601 2,184 Lancashire Holdings Ltd. 175,290 2,171 Ultra Electronics Holdings plc 67,139 2,158 Regus plc 621,144 2,137 Aveva Group plc 60,124 2,123
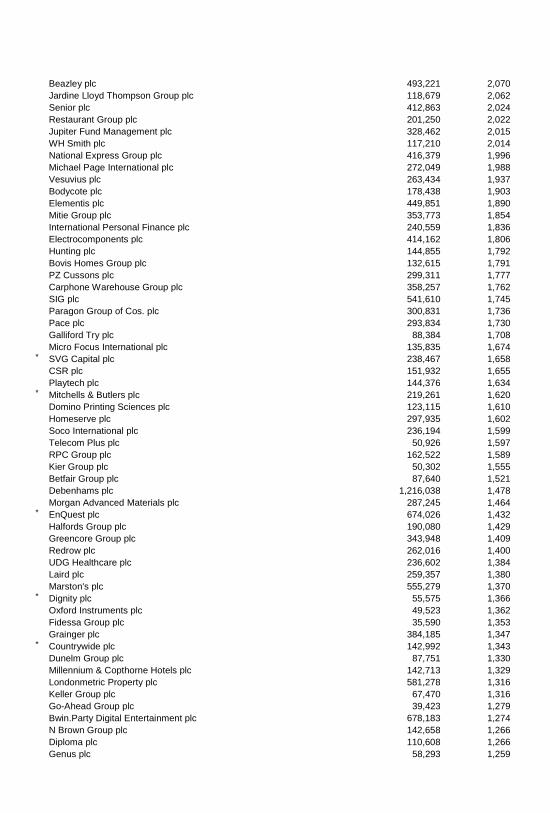
Beazley plc 493,221 2,070 Jardine Lloyd Thompson Group plc 118,679 2,062 Senior plc 412,863 2,024 Restaurant Group plc 201,250 2,022 Jupiter Fund Management plc 328,462 2,015 WH Smith plc 117,210 2,014 National Express Group plc 416,379 1,996 Michael Page International plc 272,049 1,988 Vesuvius plc 263,434 1,937 Bodycote plc 178,438 1,903 Elementis plc 449,851 1,890 Mitie Group plc 353,773 1,854 International Personal Finance plc 240,559 1,836 Electrocomponents plc 414,162 1,806 Hunting plc 144,855 1,792 Bovis Homes Group plc 132,615 1,791 PZ Cussons plc 299,311 1,777 Carphone Warehouse Group plc 358,257 1,762 SIG plc 541,610 1,745 Paragon Group of Cos. plc 300,831 1,736 Pace plc 293,834 1,730 Galliford Try plc 88,384 1,708 Micro Focus International plc 135,835 1,674 * SVG Capital plc 238,467 1,658 CSR plc 151,932 1,655 Playtech plc 144,376 1,634 * Mitchells & Butlers plc 219,261 1,620 Domino Printing Sciences plc 123,115 1,610 Homeserve plc 297,935 1,602 Soco International plc 236,194 1,599 Telecom Plus plc 50,926 1,597 RPC Group plc 162,522 1,589 Kier Group plc 50,302 1,555 Betfair Group plc 87,640 1,521 Debenhams plc 1,216,038 1,478 Morgan Advanced Materials plc 287,245 1,464 * EnQuest plc 674,026 1,432 Halfords Group plc 190,080 1,429 Greencore Group plc 343,948 1,409 Redrow plc 262,016 1,400 UDG Healthcare plc 236,602 1,384 Laird plc 259,357 1,380 Marston's plc 555,279 1,370 * Dignity plc 55,575 1,366 Oxford Instruments plc 49,523 1,362 Fidessa Group plc 35,590 1,353 Grainger plc 384,185 1,347 * Countrywide plc 142,992 1,343 Dunelm Group plc 87,751 1,330 Millennium & Copthorne Hotels plc 142,713 1,329 Londonmetric Property plc 581,278 1,316 Keller Group plc 67,470 1,316 Go-Ahead Group plc 39,423 1,279 Bwin.Party Digital Entertainment plc 678,183 1,274 N Brown Group plc 142,658 1,266 Diploma plc 110,608 1,266 Genus plc 58,293 1,259
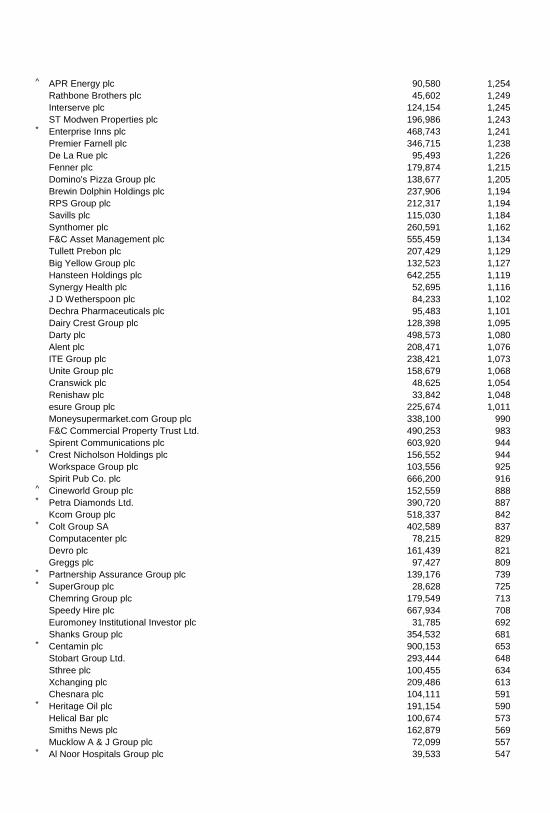
^ APR Energy plc 90,580 1,254 Rathbone Brothers plc 45,602 1,249 Interserve plc 124,154 1,245 ST Modwen Properties plc 196,986 1,243 * Enterprise Inns plc 468,743 1,241 Premier Farnell plc 346,715 1,238 De La Rue plc 95,493 1,226 Fenner plc 179,874 1,215 Domino's Pizza Group plc 138,677 1,205 Brewin Dolphin Holdings plc 237,906 1,194 RPS Group plc 212,317 1,194 Savills plc 115,030 1,184 Synthomer plc 260,591 1,162 F&C Asset Management plc 555,459 1,134 Tullett Prebon plc 207,429 1,129 Big Yellow Group plc 132,523 1,127 Hansteen Holdings plc 642,255 1,119 Synergy Health plc 52,695 1,116 J D Wetherspoon plc 84,233 1,102 Dechra Pharmaceuticals plc 95,483 1,101 Dairy Crest Group plc 128,398 1,095 Darty plc 498,573 1,080 Alent plc 208,471 1,076 ITE Group plc 238,421 1,073 Unite Group plc 158,679 1,068 Cranswick plc 48,625 1,054 Renishaw plc 33,842 1,048 esure Group plc 225,674 1,011 Moneysupermarket.com Group plc 338,100 990 F&C Commercial Property Trust Ltd. 490,253 983 Spirent Communications plc 603,920 944 * Crest Nicholson Holdings plc 156,552 944 Workspace Group plc 103,556 925 Spirit Pub Co. plc 666,200 916 ^ Cineworld Group plc 152,559 888 * Petra Diamonds Ltd. 390,720 887 Kcom Group plc 518,337 842 * Colt Group SA 402,589 837 Computacenter plc 78,215 829 Devro plc 161,439 821 Greggs plc 97,427 809 * Partnership Assurance Group plc 139,176 739 * SuperGroup plc 28,628 725 Chemring Group plc 179,549 713 Speedy Hire plc 667,934 708 Euromoney Institutional Investor plc 31,785 692 Shanks Group plc 354,532 681 * Centamin plc 900,153 653 Stobart Group Ltd. 293,444 648 Sthree plc 100,455 634 Xchanging plc 209,486 613 Chesnara plc 104,111 591 * Heritage Oil plc 191,154 590 Helical Bar plc 100,674 573 Smiths News plc 162,879 569 Mucklow A & J Group plc 72,099 557 * Al Noor Hospitals Group plc 39,533 547

^,* Imagination Technologies Group plc 191,570 542 UK Commercial Property Trust Ltd. 413,753 523 Schroder REIT Ltd. 586,909 521 Development Securities plc 125,803 508 Morgan Sindall Group plc 38,158 501 Hochschild Mining plc 197,008 496 Cape plc 111,115 490 * Premier Foods plc 191,846 453 SDL plc 73,436 440 * Aquarius Platinum Ltd. 674,069 437 * Perform Group plc 96,694 393 * Salamander Energy plc 219,336 383 * Gem Diamonds Ltd. 134,777 352 Picton Property Income Ltd. 342,986 330 * Asia Resource Minerals plc 81,487 323 ^,* Mothercare plc 73,260 315 888 Holdings plc 124,984 294 Daejan Holdings plc 3,334 266 Anglo Pacific Group plc 74,188 224 Petropavlovsk plc 174,667 202 ^,* Talvivaara Mining Co. plc 1,128,309 104 * Cineworld Group Rights Exp. 02/13/2014 48,818 99 ^,* New World Resources plc 78,873 66 * Connaught plc 50,771 — _____________
380,401
Total Common Stocks (Cost $1,776,363) 2,036,579
Coupon
Temporary Cash Investments (5.4%)1
Money Market Fund (5.3%) 3,4 Vanguard Market Liquidity Fund 0.130% 108,715,288 108,715
Maturity
Date
Face
Amount
($000)
U.S. Government and Agency Obligations (0.1%)
5,6 Fannie Mae Discount Notes 0.060% 3/19/14 100 100 6,7 Federal Home Loan Bank Discount Notes 0.090% 3/21/14 300 300 7 Federal Home Loan Bank Discount Notes 0.070% 4/9/14 100 100 5,6 Freddie Mac Discount Notes 0.080% 2/10/14 100 100 _____________
600
Total Temporary Cash Investments (Cost $109,315) 109,315
Total Investments (105.1%) (Cost $1,885,678) 2,145,894
Other Assets and Liabilities-Net (-5.1%)4 (103,391)
Net Assets (100%) 2,042,503
^ Includes partial security positions on loan to broker-dealers. The total value of securities on loan is $95,121,000.
* Non-income-producing security.
1 The fund invests a portion of its cash reserves in equity markets through the use of index futures contracts. After giving effect to futures investments, the fund's effective common stock and temporary cash investment positions represent 100.0% and 5.1%, respectively, of net assets.
2 Security exempt from registration under Rule 144A of the Securities Act of 1933. Such securities may be sold in transactions exempt from registration, normally to qualified institutional buyers. At January 31, 2014, the aggregate value of these securities was $1,072,000, representing 0.1% of net assets.
3 Affiliated money market fund available only to Vanguard funds and certain trusts and accounts managed by Vanguard. Rate shown is the 7-day yield.
4 Includes $105,843,000 of collateral received for securities on loan.
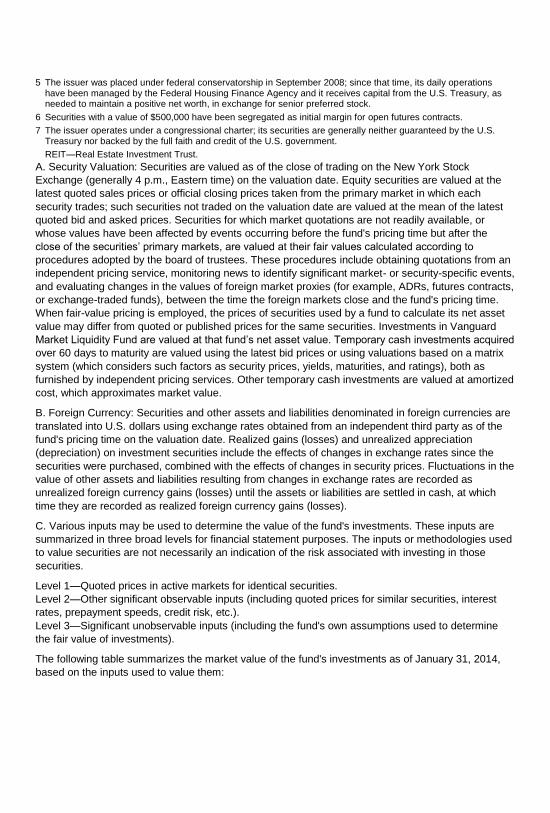
5 The issuer was placed under federal conservatorship in September 2008; since that time, its daily operations have been managed by the Federal Housing Finance Agency and it receives capital from the U.S. Treasury, as needed to maintain a positive net worth, in exchange for senior preferred stock.
6 Securities with a value of $500,000 have been segregated as initial margin for open futures contracts.
7 The issuer operates under a congressional charter; its securities are generally neither guaranteed by the U.S. Treasury nor backed by the full faith and credit of the U.S. government.
REIT—Real Estate Investment Trust.
A. Security Valuation: Securities are valued as of the close of trading on the New York Stock
Exchange (generally 4 p.m., Eastern time) on the valuation date. Equity securities are valued at the
latest quoted sales prices or official closing prices taken from the primary market in which each
security trades; such securities not traded on the valuation date are valued at the mean of the latest
quoted bid and asked prices. Securities for which market quotations are not readily available, or
whose values have been affected by events occurring before the fund's pricing time but after the
close of the securities’ primary markets, are valued at their fair values calculated according to
procedures adopted by the board of trustees. These procedures include obtaining quotations from an
independent pricing service, monitoring news to identify significant market- or security-specific events,
and evaluating changes in the values of foreign market proxies (for example, ADRs, futures contracts,
or exchange-traded funds), between the time the foreign markets close and the fund's pricing time.
When fair-value pricing is employed, the prices of securities used by a fund to calculate its net asset
value may differ from quoted or published prices for the same securities. Investments in Vanguard
Market Liquidity Fund are valued at that fund’s net asset value. Temporary cash investments acquired
over 60 days to maturity are valued using the latest bid prices or using valuations based on a matrix
system (which considers such factors as security prices, yields, maturities, and ratings), both as
furnished by independent pricing services. Other temporary cash investments are valued at amortized
cost, which approximates market value.
B. Foreign Currency: Securities and other assets and liabilities denominated in foreign currencies are
translated into U.S. dollars using exchange rates obtained from an independent third party as of the
fund's pricing time on the valuation date. Realized gains (losses) and unrealized appreciation
(depreciation) on investment securities include the effects of changes in exchange rates since the
securities were purchased, combined with the effects of changes in security prices. Fluctuations in the
value of other assets and liabilities resulting from changes in exchange rates are recorded as
unrealized foreign currency gains (losses) until the assets or liabilities are settled in cash, at which
time they are recorded as realized foreign currency gains (losses).
C. Various inputs may be used to determine the value of the fund's investments. These inputs are
summarized in three broad levels for financial statement purposes. The inputs or methodologies used
to value securities are not necessarily an indication of the risk associated with investing in those
securities.
Level 1—Quoted prices in active markets for identical securities.
Level 2—Other significant observable inputs (including quoted prices for similar securities, interest
rates, prepayment speeds, credit risk, etc.).
Level 3—Significant unobservable inputs (including the fund's own assumptions used to determine
the fair value of investments).
The following table summarizes the market value of the fund's investments as of January 31, 2014,
based on the inputs used to value them:
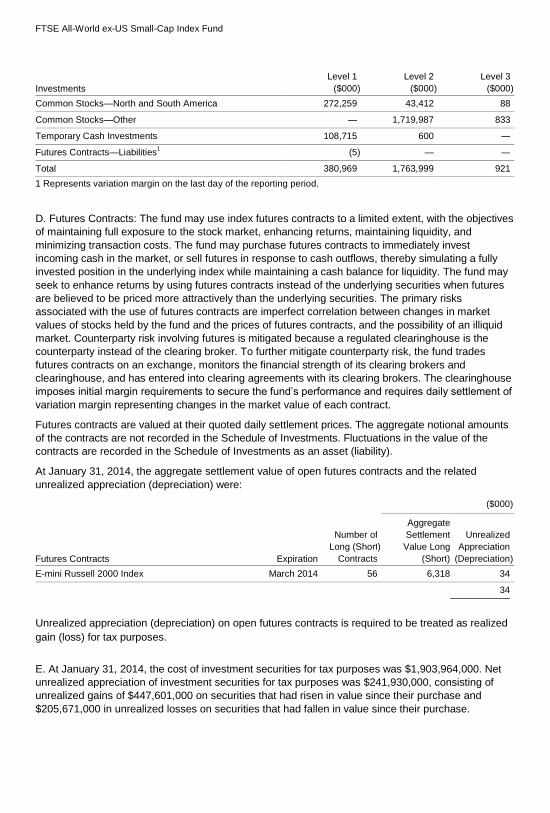
FTSE All-World ex-US Small-Cap Index Fund
Investments
Level 1
($000 )
Level 2
($000 )
Level 3
($000 )
Common Stocks—North and South America 272,259 43,412 88
Common Stocks—Other — 1,719,987 833
Temporary Cash Investments 108,715 600 —
Futures Contracts—Liabilities1 (5 ) — —
Total 380,969 1,763,999 921
1 Represents variation margin on the last day of the reporting period.
D. Futures Contracts: The fund may use index futures contracts to a limited extent, with the objectives
of maintaining full exposure to the stock market, enhancing returns, maintaining liquidity, and
minimizing transaction costs. The fund may purchase futures contracts to immediately invest
incoming cash in the market, or sell futures in response to cash outflows, thereby simulating a fully
invested position in the underlying index while maintaining a cash balance for liquidity. The fund may
seek to enhance returns by using futures contracts instead of the underlying securities when futures
are believed to be priced more attractively than the underlying securities. The primary risks
associated with the use of futures contracts are imperfect correlation between changes in market
values of stocks held by the fund and the prices of futures contracts, and the possibility of an illiquid
market. Counterparty risk involving futures is mitigated because a regulated clearinghouse is the
counterparty instead of the clearing broker. To further mitigate counterparty risk, the fund trades
futures contracts on an exchange, monitors the financial strength of its clearing brokers and
clearinghouse, and has entered into clearing agreements with its clearing brokers. The clearinghouse
imposes initial margin requirements to secure the fund’s performance and requires daily settlement of
variation margin representing changes in the market value of each contract.
Futures contracts are valued at their quoted daily settlement prices. The aggregate notional amounts
of the contracts are not recorded in the Schedule of Investments. Fluctuations in the value of the
contracts are recorded in the Schedule of Investments as an asset (liability).
At January 31, 2014, the aggregate settlement value of open futures contracts and the related
unrealized appreciation (depreciation) were:
($000 )
Futures Contracts Expiration
Number of
Long (Short
Contracts
)
Aggregate
Settlement
Value Long
(Short)
Unrealized
Appreciation
(Depreciation )
E-mini Russell 2000 Index March 2014 56 6,318 34
34
Unrealized appreciation (depreciation) on open futures contracts is required to be treated as realized
gain (loss) for tax purposes.
E. At January 31, 2014, the cost of investment securities for tax purposes was $1,903,964,000. Net
unrealized appreciation of investment securities for tax purposes was $241,930,000, consisting of
unrealized gains of $447,601,000 on securities that had risen in value since their purchase and
$205,671,000 in unrealized losses on securities that had fallen in value since their purchase.
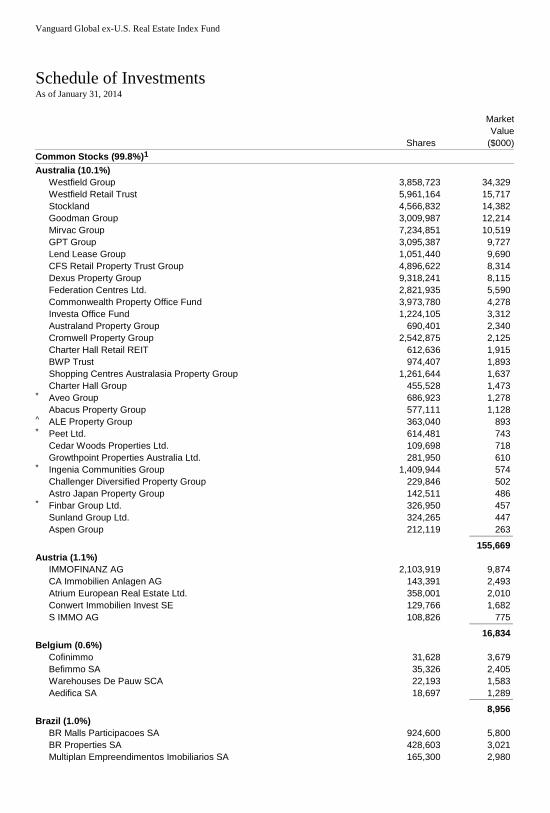
Vanguard Global ex-U.S. Real Estate Index Fund
Schedule of Investments As of January 31, 2014
Shares
Market
Value
($000)
Common Stocks (99.8%)1
Australia (10.1%)
Westfield Group 3,858,723 34,329 Westfield Retail Trust 5,961,164 15,717 Stockland 4,566,832 14,382 Goodman Group 3,009,987 12,214 Mirvac Group 7,234,851 10,519 GPT Group 3,095,387 9,727 Lend Lease Group 1,051,440 9,690 CFS Retail Property Trust Group 4,896,622 8,314 Dexus Property Group 9,318,241 8,115 Federation Centres Ltd. 2,821,935 5,590 Commonwealth Property Office Fund 3,973,780 4,278 Investa Office Fund 1,224,105 3,312 Australand Property Group 690,401 2,340 Cromwell Property Group 2,542,875 2,125 Charter Hall Retail REIT 612,636 1,915 BWP Trust 974,407 1,893 Shopping Centres Australasia Property Group 1,261,644 1,637 Charter Hall Group 455,528 1,473 * Aveo Group 686,923 1,278 Abacus Property Group 577,111 1,128 ^ ALE Property Group 363,040 893 * Peet Ltd. 614,481 743 Cedar Woods Properties Ltd. 109,698 718 Growthpoint Properties Australia Ltd. 281,950 610 * Ingenia Communities Group 1,409,944 574 Challenger Diversified Property Group 229,846 502 Astro Japan Property Group 142,511 486 * Finbar Group Ltd. 326,950 457 Sunland Group Ltd. 324,265 447 Aspen Group 212,119 263 _____________
155,669
Austria (1.1%)
IMMOFINANZ AG 2,103,919 9,874 CA Immobilien Anlagen AG 143,391 2,493 Atrium European Real Estate Ltd. 358,001 2,010 Conwert Immobilien Invest SE 129,766 1,682 S IMMO AG 108,826 775 _____________
16,834
Belgium (0.6%)
Cofinimmo 31,628 3,679 Befimmo SA 35,326 2,405 Warehouses De Pauw SCA 22,193 1,583 Aedifica SA 18,697 1,289 _____________
8,956
Brazil (1.0%)
BR Malls Participacoes SA 924,600 5,800 BR Properties SA 428,603 3,021 Multiplan Empreendimentos Imobiliarios SA 165,300 2,980

Iguatemi Empresa de Shopping Centers SA 114,586 951 Aliansce Shopping Centers SA 138,329 938 Sao Carlos Empreendimentos e Participacoes SA 55,650 807 Cyrela Commercial Properties SA Empreendimentos e Participacoes 51,600 435 JHSF Participacoes SA 217,127 361 Sonae Sierra Brasil SA 53,883 347 _____________
15,640
Canada (3.9%)
Brookfield Office Properties Inc. 494,165 9,238 ^ RioCan REIT 292,205 6,501 ^ H&R REIT 261,246 4,961 First Capital Realty Inc. 187,171 2,939 ^ Calloway REIT 129,831 2,897 Dundee REIT Class A 104,782 2,757 Boardwalk REIT 50,994 2,678 ^ Canadian REIT 66,617 2,543 Cominar REIT 124,553 2,078 ^ Canadian Apartment Properties REIT 105,586 2,009 ^ Allied Properties REIT 66,284 1,946 ^ Artis REIT 123,495 1,673 Chartwell Retirement Residences 172,956 1,654 Granite REIT 45,545 1,562 * Dream Unlimited Corp. 95,096 1,355 Morguard Corp. 11,586 1,303 ^ Crombie REIT 107,684 1,288 CT REIT 111,065 1,137 Killam Properties Inc. 104,214 990 Morguard REIT 63,317 930 Northern Property REIT 33,605 878 ^ Dundee International REIT 110,017 874 Choice Properties REIT 83,250 780 ^ Brookfield Canada Office Properties 32,302 733 ^ Pure Industrial Real Estate Trust 126,375 515 Melcor Developments Ltd. 24,460 439 Dundee Industrial REIT 53,825 425 InnVest REIT 90,638 415 * Mainstreet Equity Corp. 12,797 411 ^ NorthWest Healthcare Properties REIT 37,537 349 ^ Plaza Retail REIT 72,750 274 ^ Retrocom REIT 65,805 271 Morguard North American Residential REIT 28,800 251 HealthLease Properties REIT 26,700 249 InterRent REIT 50,296 243 Milestone Apartments REIT 27,200 238 _____________
59,784
Chile (0.1%)
Parque Arauco SA 1,041,350 1,779
China (7.1%)
China Overseas Land & Investment Ltd. 7,599,550 20,352 China Resources Land Ltd. 3,701,127 8,726 Country Garden Holdings Co. Ltd. 13,498,908 7,371 Shimao Property Holdings Ltd. 2,492,164 5,441 ^ Evergrande Real Estate Group Ltd. 11,712,921 4,697 China Vanke Co. Ltd. Class B 2,659,954 4,374 Sino-Ocean Land Holdings Ltd. 7,784,891 4,180
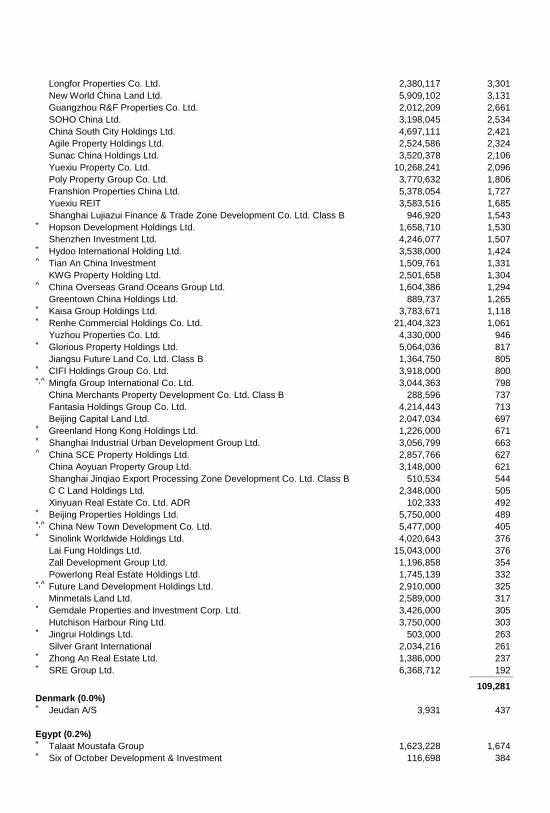
Longfor Properties Co. Ltd. 2,380,117 3,301 New World China Land Ltd. 5,909,102 3,131 Guangzhou R&F Properties Co. Ltd. 2,012,209 2,661 SOHO China Ltd. 3,198,045 2,534 China South City Holdings Ltd. 4,697,111 2,421 Agile Property Holdings Ltd. 2,524,586 2,324 Sunac China Holdings Ltd. 3,520,378 2,106 Yuexiu Property Co. Ltd. 10,268,241 2,096 Poly Property Group Co. Ltd. 3,770,632 1,806 Franshion Properties China Ltd. 5,378,054 1,727 Yuexiu REIT 3,583,516 1,685 Shanghai Lujiazui Finance & Trade Zone Development Co. Ltd. Class B 946,920 1,543 * Hopson Development Holdings Ltd. 1,658,710 1,530 Shenzhen Investment Ltd. 4,246,077 1,507 * Hydoo International Holding Ltd. 3,538,000 1,424 ^ Tian An China Investment 1,509,761 1,331 KWG Property Holding Ltd. 2,501,658 1,304 ^ China Overseas Grand Oceans Group Ltd. 1,604,386 1,294 Greentown China Holdings Ltd. 889,737 1,265 * Kaisa Group Holdings Ltd. 3,783,671 1,118 * Renhe Commercial Holdings Co. Ltd. 21,404,323 1,061 Yuzhou Properties Co. Ltd. 4,330,000 946 * Glorious Property Holdings Ltd. 5,064,036 817 Jiangsu Future Land Co. Ltd. Class B 1,364,750 805 * CIFI Holdings Group Co. Ltd. 3,918,000 800 *,^ Mingfa Group International Co. Ltd. 3,044,363 798 China Merchants Property Development Co. Ltd. Class B 288,596 737 Fantasia Holdings Group Co. Ltd. 4,214,443 713 Beijing Capital Land Ltd. 2,047,034 697 * Greenland Hong Kong Holdings Ltd. 1,226,000 671 * Shanghai Industrial Urban Development Group Ltd. 3,056,799 663 ^ China SCE Property Holdings Ltd. 2,857,766 627 China Aoyuan Property Group Ltd. 3,148,000 621 Shanghai Jinqiao Export Processing Zone Development Co. Ltd. Class B 510,534 544 C C Land Holdings Ltd. 2,348,000 505 Xinyuan Real Estate Co. Ltd. ADR 102,333 492 * Beijing Properties Holdings Ltd. 5,750,000 489 *,^ China New Town Development Co. Ltd. 5,477,000 405 * Sinolink Worldwide Holdings Ltd. 4,020,643 376 Lai Fung Holdings Ltd. 15,043,000 376 Zall Development Group Ltd. 1,196,858 354 Powerlong Real Estate Holdings Ltd. 1,745,139 332 *,^ Future Land Development Holdings Ltd. 2,910,000 325 Minmetals Land Ltd. 2,589,000 317 * Gemdale Properties and Investment Corp. Ltd. 3,426,000 305 Hutchison Harbour Ring Ltd. 3,750,000 303 * Jingrui Holdings Ltd. 503,000 263 Silver Grant International 2,034,216 261 * Zhong An Real Estate Ltd. 1,386,000 237 * SRE Group Ltd. 6,368,712 192 _____________
109,281
Denmark (0.0%)
* Jeudan A/S 3,931 437
Egypt (0.2%)
* Talaat Moustafa Group 1,623,228 1,674 * Six of October Development & Investment 116,698 384
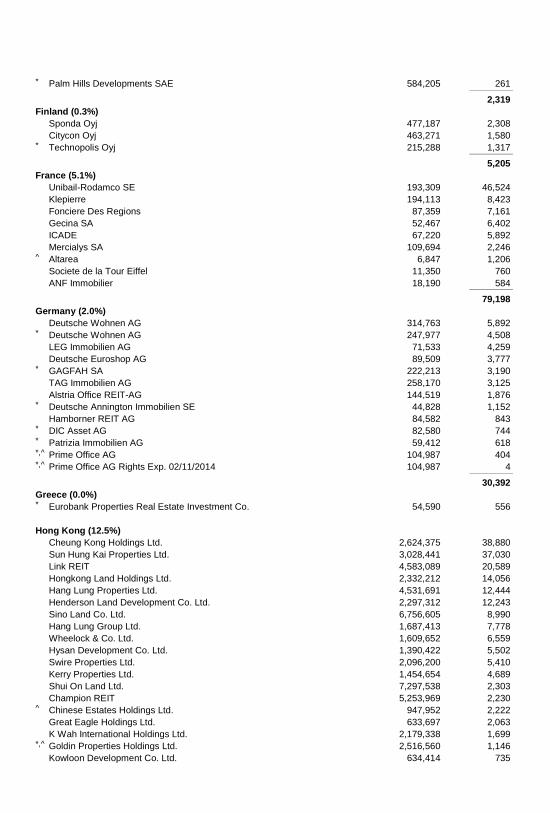
* Palm Hills Developments SAE 584,205 261 _____________
2,319
Finland (0.3%)
Sponda Oyj 477,187 2,308 Citycon Oyj 463,271 1,580 * Technopolis Oyj 215,288 1,317 _____________
5,205
France (5.1%)
Unibail-Rodamco SE 193,309 46,524 Klepierre 194,113 8,423 Fonciere Des Regions 87,359 7,161 Gecina SA 52,467 6,402 ICADE 67,220 5,892 Mercialys SA 109,694 2,246 ^ Altarea 6,847 1,206 Societe de la Tour Eiffel 11,350 760 ANF Immobilier 18,190 584 _____________
79,198
Germany (2.0%)
Deutsche Wohnen AG 314,763 5,892 * Deutsche Wohnen AG 247,977 4,508 LEG Immobilien AG 71,533 4,259 Deutsche Euroshop AG 89,509 3,777 * GAGFAH SA 222,213 3,190 TAG Immobilien AG 258,170 3,125 Alstria Office REIT-AG 144,519 1,876 * Deutsche Annington Immobilien SE 44,828 1,152 Hamborner REIT AG 84,582 843 * DIC Asset AG 82,580 744 * Patrizia Immobilien AG 59,412 618 *,^ Prime Office AG 104,987 404 *,^ Prime Office AG Rights Exp. 02/11/2014 104,987 4 _____________
30,392
Greece (0.0%)
* Eurobank Properties Real Estate Investment Co. 54,590 556
Hong Kong (12.5%)
Cheung Kong Holdings Ltd. 2,624,375 38,880 Sun Hung Kai Properties Ltd. 3,028,441 37,030 Link REIT 4,583,089 20,589 Hongkong Land Holdings Ltd. 2,332,212 14,056 Hang Lung Properties Ltd. 4,531,691 12,444 Henderson Land Development Co. Ltd. 2,297,312 12,243 Sino Land Co. Ltd. 6,756,605 8,990 Hang Lung Group Ltd. 1,687,413 7,778 Wheelock & Co. Ltd. 1,609,652 6,559 Hysan Development Co. Ltd. 1,390,422 5,502 Swire Properties Ltd. 2,096,200 5,410 Kerry Properties Ltd. 1,454,654 4,689 Shui On Land Ltd. 7,297,538 2,303 Champion REIT 5,253,969 2,230 ^ Chinese Estates Holdings Ltd. 947,952 2,222 Great Eagle Holdings Ltd. 633,697 2,063 K Wah International Holdings Ltd. 2,179,338 1,699 *,^ Goldin Properties Holdings Ltd. 2,516,560 1,146 Kowloon Development Co. Ltd. 634,414 735
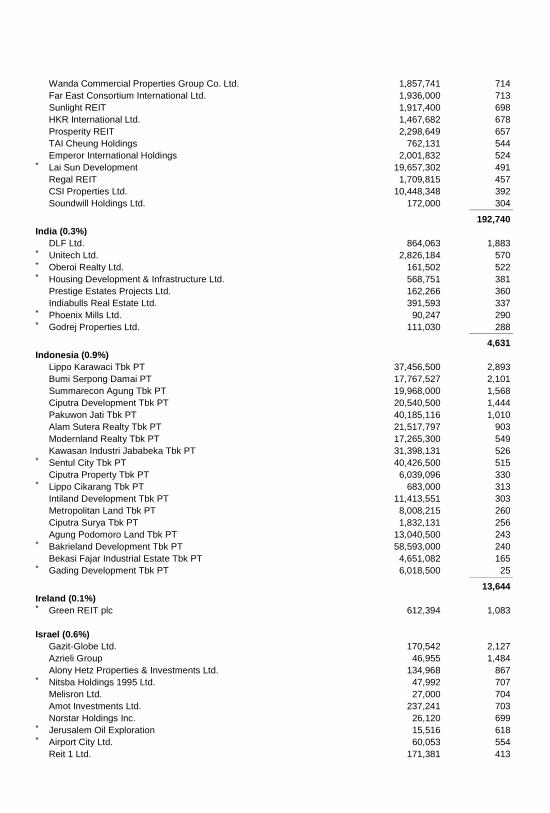
Wanda Commercial Properties Group Co. Ltd. 1,857,741 714 Far East Consortium International Ltd. 1,936,000 713 Sunlight REIT 1,917,400 698 HKR International Ltd. 1,467,682 678 Prosperity REIT 2,298,649 657 TAI Cheung Holdings 762,131 544 Emperor International Holdings 2,001,832 524 * Lai Sun Development 19,657,302 491 Regal REIT 1,709,815 457 CSI Properties Ltd. 10,448,348 392 Soundwill Holdings Ltd. 172,000 304 _____________
192,740
India (0.3%)
DLF Ltd. 864,063 1,883 * Unitech Ltd. 2,826,184 570 * Oberoi Realty Ltd. 161,502 522 * Housing Development & Infrastructure Ltd. 568,751 381 Prestige Estates Projects Ltd. 162,266 360 Indiabulls Real Estate Ltd. 391,593 337 * Phoenix Mills Ltd. 90,247 290 * Godrej Properties Ltd. 111,030 288 _____________
4,631
Indonesia (0.9%)
Lippo Karawaci Tbk PT 37,456,500 2,893 Bumi Serpong Damai PT 17,767,527 2,101 Summarecon Agung Tbk PT 19,968,000 1,568 Ciputra Development Tbk PT 20,540,500 1,444 Pakuwon Jati Tbk PT 40,185,116 1,010 Alam Sutera Realty Tbk PT 21,517,797 903 Modernland Realty Tbk PT 17,265,300 549 Kawasan Industri Jababeka Tbk PT 31,398,131 526 * Sentul City Tbk PT 40,426,500 515 Ciputra Property Tbk PT 6,039,096 330 * Lippo Cikarang Tbk PT 683,000 313 Intiland Development Tbk PT 11,413,551 303 Metropolitan Land Tbk PT 8,008,215 260 Ciputra Surya Tbk PT 1,832,131 256 Agung Podomoro Land Tbk PT 13,040,500 243 * Bakrieland Development Tbk PT 58,593,000 240 Bekasi Fajar Industrial Estate Tbk PT 4,651,082 165 * Gading Development Tbk PT 6,018,500 25 _____________
13,644
Ireland (0.1%)
* Green REIT plc 612,394 1,083
Israel (0.6%)
Gazit-Globe Ltd. 170,542 2,127 Azrieli Group 46,955 1,484 Alony Hetz Properties & Investments Ltd. 134,968 867 * Nitsba Holdings 1995 Ltd. 47,992 707 Melisron Ltd. 27,000 704 Amot Investments Ltd. 237,241 703 Norstar Holdings Inc. 26,120 699 * Jerusalem Oil Exploration 15,516 618 * Airport City Ltd. 60,053 554 Reit 1 Ltd. 171,381 413
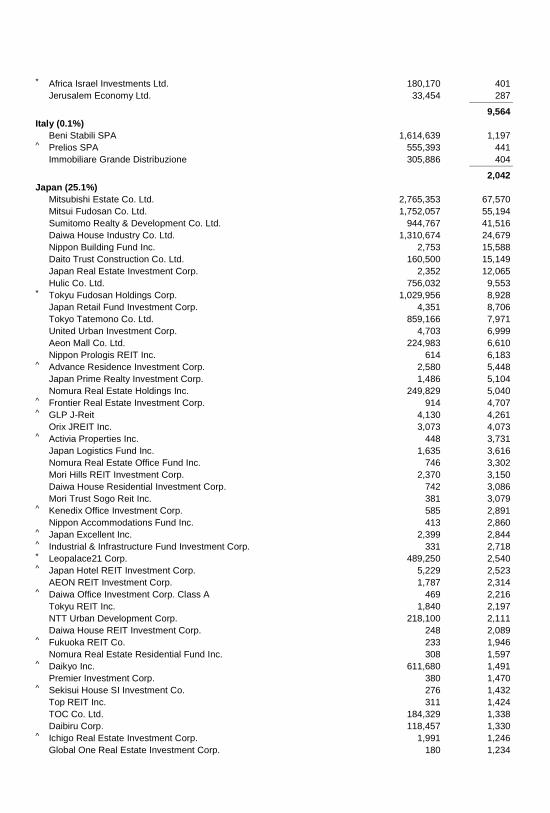
* Africa Israel Investments Ltd. 180,170 401 Jerusalem Economy Ltd. 33,454 287 _____________
9,564
Italy (0.1%)
Beni Stabili SPA 1,614,639 1,197 ^ Prelios SPA 555,393 441 Immobiliare Grande Distribuzione 305,886 404 _____________
2,042
Japan (25.1%)
Mitsubishi Estate Co. Ltd. 2,765,353 67,570 Mitsui Fudosan Co. Ltd. 1,752,057 55,194 Sumitomo Realty & Development Co. Ltd. 944,767 41,516 Daiwa House Industry Co. Ltd. 1,310,674 24,679 Nippon Building Fund Inc. 2,753 15,588 Daito Trust Construction Co. Ltd. 160,500 15,149 Japan Real Estate Investment Corp. 2,352 12,065 Hulic Co. Ltd. 756,032 9,553 * Tokyu Fudosan Holdings Corp. 1,029,956 8,928 Japan Retail Fund Investment Corp. 4,351 8,706 Tokyo Tatemono Co. Ltd. 859,166 7,971 United Urban Investment Corp. 4,703 6,999 Aeon Mall Co. Ltd. 224,983 6,610 Nippon Prologis REIT Inc. 614 6,183 ^ Advance Residence Investment Corp. 2,580 5,448 Japan Prime Realty Investment Corp. 1,486 5,104 Nomura Real Estate Holdings Inc. 249,829 5,040 ^ Frontier Real Estate Investment Corp. 914 4,707 ^ GLP J-Reit 4,130 4,261 Orix JREIT Inc. 3,073 4,073 ^ Activia Properties Inc. 448 3,731 Japan Logistics Fund Inc. 1,635 3,616 Nomura Real Estate Office Fund Inc. 746 3,302 Mori Hills REIT Investment Corp. 2,370 3,150 Daiwa House Residential Investment Corp. 742 3,086 Mori Trust Sogo Reit Inc. 381 3,079 ^ Kenedix Office Investment Corp. 585 2,891 Nippon Accommodations Fund Inc. 413 2,860 ^ Japan Excellent Inc. 2,399 2,844 ^ Industrial & Infrastructure Fund Investment Corp. 331 2,718 * Leopalace21 Corp. 489,250 2,540 ^ Japan Hotel REIT Investment Corp. 5,229 2,523 AEON REIT Investment Corp. 1,787 2,314 ^ Daiwa Office Investment Corp. Class A 469 2,216 Tokyu REIT Inc. 1,840 2,197 NTT Urban Development Corp. 218,100 2,111 Daiwa House REIT Investment Corp. 248 2,089 ^ Fukuoka REIT Co. 233 1,946 Nomura Real Estate Residential Fund Inc. 308 1,597 ^ Daikyo Inc. 611,680 1,491 Premier Investment Corp. 380 1,470 ^ Sekisui House SI Investment Co. 276 1,432 Top REIT Inc. 311 1,424 TOC Co. Ltd. 184,329 1,338 Daibiru Corp. 118,457 1,330 ^ Ichigo Real Estate Investment Corp. 1,991 1,246 Global One Real Estate Investment Corp. 180 1,234
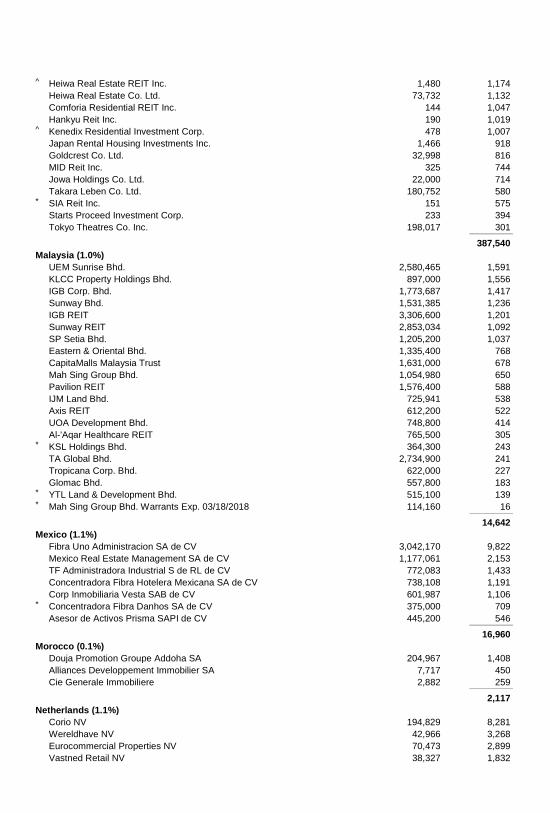
^ Heiwa Real Estate REIT Inc. 1,480 1,174 Heiwa Real Estate Co. Ltd. 73,732 1,132 Comforia Residential REIT Inc. 144 1,047 Hankyu Reit Inc. 190 1,019 ^ Kenedix Residential Investment Corp. 478 1,007 Japan Rental Housing Investments Inc. 1,466 918 Goldcrest Co. Ltd. 32,998 816 MID Reit Inc. 325 744 Jowa Holdings Co. Ltd. 22,000 714 Takara Leben Co. Ltd. 180,752 580 * SIA Reit Inc. 151 575 Starts Proceed Investment Corp. 233 394 Tokyo Theatres Co. Inc. 198,017 301 _____________
387,540
Malaysia (1.0%)
UEM Sunrise Bhd. 2,580,465 1,591 KLCC Property Holdings Bhd. 897,000 1,556 IGB Corp. Bhd. 1,773,687 1,417 Sunway Bhd. 1,531,385 1,236 IGB REIT 3,306,600 1,201 Sunway REIT 2,853,034 1,092 SP Setia Bhd. 1,205,200 1,037 Eastern & Oriental Bhd. 1,335,400 768 CapitaMalls Malaysia Trust 1,631,000 678 Mah Sing Group Bhd. 1,054,980 650 Pavilion REIT 1,576,400 588 IJM Land Bhd. 725,941 538 Axis REIT 612,200 522 UOA Development Bhd. 748,800 414 Al-'Aqar Healthcare REIT 765,500 305 * KSL Holdings Bhd. 364,300 243 TA Global Bhd. 2,734,900 241 Tropicana Corp. Bhd. 622,000 227 Glomac Bhd. 557,800 183 * YTL Land & Development Bhd. 515,100 139 * Mah Sing Group Bhd. Warrants Exp. 03/18/2018 114,160 16 _____________
14,642
Mexico (1.1%)
Fibra Uno Administracion SA de CV 3,042,170 9,822 Mexico Real Estate Management SA de CV 1,177,061 2,153 TF Administradora Industrial S de RL de CV 772,083 1,433 Concentradora Fibra Hotelera Mexicana SA de CV 738,108 1,191 Corp Inmobiliaria Vesta SAB de CV 601,987 1,106 * Concentradora Fibra Danhos SA de CV 375,000 709 Asesor de Activos Prisma SAPI de CV 445,200 546 _____________
16,960
Morocco (0.1%)
Douja Promotion Groupe Addoha SA 204,967 1,408 Alliances Developpement Immobilier SA 7,717 450 Cie Generale Immobiliere 2,882 259 _____________
2,117
Netherlands (1.1%)
Corio NV 194,829 8,281 Wereldhave NV 42,966 3,268 Eurocommercial Properties NV 70,473 2,899 Vastned Retail NV 38,327 1,832
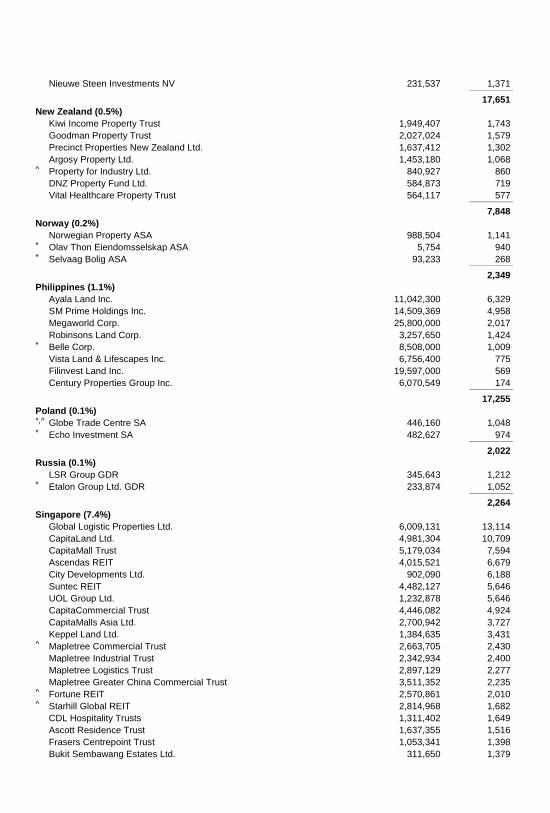
Nieuwe Steen Investments NV 231,537 1,371 _____________
17,651
New Zealand (0.5%)
Kiwi Income Property Trust 1,949,407 1,743 Goodman Property Trust 2,027,024 1,579 Precinct Properties New Zealand Ltd. 1,637,412 1,302 Argosy Property Ltd. 1,453,180 1,068 ^ Property for Industry Ltd. 840,927 860 DNZ Property Fund Ltd. 584,873 719 Vital Healthcare Property Trust 564,117 577 _____________
7,848
Norway (0.2%)
Norwegian Property ASA 988,504 1,141 * Olav Thon Eiendomsselskap ASA 5,754 940 * Selvaag Bolig ASA 93,233 268 _____________
2,349
Philippines (1.1%)
Ayala Land Inc. 11,042,300 6,329 SM Prime Holdings Inc. 14,509,369 4,958 Megaworld Corp. 25,800,000 2,017 Robinsons Land Corp. 3,257,650 1,424 * Belle Corp. 8,508,000 1,009 Vista Land & Lifescapes Inc. 6,756,400 775 Filinvest Land Inc. 19,597,000 569 Century Properties Group Inc. 6,070,549 174 _____________
17,255
Poland (0.1%)
*,^ Globe Trade Centre SA 446,160 1,048 * Echo Investment SA 482,627 974 _____________
2,022
Russia (0.1%)
LSR Group GDR 345,643 1,212 * Etalon Group Ltd. GDR 233,874 1,052 _____________
2,264
Singapore (7.4%)
Global Logistic Properties Ltd. 6,009,131 13,114 CapitaLand Ltd. 4,981,304 10,709 CapitaMall Trust 5,179,034 7,594 Ascendas REIT 4,015,521 6,679 City Developments Ltd. 902,090 6,188 Suntec REIT 4,482,127 5,646 UOL Group Ltd. 1,232,878 5,646 CapitaCommercial Trust 4,446,082 4,924 CapitaMalls Asia Ltd. 2,700,942 3,727 Keppel Land Ltd. 1,384,635 3,431 ^ Mapletree Commercial Trust 2,663,705 2,430 Mapletree Industrial Trust 2,342,934 2,400 Mapletree Logistics Trust 2,897,129 2,277 Mapletree Greater China Commercial Trust 3,511,352 2,235 ^ Fortune REIT 2,570,861 2,010 ^ Starhill Global REIT 2,814,968 1,682 CDL Hospitality Trusts 1,311,402 1,649 Ascott Residence Trust 1,637,355 1,516 Frasers Centrepoint Trust 1,053,341 1,398 Bukit Sembawang Estates Ltd. 311,650 1,379
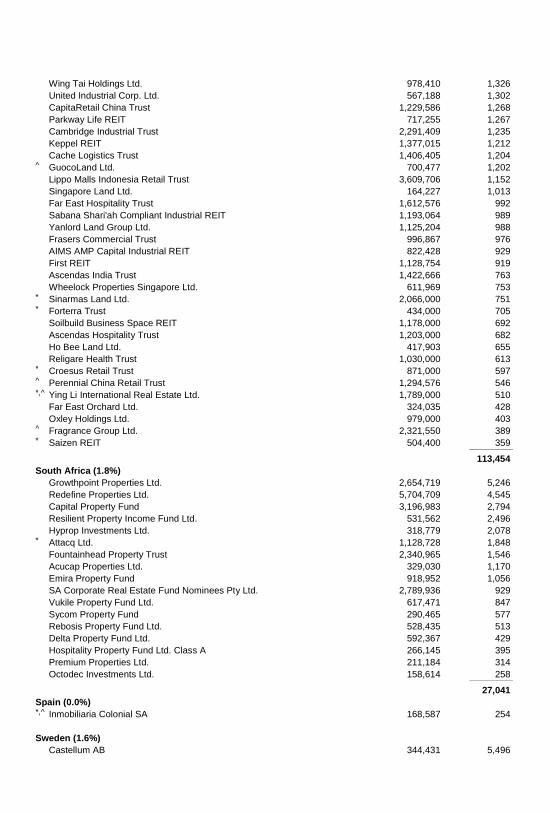
Wing Tai Holdings Ltd. 978,410 1,326 United Industrial Corp. Ltd. 567,188 1,302 CapitaRetail China Trust 1,229,586 1,268 Parkway Life REIT 717,255 1,267 Cambridge Industrial Trust 2,291,409 1,235 Keppel REIT 1,377,015 1,212 Cache Logistics Trust 1,406,405 1,204 ^ GuocoLand Ltd. 700,477 1,202 Lippo Malls Indonesia Retail Trust 3,609,706 1,152 Singapore Land Ltd. 164,227 1,013 Far East Hospitality Trust 1,612,576 992 Sabana Shari'ah Compliant Industrial REIT 1,193,064 989 Yanlord Land Group Ltd. 1,125,204 988 Frasers Commercial Trust 996,867 976 AIMS AMP Capital Industrial REIT 822,428 929 First REIT 1,128,754 919 Ascendas India Trust 1,422,666 763 Wheelock Properties Singapore Ltd. 611,969 753 * Sinarmas Land Ltd. 2,066,000 751 * Forterra Trust 434,000 705 Soilbuild Business Space REIT 1,178,000 692 Ascendas Hospitality Trust 1,203,000 682 Ho Bee Land Ltd. 417,903 655 Religare Health Trust 1,030,000 613 * Croesus Retail Trust 871,000 597 ^ Perennial China Retail Trust 1,294,576 546 *,^ Ying Li International Real Estate Ltd. 1,789,000 510 Far East Orchard Ltd. 324,035 428 Oxley Holdings Ltd. 979,000 403 ^ Fragrance Group Ltd. 2,321,550 389 * Saizen REIT 504,400 359 _____________
113,454
South Africa (1.8%)
Growthpoint Properties Ltd. 2,654,719 5,246 Redefine Properties Ltd. 5,704,709 4,545 Capital Property Fund 3,196,983 2,794 Resilient Property Income Fund Ltd. 531,562 2,496 Hyprop Investments Ltd. 318,779 2,078 * Attacq Ltd. 1,128,728 1,848 Fountainhead Property Trust 2,340,965 1,546 Acucap Properties Ltd. 329,030 1,170 Emira Property Fund 918,952 1,056 SA Corporate Real Estate Fund Nominees Pty Ltd. 2,789,936 929 Vukile Property Fund Ltd. 617,471 847 Sycom Property Fund 290,465 577 Rebosis Property Fund Ltd. 528,435 513 Delta Property Fund Ltd. 592,367 429 Hospitality Property Fund Ltd. Class A 266,145 395 Premium Properties Ltd. 211,184 314 Octodec Investments Ltd. 158,614 258 _____________
27,041
Spain (0.0%)
*,^ Inmobiliaria Colonial SA 168,587 254
Sweden (1.6%)
Castellum AB 344,431 5,496
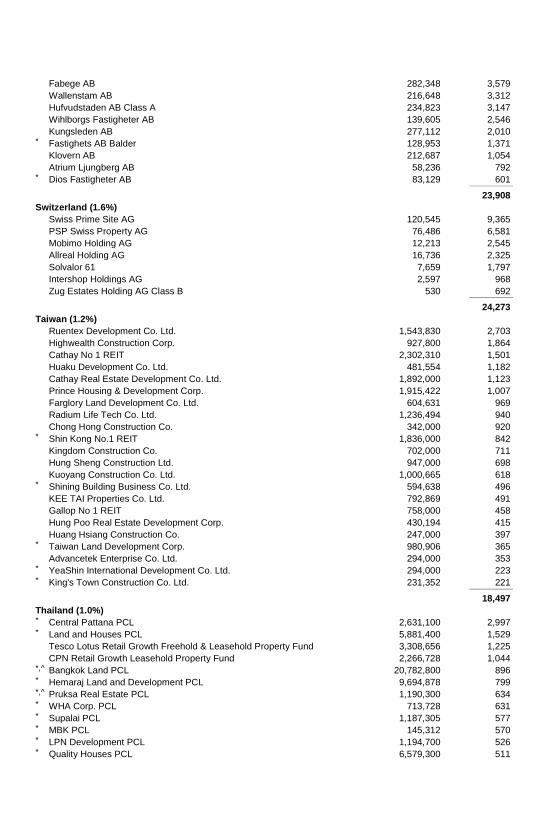
Fabege AB 282,348 3,579 Wallenstam AB 216,648 3,312 Hufvudstaden AB Class A 234,823 3,147 Wihlborgs Fastigheter AB 139,605 2,546 Kungsleden AB 277,112 2,010 * Fastighets AB Balder 128,953 1,371 Klovern AB 212,687 1,054 Atrium Ljungberg AB 58,236 792 * Dios Fastigheter AB 83,129 601 _____________
23,908
Switzerland (1.6%)
Swiss Prime Site AG 120,545 9,365 PSP Swiss Property AG 76,486 6,581 Mobimo Holding AG 12,213 2,545 Allreal Holding AG 16,736 2,325 Solvalor 61 7,659 1,797 Intershop Holdings AG 2,597 968 Zug Estates Holding AG Class B 530 692 _____________
24,273
Taiwan (1.2%)
Ruentex Development Co. Ltd. 1,543,830 2,703 Highwealth Construction Corp. 927,800 1,864 Cathay No 1 REIT 2,302,310 1,501 Huaku Development Co. Ltd. 481,554 1,182 Cathay Real Estate Development Co. Ltd. 1,892,000 1,123 Prince Housing & Development Corp. 1,915,422 1,007 Farglory Land Development Co. Ltd. 604,631 969 Radium Life Tech Co. Ltd. 1,236,494 940 Chong Hong Construction Co. 342,000 920 * Shin Kong No.1 REIT 1,836,000 842 Kingdom Construction Co. 702,000 711 Hung Sheng Construction Ltd. 947,000 698 Kuoyang Construction Co. Ltd. 1,000,665 618 * Shining Building Business Co. Ltd. 594,638 496 KEE TAI Properties Co. Ltd. 792,869 491 Gallop No 1 REIT 758,000 458 Hung Poo Real Estate Development Corp. 430,194 415 Huang Hsiang Construction Co. 247,000 397 * Taiwan Land Development Corp. 980,906 365 Advancetek Enterprise Co. Ltd. 294,000 353 * YeaShin International Development Co. Ltd. 294,000 223 * King's Town Construction Co. Ltd. 231,352 221 _____________
18,497
Thailand (1.0%)
* Central Pattana PCL 2,631,100 2,997 * Land and Houses PCL 5,881,400 1,529 Tesco Lotus Retail Growth Freehold & Leasehold Property Fund 3,308,656 1,225 CPN Retail Growth Leasehold Property Fund 2,266,728 1,044 *,^ Bangkok Land PCL 20,782,800 896 * Hemaraj Land and Development PCL 9,694,878 799 *,^ Pruksa Real Estate PCL 1,190,300 634 * WHA Corp. PCL 713,728 631 * Supalai PCL 1,187,305 577 * MBK PCL 145,312 570 * LPN Development PCL 1,194,700 526 * Quality Houses PCL 6,579,300 511
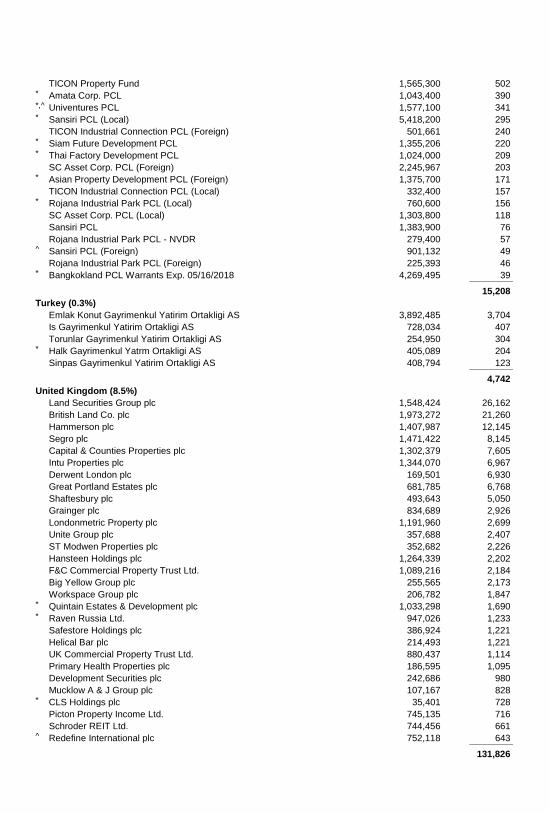
TICON Property Fund 1,565,300 502 * Amata Corp. PCL 1,043,400 390 *,^ Univentures PCL 1,577,100 341 * Sansiri PCL (Local) 5,418,200 295 TICON Industrial Connection PCL (Foreign) 501,661 240 * Siam Future Development PCL 1,355,206 220 * Thai Factory Development PCL 1,024,000 209 SC Asset Corp. PCL (Foreign) 2,245,967 203 * Asian Property Development PCL (Foreign) 1,375,700 171 TICON Industrial Connection PCL (Local) 332,400 157 * Rojana Industrial Park PCL (Local) 760,600 156 SC Asset Corp. PCL (Local) 1,303,800 118 Sansiri PCL 1,383,900 76 Rojana Industrial Park PCL - NVDR 279,400 57 ^ Sansiri PCL (Foreign) 901,132 49 Rojana Industrial Park PCL (Foreign) 225,393 46 * Bangkokland PCL Warrants Exp. 05/16/2018 4,269,495 39 _____________
15,208
Turkey (0.3%)
Emlak Konut Gayrimenkul Yatirim Ortakligi AS 3,892,485 3,704 Is Gayrimenkul Yatirim Ortakligi AS 728,034 407 Torunlar Gayrimenkul Yatirim Ortakligi AS 254,950 304 * Halk Gayrimenkul Yatrm Ortakligi AS 405,089 204 Sinpas Gayrimenkul Yatirim Ortakligi AS 408,794 123 _____________
4,742
United Kingdom (8.5%)
Land Securities Group plc 1,548,424 26,162 British Land Co. plc 1,973,272 21,260 Hammerson plc 1,407,987 12,145 Segro plc 1,471,422 8,145 Capital & Counties Properties plc 1,302,379 7,605 Intu Properties plc 1,344,070 6,967 Derwent London plc 169,501 6,930 Great Portland Estates plc 681,785 6,768 Shaftesbury plc 493,643 5,050 Grainger plc 834,689 2,926 Londonmetric Property plc 1,191,960 2,699 Unite Group plc 357,688 2,407 ST Modwen Properties plc 352,682 2,226 Hansteen Holdings plc 1,264,339 2,202 F&C Commercial Property Trust Ltd. 1,089,216 2,184 Big Yellow Group plc 255,565 2,173 Workspace Group plc 206,782 1,847 * Quintain Estates & Development plc 1,033,298 1,690 * Raven Russia Ltd. 947,026 1,233 Safestore Holdings plc 386,924 1,221 Helical Bar plc 214,493 1,221 UK Commercial Property Trust Ltd. 880,437 1,114 Primary Health Properties plc 186,595 1,095 Development Securities plc 242,686 980 Mucklow A & J Group plc 107,167 828 * CLS Holdings plc 35,401 728 Picton Property Income Ltd. 745,135 716 Schroder REIT Ltd. 744,456 661 ^ Redefine International plc 752,118 643 _____________
131,826
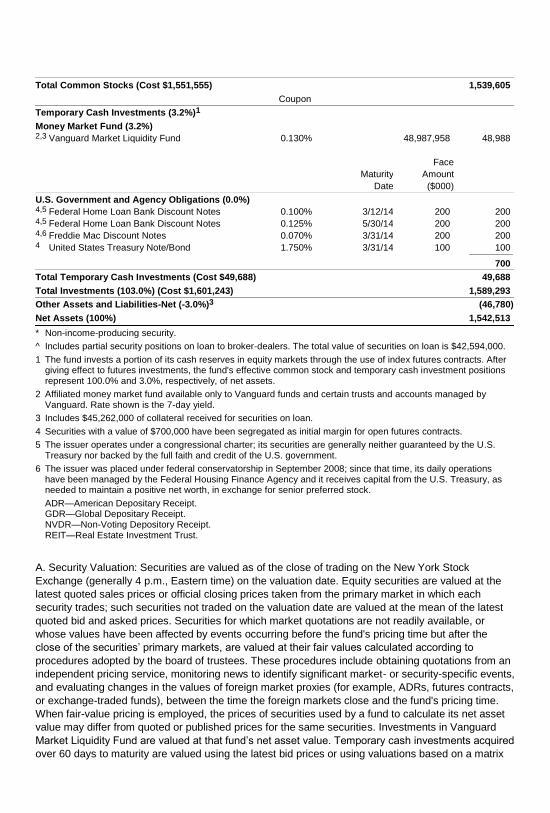
Total Common Stocks (Cost $1,551,555) 1,539,605
Coupon
Temporary Cash Investments (3.2%)1
Money Market Fund (3.2%) 2,3 Vanguard Market Liquidity Fund 0.130% 48,987,958 48,988
Maturity
Date
Face
Amount
($000)
U.S. Government and Agency Obligations (0.0%)
4,5 Federal Home Loan Bank Discount Notes 0.100% 3/12/14 200 200 4,5 Federal Home Loan Bank Discount Notes 0.125% 5/30/14 200 200 4,6 Freddie Mac Discount Notes 0.070% 3/31/14 200 200 4 United States Treasury Note/Bond 1.750% 3/31/14 100 100 _____________
700
Total Temporary Cash Investments (Cost $49,688) 49,688
Total Investments (103.0%) (Cost $1,601,243) 1,589,293
Other Assets and Liabilities-Net (-3.0%)3 (46,780)
Net Assets (100%) 1,542,513
* Non-income-producing security.
^ Includes partial security positions on loan to broker-dealers. The total value of securities on loan is $42,594,000.
1 The fund invests a portion of its cash reserves in equity markets through the use of index futures contracts. After giving effect to futures investments, the fund's effective common stock and temporary cash investment positions represent 100.0% and 3.0%, respectively, of net assets.
2 Affiliated money market fund available only to Vanguard funds and certain trusts and accounts managed by Vanguard. Rate shown is the 7-day yield.
3 Includes $45,262,000 of collateral received for securities on loan.
4 Securities with a value of $700,000 have been segregated as initial margin for open futures contracts.
5 The issuer operates under a congressional charter; its securities are generally neither guaranteed by the U.S. Treasury nor backed by the full faith and credit of the U.S. government.
6 The issuer was placed under federal conservatorship in September 2008; since that time, its daily operations have been managed by the Federal Housing Finance Agency and it receives capital from the U.S. Treasury, as needed to maintain a positive net worth, in exchange for senior preferred stock.
ADR—American Depositary Receipt. GDR—Global Depositary Receipt. NVDR—Non-Voting Depository Receipt. REIT—Real Estate Investment Trust.
A. Security Valuation: Securities are valued as of the close of trading on the New York Stock
Exchange (generally 4 p.m., Eastern time) on the valuation date. Equity securities are valued at the
latest quoted sales prices or official closing prices taken from the primary market in which each
security trades; such securities not traded on the valuation date are valued at the mean of the latest
quoted bid and asked prices. Securities for which market quotations are not readily available, or
whose values have been affected by events occurring before the fund's pricing time but after the
close of the securities’ primary markets, are valued at their fair values calculated according to
procedures adopted by the board of trustees. These procedures include obtaining quotations from an
independent pricing service, monitoring news to identify significant market- or security-specific events,
and evaluating changes in the values of foreign market proxies (for example, ADRs, futures contracts,
or exchange-traded funds), between the time the foreign markets close and the fund's pricing time.
When fair-value pricing is employed, the prices of securities used by a fund to calculate its net asset
value may differ from quoted or published prices for the same securities. Investments in Vanguard
Market Liquidity Fund are valued at that fund’s net asset value. Temporary cash investments acquired
over 60 days to maturity are valued using the latest bid prices or using valuations based on a matrix
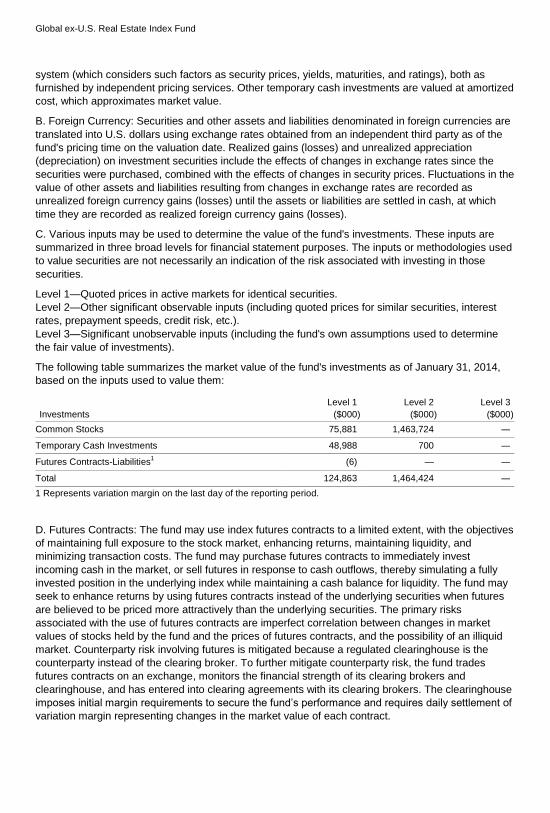
Global ex-U.S. Real Estate Index Fund
system (which considers such factors as security prices, yields, maturities, and ratings), both as
furnished by independent pricing services. Other temporary cash investments are valued at amortized
cost, which approximates market value.
B. Foreign Currency: Securities and other assets and liabilities denominated in foreign currencies are
translated into U.S. dollars using exchange rates obtained from an independent third party as of the
fund's pricing time on the valuation date. Realized gains (losses) and unrealized appreciation
(depreciation) on investment securities include the effects of changes in exchange rates since the
securities were purchased, combined with the effects of changes in security prices. Fluctuations in the
value of other assets and liabilities resulting from changes in exchange rates are recorded as
unrealized foreign currency gains (losses) until the assets or liabilities are settled in cash, at which
time they are recorded as realized foreign currency gains (losses).
C. Various inputs may be used to determine the value of the fund's investments. These inputs are
summarized in three broad levels for financial statement purposes. The inputs or methodologies used
to value securities are not necessarily an indication of the risk associated with investing in those
securities.
Level 1—Quoted prices in active markets for identical securities.
Level 2—Other significant observable inputs (including quoted prices for similar securities, interest
rates, prepayment speeds, credit risk, etc.).
Level 3—Significant unobservable inputs (including the fund's own assumptions used to determine
the fair value of investments).
The following table summarizes the market value of the fund's investments as of January 31, 2014,
based on the inputs used to value them:
Investments
Level 1
($000 )
Level 2
($000 )
Level 3
($000 )
Common Stocks 75,881 1,463,724 —
Temporary Cash Investments 48,988 700 —
Futures Contracts-Liabilities1 (6) — —
Total 124,863 1,464,424 —
1 Represents variation margin on the last day of the reporting period.
D. Futures Contracts: The fund may use index futures contracts to a limited extent, with the objectives
of maintaining full exposure to the stock market, enhancing returns, maintaining liquidity, and
minimizing transaction costs. The fund may purchase futures contracts to immediately invest
incoming cash in the market, or sell futures in response to cash outflows, thereby simulating a fully
invested position in the underlying index while maintaining a cash balance for liquidity. The fund may
seek to enhance returns by using futures contracts instead of the underlying securities when futures
are believed to be priced more attractively than the underlying securities. The primary risks
associated with the use of futures contracts are imperfect correlation between changes in market
values of stocks held by the fund and the prices of futures contracts, and the possibility of an illiquid
market. Counterparty risk involving futures is mitigated because a regulated clearinghouse is the
counterparty instead of the clearing broker. To further mitigate counterparty risk, the fund trades
futures contracts on an exchange, monitors the financial strength of its clearing brokers and
clearinghouse, and has entered into clearing agreements with its clearing brokers. The clearinghouse
imposes initial margin requirements to secure the fund’s performance and requires daily settlement of
variation margin representing changes in the market value of each contract.
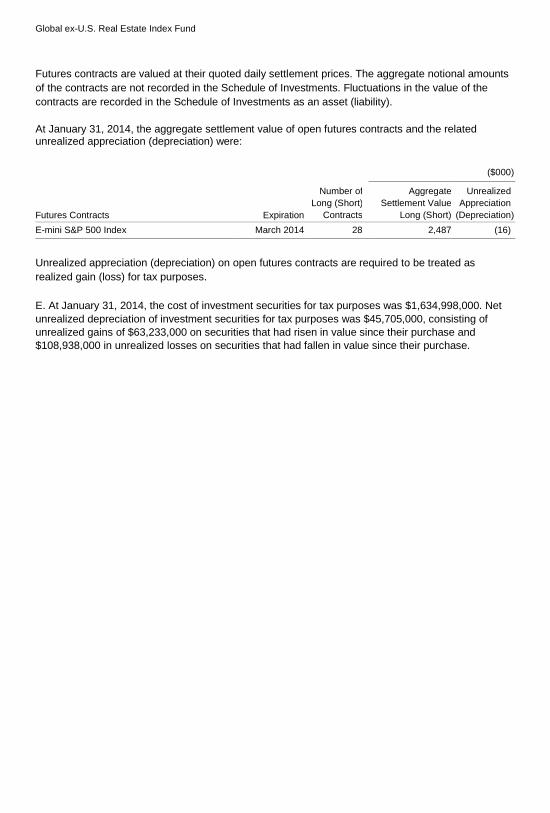
Global ex-U.S. Real Estate Index Fund
Futures contracts are valued at their quoted daily settlement prices. The aggregate notional amounts
of the contracts are not recorded in the Schedule of Investments. Fluctuations in the value of the
contracts are recorded in the Schedule of Investments as an asset (liability).
At January 31, 2014, the aggregate settlement value of open futures contracts and the related unrealized appreciation (depreciation) were:
($000 )
Futures Contracts Expiration
Number of
Long (Short)
Contracts
Aggregate
Settlement Value
Long (Short)
Unrealized
Appreciation
(Depreciation )
E-mini S&P 500 Index March 2014 28 2,487 (16)
Unrealized appreciation (depreciation) on open futures contracts are required to be treated as
realized gain (loss) for tax purposes.
E. At January 31, 2014, the cost of investment securities for tax purposes was $1,634,998,000. Net
unrealized depreciation of investment securities for tax purposes was $45,705,000, consisting of
unrealized gains of $63,233,000 on securities that had risen in value since their purchase and
$108,938,000 in unrealized losses on securities that had fallen in value since their purchase.
Item 2: Controls and Procedures
(a) Disclosure Controls and Procedures. The Principal Executive and Financial Officers concluded that the Registrant’s Disclosure Controls and Procedures are effective based on their evaluation of the Disclosure Controls and Procedures as of a date within 90 days of the filing date of this report.
(b) Internal Control Over Financial Reporting. During the last fiscal quarter, there was no significant change in the Registrant’s internal control over financial reporting that has materially affected, or is reasonably likely to materially affect, the registrant’s internal control over financial reporting.
Item 3: Exhibits
(a) Certifications VANGUARD INTERNATIONAL EQUITY INDEX FUNDS By: /s/ F. WILLIAM MCNABB III* F. WILLIAM MCNABB III CHIEF EXECUTIVE OFFICER Date: March 19, 2014 Pursuant to the requirements of the Securities Exchange Act of 1934 and the Investment Company Act of 1940, this report has been signed below by the following persons on behalf of the registrant and in the capacities and on the dates indicated. VANGUARD INTERNATIONAL EQUITY INDEX FUNDS By: /s/ F. WILLIAM MCNABB III* F. WILLIAM MCNABB III CHIEF EXECUTIVE OFFICER Date: March 19, 2014 VANGUARD INTERNATIONAL EQUITY INDEX FUNDS By: /s/ THOMAS J. HIGGINS* THOMAS J. HIGGINS CHIEF FINANCIAL OFFICER Date: March 19, 2014 * By:/s/ Heidi Stam Heidi Stam, pursuant to a Power of Attorney filed on March 27, 2012, see file Number 2-11444, Incorporated by Reference.

CERTIFICATIONS
I, F. William McNabb III, certify that: 1. I have reviewed this report on Form N-Q of Vanguard International Equity Index Funds; 2. Based on my knowledge, this report does not contain any untrue statement of a material fact or omit to state a material fact necessary to make the statements made, in light of the circumstances under which such statements were made, not misleading with respect to the period covered by this report; 3. Based on my knowledge, the schedules of investments included in this report fairly present in all material respects the investments of the registrant as of the end of the fiscal quarter for which the report is filed; 4. The registrant’s other certifying officer(s) and I are responsible for establishing and maintaining disclosure controls and procedures (as defined in Rule 30a-3(c) under the Investment Company Act of 1940) and internal control over financial reporting (as defined in Rule 30a-3(d) under the Investment Company Act of 1940) for the registrant and have: (a) Designed such disclosure controls and procedures, or caused such disclosure controls and procedures to be designed under our supervision, to ensure that material information relating to the registrant, including its consolidated subsidiaries, is made known to us by others within those entities, particularly during the period in which this report is being prepared; (b) Designed such internal control over financial reporting, or caused such internal control over financial reporting to be designed under our supervision, to provide reasonable assurance regarding the reliability of financial reporting and the preparation of financial statements for external purposes in accordance with generally accepted accounting principles; (c) Evaluated the effectiveness of the registrant’s disclosure controls and procedures and presented in this report our conclusions about the effectiveness of the disclosure controls and procedures, as of a date within 90 days prior to the filing date of this report, based on such evaluation; and (d) Disclosed in this report any change in the registrant’s internal control over financial reporting that occurred during the registrant’s most recent fiscal quarter that has materially affected, or is reasonably likely to materially affect, the registrant’s internal control over financial reporting; and 5. The registrant’s other certifying officer(s) and I have disclosed to the registrant’s auditors and the audit committee of the registrant’s board of directors (or persons performing the equivalent functions): (a) All significant deficiencies and material weaknesses in the design or operation of internal control over financial reporting which are reasonably likely to adversely affect the registrant’s ability to record, process, summarize, and report financial information; and (b) Any fraud, whether or not material, that involves management or other employees who have a significant role in the registrant’s internal control over financial reporting. Date: March 19, 2014 /s/ F. William McNabb III F. William McNabb III Chief Executive Officer
CERTIFICATIONS
I, Thomas J. Higgins, certify that: 1. I have reviewed this report on Form N-Q of Vanguard International Equity Index Funds; 2. Based on my knowledge, this report does not contain any untrue statement of a material fact or omit to state a material fact necessary to make the statements made, in light of the circumstances under which such statements were made, not misleading with respect to the period covered by this report; 3. Based on my knowledge, the schedules of investments included in this report fairly present in all material respects the investments of the registrant as of the end of the fiscal quarter for which the report is filed; 4. The registrant’s other certifying officer(s) and I are responsible for establishing and maintaining disclosure controls and procedures (as defined in Rule 30a-3(c) under the Investment Company Act of 1940) and internal control over financial reporting (as defined in Rule 30a-3(d) under the Investment Company Act of 1940) for the registrant and have: (a) Designed such disclosure controls and procedures, or caused such disclosure controls and procedures to be designed under our supervision, to ensure that material information relating to the registrant, including its consolidated subsidiaries, is made known to us by others within those entities, particularly during the period in which this report is being prepared; (b) Designed such internal control over financial reporting, or caused such internal control over financial reporting to be designed under our supervision, to provide reasonable assurance regarding the reliability of financial reporting and the preparation of financial statements for external purposes in accordance with generally accepted accounting principles; (c) Evaluated the effectiveness of the registrant’s disclosure controls and procedures and presented in this report our conclusions about the effectiveness of the disclosure controls and procedures, as of a date within 90 days prior to the filing date of this report, based on such evaluation; and (d) Disclosed in this report any change in the registrant’s internal control over financial reporting that occurred during the registrant’s most recent fiscal quarter that has materially affected, or is reasonably likely to materially affect, the registrant’s internal control over financial reporting; and 5. The registrant’s other certifying officer(s) and I have disclosed to the registrant’s auditors and the audit committee of the registrant’s board of directors (or persons performing the equivalent functions): (a) All significant deficiencies and material weaknesses in the design or operation of internal control over financial reporting which are reasonably likely to adversely affect the registrant’s ability to record, process, summarize, and report financial information; and (b) Any fraud, whether or not material, that involves management or other employees who have a significant role in the registrant’s internal control over financial reporting. Date: March 19, 2014 /s/ Thomas J Higgins Thomas J. Higgins Chief Financial Officer