Embed Size (px)
Citation preview

1
Testimony of Patricia Neuman, Sc.D. Director, Program on Medicare Policy and
Senior Vice President, The Henry J. Kaiser Family Foundation
U.S. Senate Special Committee on Aging Income Security and the Elderly: Securing Gains Made in the War on Poverty
March 5, 2014
Chairman Nelson, Ranking Member Collins and distinguished Senators, I am honored to be here
to testify on the topic of economic security among older Americans, and issues associated with
securing the gains made in the War on Poverty. I am also pleased to share with you highlights
from a video that the Kaiser Family Foundation is releasing today, entitled, Old and Poor:
America’s Forgotten. The video illuminates the daily challenges facing seniors who live in
poverty and the tradeoffs they face to make ends meet.
I am Dr. Tricia Neuman, a Senior Vice President at the Kaiser Family Foundation, and Director of
the Foundation’s Program on Medicare Policy. I am proud to say that I once worked on the
staff of this Committee when Senator John Heinz was chair, and appreciate the important role
that the Senate Special Committee on Aging has always played in addressing the important
issues facing older Americans.
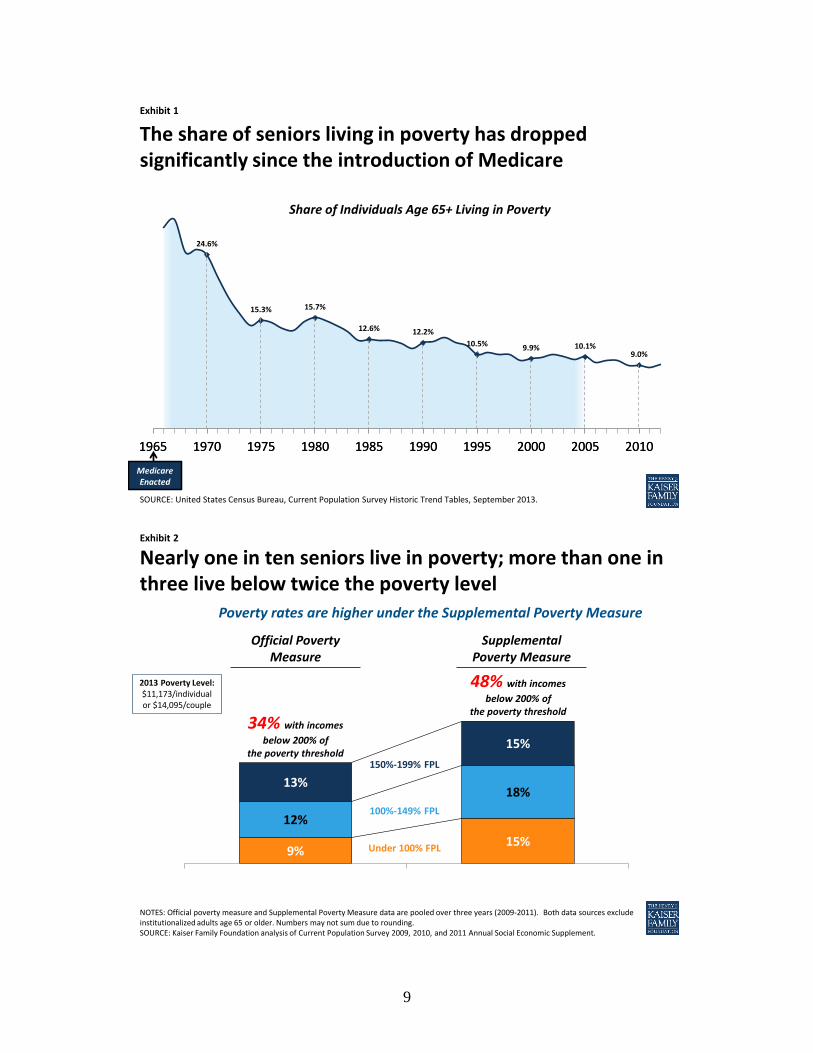
Since the War on Poverty was launched 50 years ago, the poverty rate for seniors has declined,
which is an enormous achievement. Between 1966 and 2011, the share of seniors living in
poverty fell from more than 28 percent to about 9 percent, with the steepest drop occurring in
the decade immediately following the start of the Medicare program (Exhibit 1). The
introduction of Medicare, coupled with Social Security, played a key role in lifting seniors out of
poverty. As President Johnson said, as he signed the historic Medicare bill on July 30, 1965:
No longer will older Americans be denied the healing miracle of modern medicine. No
longer will illness crush and destroy the savings that they have so carefully put away over a
2
lifetime so that they might enjoy dignity in their later years. No longer will young families
see their own incomes, and their own hopes, eaten away simply because they are carrying
out their deep moral obligations to their parents, and to their uncles, and their aunts.1
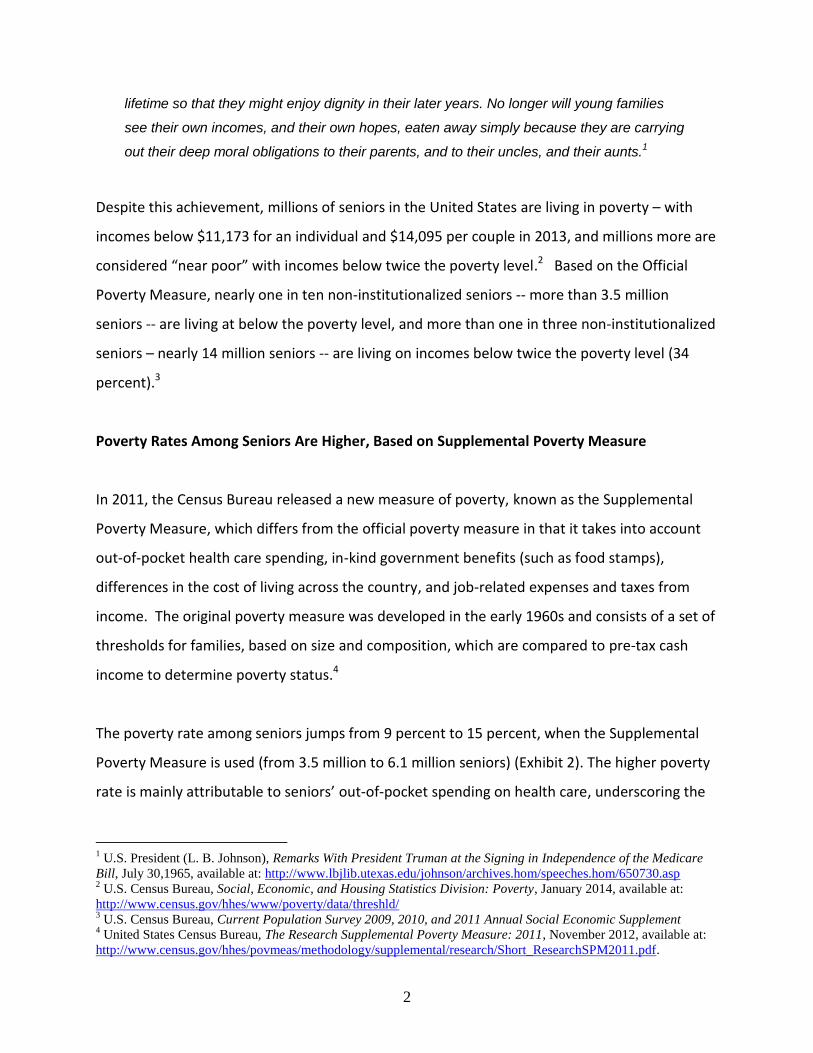
Despite this achievement, millions of seniors in the United States are living in poverty – with
incomes below $11,173 for an individual and $14,095 per couple in 2013, and millions more are
considered “near poor” with incomes below twice the poverty level.2 Based on the Official
Poverty Measure, nearly one in ten non-institutionalized seniors -- more than 3.5 million
seniors -- are living at below the poverty level, and more than one in three non-institutionalized
seniors – nearly 14 million seniors -- are living on incomes below twice the poverty level (34
percent).3
Poverty Rates Among Seniors Are Higher, Based on Supplemental Poverty Measure
In 2011, the Census Bureau released a new measure of poverty, known as the Supplemental
Poverty Measure, which differs from the official poverty measure in that it takes into account
out-of-pocket health care spending, in-kind government benefits (such as food stamps),
differences in the cost of living across the country, and job-related expenses and taxes from
income. The original poverty measure was developed in the early 1960s and consists of a set of
thresholds for families, based on size and composition, which are compared to pre-tax cash
income to determine poverty status.4
The poverty rate among seniors jumps from 9 percent to 15 percent, when the Supplemental
Poverty Measure is used (from 3.5 million to 6.1 million seniors) (Exhibit 2). The higher poverty
rate is mainly attributable to seniors’ out-of-pocket spending on health care, underscoring the
1 U.S. President (L. B. Johnson), Remarks With President Truman at the Signing in Independence of the Medicare
Bill, July 30,1965, available at: http://www.lbjlib.utexas.edu/johnson/archives.hom/speeches.hom/650730.asp 2 U.S. Census Bureau, Social, Economic, and Housing Statistics Division: Poverty, January 2014, available at:
http://www.census.gov/hhes/www/poverty/data/threshld/ 3 U.S. Census Bureau, Current Population Survey 2009, 2010, and 2011 Annual Social Economic Supplement
4 United States Census Bureau, The Research Supplemental Poverty Measure: 2011, November 2012, available at:
http://www.census.gov/hhes/povmeas/methodology/supplemental/research/Short_ResearchSPM2011.pdf.
3
link between health and financial security for seniors.5 Because health problems tend to rise
with age, seniors tend to have higher out-of-pocket health costs than younger adults. In fact,
older households spend 3-times more than younger households on health expenses, as a share
of their household budgets (Exhibit 3).6
Poverty Rates Among Seniors Vary Across States
Poverty rates among seniors vary across states, and are higher in all states when the
supplemental measure is used. According to an analysis by the Kaiser Family Foundation, the
poverty rate doubles in 12 states when using the Supplemental Poverty Measure rather than
the official measure (Table 1). Under the supplemental measure, roughly one in five seniors
lives in poverty in California (20%), Hawaii (19%), Nevada (19%), Louisiana (19%), New York
(18%), and Georgia (18%).7 Here in the District of Columbia, the rate is even higher with more
than one in four seniors (26 percent) living in poverty (16% under the official poverty measure).
Higher Poverty Rates for Older Women than Older Men
Under both measures of poverty, poverty rates are higher for older women than older men
(11% vs. 6% respectively under the official poverty measure, and 17% vs. 13% respectively
under the Supplemental Poverty Measure) (Exhibit 4 and Table 2). The income gap between
older women and older men widens when the poor and near poor are examined together: 39
percent of women ages 65 and older live on incomes below twice the poverty level, compared
to 27 percent of older men (under the official poverty measure), rising to 53 percent of older
women and 42 percent of older men (under the Supplemental Poverty Measure).
5 United States Census Bureau, The Research, Supplemental Poverty Measure: 2011, November 2012, available at:
http://www.census.gov/hhes/povmeas/methodology/supplemental/research/Short_ResearchSPM2011.pdf. 6 Kaiser Family Foundation, Health Care on a Budget: The Financial Burden of Health Spending by Medicare
Households, January 2014, available at: http://kff.org/medicare/issue-brief/health-care-on-a-budget-the-financial-
burden-of-health-spending-by-medicare-households/. 7 Kaiser Family Foundation, A State-by-State Snapshot of Poverty Among Seniors: Findings From Analysis of the
Supplemental Poverty Measure, May 2013, available at: http://kff.org/medicare/issue-brief/a-state-by-state-
snapshot-of-poverty-among-seniors/. For state-level estimates, data were pooled across three years (2009-2011).

4
Older women are more likely than older men to live on incomes near or below the poverty level
for many reasons. With lower-paying jobs during their working years, older women tend to
have lower average Social Security and pension benefits than men. Many worked part-time or
left the workforce for periods of time to raise families or care for aging family members.8 For
widows, the loss of a spouse also means the loss of significant household income from Social
Security and pensions.9 For these women, the loss of income is often not proportionally offset
by a decrease in household expenses, such as mortgage or rent and utilities, requiring them to
bear a greater burden alone.10
Further, women tend to have higher out-of-pocket health expenditures than men, which
contribute to their higher rates of poverty compared to men under the Supplemental Poverty
Measure.
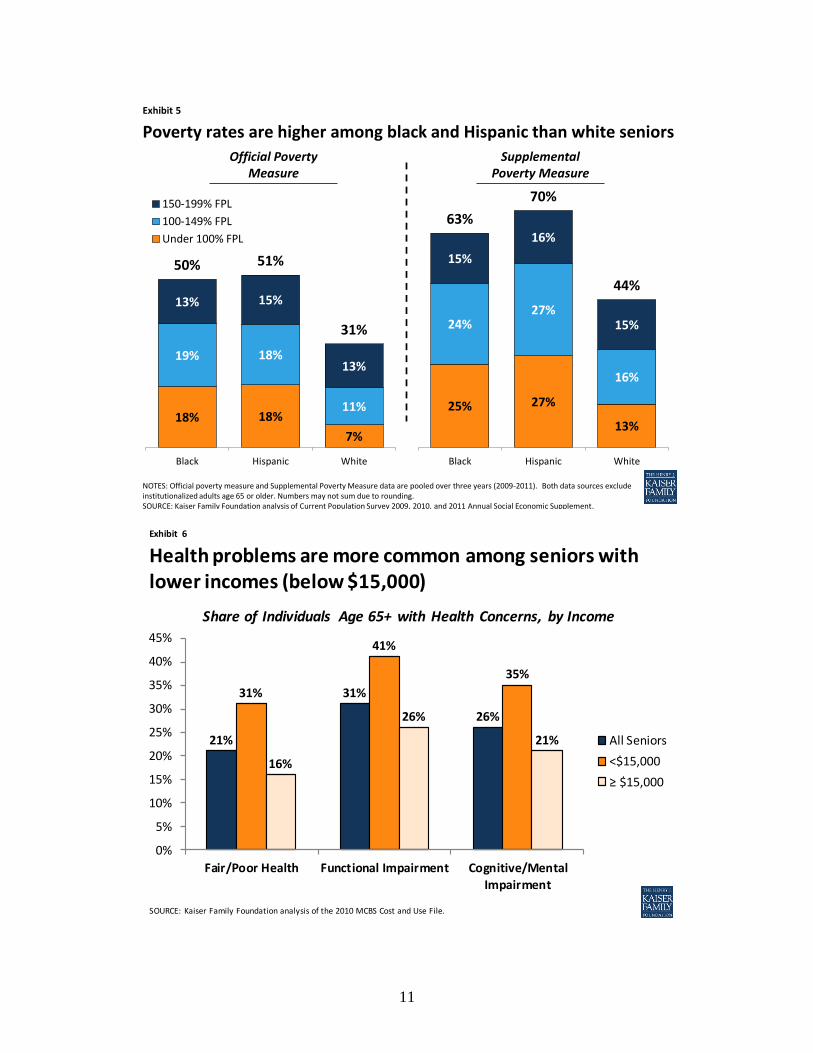
Higher Poverty Rates Among Black and Hispanic Seniors than White Seniors
Poverty rates among black seniors (18 percent) and Hispanic seniors (18 percent) are more than
double the rate among white seniors (7 percent) (Exhibit 5 and Table 2). Half of black and
Hispanic seniors (50 percent and 51 percent, respectively) live on incomes below twice the
poverty measure, as compared to 31 percent of white seniors. The gap in poverty rates
between white and non-white seniors looks similar when the Supplemental Poverty Measure is
used, although the rates are considerably higher (25%, 27%, and 13% for black, Hispanic, and
white seniors, respectively, living below poverty, and 63%, 70%, and 44% below 200% of
poverty).
8 Kaiser Family Foundation, Medicare’s Role for Older Women, May 2013, available at: http://kff.org/womens-
health-policy/fact-sheet/medicares-role-for-older-women/. 9 Kaiser Family Foundation, Income and Assets of Medicare Beneficiaries, 2013 – 2030, January 2014, available at
http://kff.org/medicare/issue-brief/income-and-assets-of-medicare-beneficiaries-2013-2030/. 10
Kaiser Family Foundation, Key Issues in Understanding the Economic and Health Security of Current and Future
Generations of Seniors, March 2012, available at: http://kff.org/medicaid/issue-brief/key-issues-in-understanding-
the-economic-and/.

5
People of color are more likely than whites to be poor or near poor in their retirement years
because they are more likely to have worked in lower paying jobs, and less likely to have
worked for employers that offered pensions and retiree health benefits. Minorities also
experience a higher incidence of chronic health conditions, both before and after retirement,
which leads to lower incomes, diminished capacity to save during pre-retirement years, and
higher health care expenses during retirement.11
Seniors With Low Incomes Tend to Have Greater Health Needs
Seniors with low incomes, defined here as incomes below $15,000, tend to be in poorer health
than those with higher incomes (Exhibit 6). Nearly one third (31%) of seniors with incomes
below $15,000 report their health status as fair/poor, nearly double the rate reported by
seniors with higher incomes (16 percent). More than four in ten seniors with incomes below
$15,000 report having a functional impairment, as compared to 26 percent of those with
incomes greater than $15,000. Similarly, more than one third of these low-income seniors (35
percent) report having cognitive impairments, as compared to 21 percent of seniors with
incomes greater than $15,000. Efforts that focus greater attention on the needs of low-income
seniors would therefore also target support to seniors with significant health limitations who
are more likely to go without needed care if they are unable to afford the cost of their care.12
The Role of Medicare and Medicaid
Medicare provides important protections for more than 52 million elderly and disabled
beneficiaries, including but not limited to those with low incomes. Medicare covers a wide
range of essential health care services, including inpatient, outpatient, post-acute, diagnostic
and preventive care, and outpatient prescription drugs that would otherwise be unaffordable
11
Kaiser Family Foundation, Wide Disparities in the Income and Assets of People on Medicare by Race and
Ethnicity: Now and in the Future, September 2013, available at: http://kff.org/medicare/report/wide-disparities-in-
the-income-and-assets-of-people-on-medicare-by-race-and-ethnicity-now-and-in-the-future/. 12
Kaiser Family Foundation, Key Issues in Understanding the Economic and Health Security of Current and Future
Generations of Seniors, March 2012, available at: http://kff.org/medicaid/issue-brief/key-issues-in-understanding-
the-economic-and/.

6
for many beneficiaries. Without Medicare, not only would more seniors be living in poverty,
but the burden of their health expenses would most likely be extended to their children and
grandchildren, who themselves may be struggling to cover routine education, housing and
other expenses and saving for their own retirement.
Even with Medicare, beneficiaries are subject to premiums and high cost-sharing requirements
and incur costs for services that are not covered by Medicare, such as dental visits, eyeglasses,
hearing aids, and long-term services and supports. In 2014, Medicare has a Part A deductible
($1,216), a Part B deductible ($147) and a Part D standard deductible ($310).13,14 Medicare also
imposes cost-sharing requirements on most services and, unlike many large employer plans,
has no limit on out-of-pocket spending for services covered under Parts A and B, and has a gap
in the Part D benefit, known as the “doughnut hole” until 2020.
Medicaid, the Medicare Savings Programs, and the Part D Low-Income Subsidy Program Help Make Medicare Affordable for Low-Income Seniors Medicaid, the Medicare Savings Programs, and the Part D Low-Income Subsidy Program provide
important financial protections for low-income beneficiaries that help to make Medicare more
affordable. Eligibility and benefits vary across these programs, and each require individuals to
meet both an income and asset test as a condition of eligibility (Table 3). Individuals eligible for
full Medicaid benefits receive help with Medicare premiums and cost-sharing, and qualify for
additional Medicaid-covered benefits, such as dental care and long-term care services and
supports. Eligibility levels for full Medicaid benefits that supplement Medicare vary across
states, but in many states, to qualify, individuals must have incomes below 75 percent of the
federal poverty level and assets at or below $2,000/individual or $3,000/couple. These asset
levels are not indexed to rise with inflation.
13
Centers for Medicare and Medicaid Services, Medicare 2014 Costs at a Glance, available at:
http://www.medicare.gov/your-medicare-costs/costs-at-a-glance/costs-at-glance.html#collapse-4811. 14
Kaiser Family Foundation, The Medicare Prescription Drug Benefit Fact Sheet, November 2013, available at:
http://kff.org/medicare/fact-sheet/the-medicare-prescription-drug-benefit-fact-sheet/.
7
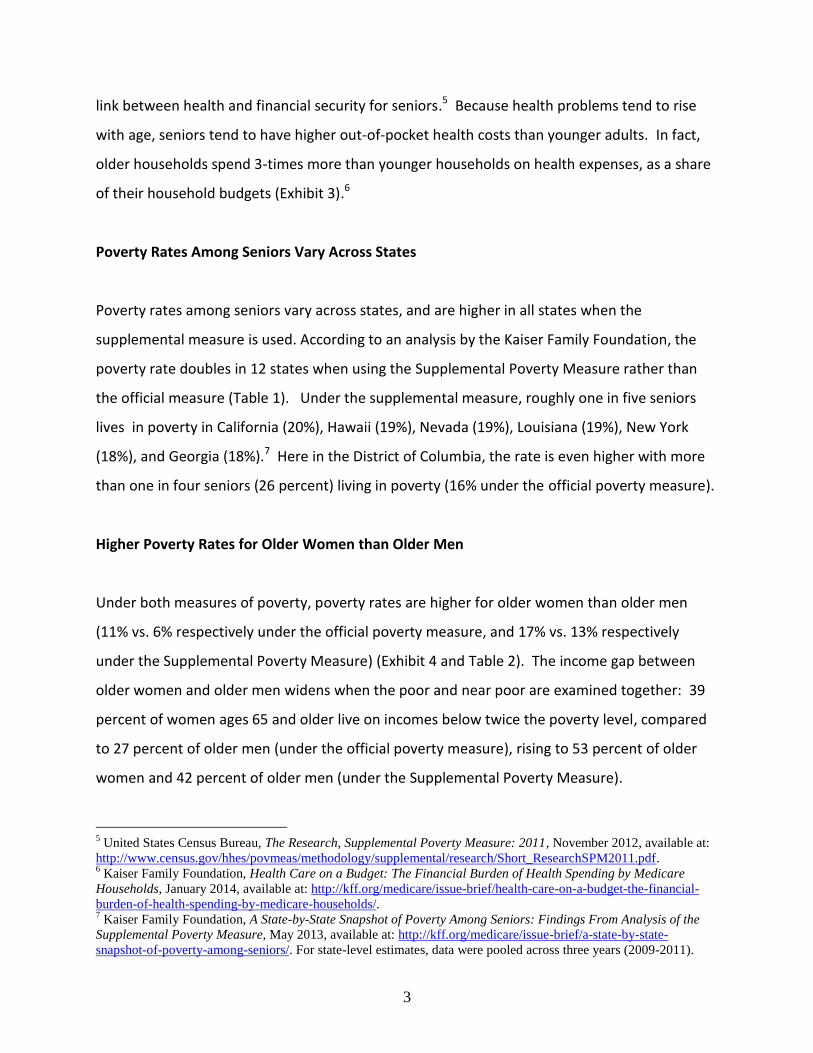
The Medicare Savings Programs (MSP) help with Medicare premiums and, in some instances,
cost-sharing for beneficiaries with somewhat higher incomes (up to 135 percent of poverty,
with some variation across states). The MSP programs are available to individuals with assets
below $7,160/individual and $10,750/couple. The Part D Low-Income Subsidy (LIS) program
provides full premium and cost-sharing assistance on a sliding-scale basis to Medicare
beneficiaries with incomes below 135 percent of poverty, subject to the same asset test as the
MSP program, and partial assistance up to 150 percent of the federal poverty level and assets
below $11,940/individual and $23,860/couple.
Even With These Programs, Many Low-Income Seniors Do Not Get Extra Help
While Medicare, together with Medicaid, Medicare Savings Programs and Part D LIS, provide
important financial protections to seniors with low incomes, many low-income seniors do not
receive this additional assistance– either because they did not know about or apply for
coverage, had savings and other assets that exceed the eligibility thresholds, or attempted to
apply but were deterred by the application process.
Among seniors with incomes below 150 percent of the federal poverty level, two thirds
received additional assistance from Medicaid, the Medicare Savings Programs or the Part D
Low-Income Subsidy Program (Exhibit 7). More than one third (37 percent) received full
Medicaid benefits, along with premium and cost-sharing assistance for Part D. Nearly one in
five (18 percent), known as “partial duals”, received help under the Medicare Savings Programs
(Qualified Medicare Beneficiaries, Specified Low-Income Medicare Beneficiaries and Qualifying
Individuals) and an additional 13 percent received help with their Part D premiums and cost-
sharing in 2011.
However, nearly three million seniors, or one third of all seniors with incomes below 150
percent of the federal poverty level -- $16,760 for individuals and $21,143 for couples – receive
no additional assistance and are responsible for covering the cost of their premiums, cost-
sharing requirements and other health expenses.
8
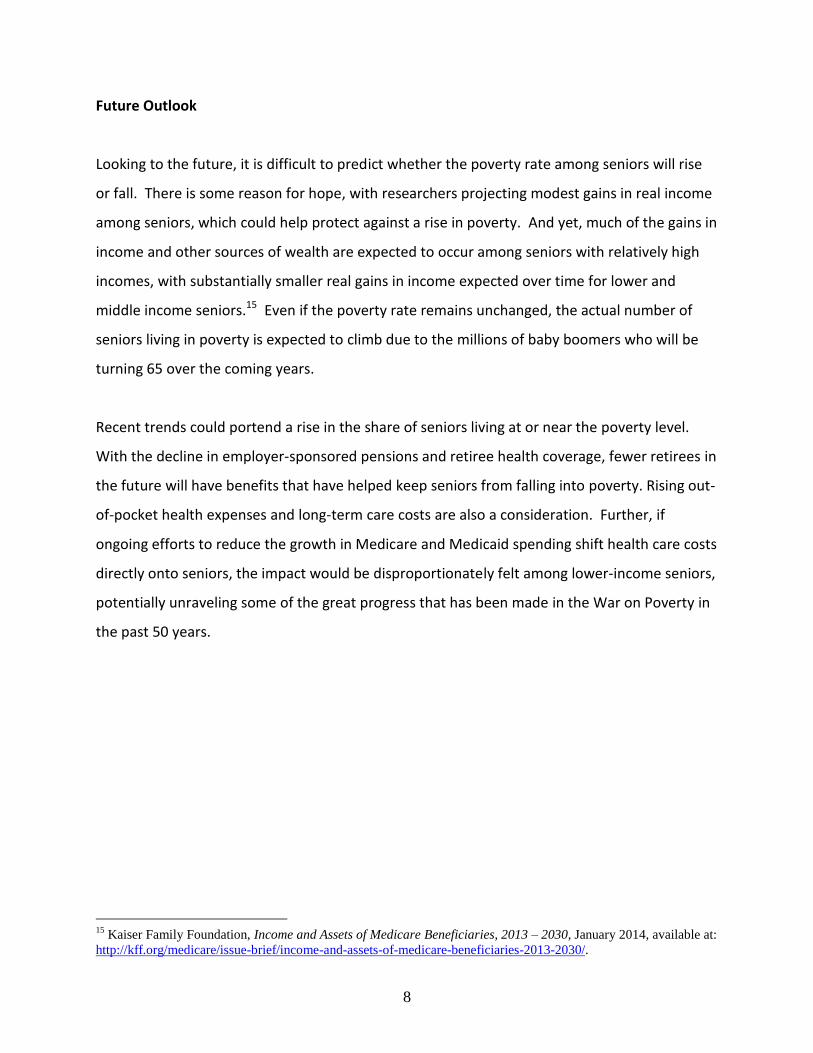
Future Outlook
Looking to the future, it is difficult to predict whether the poverty rate among seniors will rise
or fall. There is some reason for hope, with researchers projecting modest gains in real income
among seniors, which could help protect against a rise in poverty. And yet, much of the gains in
income and other sources of wealth are expected to occur among seniors with relatively high
incomes, with substantially smaller real gains in income expected over time for lower and
middle income seniors.15 Even if the poverty rate remains unchanged, the actual number of
seniors living in poverty is expected to climb due to the millions of baby boomers who will be
turning 65 over the coming years.
Recent trends could portend a rise in the share of seniors living at or near the poverty level.
With the decline in employer-sponsored pensions and retiree health coverage, fewer retirees in
the future will have benefits that have helped keep seniors from falling into poverty. Rising out-
of-pocket health expenses and long-term care costs are also a consideration. Further, if
ongoing efforts to reduce the growth in Medicare and Medicaid spending shift health care costs
directly onto seniors, the impact would be disproportionately felt among lower-income seniors,
potentially unraveling some of the great progress that has been made in the War on Poverty in
the past 50 years.
15
Kaiser Family Foundation, Income and Assets of Medicare Beneficiaries, 2013 – 2030, January 2014, available at:
http://kff.org/medicare/issue-brief/income-and-assets-of-medicare-beneficiaries-2013-2030/.
9
Exhibit 1
1965 1970 1975 1980 1985 1990 1995 2000 2005 2010
Share of Individuals Age 65+ Living in Poverty
24.6%
15.3% 15.7%
12.6% 12.2%
10.5% 9.9% 10.1%9.0%
1965 1970 1975 1980 1985 1990 1995 2000 2005 2010
SOURCE: United States Census Bureau, Current Population Survey Historic Trend Tables, September 2013.
The share of seniors living in poverty has dropped significantly since the introduction of Medicare
Medicare Enacted
Exhibit 2
9%15%
12%
18%13%
15%
Official Measure Supplemental Measure
Poverty rates are higher under the Supplemental Poverty Measure
NOTES: Official poverty measure and Supplemental Poverty Measure data are pooled over three years (2009-2011). Both data sources exclude institutionalized adults age 65 or older. Numbers may not sum due to rounding.SOURCE: Kaiser Family Foundation analysis of Current Population Survey 2009, 2010, and 2011 Annual Social Economic Supplement.
Nearly one in ten seniors live in poverty; more than one in three live below twice the poverty level
34% with incomes
below 200% of the poverty threshold
48% with incomes
below 200% of the poverty threshold
2013 Poverty Level:$11,173/individual or $14,095/couple
Under 100% FPL
100%-149% FPL
150%-199% FPL
Official Poverty Measure
Supplemental Poverty Measure

10
Exhibit 3
Housing$16,976 32.0%
$9,660 18.2% $2,772
5.2%
Food$7,890 14.9%
Other$15,702 29.6%
Housing$11,673*
34.3%
$5,087* 15.0%
Health Care$4,722* 13.9%*
Food$5,189* 15.3%
Other$7,321* 21.5%*
NOTE: *Estimate statistically significantly different from the non-Medicare household estimate at the 95 percent confidence level. SOURCE: Kaiser Family Foundation, Health Care on a Budget: The Financial Burden of Health Spending by Medicare Households, January 2014.
Older households spend 3-times more than younger households on health expenses, as a share of their household budgets
TransportationTransportation
Health Care
Non-Medicare Household SpendingMedicare Household Spending
Average Household Spending = $53,000
Average Household Spending = $33,993*
Exhibit 4
6% 11%
9%
14%11%
14%27%
39%
Men Women
150-199% FPL
100-149% FPL
Under 100% FPL
NOTES: Official poverty measure and Supplemental Poverty Measure data are pooled over three years (2009-2011). Both data sources exclude institutionalized adults age 65 or older. Numbers may not sum due to rounding.SOURCE: Kaiser Family Foundation analysis of Current Population Survey 2009, 2010, and 2011 Annual Social Economic Supplement.
13%17%
15%
20%
14%
15%42%
53%
Men Women
Among seniors, poverty rates are higher among women than men
Official Poverty Measure
Supplemental Poverty Measure
11
Exhibit 5
18% 18%
7%
19% 18%
11%
13% 15%
13%
50% 51%
31%
Black Hispanic White
150-199% FPL
100-149% FPL
Under 100% FPL
NOTES: Official poverty measure and Supplemental Poverty Measure data are pooled over three years (2009-2011). Both data sources exclude institutionalized adults age 65 or older. Numbers may not sum due to rounding.SOURCE: Kaiser Family Foundation analysis of Current Population Survey 2009, 2010, and 2011 Annual Social Economic Supplement.
25% 27%
13%
24%27%
16%
15%
16%
15%
63%
70%
44%
Black Hispanic White
Poverty rates are higher among black and Hispanic than white seniors
Official Poverty Measure
Supplemental Poverty Measure
Exhibit 6
21%
31%
26%
31%
41%
35%
16%
26%
21%
0%
5%
10%
15%
20%
25%
30%
35%
40%
45%
Fair/Poor Health Functional Impairment Cognitive/MentalImpairment
Share of Individuals Age 65+ with Health Concerns, by Income
All Seniors
˂$15,000
≥ $15,000
SOURCE: Kaiser Family Foundation analysis of the 2010 MCBS Cost and Use File.
Health problems are more common among seniors with lower incomes (below $15,000)

12
Exhibit 7
No Medicaid, Medicare
Savings Program, or Part D LIS
32%
Part D Low-Income Subsidy Only
13%Medicare Shared Savings Programs
18%
Full Medicaid
37%
Note: Excludes seniors living in nursing homes but may include some seniors living in other institutions. Analysis based on official poverty measure.SOURCE: Kaiser Family Foundation analysis of a five percent sample of Medicare beneficiaries from the CMS Chronic Condition Data Warehouse, 2011 and the Current Population Survey, 2011 Annual Social and Economic Supplement .
Two thirds of low-income seniors on Medicare receive some help with Medicare premiums and cost-sharing -- but one third do not
Total = 8.7 million non-institutionalized seniors on Medicare with incomes below 150% FPL
Distribution of individuals age 65+ on Medicare with incomes below 150% FPL by Enrollment in Medicaid, the Medicare Savings Programs, or the Part D Low-Income Subsidy Program

13
TABLE 1: Percent of Individuals Ages 65 and Older With Incomes Below 100% and 200% of Poverty,
2009-2011
Below 100% of the poverty threshold Below 200% of the poverty threshold
State
Official
poverty
measure
Supplemental
poverty
measure
Percentage
point
difference
Official
poverty
measure
Supplemental
poverty
measure
Percentage
point
difference
United States 9% 15% 6%* 34% 48% 14%* Alaska 10% 15% 5%* 31% 47% 16%* Alabama 9% 12% 3% 39% 45% 6% Arkansas 12% 15% 3% 44% 50% 7% Arizona 9% 15% 6%* 31% 42% 12%* California 8% 20% 12%* 33% 56% 23%* Colorado 7% 15% 8%* 28% 42% 15%* Connecticut 6% 13% 6%* 26% 46% 20%* DC 16% 26% 10%* 37% 59% 22%* Delaware 8% 15% 7%* 29% 46% 17%* Florida 9% 17% 9%* 33% 51% 18%* Georgia 12% 18% 6%* 42% 54% 11%* Hawaii 8% 19% 11%* 30% 55% 25%* Iowa 6% 8% 2% 33% 41% 8% Idaho 8% 15% 6%* 32% 43% 11%* Illinois 8% 15% 7%* 34% 47% 13%* Indiana 8% 13% 5%* 34% 48% 14%* Kansas 7% 11% 4% 32% 41% 9%* Kentucky 9% 12% 3% 41% 48% 7% Louisiana 15% 19% 4% 45% 52% 6% Massachusetts 7% 16% 9%* 30% 48% 18%* Maryland 8% 17% 9%* 27% 48% 21%* Maine 8% 12% 4%* 36% 47% 12%* Michigan 7% 12% 4%* 32% 44% 13%* Minnesota 7% 14% 7%* 31% 44% 13%* Missouri 7% 11% 4% 35% 43% 8%* Mississippi 12% 17% 5%* 43% 51% 8%* Montana 8% 12% 4%* 39% 45% 6% North Carolina 10% 15% 5%* 39% 47% 8%* North Dakota 9% 10% 1% 30% 36% 6% Nebraska 7% 11% 5%* 30% 40% 11%* New Hampshire 6% 17% 11%* 30% 49% 19%* New Jersey 8% 17% 9%* 30% 49% 19%* New Mexico 10% 13% 2% 36% 45% 9%* Nevada 9% 19% 10%* 30% 49% 19%* New York 11% 18% 7%* 35% 52% 17%* Ohio 8% 11% 3%* 35% 44% 9%* Oklahoma 7% 12% 5%* 34% 41% 7% Oregon 7% 11% 4%* 28% 43% 15%* Pennsylvania 9% 14% 5%* 35% 46% 12%* Rhode Island 8% 15% 6%* 36% 52% 16%* South Carolina 11% 14% 3% 38% 47% 9%* South Dakota 7% 10% 3% 29% 37% 8%* Tennessee 11% 16% 5%* 42% 52% 10%* Texas 11% 17% 6%* 36% 47% 11%* Utah 7% 11% 4% 28% 43% 15%* Virginia 9% 13% 4%* 29% 42% 13%* Vermont 9% 12% 3% 35% 47% 12%* Washington 7% 11% 5%* 25% 42% 16%* Wisconsin 5% 11% 6%* 30% 40% 11%* West Virginia 9% 11% 2% 38% 43% 5% Wyoming 7% 14% 7%* 33% 46% 13%*
Notes: Data were pooled over three years. * Indicates statistical significance at the 95 percent confidence level.
Source: Kaiser Family Foundation, A State-by-State Snapshot of Poverty Among Seniors: Findings From Analysis of the Supplemental Poverty
Measure, May 2013.
14
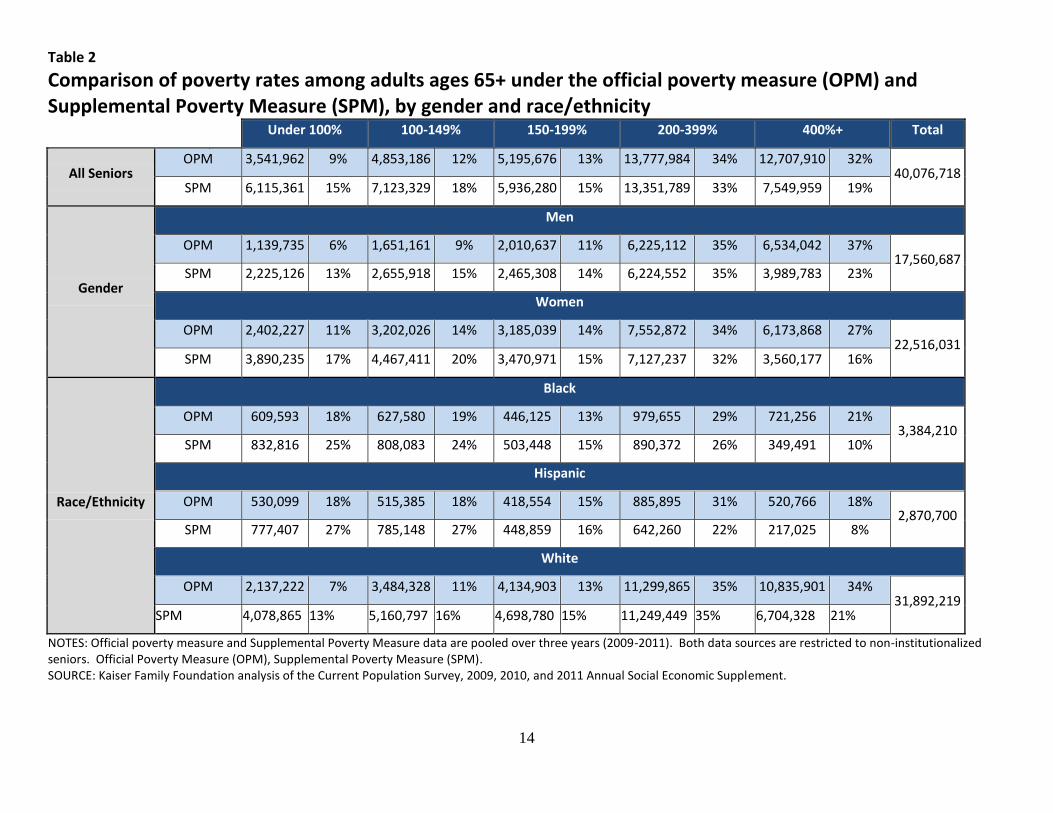
Table 2
Comparison of poverty rates among adults ages 65+ under the official poverty measure (OPM) and Supplemental Poverty Measure (SPM), by gender and race/ethnicity
Under 100% 100-149% 150-199% 200-399% 400%+ Total
All Seniors OPM 3,541,962 9% 4,853,186 12% 5,195,676 13% 13,777,984 34% 12,707,910 32%
40,076,718 SPM 6,115,361 15% 7,123,329 18% 5,936,280 15% 13,351,789 33% 7,549,959 19%
Gender
Men
OPM 1,139,735 6% 1,651,161 9% 2,010,637 11% 6,225,112 35% 6,534,042 37% 17,560,687
SPM 2,225,126 13% 2,655,918 15% 2,465,308 14% 6,224,552 35% 3,989,783 23%
Women
OPM 2,402,227 11% 3,202,026 14% 3,185,039 14% 7,552,872 34% 6,173,868 27% 22,516,031
SPM 3,890,235 17% 4,467,411 20% 3,470,971 15% 7,127,237 32% 3,560,177 16%
Race/Ethnicity
Black
OPM 609,593 18% 627,580 19% 446,125 13% 979,655 29% 721,256 21% 3,384,210
SPM 832,816 25% 808,083 24% 503,448 15% 890,372 26% 349,491 10%
Hispanic
OPM 530,099 18% 515,385 18% 418,554 15% 885,895 31% 520,766 18% 2,870,700
SPM 777,407 27% 785,148 27% 448,859 16% 642,260 22% 217,025 8%
White
OPM 2,137,222 7% 3,484,328 11% 4,134,903 13% 11,299,865 35% 10,835,901 34% 31,892,219
SPM 4,078,865 13% 5,160,797 16% 4,698,780 15% 11,249,449 35% 6,704,328 21%
NOTES: Official poverty measure and Supplemental Poverty Measure data are pooled over three years (2009-2011). Both data sources are restricted to non-institutionalized seniors. Official Poverty Measure (OPM), Supplemental Poverty Measure (SPM). SOURCE: Kaiser Family Foundation analysis of the Current Population Survey, 2009, 2010, and 2011 Annual Social Economic Supplement.

15
Table 3
Common Medicaid Eligibility Pathways and Benefits for Medicare Beneficiaries, 2014
Pathway to Eligibility Income Eligibility Level
(individual/couple) Asset Limit
(individual/couple) Covered Costs and Benefits
SSI Related (mandatory) <75% of poverty (SSI income eligibility)
$2,000/$3,000 (varies by state)
Medicaid benefits, Medicare Part A and Part B premiums and cost sharing
Poverty Level (optional) ≤100% of poverty
Medically Needy (optional) Must spend income down to a specified level to qualify, varies by state
Special Income Rule for Nursing Home Residents (optional)
Institutionalized individuals with income <300% of the SSI level
HCBS Waiver (optional) Must be eligible for institutional care
Medicare Savings Programs
Qualified Medicare Beneficiary (QMB) (mandatory)
<100% of poverty $7,160/$10,750 Medicare Part A and Part B premiums and
cost sharing
Specified Low-Income Medicare Beneficiary (SLMB), (mandatory)
100%-120% of poverty $7,160/$10,750 Medicare Part B premiums
Qualified Individual (QI), (mandatory) 120%-135% of poverty $7,160/$10,750 Medicare Part B premiums
Medicare Part D Prescription Drug Benefit
Full Low-Income Subsidy (LIS) <135% of poverty $7,160/$10,750 Medicare Part D premium, deductible, and
some cost sharing
Partial Low-Income Subsidy (LIS) 135%-150% of poverty $11,940/$23,860 Medicare Part D premium (on a sliding scale)
and some cost sharing
NOTES: SSI is Supplemental Security Income. HCBS is home and community based services. Medicaid benefits for dual-eligible beneficiaries are jointly financed by the federal government and states. Although certain categories of dual-eligible beneficiaries are eligible for Medicaid coverage of their Medicare cost sharing, the Balanced Budget Act of 1997 permitted states to pay less than the full amount of cost sharing if the Medicare rates minus the cost-sharing amount is higher than the Medicaid rate for these services. Resource limits for QMB, SLMB, QI, and LIS are adjusted annually for inflation. Not all income and resources (e.g., the value of a house, vehicle, etc.) are counted towards limits and asset limits exclude the $1,500 burial allowance. In addition, states may use less restrictive methodologies for counting income and resources, enabling them to expand eligibility above limits shown here. Eleven 209(b) states may use more restrictive limits and methodologies when determining eligibility for full Medicaid benefits. SOURCE: Centers for Medicare and Medicaid Services, Medicare Savings Program 2014 Income Limits. National Council on Aging, Chart of LIS Eligibility and Benefits in 48 Contiguous States, Alaska, and Hawaii for 2014, February 2014.