Embed Size (px)
Citation preview
U.S. Shale Gas and Tight Oil:
Game-Changers for the U.S. and the World
Dr. Helen Currie, Senior Economist
American Association of Port Authorities Annual Conference
April 6, 2016
Cautionary StatementThe following presentation includes forward-looking statements. All statements included in this presentation other than statements of historical fact, including, without limitation, statements regarding production forecasts, anticipated production mix, estimates of operating costs, assumptions regarding future commodity prices, planned drilling activity, potential changes in leverage, estimates of future capital expenditures, estimates of recoverable resources, projected rates of return and efficiency gains, estimates of future cost of supply, as well as projected cash flow, inventory levels and capital efficiency, business strategy and other plans and objectives for future operations, are forward-looking statements.
Forward-looking statements relating to ConocoPhillips’ operations are based on management’s current expectations, estimates, forecasts and projections about ConocoPhillips and the industries in which it operates in general. These statements are not guarantees of future performance as they involve assumptions that, while made in good faith, may prove to be incorrect, and involve risks and uncertainties that are difficult to predict. Further, many of these forward-looking statements are based upon assumptions about future events that may prove to be inaccurate. Accordingly, actual outcomes and results may differ materially from what is expressed or forecast in such forward-looking statements. Any differences could result from a variety of factors, including, but not limited to, the following: oil and gas prices; operational hazards and drilling risks; potential failure to achieve, and potential delays in achieving expected reserves or production levels from existing and future oil and gas development projects; unsuccessful exploratory activities; unexpected cost increases or technical difficulties in constructing, maintaining or modifying company facilities; international monetary conditions and exchange controls; potential liability for remedial actions under existing or future environmental regulations or from pending or future litigation; limited access to capital or significantly higher cost of capital related to illiquidity or uncertainty in the domestic or international financial markets; general domestic and international economic and political conditions, as well as changes in tax, environmental and other laws applicable to ConocoPhillips’ business; and the factors generally described in Item 1A—Risk Factors in our 2014 Annual Report on Form 10-K. We caution you not to place undue reliance on our forward-looking statements, which are only as of the date of this presentation, and we undertake no obligation to publicly update or revise any forward-looking statements, whether as a result of new information, future events or otherwise.
Use of non-GAAP financial information – This presentation may include non-GAAP financial measures, which help facilitate comparison of company operating performance across periods and with peer companies. Any non-GAAP measures included herein will be accompanied by a reconciliation to the nearest corresponding GAAP measure on our website at www.conocophillips.com/nongaap.
Cautionary Note to U.S. Investors – The SEC permits oil and gas companies, in their filings with the SEC, to disclose only proved, probable and possible reserves. We use the term "resource" in this presentation that the SEC’s guidelines prohibit us from including in filings with the SEC. U.S. investors are urged to consider closely the oil and gas disclosures in our Form 10-K and other reports and filings with the SEC. Copies are available from the SEC and from the ConocoPhillips website.
2
Outline
• U.S. unconventional oil and natural gas production renaissance: scale and scope
• Many benefits generated
1) Economic
2) Environmental
3) Energy security
• Steps to support continuation of the success story and to meet the world’s energy needs affordably
3
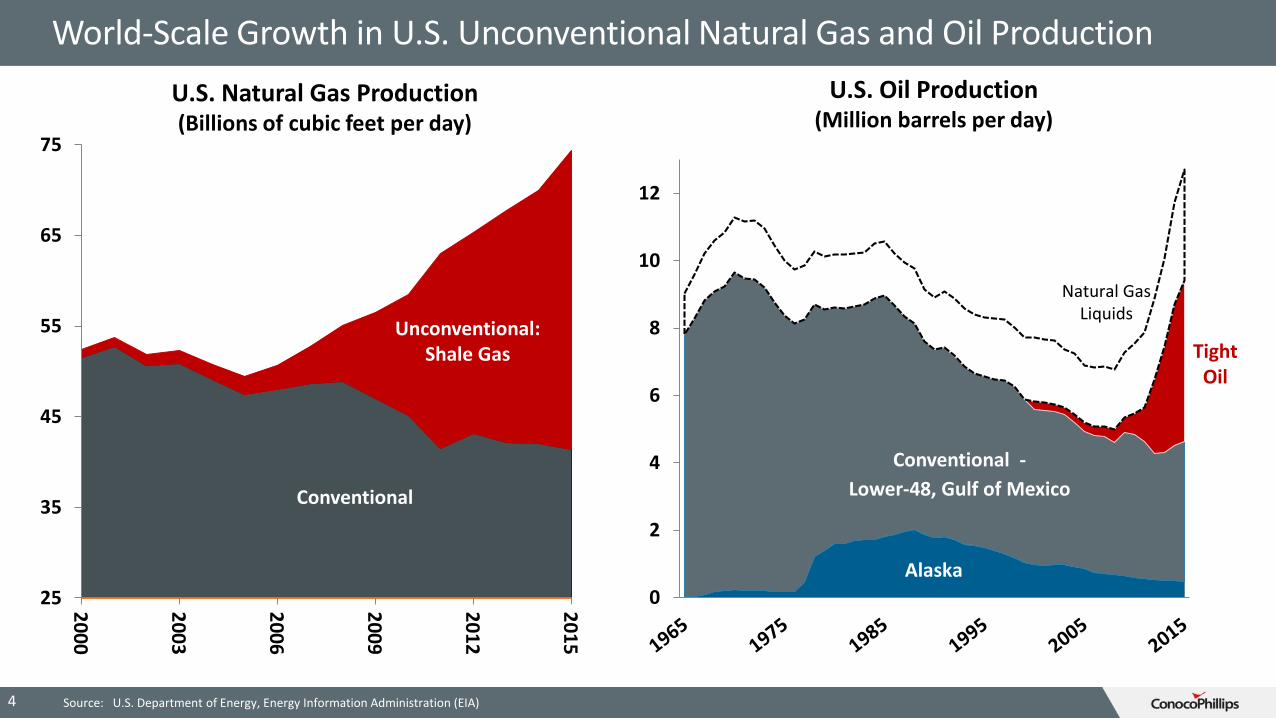
World-Scale Growth in U.S. Unconventional Natural Gas and Oil Production
Source: U.S. Department of Energy, Energy Information Administration (EIA)4
U.S. Natural Gas Production(Billions of cubic feet per day)
U.S. Oil Production(Million barrels per day)
Shale Gas
Non-Shale Gas
25
35
45
55
65
75
20
00
20
03
20
06
20
09
20
12
20
15
Unconventional:Shale Gas
Conventional
0
2
4
6
8
10
12
Conventional -
Lower-48, Gulf of Mexico
Tight Oil
Alaska
Natural Gas Liquids
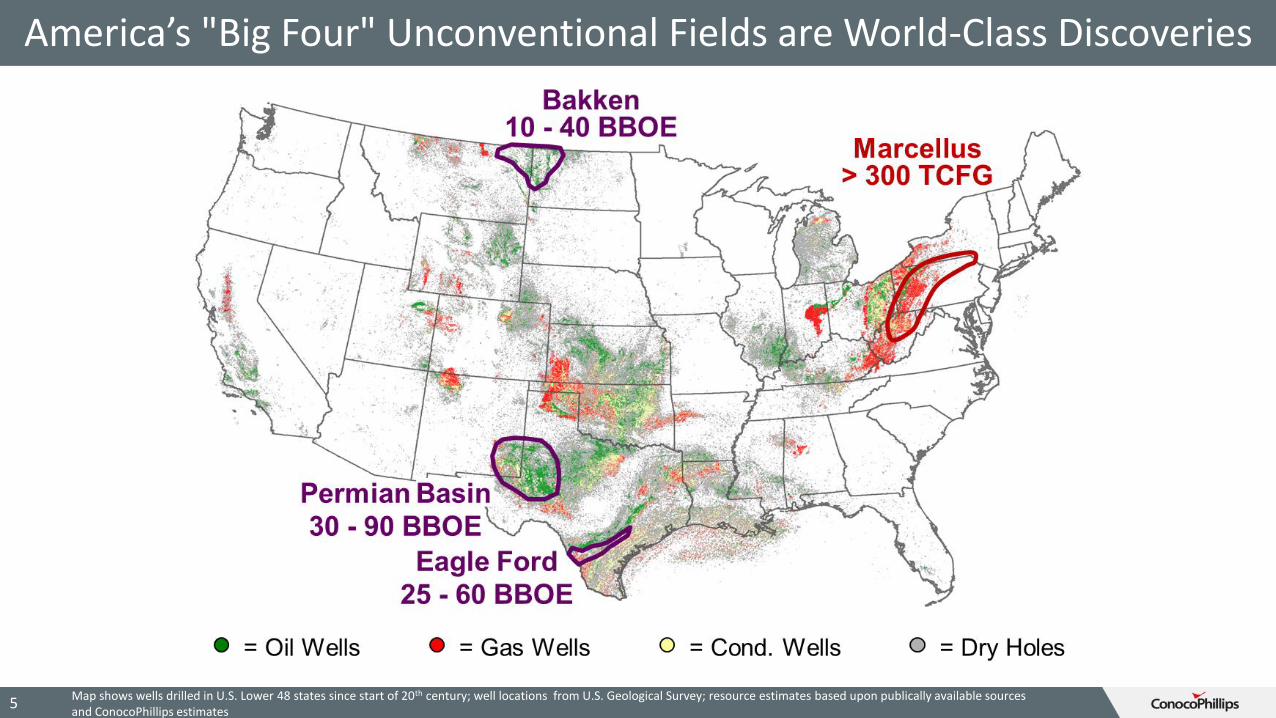
5Map shows wells drilled in U.S. Lower 48 states since start of 20th century; well locations from U.S. Geological Survey; resource estimates based upon publically available sources and ConocoPhillips estimates
America’s "Big Four" Unconventional Fields are World-Class Discoveries
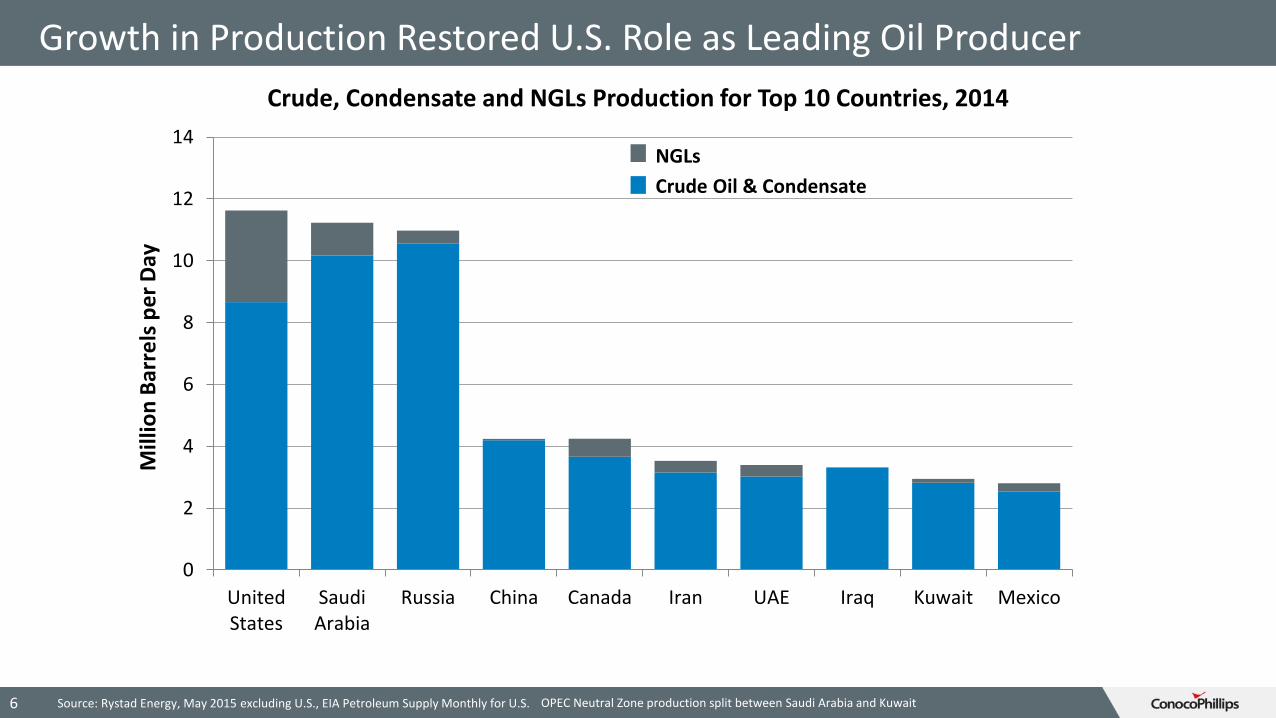
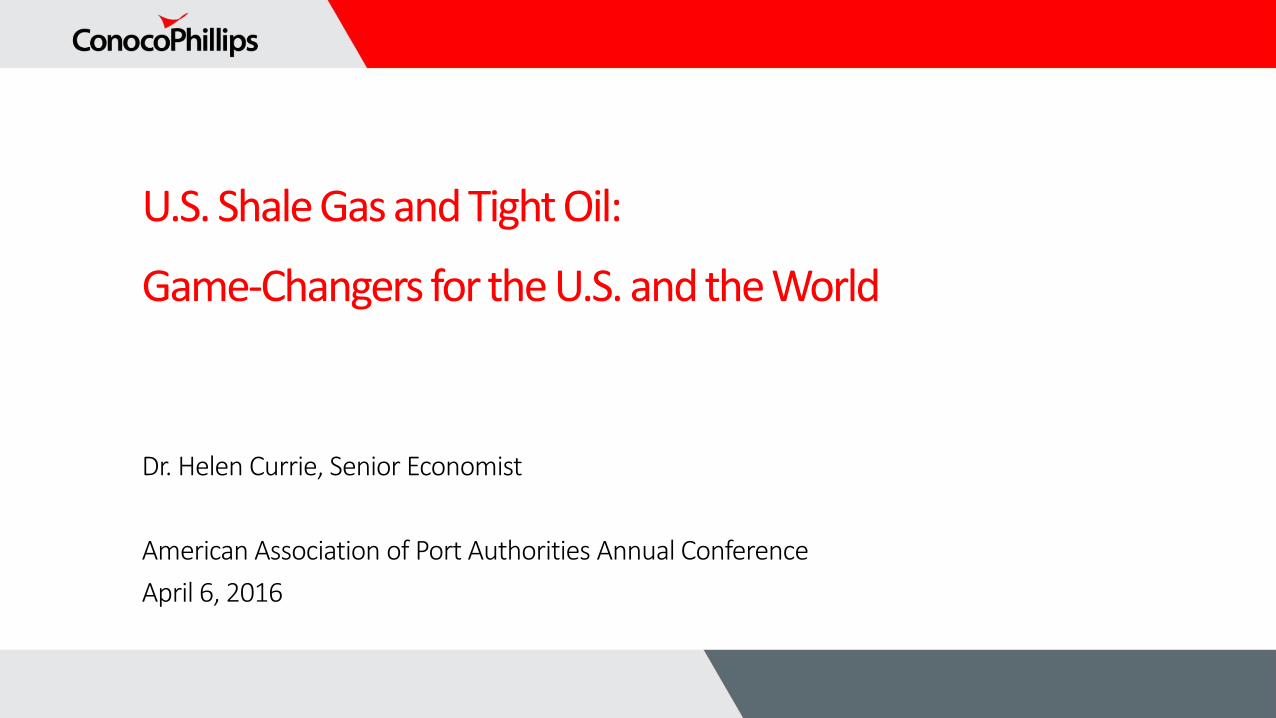
Growth in Production Restored U.S. Role as Leading Oil Producer
0
2
4
6
8
10
12
14
UnitedStates
SaudiArabia
Russia China Canada Iran UAE Iraq Kuwait Mexico
Mill
ion
Bar
rels
per
Day
Crude Oil & Condensate
NGLs
Source: Rystad Energy, May 2015 excluding U.S., EIA Petroleum Supply Monthly for U.S.
Crude, Condensate and NGLs Production for Top 10 Countries, 2014
OPEC Neutral Zone production split between Saudi Arabia and Kuwait6
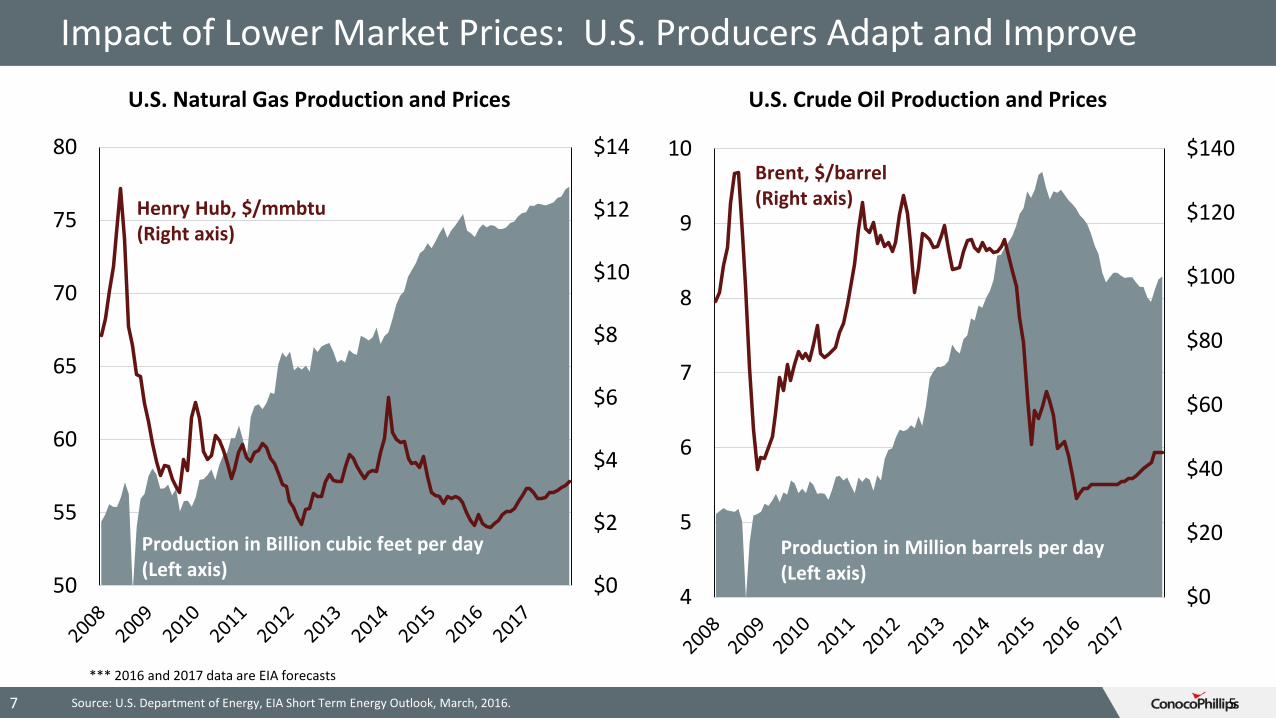
Impact of Lower Market Prices: U.S. Producers Adapt and Improve
Mid-sizedE&Ps
SmallE&Ps
Source: U.S. Department of Energy, EIA Short Term Energy Outlook, March, 2016.
U.S. Natural Gas Production and Prices U.S. Crude Oil Production and Prices
5
$0
$2
$4
$6
$8
$10
$12
$14
50
55
60
65
70
75
80
Henry Hub, $/mmbtu(Right axis)
Production in Billion cubic feet per day (Left axis)
$0
$20
$40
$60
$80
$100
$120
$140
4
5
6
7
8
9
10
Production in Million barrels per day (Left axis)
Brent, $/barrel(Right axis)
7
*** 2016 and 2017 data are EIA forecasts
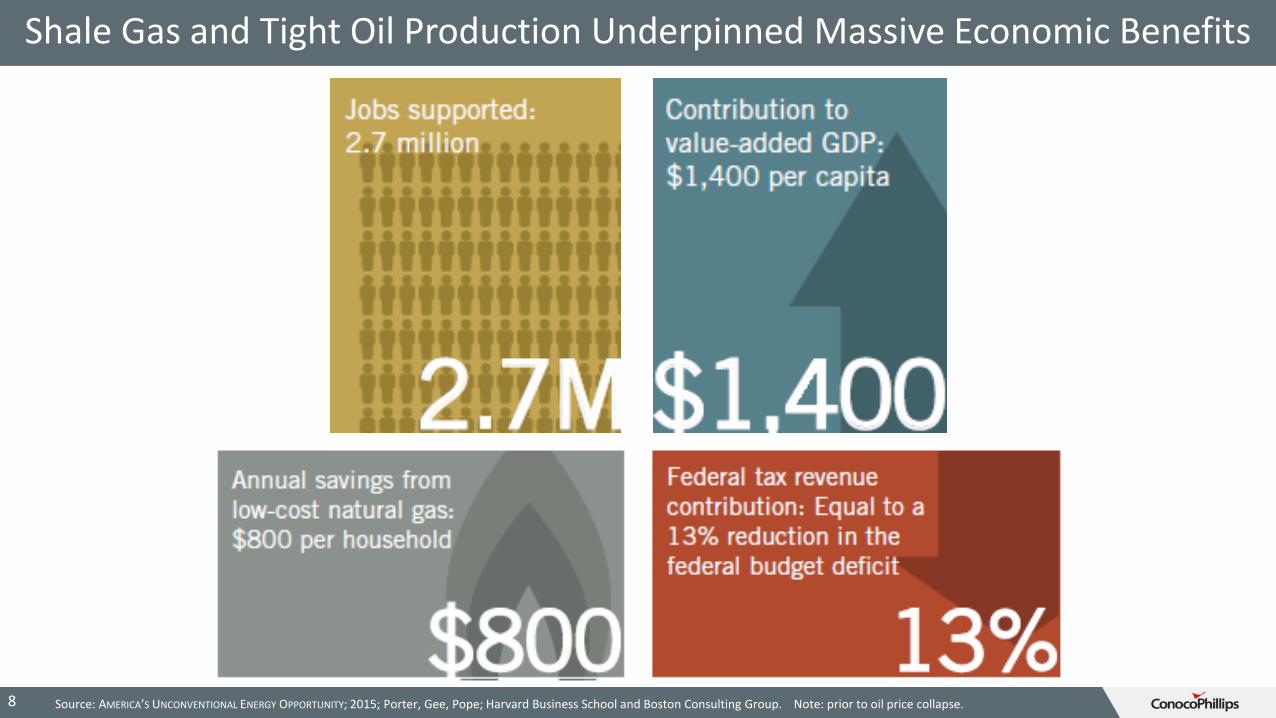
Shale Gas and Tight Oil Production Underpinned Massive Economic Benefits
8 Source: AMERICA’S UNCONVENTIONAL ENERGY OPPORTUNITY; 2015; Porter, Gee, Pope; Harvard Business School and Boston Consulting Group. Note: prior to oil price collapse.
4%
5%
6%
7%
8%
9%
10%
2007 2008 2010 2011 2013 2014 2016
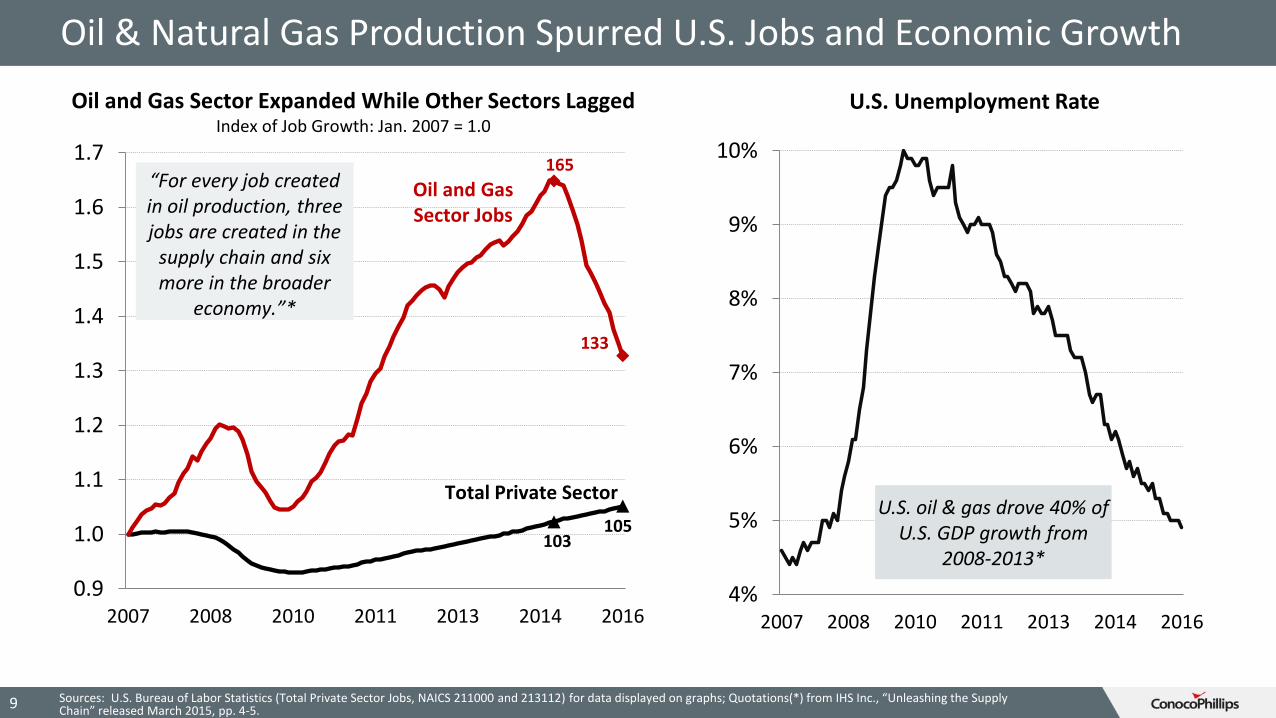
U.S. Unemployment Rate
U.S. oil & gas drove 40% of U.S. GDP growth from
2008-2013*
0.9
1.0
1.1
1.2
1.3
1.4
1.5
1.6
1.7
2007 2008 2010 2011 2013 2014 2016
Oil and Gas Sector Expanded While Other Sectors LaggedIndex of Job Growth: Jan. 2007 = 1.0
Oil and Gas Sector Jobs
Total Private Sector
133
165
105103
“For every job created in oil production, three jobs are created in the
supply chain and six more in the broader
economy.”*
Sources: U.S. Bureau of Labor Statistics (Total Private Sector Jobs, NAICS 211000 and 213112) for data displayed on graphs; Quotations(*) from IHS Inc., “Unleashing the Supply Chain” released March 2015, pp. 4-5.9
Oil & Natural Gas Production Spurred U.S. Jobs and Economic Growth
10
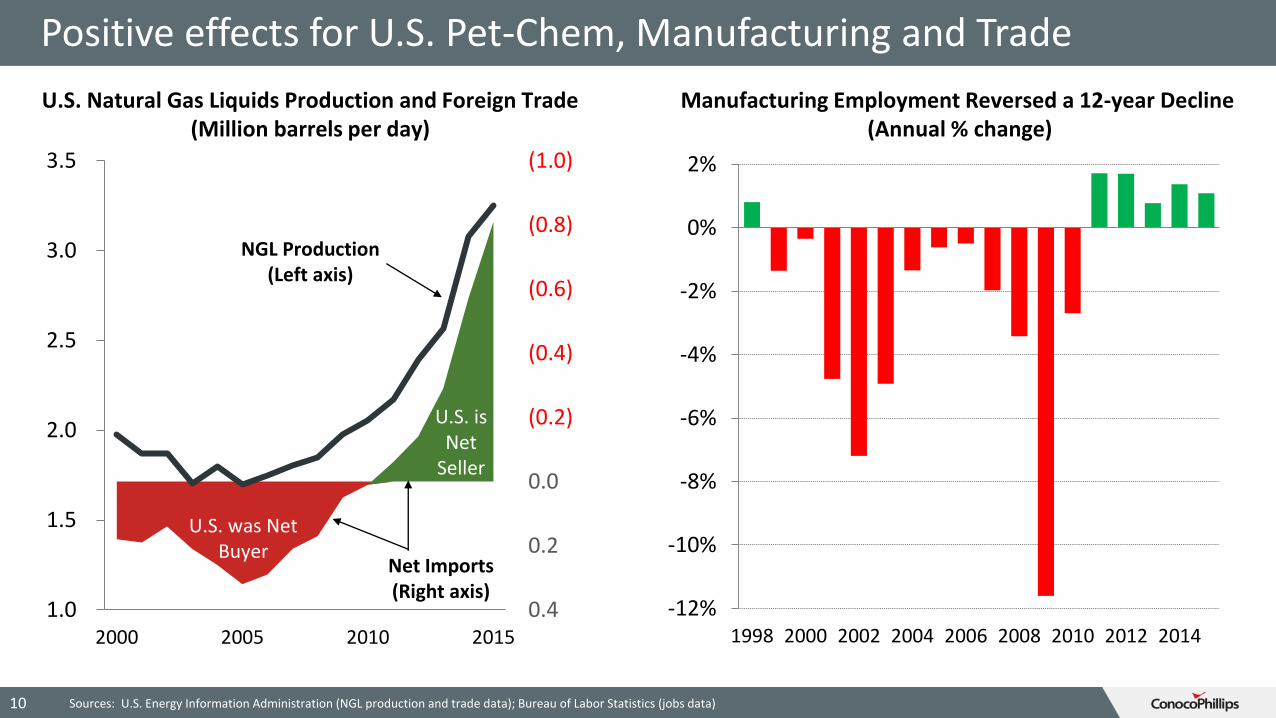
Positive effects for U.S. Pet-Chem, Manufacturing and Trade
Sources: U.S. Energy Information Administration (NGL production and trade data); Bureau of Labor Statistics (jobs data)
(1.0)
(0.8)
(0.6)
(0.4)
(0.2)
0.0
0.2
0.41.0
1.5
2.0
2.5
3.0
3.5
2000 2005 2010 2015
U.S. Natural Gas Liquids Production and Foreign Trade(Million barrels per day)
NGL Production(Left axis)
Net Imports(Right axis)
U.S. was Net Buyer
U.S. is Net
Seller
-12%
-10%
-8%
-6%
-4%
-2%
0%
2%
1998 2000 2002 2004 2006 2008 2010 2012 2014
Manufacturing Employment Reversed a 12-year Decline (Annual % change)
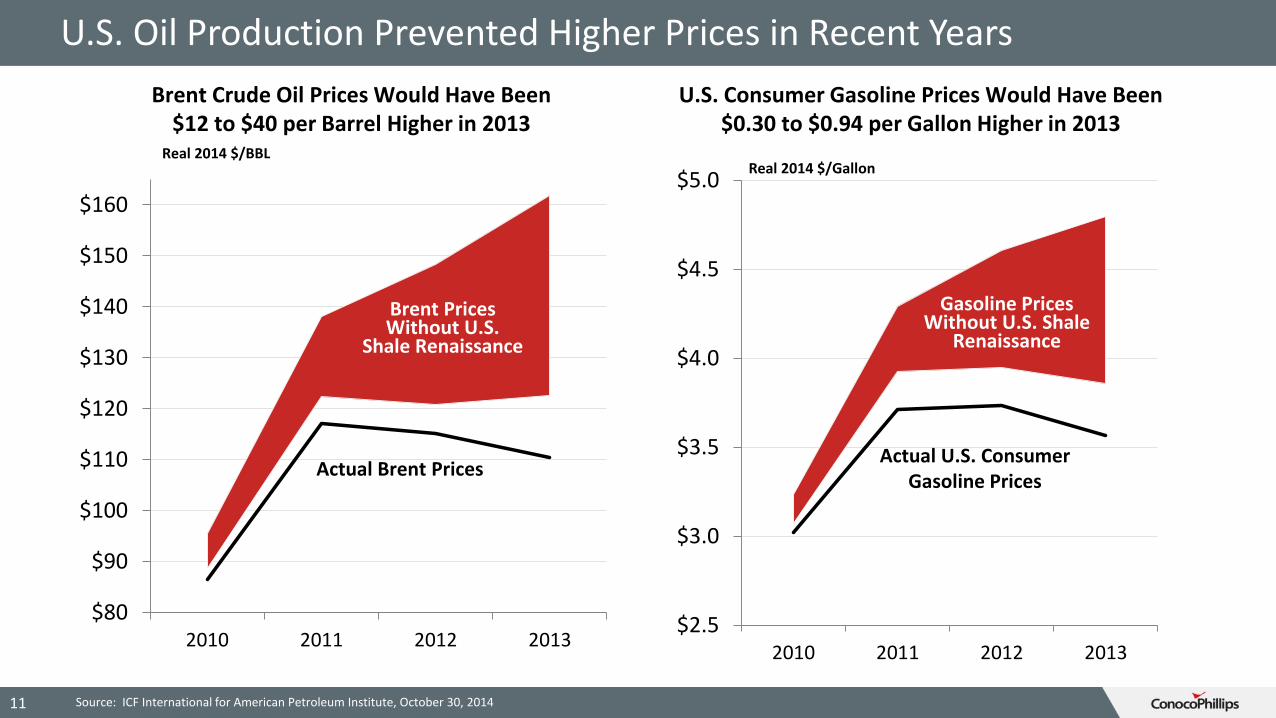
U.S. Oil Production Prevented Higher Prices in Recent Years
$80
$90
$100
$110
$120
$130
$140
$150
$160
2010 2011 2012 2013
Brent Crude Oil Prices Would Have Been$12 to $40 per Barrel Higher in 2013
Actual Brent Prices
Brent Prices Without U.S.
Shale Renaissance
Real 2014 $/BBL
$2.5
$3.0
$3.5
$4.0
$4.5
$5.0
2010 2011 2012 2013
U.S. Consumer Gasoline Prices Would Have Been $0.30 to $0.94 per Gallon Higher in 2013
Real 2014 $/Gallon
Actual U.S. Consumer Gasoline Prices
Gasoline Prices Without U.S. Shale
Renaissance
Source: ICF International for American Petroleum Institute, October 30, 2014 11
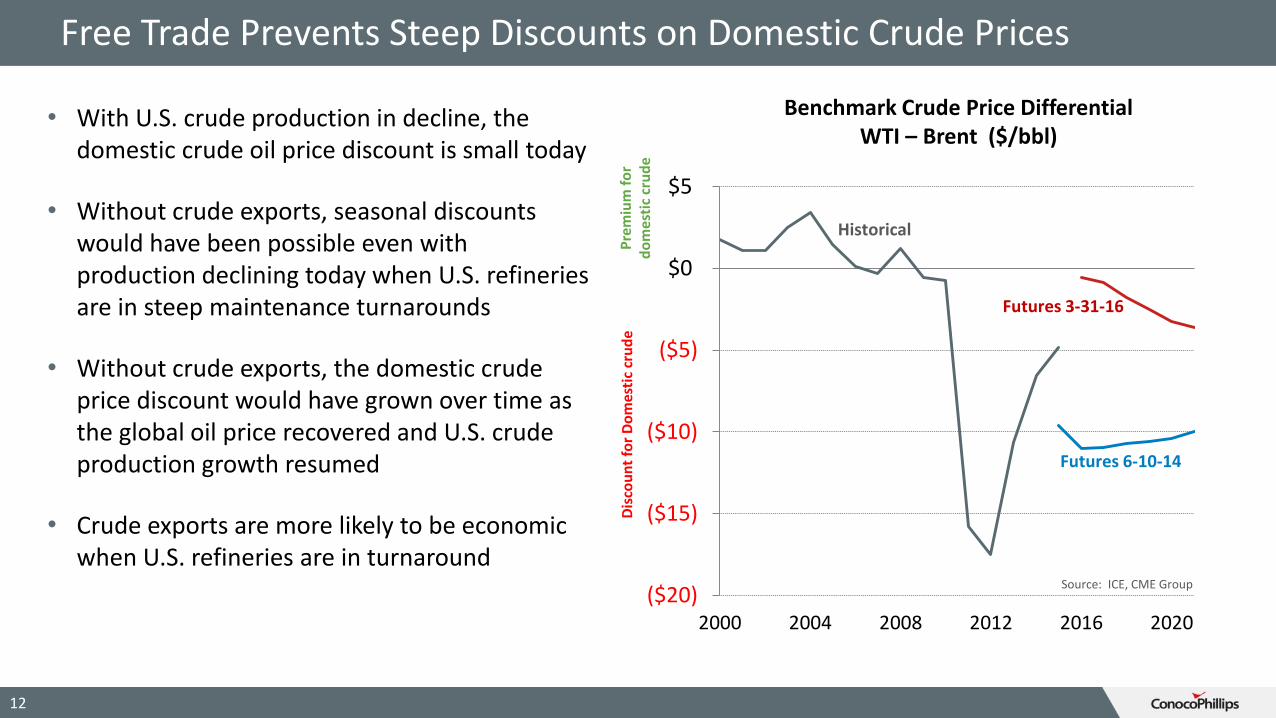
Free Trade Prevents Steep Discounts on Domestic Crude Prices
($20)
($15)
($10)
($5)
$0
$5
2000 2004 2008 2012 2016 2020
Futures 6-10-14
Futures 3-31-16
Historical
Dis
cou
nt
for
Do
mes
tic
cru
de
Pre
miu
m f
or
do
mes
tic
cru
de
12
Source: ICE, CME Group
Benchmark Crude Price DifferentialWTI – Brent ($/bbl)
• With U.S. crude production in decline, the domestic crude oil price discount is small today
• Without crude exports, seasonal discounts would have been possible even with production declining today when U.S. refineries are in steep maintenance turnarounds
• Without crude exports, the domestic crude price discount would have grown over time as the global oil price recovered and U.S. crude production growth resumed
• Crude exports are more likely to be economic when U.S. refineries are in turnaround
Critical Success Factors for U.S. Production Growth
• Legal and fiscal systems that facilitate investment
• Private property & mineral rights
• Fit for purpose regulations
• Efficient permitting process
• Large drilling fleet and service/support capabilities
• Highly developed transportation infrastructure
• Transparent market pricing
• Numerous market hubs
• Liquid Spot and Forward markets
13
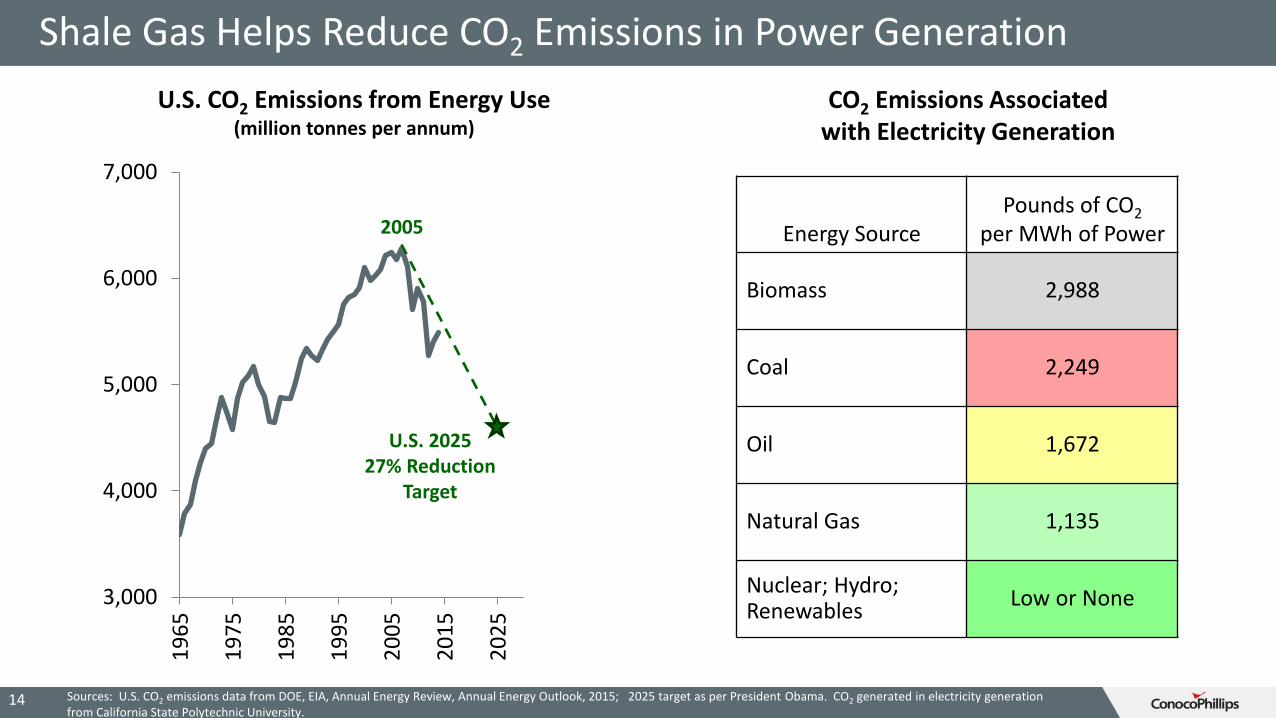
Shale Gas Helps Reduce CO2 Emissions in Power Generation
14
Energy SourcePounds of CO2
per MWh of Power
Biomass 2,988
Coal 2,249
Oil 1,672
Natural Gas 1,135
Nuclear; Hydro; Renewables
Low or None
CO2 Emissions Associatedwith Electricity Generation
3,000
4,000
5,000
6,000
7,0001
96
5
19
75
19
85
19
95
20
05
20
15
20
25
U.S. 202527% Reduction
Target
2005
U.S. CO2 Emissions from Energy Use(million tonnes per annum)
Sources: U.S. CO2 emissions data from DOE, EIA, Annual Energy Review, Annual Energy Outlook, 2015; 2025 target as per President Obama. CO2 generated in electricity generation from California State Polytechnic University.
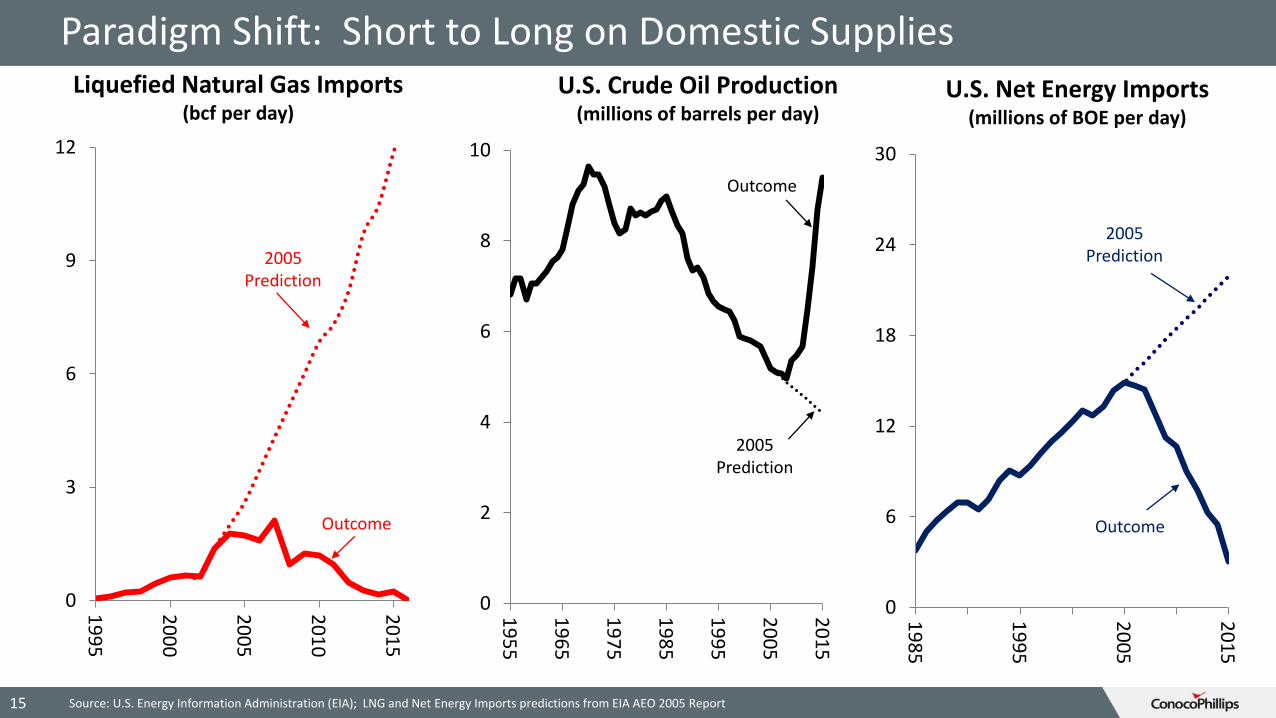
Paradigm Shift: Short to Long on Domestic Supplies
Source: U.S. Energy Information Administration (EIA); LNG and Net Energy Imports predictions from EIA AEO 2005 Report15
0
6
12
18
24
30
19
85
19
95
20
05
20
15
0
2
4
6
8
10
19
55
19
65
19
75
19
85
19
95
20
05
20
15
2005Prediction
Outcome
0
3
6
9
12
19
95
20
00
20
05
20
10
20
15
Outcome
2005Prediction
2005Prediction
Outcome
U.S. Crude Oil Production(millions of barrels per day)
Liquefied Natural Gas Imports(bcf per day)
U.S. Net Energy Imports(millions of BOE per day)
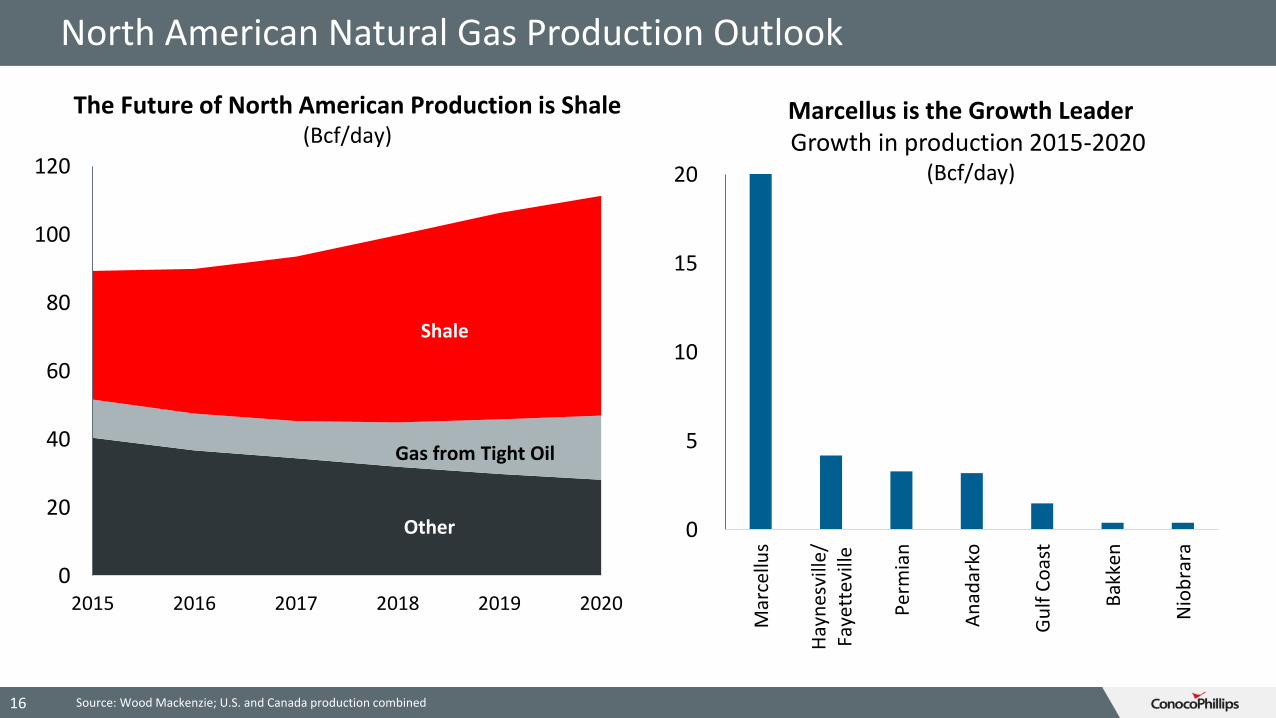
North American Natural Gas Production Outlook
Source: Wood Mackenzie; U.S. and Canada production combined16
0
20
40
60
80
100
120
2015 2016 2017 2018 2019 2020
The Future of North American Production is Shale(Bcf/day)
Shale
Other
Gas from Tight Oil
0
5
10
15
20
Mar
cellu
s
Hay
ne
svill
e/Fa
yett
evill
e
Per
mia
n
An
adar
ko
Gu
lf C
oas
t
Bak
ken
Nio
bra
ra
Marcellus is the Growth LeaderGrowth in production 2015-2020
(Bcf/day)
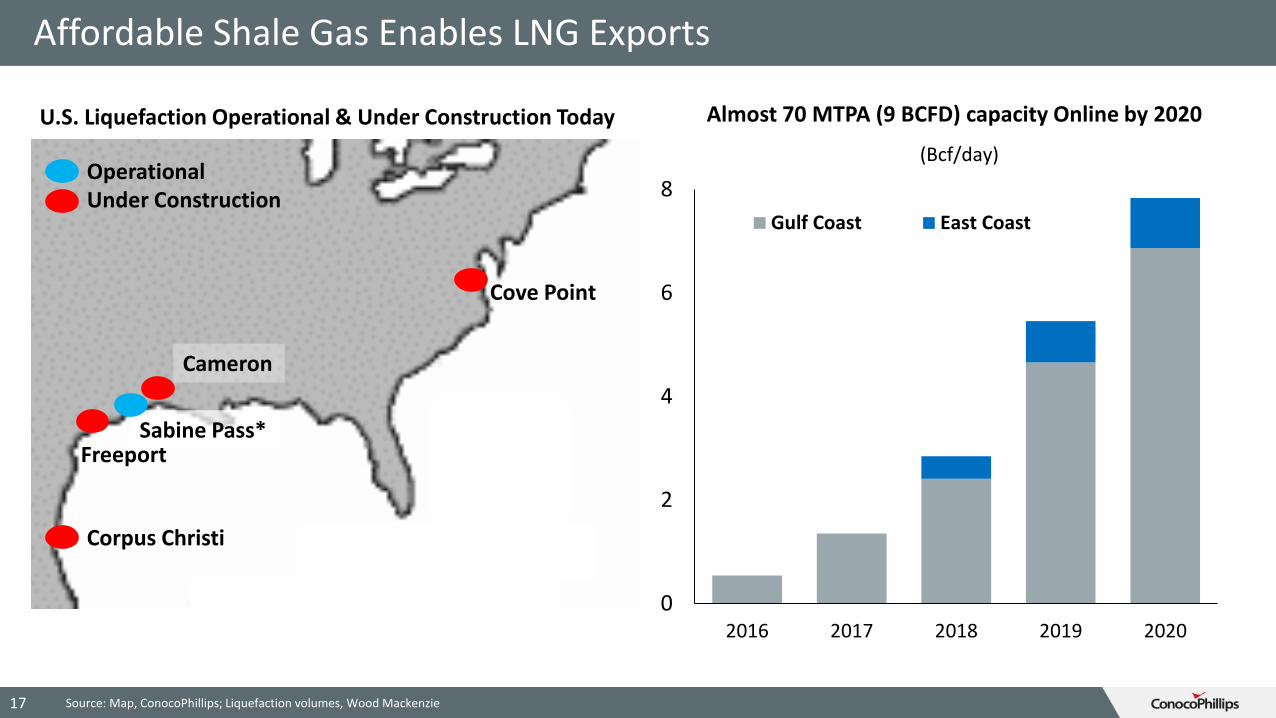
Affordable Shale Gas Enables LNG Exports
17
Almost 70 MTPA (9 BCFD) capacity Online by 2020
0
2
4
6
8
2016 2017 2018 2019 2020
Gulf Coast East Coast
(Bcf/day)
Sabine Pass*
Cameron
Freeport
Corpus Christi
Cove Point
U.S. Liquefaction Operational & Under Construction Today
OperationalUnder Construction
Source: Map, ConocoPhillips; Liquefaction volumes, Wood Mackenzie
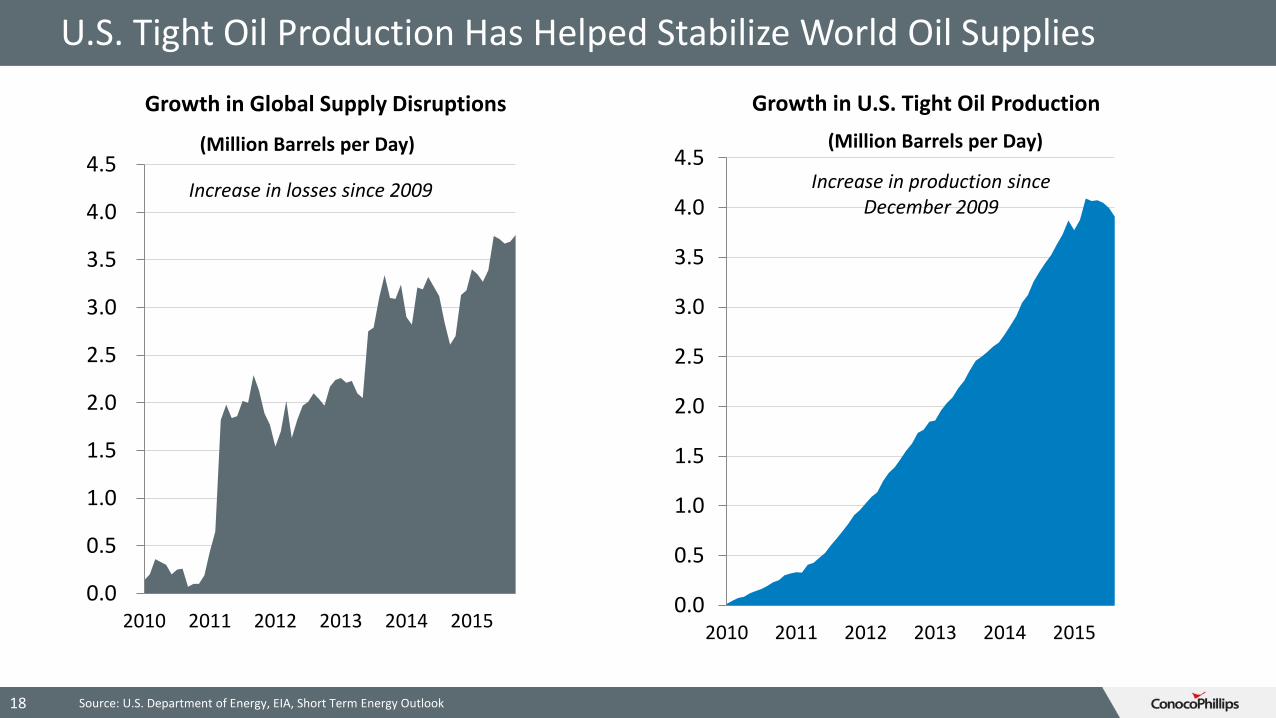
Source: U.S. Department of Energy, EIA, Short Term Energy Outlook
0.0
0.5
1.0
1.5
2.0
2.5
3.0
3.5
4.0
4.5
2010 2011 2012 2013 2014 2015
Growth in U.S. Tight Oil Production
Increase in production since December 2009
0.0
0.5
1.0
1.5
2.0
2.5
3.0
3.5
4.0
4.5
2010 2011 2012 2013 2014 2015
Growth in Global Supply Disruptions
Increase in losses since 2009
(Million Barrels per Day) (Million Barrels per Day)
18
U.S. Tight Oil Production Has Helped Stabilize World Oil Supplies
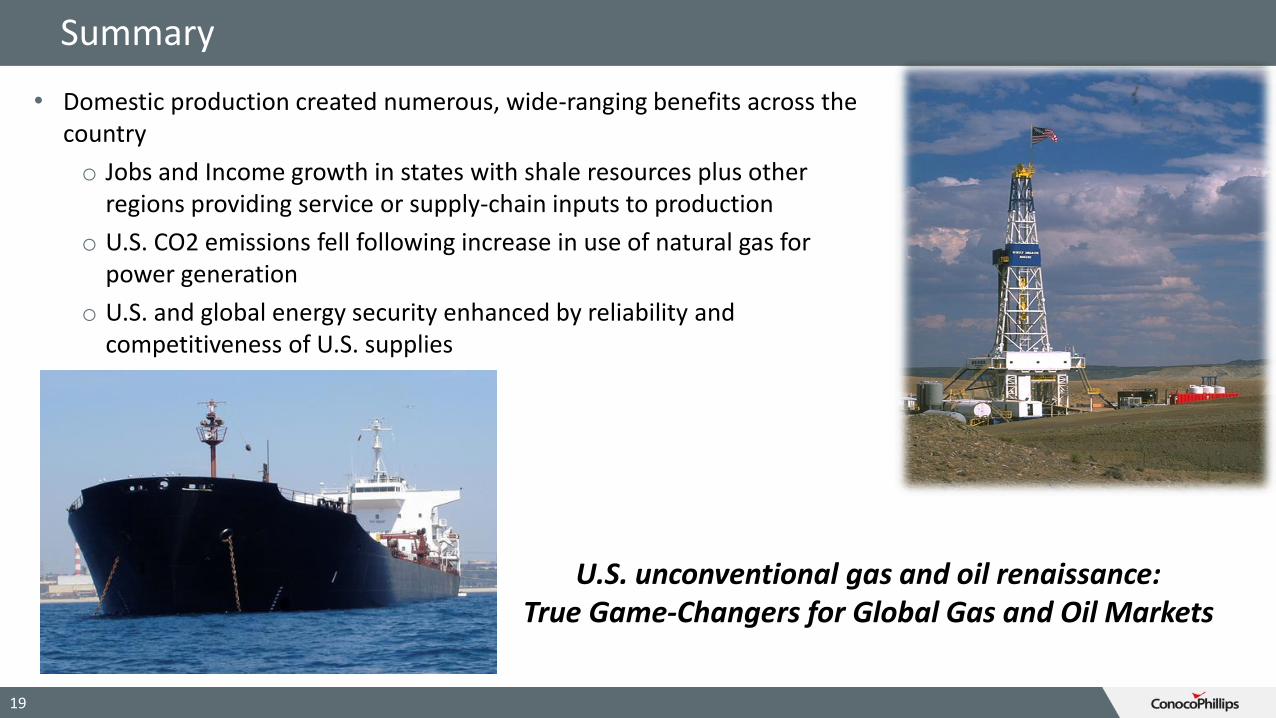
Summary
• Domestic production created numerous, wide-ranging benefits across the country
o Jobs and Income growth in states with shale resources plus other regions providing service or supply-chain inputs to production
o U.S. CO2 emissions fell following increase in use of natural gas for power generation
o U.S. and global energy security enhanced by reliability and competitiveness of U.S. supplies
19
U.S. unconventional gas and oil renaissance: True Game-Changers for Global Gas and Oil Markets