Embed Size (px)
Citation preview

www.eia.govU.S. Energy Information Administration Independent Statistics & Analysis
U.S. Shale Gas in Context
For
National Conference of State Legislatures – Natural Gas Policy Institute
September 9, 2015| Pittsburgh, Pennsylvania
By
Grant Nülle, Upstream Oil & Gas Economist, Exploration and Production
Analysis Team
Overview of U.S. Natural Gas production and trends

Discussion agenda
• About the U.S. Energy Information Administration
• Fundamentals of shale gas
• Natural gas production and electricity generation outlook
Nülle | NCSL Natural Gas Policy Institute
Sept. 9, 2015 2

EIA mission: independent statistics and analysis
• EIA was created by the U.S. Congress in 1977
• EIA collects, analyzes, and disseminates independent and
impartial energy information to promote sound policymaking,
efficient markets, and public understanding of energy and its
interaction with the economy and the environment
• EIA is the nation's premier source of energy information and,
by law, its data, analyses, and forecasts are independent of
approval by any other officer or employee of the U.S.
Government
• EIA does not propose or advocate any policy positions
Nülle | NCSL Natural Gas Policy Institute
Sept. 9, 2015 3
EIA produces data series, analyses, and energy projections
• Weekly, monthly, and annual data
– Displays U.S. and regional production, stocks, blender inputs, imports, and exports
• Real-time analyses
– Digests important developments in Today in Energy, This Week in Petroleum, Issues & Trends, Country Analysis Briefs, Drilling Productivity Report
• Short-Term Energy Outlook (STEO)
– Forecasts U.S. supplies, demands, imports, stocks, and prices of energy with a horizon of 12 to 24 months
• Annual Energy Outlook (AEO)
– Presents 25- to 30-year projection and analysis of U.S. energy supply, demand, and prices
• International Energy Outlook (IEO)
– Assesses international energy production and consumption
Nülle | NCSL Natural Gas Policy Institute
Sept. 9, 2015 44

The U.S. has experienced a rapid increase in natural gas and oil
production from shale and other tight resources
5
0.0
0.5
1.0
1.5
2.0
2.5
3.0
3.5
4.0
4.5
5.0Eagle Ford (TX)
Bakken (MT & ND)
Spraberry (TX & NM Permian)
Bonespring (TX & NM Permian)
Wolfcamp (TX & NM Permian)
Delaware (TX & NM Permian)
Yeso-Glorieta (TX & NM Permian)
Niobrara-Codell (CO, WY)
Haynesville
Utica (OH, PA & WV)
Marcellus (PA,WV,OH & NY)
Woodford (OK)
Granite Wash (OK & TX)
Austin Chalk (LA & TX)
Monterey (CA)
U.S. tight oil production
million barrels of oil per day
0
5
10
15
20
25
30
35
40
45Marcellus (PA,WV,OH & NY)
Haynesville (LA & TX)
Eagle Ford (TX)
Fayetteville (AR)
Barnett (TX)
Woodford (OK)
Bakken (ND)
Antrim (MI, IN, & OH)
Utica (OH, PA & WV)
Rest of US 'shale'
U.S. dry shale gas production
billion cubic feet per day
Sources: EIA derived from state administrative data collected by DrillingInfo Inc. Data are through July 2015 and represent
EIA’s official tight oil & shale gas estimates, but are not survey data. State abbreviations indicate primary state(s).
Nülle | NCSL Natural Gas Policy Institute
Sept. 9, 2015

0
10
20
30
40
50
60
70
0%
10%
20%
30%
40%
50%
60%
70%
80%
90%
100%
2000 2002 2004 2006 2008 2010 2012 2014
Rest of US gas production
Marcellus (PA & WV)
Haynesville (LA & TX)
Eagle Ford (TX)
Fayetteville (AR)
Barnett (TX)
Woodford (OK)
Bakken (ND)
Antrim (MI, IN, & OH)
Utica (OH, PA & WV)
Other US 'shale'
Shale gas % of total
Natural gas production (dry)
billion cubic feet per day
Shale gas production as a
percent of total gas production
Sources: EIA Natural Gas Monthly data through December, STEO through June 2015 and Drilling Info.
Nülle | NCSL Natural Gas Policy Institute
Sept. 9, 2015 6
Estimated U.S. shale gas production was 41.0 Bcf/d in June 2015
about 56% of total U.S. dry production (73.6 Bcf/d)

Nülle | NCSL Natural Gas Policy Institute
Sept. 9, 2015 7
Shale gas and tight oil plays

Tight oil characteristics vary considerably
• Prior to the “shale development breakthrough”
– Drillers targeted either oil or natural gas formations
– Production was relatively stable over a long period from each well
– Simple rig count was sufficient to monitor and forecast production
• Drilling in tight formations
– New applications of technology: Horizontal drilling and hydraulic fracturing
– Pad drilling: Multiple wells per rig from one surface location
– High initial production rates driven by better technology
– Steep production declines
– Formations yielding both oil and natural gas
– Regional differences contrast rig and well productivity
– Higher costs to drill and complete a well
Nülle | NCSL Natural Gas Policy Institute
Sept. 9, 2015 8

Shale gas and tight oil trends: production
by geography – the Drilling Productivity
Report (DPR)
Nülle | NCSL Natural Gas Policy Institute
Sept. 9, 2015
http://www.eia.gov/petroleum/drilling/
9

Nülle | NCSL Natural Gas Policy Institute
Sept. 9, 2015 10
2 months or more 2 – 4 months 1- 2 months or more
Source: EIA, Drilling Productivity Report, August 2015
Seven key plays account for nearly all recent growth in U.S. oil and
natural gas production

Nülle | NCSL Natural Gas Policy Institute
Sept. 9, 2015 11
DPR captures key elements of shale
Source: EIA Drilling Productivity Report, Aug. 2015, DrillingInfo Inc.

0
1,000
2,000
3,000
4,000
5,000
6,000
7,000
8,000
9,000
Bakken Eagle Ford Haynesville Marcellus Niobrara Permian Utica
August 2014
August 2015
new-well gas production per rig
thousand cubic feet per day
Source: EIA, Drilling Productivity Report, July 2015
Nülle | NCSL Natural Gas Policy Institute
Sept. 9, 2015 12
Rig productivity underpins natural gas production gains

Contributing factors to U.S. Shale Gas / Tight Oil production
• Technical expertise and experience
• Extensive transportation capacity
• Price responsiveness of producers
• Regulatory stability & property rights
Nülle | NCSL Natural Gas Policy Institute
Sept. 9, 2015 13

Natural gas & electricity generation
outlook
Nülle | NCSL Natural Gas Policy Institute
Sept. 9, 2015 14

An increasing amount of electric power generation comes from
natural gas
15
electricity net generation
trillion kilowatthours
Source: EIA, Annual Energy Outlook 2015 Reference case
0
1
2
3
4
5
1990 1995 2000 2005 2010
13%
27%
19%
39%
13%
NuclearPetroleum and other liquids
Natural gas
Coal
Renewables
2013
1%
1993
11%
13%
19%
53%
4%
Nülle | NCSL Natural Gas Policy Institute
Sept. 9, 2015

Low natural gas prices have made natural gas
competitive with coal generation
Nülle | NCSL Natural Gas Policy Institute
Sept. 9, 2015 16
Source: U.S. Energy Information Administration, Electricity Data Browser
0
2
4
6
8
10
12
14
Natural Gas
Coal
Average U.S. costs for fossil fuels for generation $/MMBtu

17Nülle | NCSL Natural Gas Policy Institute
Sept. 9, 2015
Coal38.8%
Petroleum0.7%
Natural gas27.5%
Other gases0.3%
Nuclear19.5%
Conventional hydroelectric
6.3%
Wind4.4%
Solar thermal and PV
0.4%Wood and wood-derived fuels
1.1% Geothermal0.4%
Other biomass0.5%
Other6.9%
In 2014, U.S. electricity generation was 67% fossil fuels, 20%
nuclear, and 13% renewable2014 Total net generation:
4,093 billion kWh 2014 Non-hydro renewable
net generation:
281 billion kWh
Source: EIA, Monthly Energy Review

U.S. power plant capacity additions in 2014
megawatts (MW)
Source: U.S. Energy Information Administration, Electric Power Monthly, February 2015 edition
Note: Data include facilities with a net summer capacity of 1 MW and above only.
Nülle | NCSL Natural Gas Policy Institute
Sept. 9, 2015 18
Nearly half of power plant capacity additions in 2014 came from
natural gas
0 1,000 2,000 3,000 4,000 5,000 6,000 7,000 8,000 9,000
Other
Solar
Wind
Natural Gas

Growth in natural gas electric power
capacity is expected to continue.
June 2014 to May 2015 Additions
EPM maps
May 2015 to April 2016
Total: 21,447 MW
Nülle | NCSL Natural Gas Policy Institute
Sept. 9, 2015 19
0
1,000
2,000
3,000
4,000
5,000
6,000
7,000
8,000
9,000
Wind NaturalGas
Solar Nuclear Hydro Other

Shale resources remain the dominant source of U.S. natural gas
production growth
20
U.S. dry natural gas production
trillion cubic feet
Source: EIA, Annual Energy Outlook 2015 Reference case
0
10
20
30
40
50
60
70
80
90
100
0
5
10
15
20
25
30
35
40
1990 1995 2000 2005 2010 2015 2020 2025 2030 2035 2040
Tight gas
Coalbed methane
Other lower 48 onshore
Shale gas and tight oil plays
AlaskaLower 48 offshore
ProjectionsHistory 2013
billion cubic feet per day
Nülle | NCSL Natural Gas Policy Institute
Sept. 9, 2015

21
0
10
20
30
40
50
60
70
80
90
0
5
10
15
20
25
30
35
2005 2013 2020 2025 2030 2035 2040
U.S. dry gas consumption
trillion cubic feet
Source: EIA, Annual Energy Outlook 2015 Reference case
ProjectionsHistory
Industrial*Electric powerResidential Transportation**
10.9
4.2
1.6
9.4
3.6
8.9
4.9
0.9
8.2
3.3
*Includes combined heat-and-power and lease and plant fuel
**Includes pipeline fuel
Natural gas consumption growth is driven by increased use in all
sectors except residential
billion cubic feet per day
Commercial
Nülle | NCSL Natural Gas Policy Institute
Sept. 9, 2015

Growth in manufacturing output and use of natural gas reflect high
natural gas supply and low prices, particularly in the near term
22
manufacturing natural gas consumption
quadrillion Btu
Source: EIA, Annual Energy Outlook 2015 Reference case
0
4
8
12
16
20
24
0
1
2
3
4
5
6
7
8
9
2010 2025 2040GlassAluminum
manufacturing
Iron and steel
Refining and
Food
Bulk chemicals
Other
Metal based
billion cubic feet per day
durables
Paper
related
Nülle | NCSL Natural Gas Policy Institute
Sept. 9, 2015

Coal regains some competitive advantage relative to natural gas
over time on a national average basis
0
2
4
6
8
1990 1995 2000 2005 2010 2015 2020 2025 2030 2035 2040
ratio of natural gas price to steam coal price
Source: EIA, Annual Energy Outlook 2015
0
2
4
6
8
10
12
1990 2000 2010 2020 2030 2040
History Projections
20122013 dollars per Btu
History Projections2012
Competitive parity
Energy prices to the electric power sector
Coal
Natural gas
Nülle | NCSL Natural Gas Policy Institute
Sept. 9, 2015 23

Natural gas is projected to grow faster than other fuels in the
AEO2015 Reference case
billion kilowatthours
Coal
Petroleum
Nuclear
Natural Gas
Renewables
0
500
1000
1500
2000
2500
1980 1990 2000 2010 2020 2030 2040
Note: Includes generation from plants in both the electric power and end-use sectors.
ProjectionsHistory 2013
24
Nülle | NCSL Natural Gas Policy Institute
Sept. 9, 2015
Source: Projections: EIA, Annual Energy Outlook 2015 ; History: EIA, Annual Energy Review;

For more information
U.S. Energy Information Administration home page | www.eia.gov
Annual Energy Outlook | www.eia.gov/forecasts/aeo
Short-Term Energy Outlook | www.eia.gov/forecasts/steo
International Energy Outlook | www.eia.gov/forecasts/ieo
Today In Energy | www.eia.gov/todayinenergy
Monthly Energy Review | www.eia.gov/totalenergy/data/monthly
State Energy Portal | www.eia.gov/state
Drilling Productivity Report | www.eia.gov/petroleum/drilling
Nülle | NCSL Natural Gas Policy Institute
Sept. 9, 2015 25

26
Supplemental Slides
Nülle | NCSL Natural Gas Policy Institute
Sept. 9, 2015

North American natural gas prices are relatively low compared to prices
in the rest of the world
Source: U.S. Energy Information Administration based on Bloomberg data
Nülle | NCSL Natural Gas Policy Institute
Sept. 9, 2015 27
0
5
10
15
20
25
2010 2011 2012 2013 2014 2015
U.S. - Henry Hub Japan - LNG Canada - AECO
France - PEG Netherlands - TTF Belgium - Zeebrugge
Germany - BEB Hub UK - NBP Brent crude oil
Global spot natural gas and crude oil prices with average monthly LNG prices in Japan
U.S. dollars per million British thermal unit

U.S. becomes a net exporter of natural gas in the near future
U.S. dry natural gas
trillion cubic feet per year
Nülle | NCSL Natural Gas Policy Institute
Sept. 9, 2015
-10
0
10
20
30
40
1990 1995 2000 2005 2010 2015 2020 2025 2030 2035 2040
ProjectionsHistory 2013
Consumption
Production
Net exports
100
75
50
25
0
-25
billion cubic feet per day
28
Source: EIA, Annual Energy Outlook 2015

U.S. natural gas imports and exports
trillion cubic feet
-8
-4
0
4
8
12
16
2000 2010 2020 2030 2040 2020 2030 2040 2020 2030 2040
LNG imports
Source: EIA, Annual Energy Outlook 2015
29
billion cubic feet per day
Projected U.S. natural gas exports reflect the spread between domestic
natural gas prices and world energy prices
ProjectionsHistory 2013
-10
0
10
20
2013 2013
30
40
-20Reference Low Oil Price
High Oil and Gas
Resource
Pipeline exports
to Mexico
Lower 48 states
LNG exports
Pipeline exports to Canada Pipeline imports from Canada
Alaska LNG exports
Nülle | NCSL Natural Gas Policy Institute
Sept. 9, 2015

0
3
6
9
12
2005 2010 2015 2020 2025 2030 2035 2040
Future domestic natural gas prices depend on both domestic
resource availability and world energy prices
30
average Henry Hub spot prices for natural gas
2013 dollars per million Btu
Source: EIA, Annual Energy Outlook 2015
History Projections2013
High Oil Price
Reference
High Oil and Gas Resource
Low Oil Price
Nülle | NCSL Natural Gas Policy Institute
Sept. 9, 2015

0
5
10
15
20
25
30
35
40
45
2008 2009 2010 2011 2012 2013
Northeast-Plus natural gas supply and demand
balance
billion cubic feet per day
Source: Pipelines posting Information collected by Bentek Energy, LLC
Nülle | NCSL Natural Gas Policy Institute
Sept. 9, 2015 31
Increased production in the Northeast-Plus resulted in reduced
net inflows to the region.
Natural gas
demand
Gross
production
Net inflows

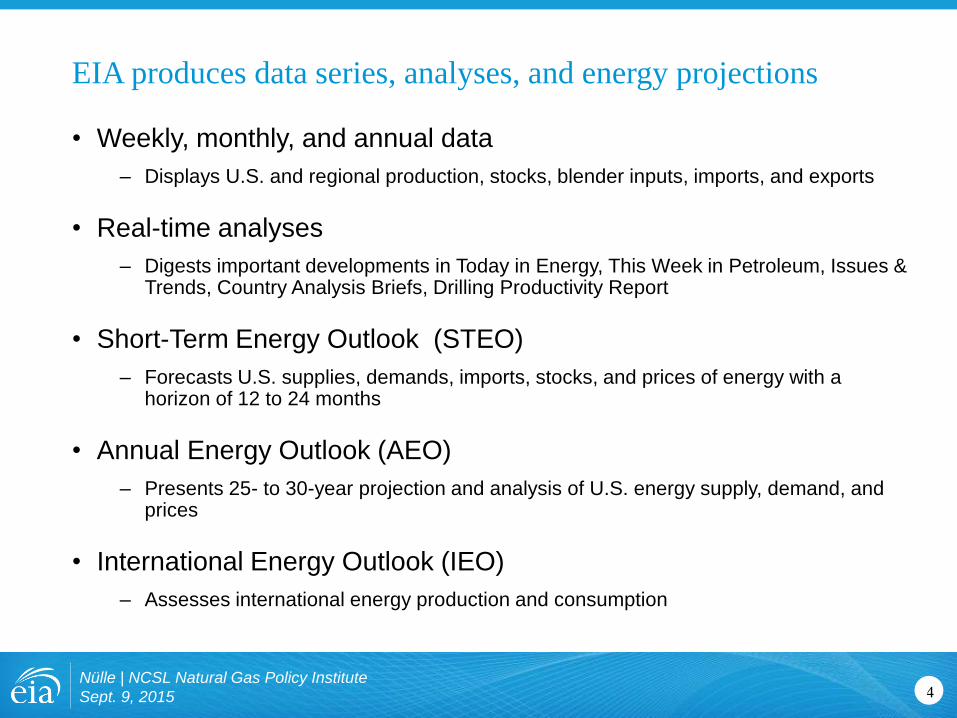
Many natural gas pipeline projects are principally developing
because of production growth in the Mid-Atlantic and Northeast
Nülle | NCSL Natural Gas Policy Institute
Sept. 9, 2015 32
Notes: Reversal projects are not on the map. ANR, Columbia Gulf Transmission, Iroquois Gas Pipeline, Rockies
Express Pipeline, Tennessee Gas Pipeline, Texas Eastern Transmission, and Transcontinental Gas Pipeline are
planning to reverse their flows
Source : EIA, Natural Gas Pipeline Projects, July 2014
0
2
4
6
8
10
12
14
16
18
2015 2016 2017 2018
Reversal New Pipeline
Lateral Expansion
Natural Pipeline Projects in the Mid-Atlantic and Northeastbillion cubic feet per day

Pipeline capacity is expanding to move more
Marcellus gas to the Northeast…
Nülle | NCSL Natural Gas Policy Institute
Sept. 9, 2015 33
Source: U.S. Energy Information Administration
Note: Map is as of October 31, 2013 and only includes projects with at least 0.1 Bcf/d of additional takeaway capacity. Dashed lines indicate
existing pipelines on which expansions are occurring. Solid lines indicate newly built pipeline connections.
…and West...
Nülle | NCSL Natural Gas Policy Institute
Sept. 9, 2015 34
Westbound flows on Rockies Express

…and South.
Nülle | NCSL Natural Gas Policy Institute
Sept. 9, 2015 35
Source: Williams Company