Embed Size (px)
Citation preview
Examining Natural Gas for the 2008-09 Winter Heating Season
Examining Natural Gas for the 2008-09 Winter Heating Season
Christopher B. McGillManaging Director Policy Analysis
October 14, 2008
Christopher B. McGillManaging Director Policy Analysis
October 14, 2008

NATURAL GAS FUTURES PRICESNATURAL GAS FUTURES PRICES
– On December 26, 2007 futures for January through April 2008 ranged from $7.05 to $7.23 per MMBtu
– Six months later June 23, 2008 settlement prices for July 2008 through March 2009 ranged from $13.20 to $14.22 per MMBtu – a 90% increase

NATURAL GAS FUTURES PRICESNATURAL GAS FUTURES PRICESWill the roller coaster ride ever end? Will the roller coaster ride ever end?
– One month later, July 21, August 2008 through March 2009 settlement prices had fallen to $10.51 to $11.60 per MMBtu
– By August 14, the September 2008 through March 2009 NYMEX settlement prices ranged from $8.46 to $9.56– a 35 % decrease from the June 23 midpoint
FACTORS INFLUENCING NATURAL GAS FACTORS INFLUENCING NATURAL GAS MARKET PRICESMARKET PRICES
– High Oil Prices
– Year over Year Storage Deficit
– Low LNG Imports
– Sector Consumption Shifts
– Uneven Energy Policy Initiatives
– Infrastructure Timing
– Supply Disruption Potential

2007-08 Winter Heating Season
Source: American Gas Association

2007-08 Winter Heating Season
Source: American Gas Association

85 % of Companies Sampled Used Financial Tools to Hedge Gas Supply During the 2007-2008 WHS Compared to
88 % One Year Ago
Source: American Gas Association

8
U.S. Natural Gas Storage
Source: Energy Information Administration, U.S. DOE.

Natural Gas Supply Sources(January 1-September 15, 2008)
Source: Bentek Energy LLC, Energy Market Fundamentals, September 15, 2008.
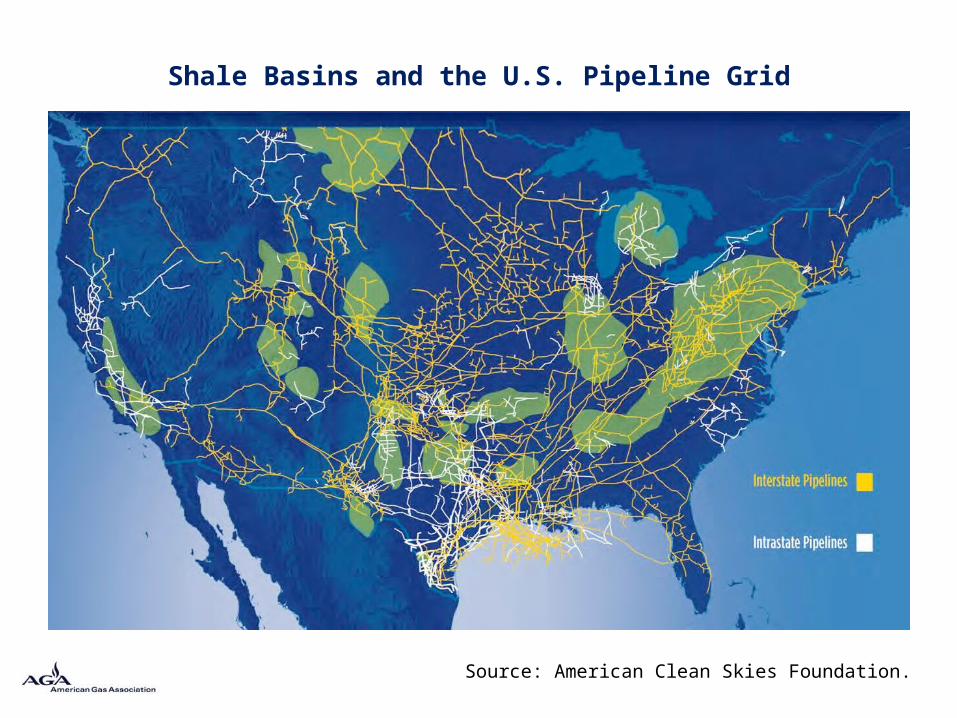
Shale Basins and the U.S. Pipeline Grid
Source: American Clean Skies Foundation.

SHALE GAS RESOURCE ESTIMATESSHALE GAS RESOURCE ESTIMATES
Potential Gas Committee added about 200 Tcf to U.S. resource assessment between 2004 and 2006 – almost all attributed to
new shale-related data
Navigant Consulting, Inc. (2008) estimates 275-842 Tcf from 17 U.S. shale plays

SHALE GAS PRODUCTION ESTIMATESSHALE GAS PRODUCTION ESTIMATES
Depending on the source, some analysts estimate that shale production now at
about 5 Bcf per day will grow to 27-35 Bcf per day by the end of the next decade
Will this be additive to current production rates or will it only replace other
declining production capability?
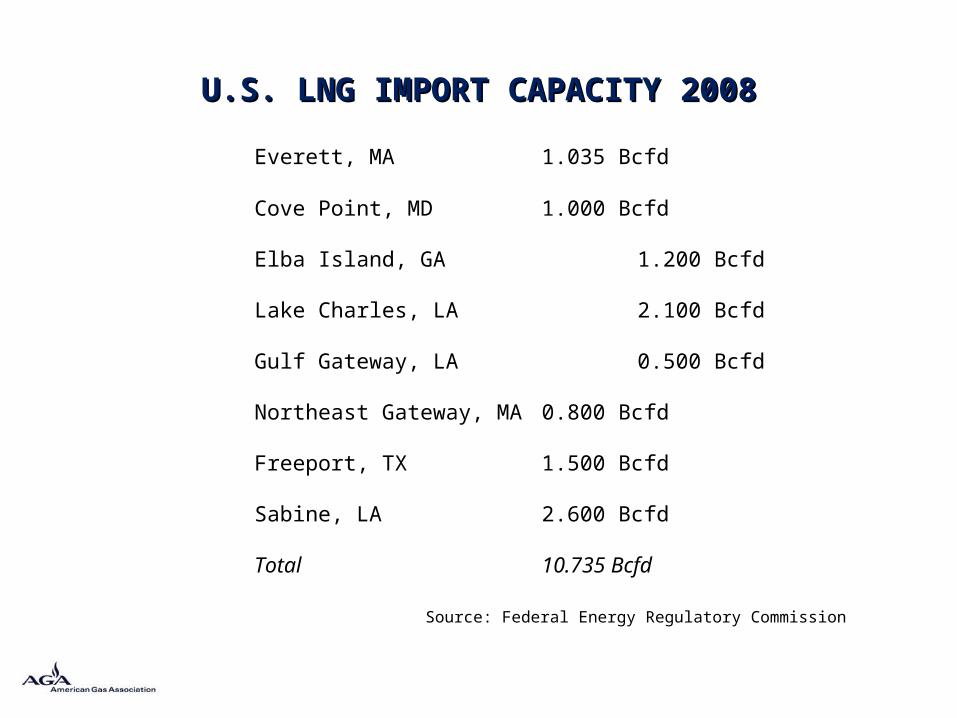
U.S. LNG IMPORT CAPACITY 2008U.S. LNG IMPORT CAPACITY 2008
Source: Federal Energy Regulatory Commission
Everett, MA 1.035 Bcfd
Cove Point, MD 1.000 Bcfd
Elba Island, GA 1.200 Bcfd
Lake Charles, LA 2.100 Bcfd
Gulf Gateway, LA 0.500 Bcfd
Northeast Gateway, MA 0.800 Bcfd
Freeport, TX 1.500 Bcfd
Sabine, LA 2.600 Bcfd
Total 10.735 Bcfd
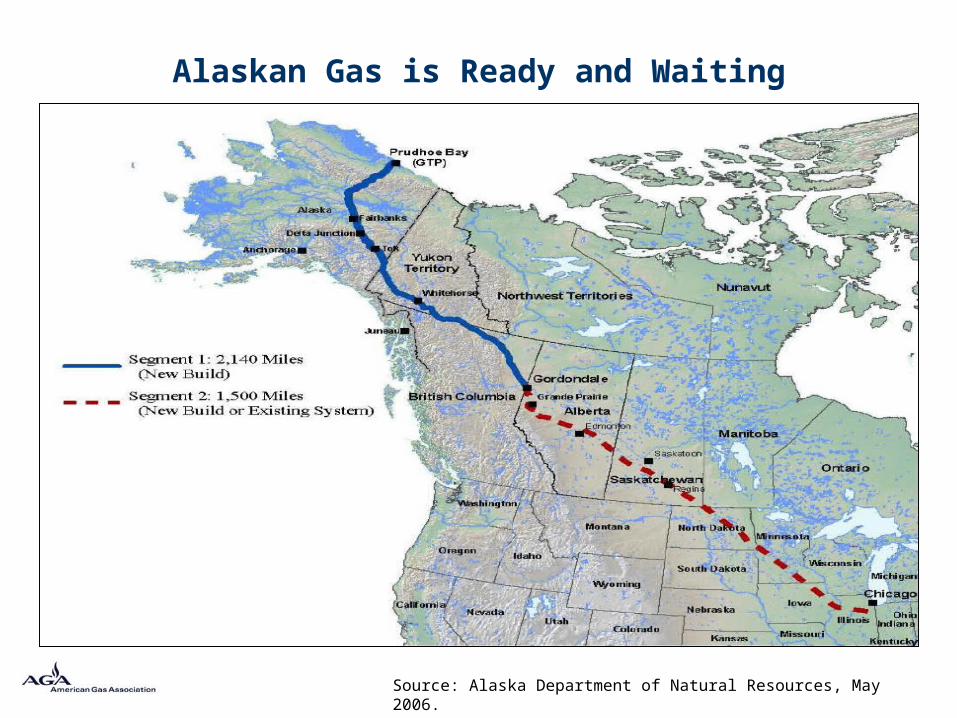
Alaskan Gas is Ready and Waiting
Reprint permitted by: BP
Source: Alaska Department of Natural Resources, May 2006.
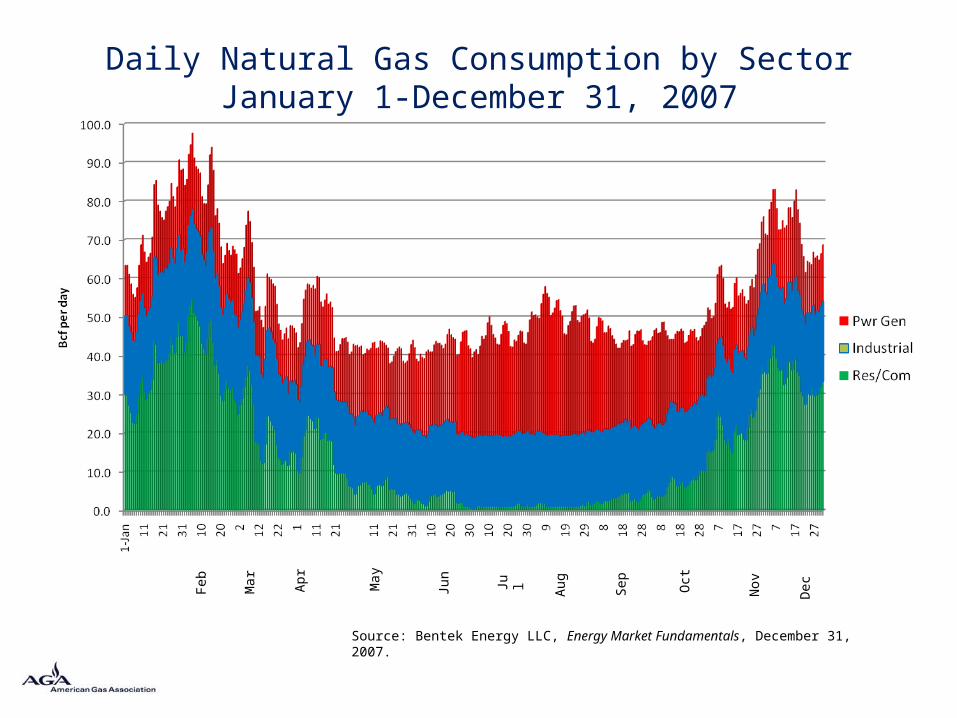
Daily Natural Gas Consumption by Sector January 1-December 31, 2007
Source: Bentek Energy LLC, Energy Market Fundamentals, December 31, 2007.
Feb
Mar
Apr
May
Jun
Jul
Aug
Sep Oct
Nov
Dec

Power GenerationAverage Daily Natural Gas Consumption
January 1-December 31, 2007
Source: Bentek Energy LLC, Energy Market Fundamentals, December 31, 2007.
Dec
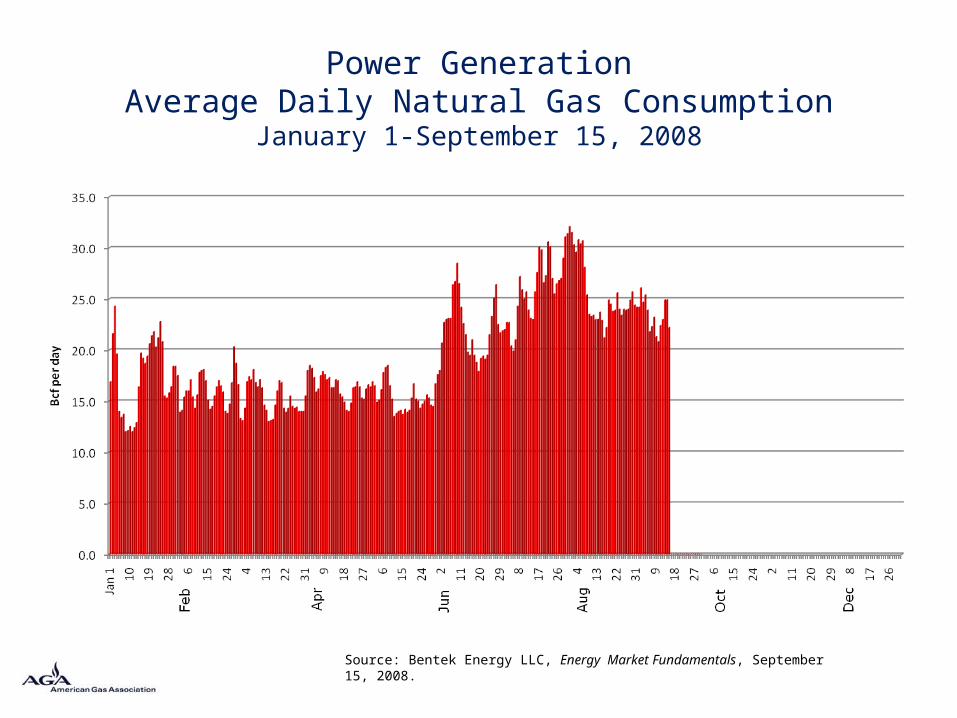
Power GenerationAverage Daily Natural Gas Consumption
January 1-September 15, 2008
Source: Bentek Energy LLC, Energy Market Fundamentals, September 15, 2008.

FACTORS INFLUENCING NATURAL GAS DURING FACTORS INFLUENCING NATURAL GAS DURING THE 2008-09 WINTERTHE 2008-09 WINTER
– Relative Movement of Oil Prices
– Storage Inventories
– Attracting Supplies of Gas other Than Domestic Production if Necessary
– Recovery from Supply Disruptions
– Weather-Based Demand

Thank You!Thank You!
Christopher B. McGillManaging Director Policy Analysis
www.aga.org
Christopher B. McGillManaging Director Policy Analysis
www.aga.org


![IIIIIIIIIIIIIIIIIIIIIIIIIUS 2018 / 0157243 A1 Jun . 7 , 2018 ( 0028 ] Optionally , the field function is equation ( 3 ) , defined below . 100291 Optionally , the method further includes](https://img.pdfslide.net/doc/110x75/5ea2774c3798d25b41046eed/iiiiiiiiiiiiiiiiiiiiiiiii-us-2018-0157243-a1-jun-7-2018-0028-optionally.jpg)