Embed Size (px)
DESCRIPTION
USD 383 Enrollment Projection
Citation preview
Manhattan-Ogden USD 383 K-12 Enrollment Projection Report
Jim Hays, KASB Research Specialist
November 12, 2010
2
K – 12 Enrollment Projection Manhattan-Ogden USD 383
November 12, 2010 Jim Hays, KASB Research Specialist
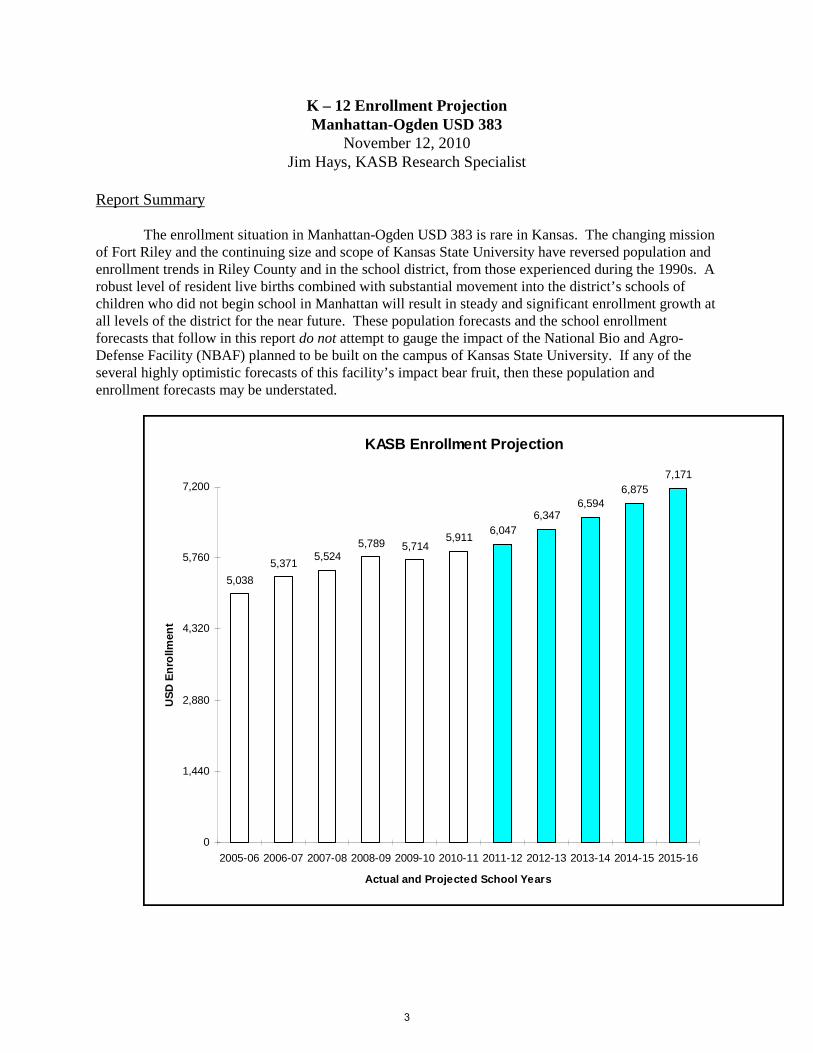
Report Summary The enrollment situation in Manhattan-Ogden USD 383 is rare in Kansas. The changing mission of Fort Riley and the continuing size and scope of Kansas State University have reversed population and enrollment trends in Riley County and in the school district, from those experienced during the 1990s. A robust level of resident live births combined with substantial movement into the district’s schools of children who did not begin school in Manhattan will result in steady and significant enrollment growth at all levels of the district for the near future. These population forecasts and the school enrollment forecasts that follow in this report do not attempt to gauge the impact of the National Bio and Agro-Defense Facility (NBAF) planned to be built on the campus of Kansas State University. If any of the several highly optimistic forecasts of this facility’s impact bear fruit, then these population and enrollment forecasts may be understated.
KASB Enrollment Projection
5,038
5,3715,524
5,789 5,7145,911
6,047
6,5946,875
7,171
6,347
0
1,440
2,880
4,320
5,760
7,200
2005-06 2006-07 2007-08 2008-09 2009-10 2010-11 2011-12 2012-13 2013-14 2014-15 2015-16
Actual and Projected School Years
US
D E
nro
llmen
t
3
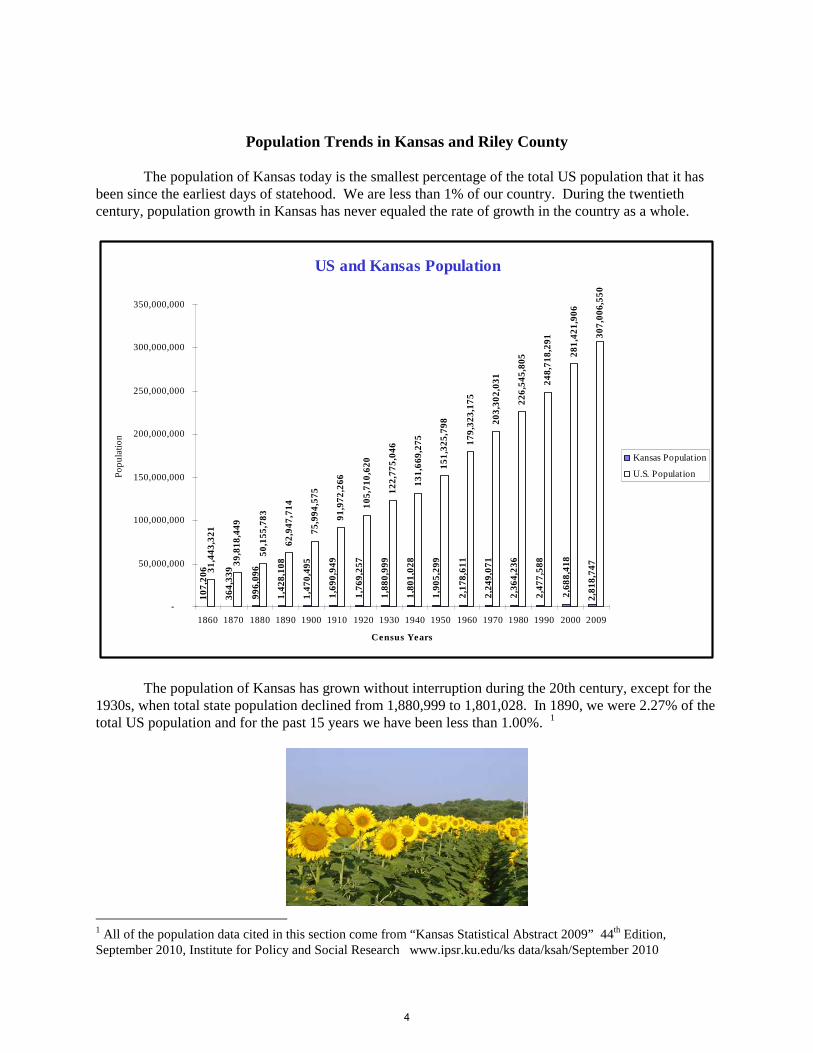
Population Trends in Kansas and Riley County The population of Kansas today is the smallest percentage of the total US population that it has been since the earliest days of statehood. We are less than 1% of our country. During the twentieth century, population growth in Kansas has never equaled the rate of growth in the country as a whole.
US and Kansas Population
10
7,2
06
36
4,3
39
99
6,0
96
1,4
28
,10
8
1,4
70
,49
5
1,6
90
,94
9
1,7
69
,25
7
1,8
80
,99
9
1,8
01
,02
8
1,9
05
,29
9
2,1
78
,61
1
2,2
49
,07
1
2,3
64
,23
6
2,4
77
,58
8
2,6
88
,41
8
2,8
18
,74
7
31
,44
3,3
21
39
,81
8,4
49
50
,15
5,7
83
62
,94
7,7
14
75
,99
4,5
75
91
,97
2,2
66
10
5,7
10
,62
0
12
2,7
75
,04
6
13
1,6
69
,27
5
15
1,3
25
,79
8
17
9,3
23
,17
5
20
3,3
02
,03
1
22
6,5
45
,80
5
24
8,7
18
,29
1
28
1,4
21
,90
6
30
7,0
06
,55
0-
50,000,000
100,000,000
150,000,000
200,000,000
250,000,000
300,000,000
350,000,000
1860 1870 1880 1890 1900 1910 1920 1930 1940 1950 1960 1970 1980 1990 2000 2009
Census Years
Po
pu
latio
n
Kansas Population
U.S. Population
The population of Kansas has grown without interruption during the 20th century, except for the 1930s, when total state population declined from 1,880,999 to 1,801,028. In 1890, we were 2.27% of the total US population and for the past 15 years we have been less than 1.00%. 1
1 All of the population data cited in this section come from “Kansas Statistical Abstract 2009” 44th Edition, September 2010, Institute for Policy and Social Research www.ipsr.ku.edu/ks data/ksah/September 2010
4
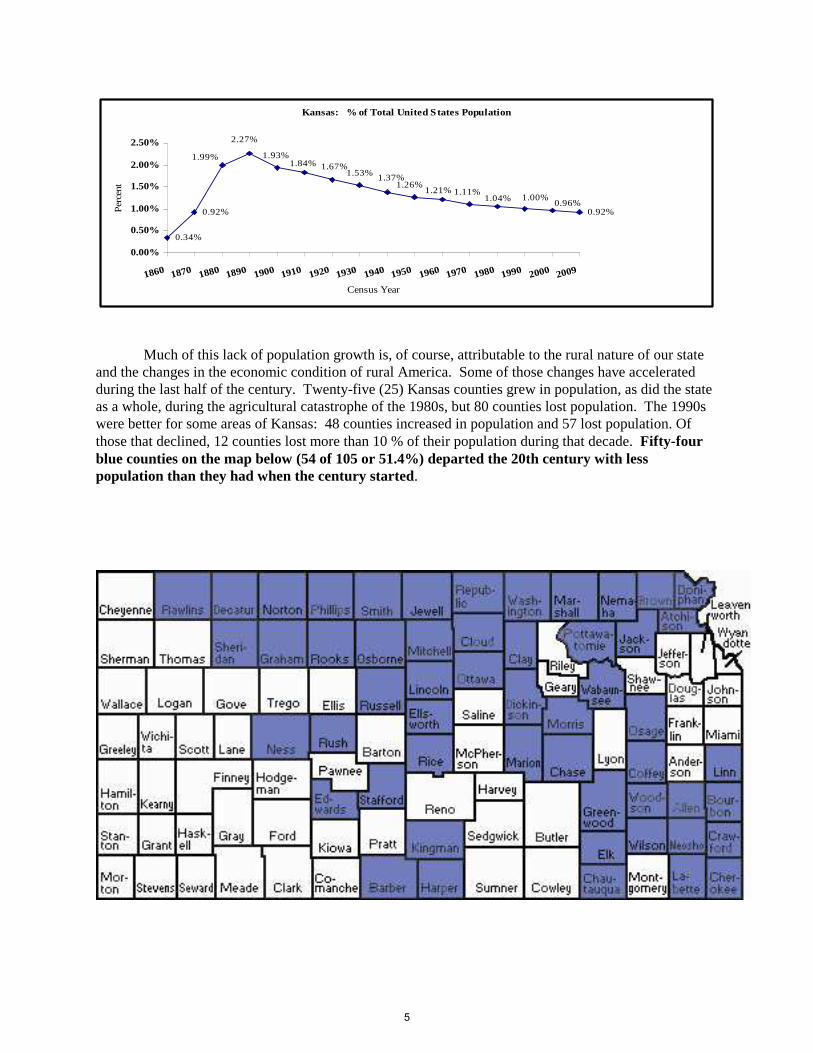
Kansas: % of Total United States Population
0.34%
0.92% 0.92%0.96%
1.53%1.67%1.84%
1.93%
2.27%
1.99%
1.00%
1.37%1.26%
1.21%1.11%1.04%
0.00%
0.50%
1.00%
1.50%
2.00%
2.50%
1860 1870 1880 1890 1900 1910 1920 1930 1940 1950 1960 1970 1980 1990 2000 2009
Census Year
Per
cent
Much of this lack of population growth is, of course, attributable to the rural nature of our state and the changes in the economic condition of rural America. Some of those changes have accelerated during the last half of the century. Twenty-five (25) Kansas counties grew in population, as did the state as a whole, during the agricultural catastrophe of the 1980s, but 80 counties lost population. The 1990s were better for some areas of Kansas: 48 counties increased in population and 57 lost population. Of those that declined, 12 counties lost more than 10 % of their population during that decade. Fifty-four blue counties on the map below (54 of 105 or 51.4%) departed the 20th century with less population than they had when the century started.
5
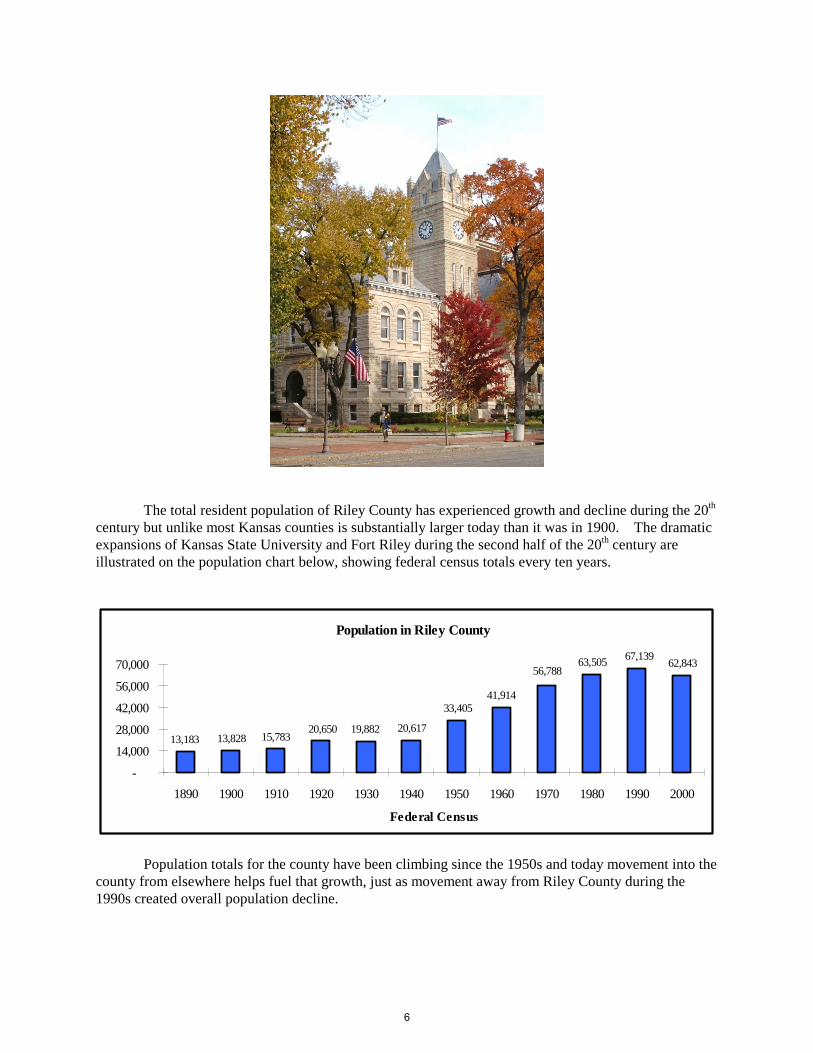
The total resident population of Riley County has experienced growth and decline during the 20th century but unlike most Kansas counties is substantially larger today than it was in 1900. The dramatic expansions of Kansas State University and Fort Riley during the second half of the 20th century are illustrated on the population chart below, showing federal census totals every ten years.
Population in Riley County
62,84367,13963,505
56,788
41,91433,405
20,61719,88220,65015,78313,82813,183
-
14,000
28,000
42,000
56,000
70,000
1890 1900 1910 1920 1930 1940 1950 1960 1970 1980 1990 2000
Federal Census
Population totals for the county have been climbing since the 1950s and today movement into the county from elsewhere helps fuel that growth, just as movement away from Riley County during the 1990s created overall population decline.
6
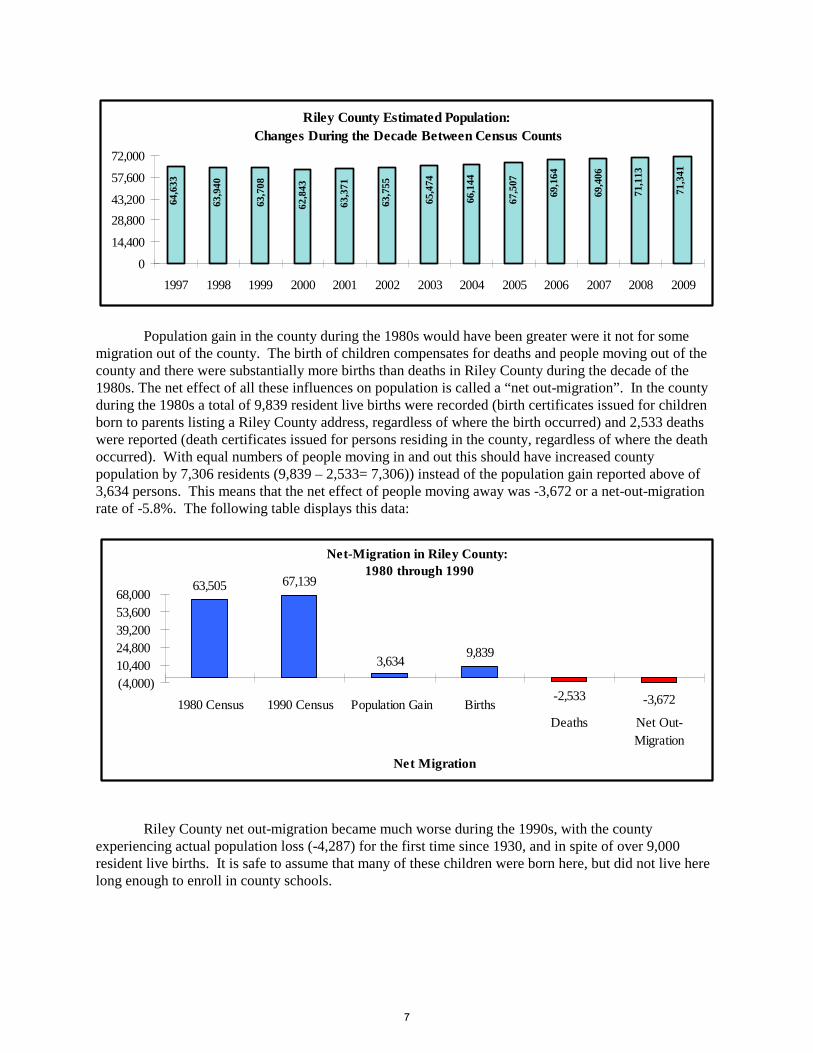
Riley County Estimated Population: Changes During the Decade Between Census Counts
64,6
33
63,9
40
63,7
08
62,8
43
63,3
71
63,7
55
65,4
74
66,1
44
67,5
07
69,1
64
69,4
06
71,1
13
71,3
41
0
14,400
28,800
43,200
57,600
72,000
1997 1998 1999 2000 2001 2002 2003 2004 2005 2006 2007 2008 2009
Population gain in the county during the 1980s would have been greater were it not for some migration out of the county. The birth of children compensates for deaths and people moving out of the county and there were substantially more births than deaths in Riley County during the decade of the 1980s. The net effect of all these influences on population is called a “net out-migration”. In the county during the 1980s a total of 9,839 resident live births were recorded (birth certificates issued for children born to parents listing a Riley County address, regardless of where the birth occurred) and 2,533 deaths were reported (death certificates issued for persons residing in the county, regardless of where the death occurred). With equal numbers of people moving in and out this should have increased county population by 7,306 residents (9,839 – 2,533= 7,306)) instead of the population gain reported above of 3,634 persons. This means that the net effect of people moving away was -3,672 or a net-out-migration rate of -5.8%. The following table displays this data:
Net-Migration in Riley County: 1980 through 1990
63,505 67,139
9,839
-2,533 -3,672
3,634
(4,000)10,40024,80039,20053,60068,000
1980 Census 1990 Census Population Gain Births Deaths
Net Out-Migration
Net Migration
Riley County net out-migration became much worse during the 1990s, with the county experiencing actual population loss (-4,287) for the first time since 1930, and in spite of over 9,000 resident live births. It is safe to assume that many of these children were born here, but did not live here long enough to enroll in county schools.
7
Net-Migration in Riley County:1990 through 2000
67,13962,852
9,231
-2,772-4,287 -10,746
-15,000
2,000
19,000
36,000
53,000
70,000
1990 Census 2000 Census Population Loss
Births Deaths
Net Out-Migration
Net Migration
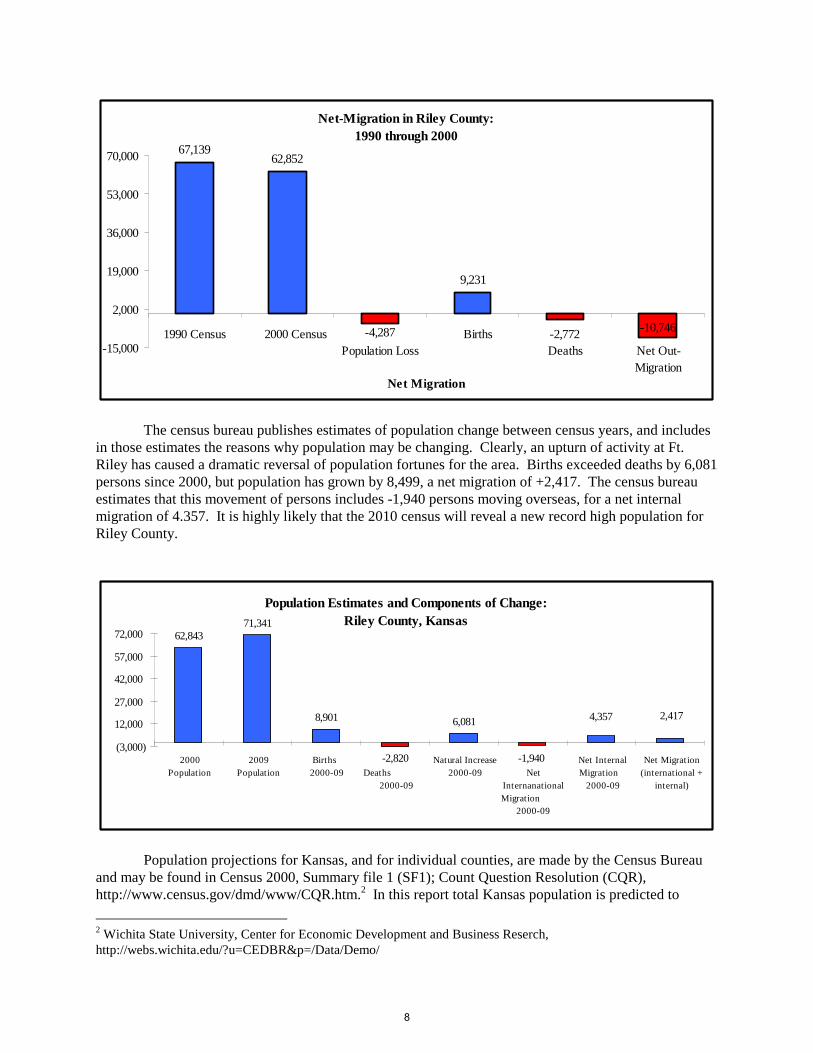
The census bureau publishes estimates of population change between census years, and includes in those estimates the reasons why population may be changing. Clearly, an upturn of activity at Ft. Riley has caused a dramatic reversal of population fortunes for the area. Births exceeded deaths by 6,081 persons since 2000, but population has grown by 8,499, a net migration of +2,417. The census bureau estimates that this movement of persons includes -1,940 persons moving overseas, for a net internal migration of 4.357. It is highly likely that the 2010 census will reveal a new record high population for Riley County.
Population Estimates and Components of Change:Riley County, Kansas
62,84371,341
8,901
-2,820
6,081
-1,940
2,4174,357
(3,000)
12,000
27,000
42,000
57,000
72,000
2000Population
2009Population
Births 2000-09
Deaths
2000-09
Natural Increase2000-09
Net
InternanationalMigration
2000-09
Net InternalMigration
2000-09
Net Migration(international +
internal)
Population projections for Kansas, and for individual counties, are made by the Census Bureau and may be found in Census 2000, Summary file 1 (SF1); Count Question Resolution (CQR), http://www.census.gov/dmd/www/CQR.htm.2 In this report total Kansas population is predicted to
2 Wichita State University, Center for Economic Development and Business Reserch, http://webs.wichita.edu/?u=CEDBR&p=/Data/Demo/
8
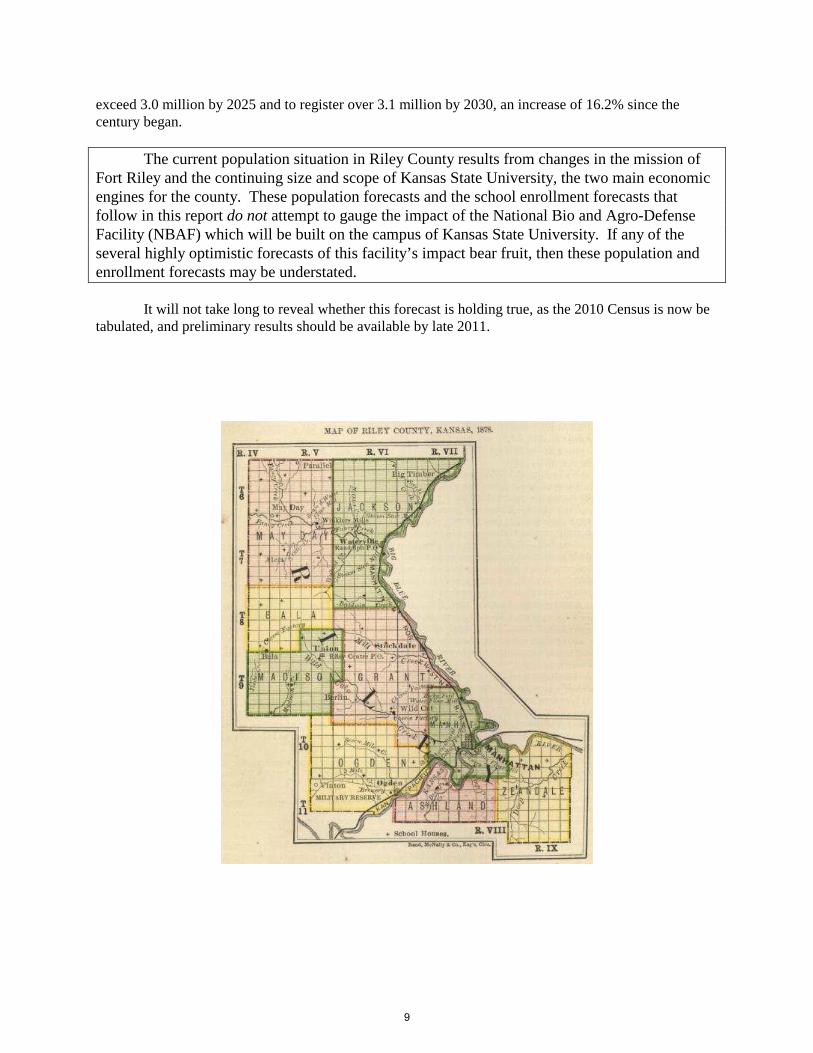
exceed 3.0 million by 2025 and to register over 3.1 million by 2030, an increase of 16.2% since the century began. The current population situation in Riley County results from changes in the mission of Fort Riley and the continuing size and scope of Kansas State University, the two main economic engines for the county. These population forecasts and the school enrollment forecasts that follow in this report do not attempt to gauge the impact of the National Bio and Agro-Defense Facility (NBAF) which will be built on the campus of Kansas State University. If any of the several highly optimistic forecasts of this facility’s impact bear fruit, then these population and enrollment forecasts may be understated. It will not take long to reveal whether this forecast is holding true, as the 2010 Census is now be tabulated, and preliminary results should be available by late 2011.
9
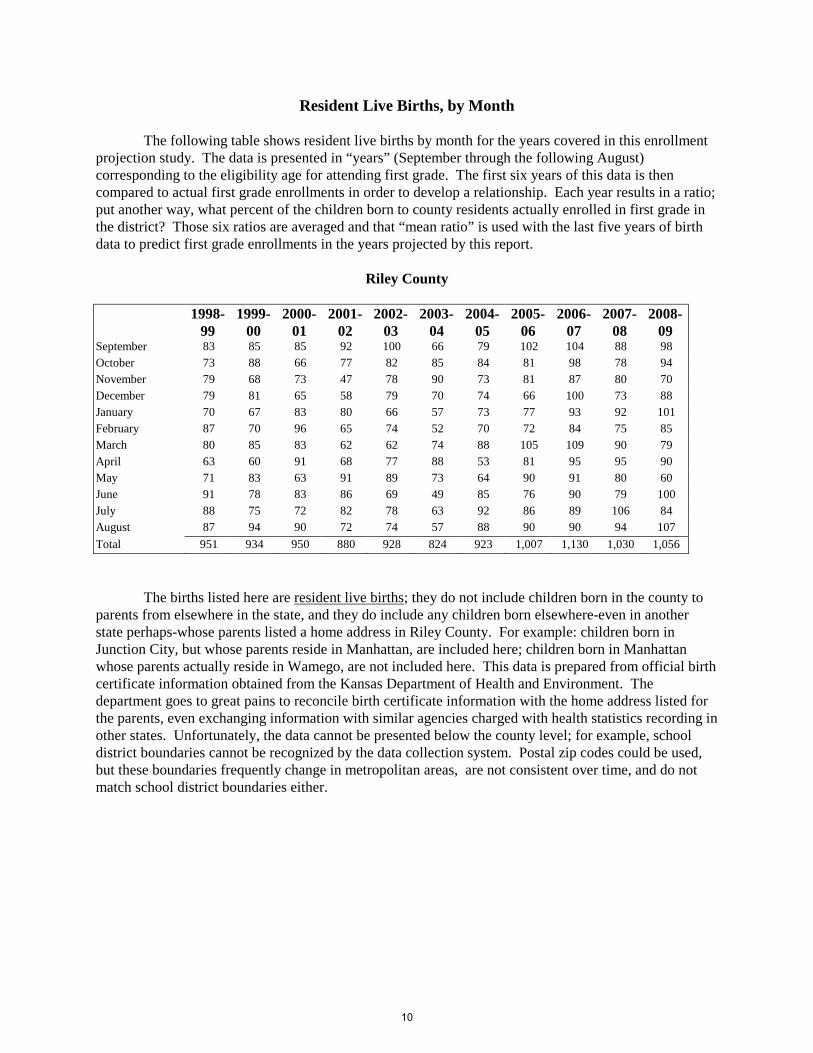
Resident Live Births, by Month The following table shows resident live births by month for the years covered in this enrollment projection study. The data is presented in “years” (September through the following August) corresponding to the eligibility age for attending first grade. The first six years of this data is then compared to actual first grade enrollments in order to develop a relationship. Each year results in a ratio; put another way, what percent of the children born to county residents actually enrolled in first grade in the district? Those six ratios are averaged and that “mean ratio” is used with the last five years of birth data to predict first grade enrollments in the years projected by this report.
Riley County
1998-
99 1999-
00 2000-
01 2001-
02 2002-
03 2003-
04 2004-
05 2005-
06 2006-
07 2007-
08 2008-
09 September 83 85 85 92 100 66 79 102 104 88 98 October 73 88 66 77 82 85 84 81 98 78 94 November 79 68 73 47 78 90 73 81 87 80 70 December 79 81 65 58 79 70 74 66 100 73 88 January 70 67 83 80 66 57 73 77 93 92 101 February 87 70 96 65 74 52 70 72 84 75 85 March 80 85 83 62 62 74 88 105 109 90 79 April 63 60 91 68 77 88 53 81 95 95 90 May 71 83 63 91 89 73 64 90 91 80 60 June 91 78 83 86 69 49 85 76 90 79 100 July 88 75 72 82 78 63 92 86 89 106 84 August 87 94 90 72 74 57 88 90 90 94 107
Total 951 934 950 880 928 824 923 1,007 1,130 1,030 1,056
The births listed here are resident live births; they do not include children born in the county to parents from elsewhere in the state, and they do include any children born elsewhere-even in another state perhaps-whose parents listed a home address in Riley County. For example: children born in Junction City, but whose parents reside in Manhattan, are included here; children born in Manhattan whose parents actually reside in Wamego, are not included here. This data is prepared from official birth certificate information obtained from the Kansas Department of Health and Environment. The department goes to great pains to reconcile birth certificate information with the home address listed for the parents, even exchanging information with similar agencies charged with health statistics recording in other states. Unfortunately, the data cannot be presented below the county level; for example, school district boundaries cannot be recognized by the data collection system. Postal zip codes could be used, but these boundaries frequently change in metropolitan areas, are not consistent over time, and do not match school district boundaries either.
10
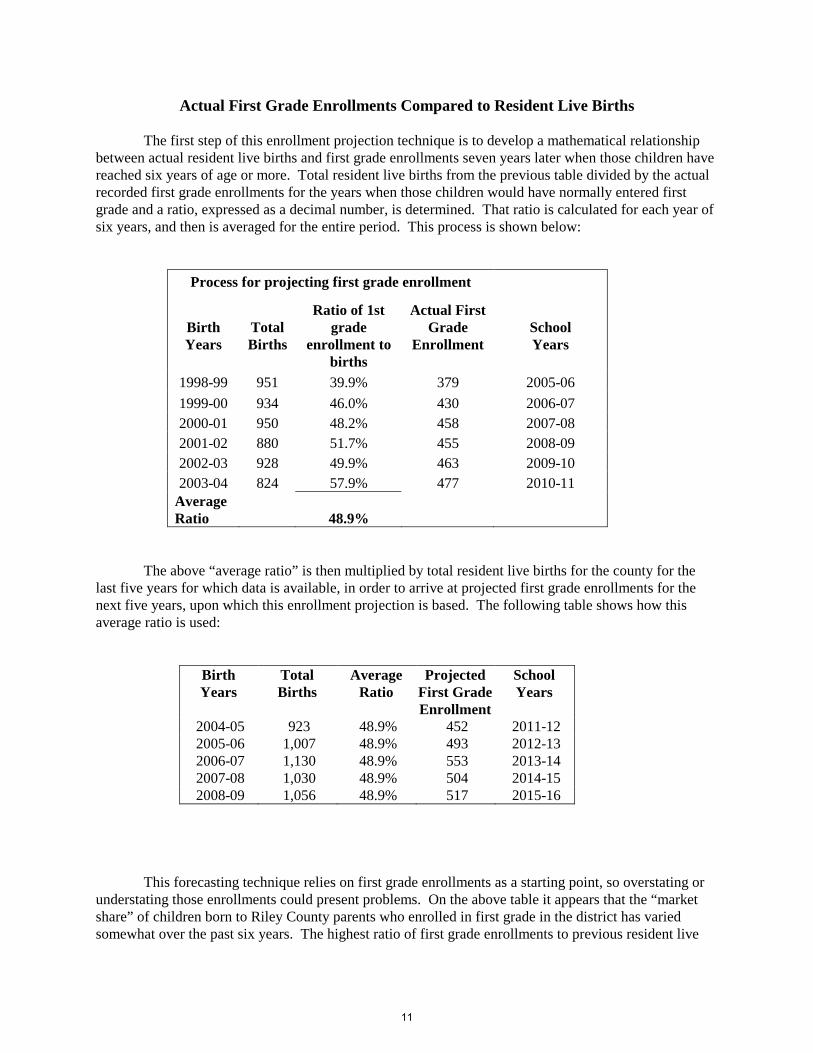
Actual First Grade Enrollments Compared to Resident Live Births The first step of this enrollment projection technique is to develop a mathematical relationship between actual resident live births and first grade enrollments seven years later when those children have reached six years of age or more. Total resident live births from the previous table divided by the actual recorded first grade enrollments for the years when those children would have normally entered first grade and a ratio, expressed as a decimal number, is determined. That ratio is calculated for each year of six years, and then is averaged for the entire period. This process is shown below:
Process for projecting first grade enrollment
Birth Years
Total Births
Ratio of 1st grade
enrollment to births
Actual First Grade
Enrollment
School Years
1998-99 951 39.9% 379 2005-06
1999-00 934 46.0% 430 2006-07 2000-01 950 48.2% 458 2007-08 2001-02 880 51.7% 455 2008-09 2002-03 928 49.9% 463 2009-10 2003-04 824 57.9% 477 2010-11
Average Ratio 48.9%
The above “average ratio” is then multiplied by total resident live births for the county for the last five years for which data is available, in order to arrive at projected first grade enrollments for the next five years, upon which this enrollment projection is based. The following table shows how this average ratio is used:
Birth Years
Total Births
Average Ratio
Projected First Grade Enrollment
School Years
2004-05 923 48.9% 452 2011-12 2005-06 1,007 48.9% 493 2012-13 2006-07 1,130 48.9% 553 2013-14 2007-08 1,030 48.9% 504 2014-15 2008-09 1,056 48.9% 517 2015-16
This forecasting technique relies on first grade enrollments as a starting point, so overstating or understating those enrollments could present problems. On the above table it appears that the “market share” of children born to Riley County parents who enrolled in first grade in the district has varied somewhat over the past six years. The highest ratio of first grade enrollments to previous resident live
11
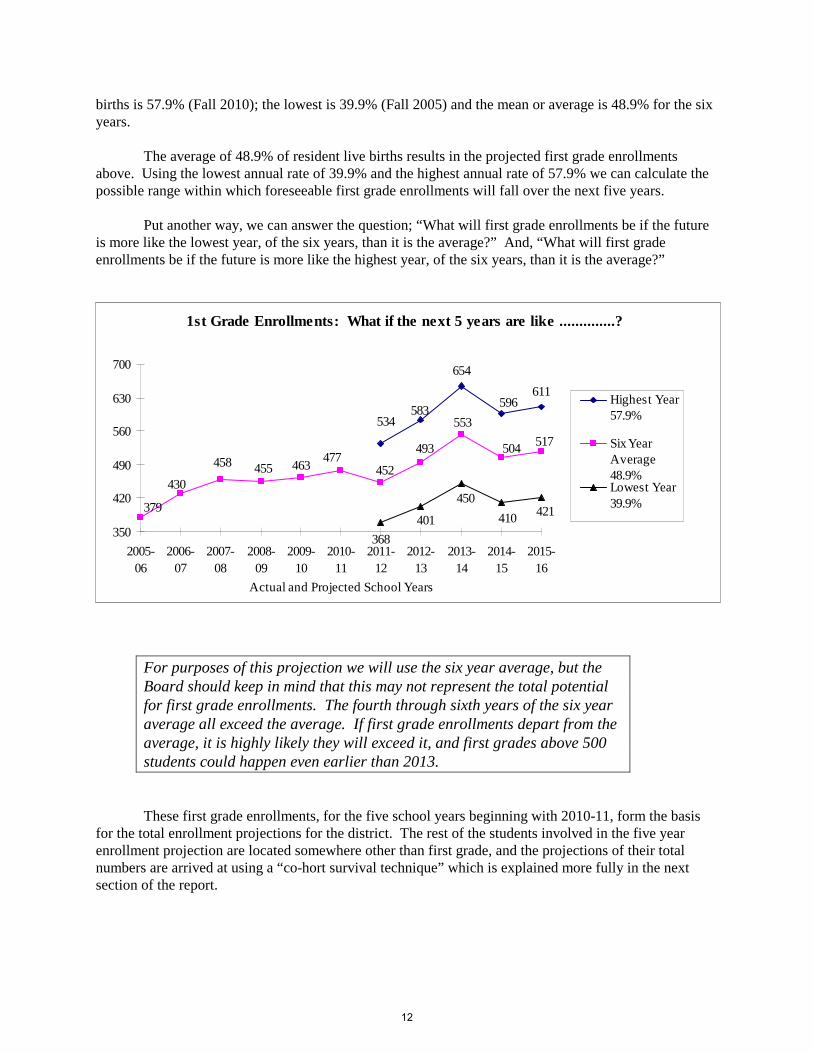
births is 57.9% (Fall 2010); the lowest is 39.9% (Fall 2005) and the mean or average is 48.9% for the six years. The average of 48.9% of resident live births results in the projected first grade enrollments above. Using the lowest annual rate of 39.9% and the highest annual rate of 57.9% we can calculate the possible range within which foreseeable first grade enrollments will fall over the next five years. Put another way, we can answer the question; “What will first grade enrollments be if the future is more like the lowest year, of the six years, than it is the average?” And, “What will first grade enrollments be if the future is more like the highest year, of the six years, than it is the average?”
1st Grade Enrollments: What if the next 5 years are like ..............?
611596
654
583534
477463455458
430
379
493
452
553
504 517
421410
450
401
368350
420
490
560
630
700
2005-06
2006-07
2007-08
2008-09
2009-10
2010-11
2011-12
2012-13
2013-14
2014-15
2015-16
Actual and Projected School Years
Highest Year57.9%
Six YearAverage48.9% Lowest Year39.9%
For purposes of this projection we will use the six year average, but the Board should keep in mind that this may not represent the total potential for first grade enrollments. The fourth through sixth years of the six year average all exceed the average. If first grade enrollments depart from the average, it is highly likely they will exceed it, and first grades above 500 students could happen even earlier than 2013.
These first grade enrollments, for the five school years beginning with 2010-11, form the basis for the total enrollment projections for the district. The rest of the students involved in the five year enrollment projection are located somewhere other than first grade, and the projections of their total numbers are arrived at using a “co-hort survival technique” which is explained more fully in the next section of the report.
12
Co-hort Survival Ratios; Calculations of Grade-to-Grade Retention
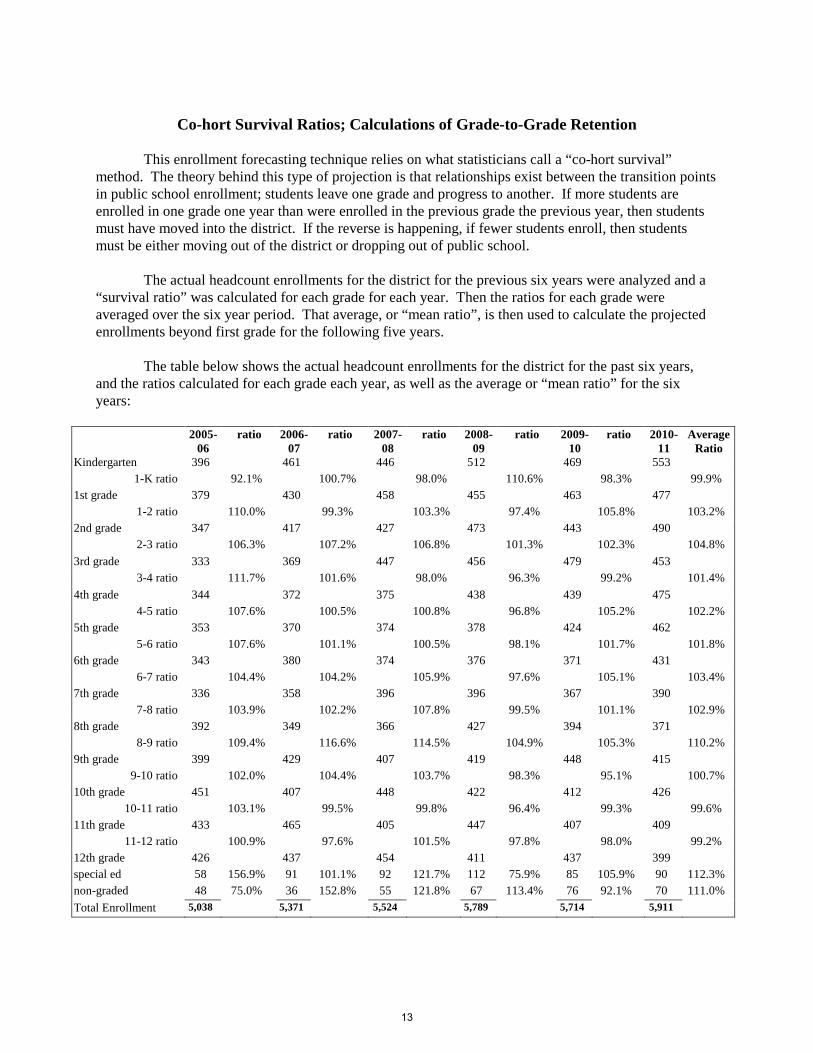
This enrollment forecasting technique relies on what statisticians call a “co-hort survival” method. The theory behind this type of projection is that relationships exist between the transition points in public school enrollment; students leave one grade and progress to another. If more students are enrolled in one grade one year than were enrolled in the previous grade the previous year, then students must have moved into the district. If the reverse is happening, if fewer students enroll, then students must be either moving out of the district or dropping out of public school. The actual headcount enrollments for the district for the previous six years were analyzed and a “survival ratio” was calculated for each grade for each year. Then the ratios for each grade were averaged over the six year period. That average, or “mean ratio”, is then used to calculate the projected enrollments beyond first grade for the following five years. The table below shows the actual headcount enrollments for the district for the past six years, and the ratios calculated for each grade each year, as well as the average or “mean ratio” for the six years:
2005-06
ratio 2006-07
ratio 2007-08
ratio 2008-09
ratio 2009-10
ratio 2010-11
Average Ratio
Kindergarten 396 461 446 512 469 553 1-K ratio 92.1% 100.7% 98.0% 110.6% 98.3% 99.9%
1st grade 379 430 458 455 463 477 1-2 ratio 110.0% 99.3% 103.3% 97.4% 105.8% 103.2%
2nd grade 347 417 427 473 443 490 2-3 ratio 106.3% 107.2% 106.8% 101.3% 102.3% 104.8%
3rd grade 333 369 447 456 479 453 3-4 ratio 111.7% 101.6% 98.0% 96.3% 99.2% 101.4%
4th grade 344 372 375 438 439 475 4-5 ratio 107.6% 100.5% 100.8% 96.8% 105.2% 102.2%
5th grade 353 370 374 378 424 462 5-6 ratio 107.6% 101.1% 100.5% 98.1% 101.7% 101.8%
6th grade 343 380 374 376 371 431 6-7 ratio 104.4% 104.2% 105.9% 97.6% 105.1% 103.4%
7th grade 336 358 396 396 367 390 7-8 ratio 103.9% 102.2% 107.8% 99.5% 101.1% 102.9%
8th grade 392 349 366 427 394 371 8-9 ratio 109.4% 116.6% 114.5% 104.9% 105.3% 110.2%
9th grade 399 429 407 419 448 415 9-10 ratio 102.0% 104.4% 103.7% 98.3% 95.1% 100.7%
10th grade 451 407 448 422 412 426 10-11 ratio 103.1% 99.5% 99.8% 96.4% 99.3% 99.6%
11th grade 433 465 405 447 407 409 11-12 ratio 100.9% 97.6% 101.5% 97.8% 98.0% 99.2%
12th grade 426 437 454 411 437 399 special ed 58 156.9% 91 101.1% 92 121.7% 112 75.9% 85 105.9% 90 112.3% non-graded 48 75.0% 36 152.8% 55 121.8% 67 113.4% 76 92.1% 70 111.0%
Total Enrollment 5,038 5,371 5,524 5,789 5,714 5,911
13
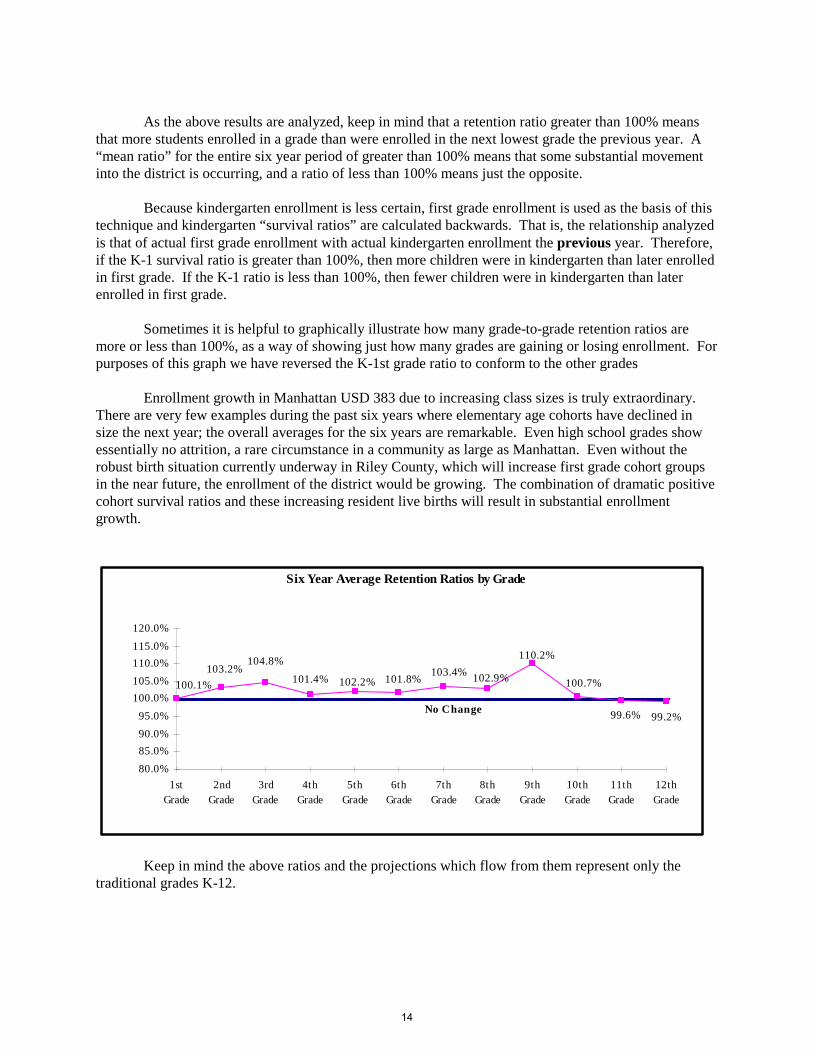
As the above results are analyzed, keep in mind that a retention ratio greater than 100% means that more students enrolled in a grade than were enrolled in the next lowest grade the previous year. A “mean ratio” for the entire six year period of greater than 100% means that some substantial movement into the district is occurring, and a ratio of less than 100% means just the opposite. Because kindergarten enrollment is less certain, first grade enrollment is used as the basis of this technique and kindergarten “survival ratios” are calculated backwards. That is, the relationship analyzed is that of actual first grade enrollment with actual kindergarten enrollment the previous year. Therefore, if the K-1 survival ratio is greater than 100%, then more children were in kindergarten than later enrolled in first grade. If the K-1 ratio is less than 100%, then fewer children were in kindergarten than later enrolled in first grade. Sometimes it is helpful to graphically illustrate how many grade-to-grade retention ratios are more or less than 100%, as a way of showing just how many grades are gaining or losing enrollment. For purposes of this graph we have reversed the K-1st grade ratio to conform to the other grades Enrollment growth in Manhattan USD 383 due to increasing class sizes is truly extraordinary. There are very few examples during the past six years where elementary age cohorts have declined in size the next year; the overall averages for the six years are remarkable. Even high school grades show essentially no attrition, a rare circumstance in a community as large as Manhattan. Even without the robust birth situation currently underway in Riley County, which will increase first grade cohort groups in the near future, the enrollment of the district would be growing. The combination of dramatic positive cohort survival ratios and these increasing resident live births will result in substantial enrollment growth.
Six Year Average Retention Ratios by Grade
No Change99.2%99.6%
100.7%
110.2%
102.9%103.4%101.8%102.2%101.4%
104.8%103.2%
100.1%
80.0%
85.0%
90.0%
95.0%
100.0%
105.0%
110.0%
115.0%
120.0%
1stGrade
2ndGrade
3rdGrade
4thGrade
5thGrade
6thGrade
7thGrade
8thGrade
9thGrade
10thGrade
11thGrade
12thGrade
Keep in mind the above ratios and the projections which flow from them represent only the traditional grades K-12.
14
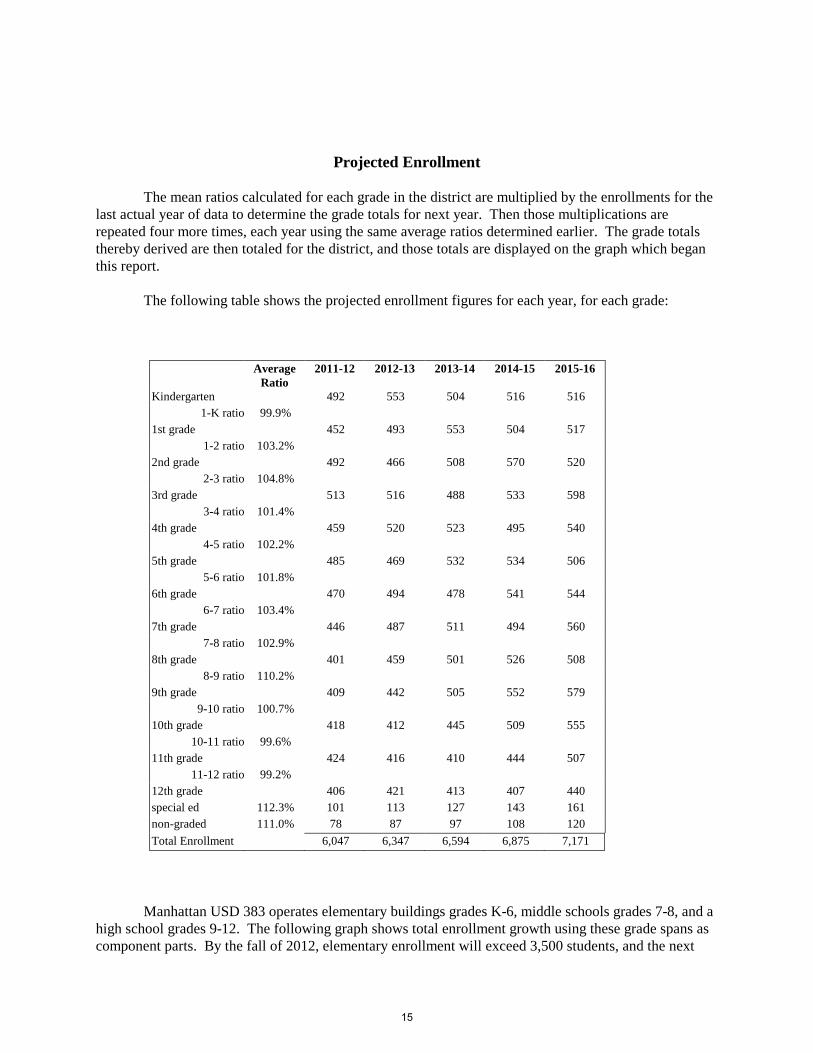
Projected Enrollment The mean ratios calculated for each grade in the district are multiplied by the enrollments for the last actual year of data to determine the grade totals for next year. Then those multiplications are repeated four more times, each year using the same average ratios determined earlier. The grade totals thereby derived are then totaled for the district, and those totals are displayed on the graph which began this report. The following table shows the projected enrollment figures for each year, for each grade:
Average Ratio
2011-12 2012-13 2013-14 2014-15 2015-16
Kindergarten 492 553 504 516 516 1-K ratio 99.9%
1st grade 452 493 553 504 517 1-2 ratio 103.2%
2nd grade 492 466 508 570 520 2-3 ratio 104.8%
3rd grade 513 516 488 533 598 3-4 ratio 101.4%
4th grade 459 520 523 495 540 4-5 ratio 102.2%
5th grade 485 469 532 534 506 5-6 ratio 101.8%
6th grade 470 494 478 541 544 6-7 ratio 103.4%
7th grade 446 487 511 494 560 7-8 ratio 102.9%
8th grade 401 459 501 526 508 8-9 ratio 110.2%
9th grade 409 442 505 552 579 9-10 ratio 100.7%
10th grade 418 412 445 509 555 10-11 ratio 99.6%
11th grade 424 416 410 444 507 11-12 ratio 99.2%
12th grade 406 421 413 407 440 special ed 112.3% 101 113 127 143 161 non-graded 111.0% 78 87 97 108 120
Total Enrollment 6,047 6,347 6,594 6,875 7,171
Manhattan USD 383 operates elementary buildings grades K-6, middle schools grades 7-8, and a high school grades 9-12. The following graph shows total enrollment growth using these grade spans as component parts. By the fall of 2012, elementary enrollment will exceed 3,500 students, and the next
15
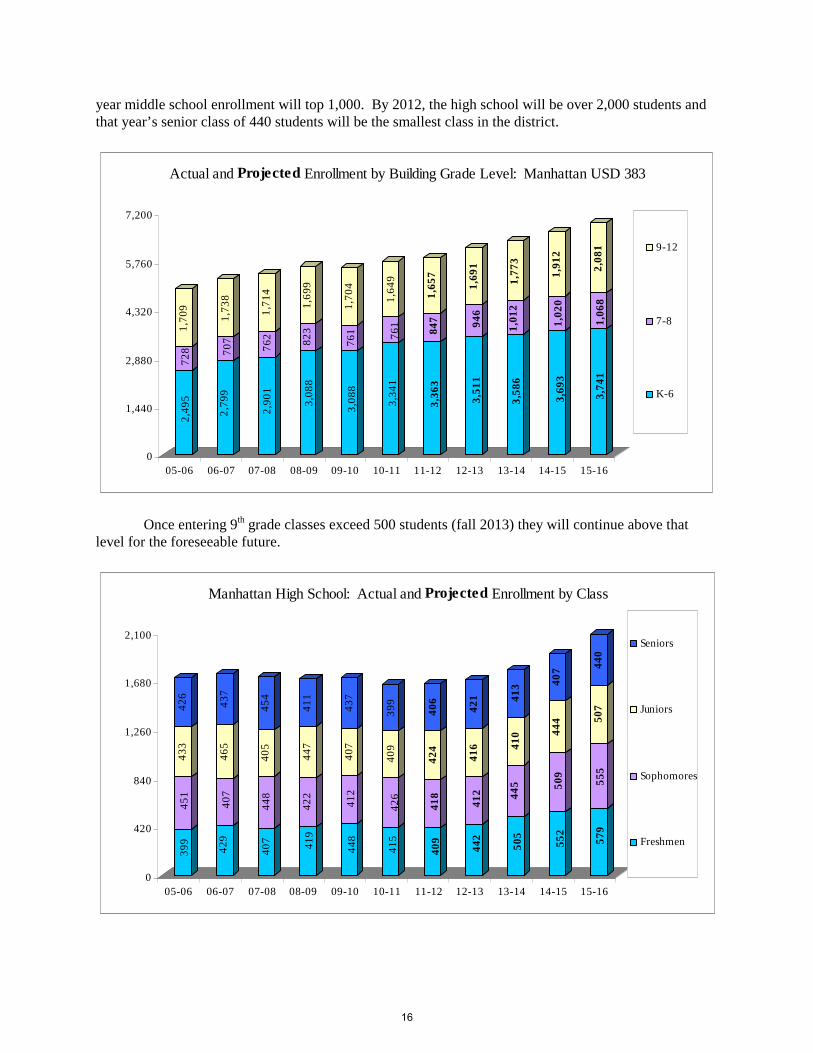
year middle school enrollment will top 1,000. By 2012, the high school will be over 2,000 students and that year’s senior class of 440 students will be the smallest class in the district.
2,4
95
72
81
,70
9
2,7
99
70
71
,73
8
2,9
01
76
21
,71
4
3,0
88
82
31
,69
9
3,0
88
76
11
,70
4
3,3
41
76
11
,64
9
3,3
63
84
71
,65
7
3,5
11
94
61
,69
1
3,5
86
1,0
12
1,7
73
3,6
93
1,0
20
1,9
12
3,7
41
1,0
68
2,0
81
0
1,440
2,880
4,320
5,760
7,200
05-06 06-07 07-08 08-09 09-10 10-11 11-12 12-13 13-14 14-15 15-16
Actual and Projected Enrollment by Building Grade Level: Manhattan USD 383
9-12
7-8
K-6
Once entering 9th grade classes exceed 500 students (fall 2013) they will continue above that level for the foreseeable future.
39
94
51
43
34
26
42
94
07
46
54
37
40
74
48
40
54
54
41
94
22
44
74
11
44
84
12
40
74
37
41
54
26
40
93
99
40
94
18
42
44
06
44
24
12
41
64
21
50
54
45
41
04
13
55
25
09
44
44
07
57
95
55
50
74
40
0
420
840
1,260
1,680
2,100
05-06 06-07 07-08 08-09 09-10 10-11 11-12 12-13 13-14 14-15 15-16
Manhattan High School: Actual and Projected Enrollment by Class
Seniors
Juniors
Sophomores
Freshmen
16
Conclusion Cohort survival ratios are used frequently as an enrollment forecasting technique because they offer both a short term and a long term perspective. We have chosen to use an average of six years worth of (cohort survival ratios) information about Manhattan USD 383. We could have used only the most recent three years, in which case projected growth would be even larger. Because migration patterns and attrition (retention ratios greater than 100% in the elementary grades and in the high school) are factors influencing enrollment change in this district, and because migration patterns can change relatively quickly, the board should keep in mind the dramatic effect on enrollment posed by the large military population in the area. No single enrollment forecast can answer all questions or always be precisely accurate. This caution is not intended to reduce the Board’s confidence in this method. With the kind of migration patterns and birth rate data affecting this district, a cohort survival ratio appears ideally suited to forecast changes in total enrollment of the district. However, this report should become only part of a total planning effort, and not the sole factor upon which resource allocation decisions are made.
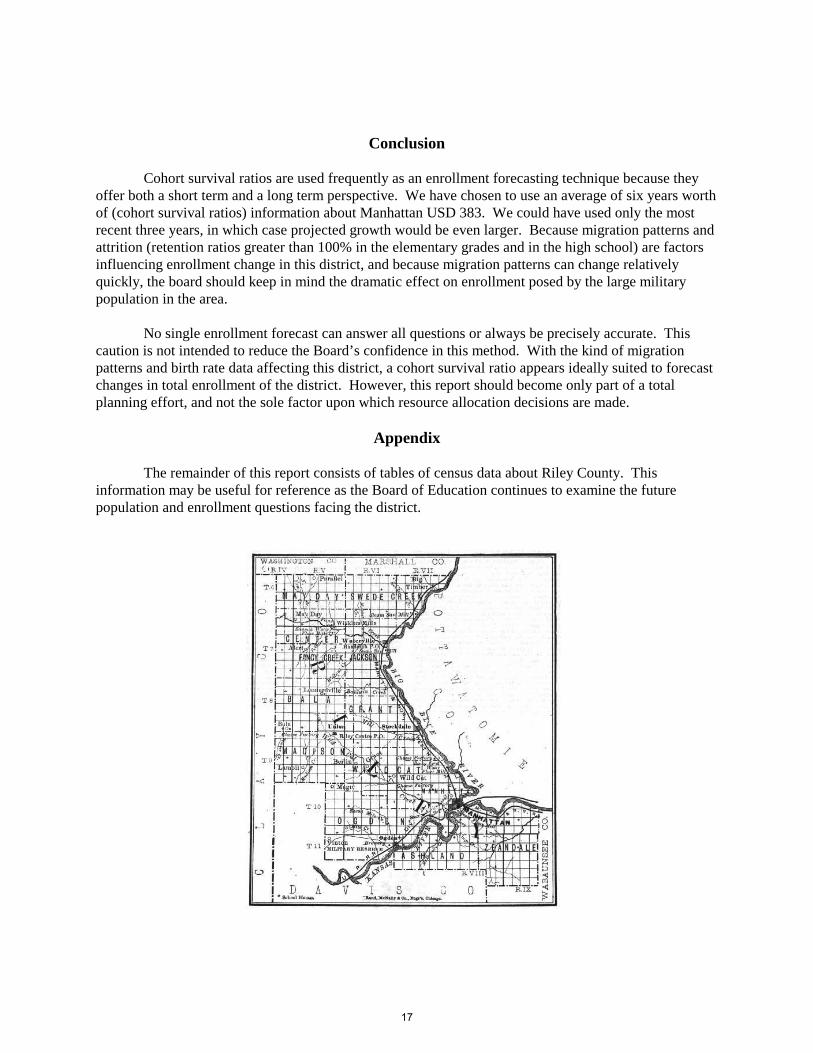
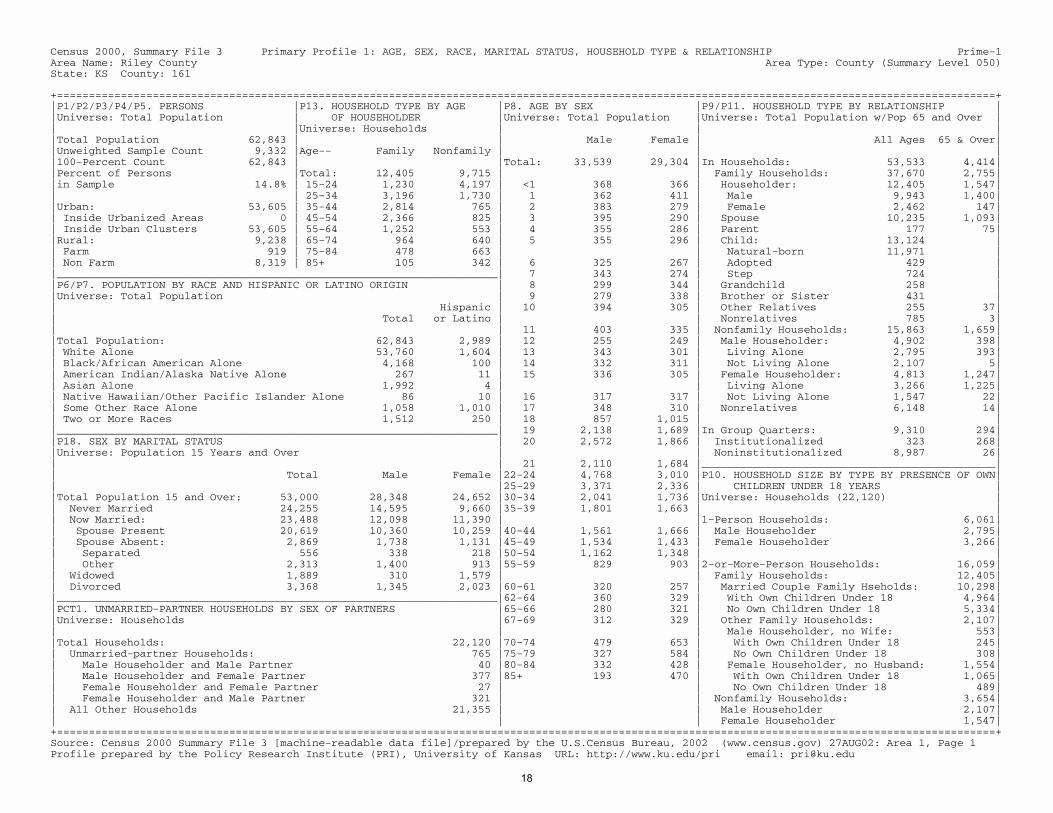
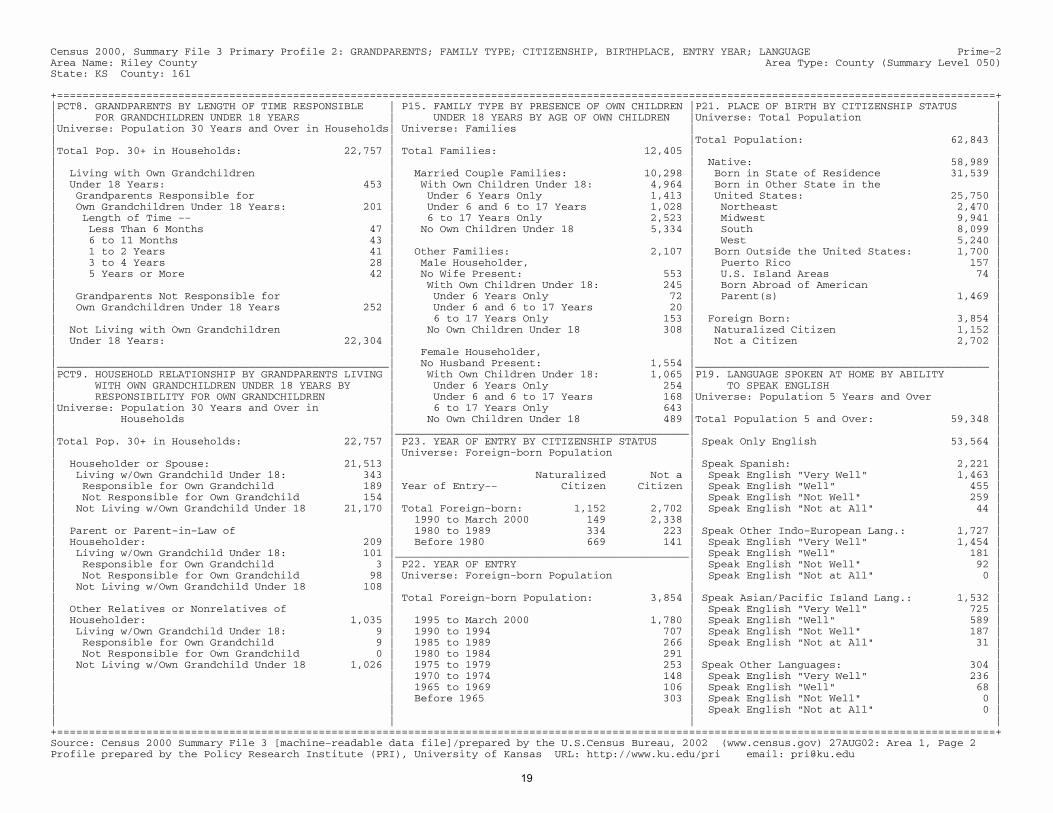
Appendix The remainder of this report consists of tables of census data about Riley County. This information may be useful for reference as the Board of Education continues to examine the future population and enrollment questions facing the district.
17
Census 2000, Summary File 3 Primary Profile 1: AGE, SEX, RACE, MARITAL STATUS, HOUSEHOLD TYPE & RELATIONSHIP Prime−1Area Name: Riley County Area Type: County (Summary Level 050)State: KS County: 161 +===================================================================================================================================================+|P1/P2/P3/P4/P5. PERSONS |P13. HOUSEHOLD TYPE BY AGE |P8. AGE BY SEX |P9/P11. HOUSEHOLD TYPE BY RELATIONSHIP ||Universe: Total Population | OF HOUSEHOLDER |Universe: Total Population |Universe: Total Population w/Pop 65 and Over || |Universe: Households | | ||Total Population 62,843 | | Male Female | All Ages 65 & Over||Unweighted Sample Count 9,332 |Age−− Family Nonfamily | | ||100−Percent Count 62,843 | |Total: 33,539 29,304 |In Households: 53,533 4,414||Percent of Persons |Total: 12,405 9,715 | | Family Households: 37,670 2,755||in Sample 14.8% | 15−24 1,230 4,197 | <1 368 366 | Householder: 12,405 1,547|| | 25−34 3,196 1,730 | 1 362 411 | Male 9,943 1,400||Urban: 53,605 | 35−44 2,814 765 | 2 383 279 | Female 2,462 147|| Inside Urbanized Areas 0 | 45−54 2,366 825 | 3 395 290 | Spouse 10,235 1,093|| Inside Urban Clusters 53,605 | 55−64 1,252 553 | 4 355 286 | Parent 177 75||Rural: 9,238 | 65−74 964 640 | 5 355 296 | Child: 13,124 || Farm 919 | 75−84 478 663 | | Natural−born 11,971 || Non Farm 8,319 | 85+ 105 342 | 6 325 267 | Adopted 429 ||_____________________________________________________________________| 7 343 274 | Step 724 ||P6/P7. POPULATION BY RACE AND HISPANIC OR LATINO ORIGIN | 8 299 344 | Grandchild 258 ||Universe: Total Population | 9 279 338 | Brother or Sister 431 || Hispanic | 10 394 305 | Other Relatives 255 37|| Total or Latino | | Nonrelatives 785 3|| | 11 403 335 | Nonfamily Households: 15,863 1,659||Total Population: 62,843 2,989 | 12 255 249 | Male Householder: 4,902 398|| White Alone 53,760 1,604 | 13 343 301 | Living Alone 2,795 393|| Black/African American Alone 4,168 100 | 14 332 311 | Not Living Alone 2,107 5|| American Indian/Alaska Native Alone 267 11 | 15 336 305 | Female Householder: 4,813 1,247|| Asian Alone 1,992 4 | | Living Alone 3,266 1,225|| Native Hawaiian/Other Pacific Islander Alone 86 10 | 16 317 317 | Not Living Alone 1,547 22|| Some Other Race Alone 1,058 1,010 | 17 348 310 | Nonrelatives 6,148 14|| Two or More Races 1,512 250 | 18 857 1,015 | ||_____________________________________________________________________| 19 2,138 1,689 |In Group Quarters: 9,310 294||P18. SEX BY MARITAL STATUS | 20 2,572 1,866 | Institutionalized 323 268||Universe: Population 15 Years and Over | | Noninstitutionalized 8,987 26|| | 21 2,110 1,684 |______________________________________________|| Total Male Female |22−24 4,768 3,010 |P10. HOUSEHOLD SIZE BY TYPE BY PRESENCE OF OWN|| |25−29 3,371 2,336 | CHILDREN UNDER 18 YEARS ||Total Population 15 and Over: 53,000 28,348 24,652 |30−34 2,041 1,736 |Universe: Households (22,120) || Never Married 24,255 14,595 9,660 |35−39 1,801 1,663 | || Now Married: 23,488 12,098 11,390 | |1−Person Households: 6,061|| Spouse Present 20,619 10,360 10,259 |40−44 1,561 1,666 | Male Householder 2,795|| Spouse Absent: 2,869 1,738 1,131 |45−49 1,534 1,433 | Female Householder 3,266|| Separated 556 338 218 |50−54 1,162 1,348 | || Other 2,313 1,400 913 |55−59 829 903 |2−or−More−Person Households: 16,059|| Widowed 1,889 310 1,579 | | Family Households: 12,405|| Divorced 3,368 1,345 2,023 |60−61 320 257 | Married Couple Family Hseholds: 10,298||_____________________________________________________________________|62−64 360 329 | With Own Children Under 18 4,964||PCT1. UNMARRIED−PARTNER HOUSEHOLDS BY SEX OF PARTNERS |65−66 280 321 | No Own Children Under 18 5,334||Universe: Households |67−69 312 329 | Other Family Households: 2,107|| | | Male Householder, no Wife: 553||Total Households: 22,120 |70−74 479 653 | With Own Children Under 18 245|| Unmarried−partner Households: 765 |75−79 327 584 | No Own Children Under 18 308|| Male Householder and Male Partner 40 |80−84 332 428 | Female Householder, no Husband: 1,554|| Male Householder and Female Partner 377 |85+ 193 470 | With Own Children Under 18 1,065|| Female Householder and Female Partner 27 | | No Own Children Under 18 489|| Female Householder and Male Partner 321 | | Nonfamily Households: 3,654|| All Other Households 21,355 | | Male Householder 2,107|| | | Female Householder 1,547|+===================================================================================================================================================+Source: Census 2000 Summary File 3 [machine−readable data file]/prepared by the U.S.Census Bureau, 2002 (www.census.gov) 27AUG02: Area 1, Page 1 Profile prepared by the Policy Research Institute (PRI), University of Kansas URL: http://www.ku.edu/pri email: [email protected]
18
Census 2000, Summary File 3 Primary Profile 2: GRANDPARENTS; FAMILY TYPE; CITIZENSHIP, BIRTHPLACE, ENTRY YEAR; LANGUAGE Prime−2Area Name: Riley County Area Type: County (Summary Level 050)State: KS County: 161 +===================================================================================================================================================+|PCT8. GRANDPARENTS BY LENGTH OF TIME RESPONSIBLE | P15. FAMILY TYPE BY PRESENCE OF OWN CHILDREN |P21. PLACE OF BIRTH BY CITIZENSHIP STATUS || FOR GRANDCHILDREN UNDER 18 YEARS | UNDER 18 YEARS BY AGE OF OWN CHILDREN |Universe: Total Population ||Universe: Population 30 Years and Over in Households| Universe: Families | || | |Total Population: 62,843 ||Total Pop. 30+ in Households: 22,757 | Total Families: 12,405 | || | | Native: 58,989 || Living with Own Grandchildren | Married Couple Families: 10,298 | Born in State of Residence 31,539 || Under 18 Years: 453 | With Own Children Under 18: 4,964 | Born in Other State in the || Grandparents Responsible for | Under 6 Years Only 1,413 | United States: 25,750 || Own Grandchildren Under 18 Years: 201 | Under 6 and 6 to 17 Years 1,028 | Northeast 2,470 || Length of Time −− | 6 to 17 Years Only 2,523 | Midwest 9,941 || Less Than 6 Months 47 | No Own Children Under 18 5,334 | South 8,099 || 6 to 11 Months 43 | | West 5,240 || 1 to 2 Years 41 | Other Families: 2,107 | Born Outside the United States: 1,700 || 3 to 4 Years 28 | Male Householder, | Puerto Rico 157 || 5 Years or More 42 | No Wife Present: 553 | U.S. Island Areas 74 || | With Own Children Under 18: 245 | Born Abroad of American || Grandparents Not Responsible for | Under 6 Years Only 72 | Parent(s) 1,469 || Own Grandchildren Under 18 Years 252 | Under 6 and 6 to 17 Years 20 | || | 6 to 17 Years Only 153 | Foreign Born: 3,854 || Not Living with Own Grandchildren | No Own Children Under 18 308 | Naturalized Citizen 1,152 || Under 18 Years: 22,304 | | Not a Citizen 2,702 || | Female Householder, | ||____________________________________________________| No Husband Present: 1,554 |______________________________________________ ||PCT9. HOUSEHOLD RELATIONSHIP BY GRANDPARENTS LIVING | With Own Children Under 18: 1,065 |P19. LANGUAGE SPOKEN AT HOME BY ABILITY || WITH OWN GRANDCHILDREN UNDER 18 YEARS BY | Under 6 Years Only 254 | TO SPEAK ENGLISH || RESPONSIBILITY FOR OWN GRANDCHILDREN | Under 6 and 6 to 17 Years 168 |Universe: Population 5 Years and Over ||Universe: Population 30 Years and Over in | 6 to 17 Years Only 643 | || Households | No Own Children Under 18 489 |Total Population 5 and Over: 59,348 || |______________________________________________| ||Total Pop. 30+ in Households: 22,757 | P23. YEAR OF ENTRY BY CITIZENSHIP STATUS | Speak Only English 53,564 || | Universe: Foreign−born Population | || Householder or Spouse: 21,513 | | Speak Spanish: 2,221 || Living w/Own Grandchild Under 18: 343 | Naturalized Not a | Speak English "Very Well" 1,463 || Responsible for Own Grandchild 189 | Year of Entry−− Citizen Citizen | Speak English "Well" 455 || Not Responsible for Own Grandchild 154 | | Speak English "Not Well" 259 || Not Living w/Own Grandchild Under 18 21,170 | Total Foreign−born: 1,152 2,702 | Speak English "Not at All" 44 || | 1990 to March 2000 149 2,338 | || Parent or Parent−in−Law of | 1980 to 1989 334 223 | Speak Other Indo−European Lang.: 1,727 || Householder: 209 | Before 1980 669 141 | Speak English "Very Well" 1,454 || Living w/Own Grandchild Under 18: 101 |______________________________________________| Speak English "Well" 181 || Responsible for Own Grandchild 3 | P22. YEAR OF ENTRY | Speak English "Not Well" 92 || Not Responsible for Own Grandchild 98 | Universe: Foreign−born Population | Speak English "Not at All" 0 || Not Living w/Own Grandchild Under 18 108 | | || | Total Foreign−born Population: 3,854 | Speak Asian/Pacific Island Lang.: 1,532 || Other Relatives or Nonrelatives of | | Speak English "Very Well" 725 || Householder: 1,035 | 1995 to March 2000 1,780 | Speak English "Well" 589 || Living w/Own Grandchild Under 18: 9 | 1990 to 1994 707 | Speak English "Not Well" 187 || Responsible for Own Grandchild 9 | 1985 to 1989 266 | Speak English "Not at All" 31 || Not Responsible for Own Grandchild 0 | 1980 to 1984 291 | || Not Living w/Own Grandchild Under 18 1,026 | 1975 to 1979 253 | Speak Other Languages: 304 || | 1970 to 1974 148 | Speak English "Very Well" 236 || | 1965 to 1969 106 | Speak English "Well" 68 || | Before 1965 303 | Speak English "Not Well" 0 || | | Speak English "Not at All" 0 || | | |+===================================================================================================================================================+Source: Census 2000 Summary File 3 [machine−readable data file]/prepared by the U.S.Census Bureau, 2002 (www.census.gov) 27AUG02: Area 1, Page 2 Profile prepared by the Policy Research Institute (PRI), University of Kansas URL: http://www.ku.edu/pri email: [email protected]
19
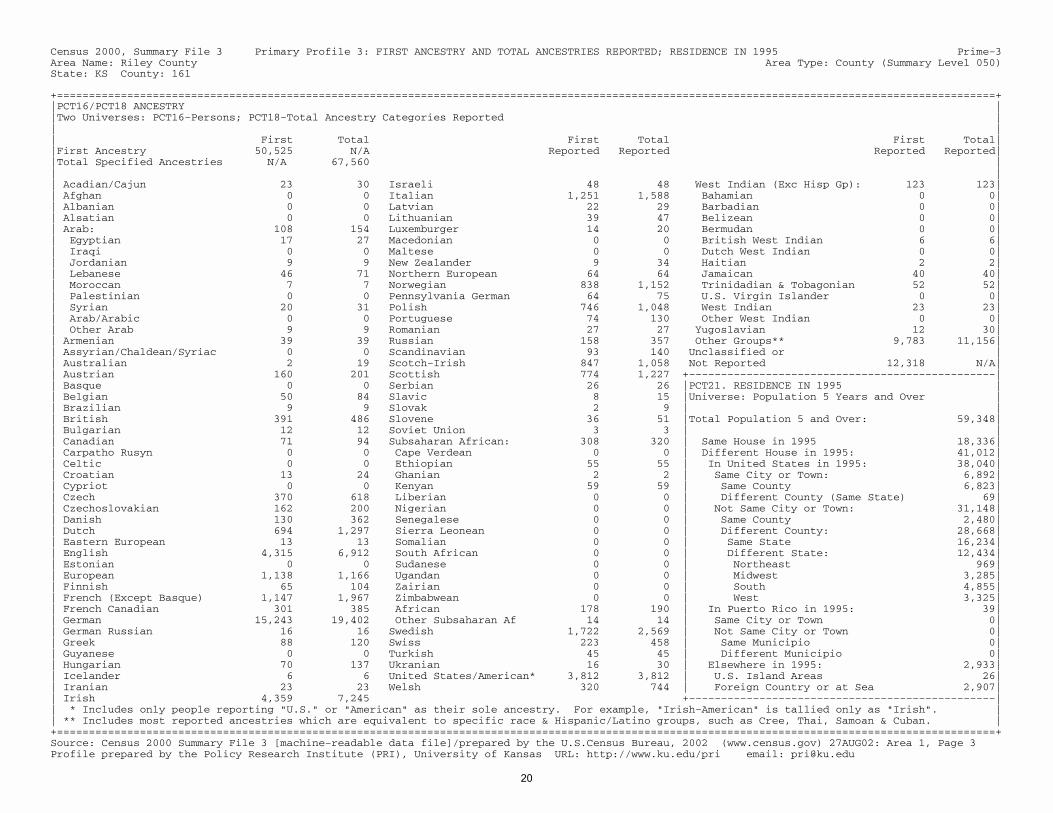
Census 2000, Summary File 3 Primary Profile 3: FIRST ANCESTRY AND TOTAL ANCESTRIES REPORTED; RESIDENCE IN 1995 Prime−3Area Name: Riley County Area Type: County (Summary Level 050)State: KS County: 161 +===================================================================================================================================================+|PCT16/PCT18 ANCESTRY ||Two Universes: PCT16−Persons; PCT18−Total Ancestry Categories Reported || || First Total First Total First Total||First Ancestry 50,525 N/A Reported Reported Reported Reported||Total Specified Ancestries N/A 67,560 || || Acadian/Cajun 23 30 Israeli 48 48 West Indian (Exc Hisp Gp): 123 123|| Afghan 0 0 Italian 1,251 1,588 Bahamian 0 0|| Albanian 0 0 Latvian 22 29 Barbadian 0 0|| Alsatian 0 0 Lithuanian 39 47 Belizean 0 0|| Arab: 108 154 Luxemburger 14 20 Bermudan 0 0|| Egyptian 17 27 Macedonian 0 0 British West Indian 6 6|| Iraqi 0 0 Maltese 0 0 Dutch West Indian 0 0|| Jordanian 9 9 New Zealander 9 34 Haitian 2 2|| Lebanese 46 71 Northern European 64 64 Jamaican 40 40|| Moroccan 7 7 Norwegian 838 1,152 Trinidadian & Tobagonian 52 52|| Palestinian 0 0 Pennsylvania German 64 75 U.S. Virgin Islander 0 0|| Syrian 20 31 Polish 746 1,048 West Indian 23 23|| Arab/Arabic 0 0 Portuguese 74 130 Other West Indian 0 0|| Other Arab 9 9 Romanian 27 27 Yugoslavian 12 30|| Armenian 39 39 Russian 158 357 Other Groups** 9,783 11,156|| Assyrian/Chaldean/Syriac 0 0 Scandinavian 93 140 Unclassified or || Australian 2 19 Scotch−Irish 847 1,058 Not Reported 12,318 N/A|| Austrian 160 201 Scottish 774 1,227 +−−−−−−−−−−−−−−−−−−−−−−−−−−−−−−−−−−−−−−−−−−−−−−−−|| Basque 0 0 Serbian 26 26 |PCT21. RESIDENCE IN 1995 || Belgian 50 84 Slavic 8 15 |Universe: Population 5 Years and Over || Brazilian 9 9 Slovak 2 9 | || British 391 486 Slovene 36 51 |Total Population 5 and Over: 59,348|| Bulgarian 12 12 Soviet Union 3 3 | || Canadian 71 94 Subsaharan African: 308 320 | Same House in 1995 18,336|| Carpatho Rusyn 0 0 Cape Verdean 0 0 | Different House in 1995: 41,012|| Celtic 0 0 Ethiopian 55 55 | In United States in 1995: 38,040|| Croatian 13 24 Ghanian 2 2 | Same City or Town: 6,892|| Cypriot 0 0 Kenyan 59 59 | Same County 6,823|| Czech 370 618 Liberian 0 0 | Different County (Same State) 69|| Czechoslovakian 162 200 Nigerian 0 0 | Not Same City or Town: 31,148|| Danish 130 362 Senegalese 0 0 | Same County 2,480|| Dutch 694 1,297 Sierra Leonean 0 0 | Different County: 28,668|| Eastern European 13 13 Somalian 0 0 | Same State 16,234|| English 4,315 6,912 South African 0 0 | Different State: 12,434|| Estonian 0 0 Sudanese 0 0 | Northeast 969|| European 1,138 1,166 Ugandan 0 0 | Midwest 3,285|| Finnish 65 104 Zairian 0 0 | South 4,855|| French (Except Basque) 1,147 1,967 Zimbabwean 0 0 | West 3,325|| French Canadian 301 385 African 178 190 | In Puerto Rico in 1995: 39|| German 15,243 19,402 Other Subsaharan Af 14 14 | Same City or Town 0|| German Russian 16 16 Swedish 1,722 2,569 | Not Same City or Town 0|| Greek 88 120 Swiss 223 458 | Same Municipio 0|| Guyanese 0 0 Turkish 45 45 | Different Municipio 0|| Hungarian 70 137 Ukranian 16 30 | Elsewhere in 1995: 2,933|| Icelander 6 6 United States/American* 3,812 3,812 | U.S. Island Areas 26|| Iranian 23 23 Welsh 320 744 | Foreign Country or at Sea 2,907|| Irish 4,359 7,245 +−−−−−−−−−−−−−−−−−−−−−−−−−−−−−−−−−−−−−−−−−−−−−−−−|| * Includes only people reporting "U.S." or "American" as their sole ancestry. For example, "Irish−American" is tallied only as "Irish". || ** Includes most reported ancestries which are equivalent to specific race & Hispanic/Latino groups, such as Cree, Thai, Samoan & Cuban. |+===================================================================================================================================================+Source: Census 2000 Summary File 3 [machine−readable data file]/prepared by the U.S.Census Bureau, 2002 (www.census.gov) 27AUG02: Area 1, Page 3 Profile prepared by the Policy Research Institute (PRI), University of Kansas URL: http://www.ku.edu/pri email: [email protected]
20
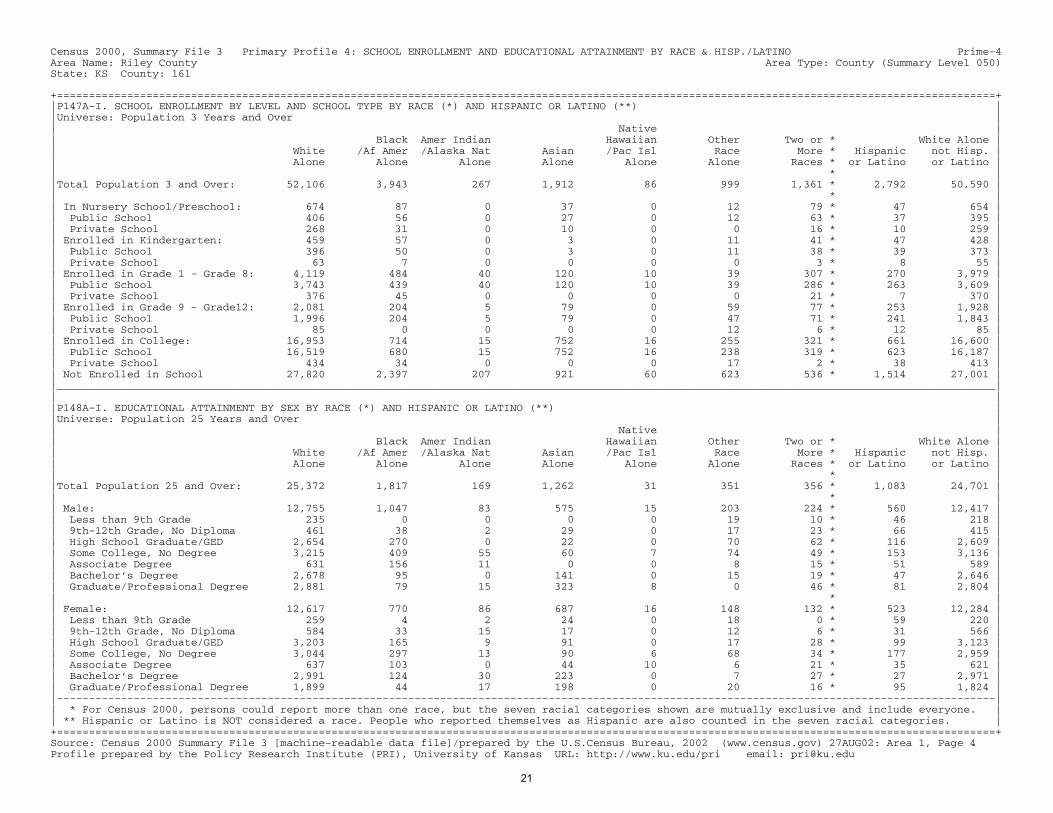
Census 2000, Summary File 3 Primary Profile 4: SCHOOL ENROLLMENT AND EDUCATIONAL ATTAINMENT BY RACE & HISP./LATINO Prime−4Area Name: Riley County Area Type: County (Summary Level 050)State: KS County: 161 +===================================================================================================================================================+|P147A−I. SCHOOL ENROLLMENT BY LEVEL AND SCHOOL TYPE BY RACE (*) AND HISPANIC OR LATINO (**) ||Universe: Population 3 Years and Over || Native || Black Amer Indian Hawaiian Other Two or * White Alone || White /Af Amer /Alaska Nat Asian /Pac Isl Race More * Hispanic not Hisp. || Alone Alone Alone Alone Alone Alone Races * or Latino or Latino || * ||Total Population 3 and Over: 52,106 3,943 267 1,912 86 999 1,361 * 2,792 50,590 || * || In Nursery School/Preschool: 674 87 0 37 0 12 79 * 47 654 || Public School 406 56 0 27 0 12 63 * 37 395 || Private School 268 31 0 10 0 0 16 * 10 259 || Enrolled in Kindergarten: 459 57 0 3 0 11 41 * 47 428 || Public School 396 50 0 3 0 11 38 * 39 373 || Private School 63 7 0 0 0 0 3 * 8 55 || Enrolled in Grade 1 − Grade 8: 4,119 484 40 120 10 39 307 * 270 3,979 || Public School 3,743 439 40 120 10 39 286 * 263 3,609 || Private School 376 45 0 0 0 0 21 * 7 370 || Enrolled in Grade 9 − Grade12: 2,081 204 5 79 0 59 77 * 253 1,928 || Public School 1,996 204 5 79 0 47 71 * 241 1,843 || Private School 85 0 0 0 0 12 6 * 12 85 || Enrolled in College: 16,953 714 15 752 16 255 321 * 661 16,600 || Public School 16,519 680 15 752 16 238 319 * 623 16,187 || Private School 434 34 0 0 0 17 2 * 38 413 || Not Enrolled in School 27,820 2,397 207 921 60 623 536 * 1,514 27,001 ||___________________________________________________________________________________________________________________________________________________|| ||P148A−I. EDUCATIONAL ATTAINMENT BY SEX BY RACE (*) AND HISPANIC OR LATINO (**) ||Universe: Population 25 Years and Over || Native || Black Amer Indian Hawaiian Other Two or * White Alone || White /Af Amer /Alaska Nat Asian /Pac Isl Race More * Hispanic not Hisp. || Alone Alone Alone Alone Alone Alone Races * or Latino or Latino || * ||Total Population 25 and Over: 25,372 1,817 169 1,262 31 351 356 * 1,083 24,701 || * || Male: 12,755 1,047 83 575 15 203 224 * 560 12,417 || Less than 9th Grade 235 0 0 0 0 19 10 * 46 218 || 9th−12th Grade, No Diploma 461 38 2 29 0 17 23 * 66 415 || High School Graduate/GED 2,654 270 0 22 0 70 62 * 116 2,609 || Some College, No Degree 3,215 409 55 60 7 74 49 * 153 3,136 || Associate Degree 631 156 11 0 0 8 15 * 51 589 || Bachelor�s Degree 2,678 95 0 141 0 15 19 * 47 2,646 || Graduate/Professional Degree 2,881 79 15 323 8 0 46 * 81 2,804 || * || Female: 12,617 770 86 687 16 148 132 * 523 12,284 || Less than 9th Grade 259 4 2 24 0 18 0 * 59 220 || 9th−12th Grade, No Diploma 584 33 15 17 0 12 6 * 31 566 || High School Graduate/GED 3,203 165 9 91 0 17 28 * 99 3,123 || Some College, No Degree 3,044 297 13 90 6 68 34 * 177 2,959 || Associate Degree 637 103 0 44 10 6 21 * 35 621 || Bachelor�s Degree 2,991 124 30 223 0 7 27 * 27 2,971 || Graduate/Professional Degree 1,899 44 17 198 0 20 16 * 95 1,824 ||−−−−−−−−−−−−−−−−−−−−−−−−−−−−−−−−−−−−−−−−−−−−−−−−−−−−−−−−−−−−−−−−−−−−−−−−−−−−−−−−−−−−−−−−−−−−−−−−−−−−−−−−−−−−−−−−−−−−−−−−−−−−−−−−−−−−−−−−−−−−−−−−−−−|| * For Census 2000, persons could report more than one race, but the seven racial categories shown are mutually exclusive and include everyone. || ** Hispanic or Latino is NOT considered a race. People who reported themselves as Hispanic are also counted in the seven racial categories. |+===================================================================================================================================================+Source: Census 2000 Summary File 3 [machine−readable data file]/prepared by the U.S.Census Bureau, 2002 (www.census.gov) 27AUG02: Area 1, Page 4 Profile prepared by the Policy Research Institute (PRI), University of Kansas URL: http://www.ku.edu/pri email: [email protected]
21
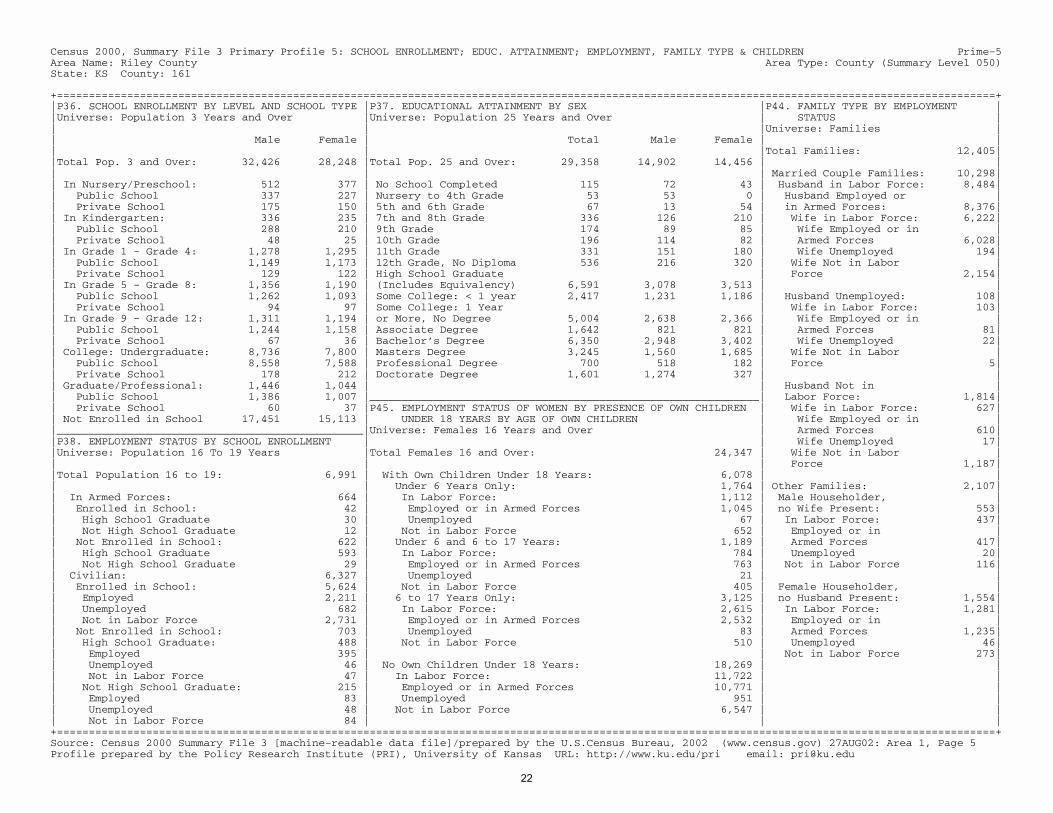
Census 2000, Summary File 3 Primary Profile 5: SCHOOL ENROLLMENT; EDUC. ATTAINMENT; EMPLOYMENT, FAMILY TYPE & CHILDREN Prime−5Area Name: Riley County Area Type: County (Summary Level 050)State: KS County: 161 +===================================================================================================================================================+|P36. SCHOOL ENROLLMENT BY LEVEL AND SCHOOL TYPE |P37. EDUCATIONAL ATTAINMENT BY SEX |P44. FAMILY TYPE BY EMPLOYMENT ||Universe: Population 3 Years and Over |Universe: Population 25 Years and Over | STATUS || | |Universe: Families || Male Female | Total Male Female | || | |Total Families: 12,405||Total Pop. 3 and Over: 32,426 28,248 |Total Pop. 25 and Over: 29,358 14,902 14,456 | || | | Married Couple Families: 10,298|| In Nursery/Preschool: 512 377 | No School Completed 115 72 43 | Husband in Labor Force: 8,484|| Public School 337 227 | Nursery to 4th Grade 53 53 0 | Husband Employed or || Private School 175 150 | 5th and 6th Grade 67 13 54 | in Armed Forces: 8,376|| In Kindergarten: 336 235 | 7th and 8th Grade 336 126 210 | Wife in Labor Force: 6,222|| Public School 288 210 | 9th Grade 174 89 85 | Wife Employed or in || Private School 48 25 | 10th Grade 196 114 82 | Armed Forces 6,028|| In Grade 1 − Grade 4: 1,278 1,295 | 11th Grade 331 151 180 | Wife Unemployed 194|| Public School 1,149 1,173 | 12th Grade, No Diploma 536 216 320 | Wife Not in Labor || Private School 129 122 | High School Graduate | Force 2,154|| In Grade 5 − Grade 8: 1,356 1,190 | (Includes Equivalency) 6,591 3,078 3,513 | || Public School 1,262 1,093 | Some College: < 1 year 2,417 1,231 1,186 | Husband Unemployed: 108|| Private School 94 97 | Some College: 1 Year | Wife in Labor Force: 103|| In Grade 9 − Grade 12: 1,311 1,194 | or More, No Degree 5,004 2,638 2,366 | Wife Employed or in || Public School 1,244 1,158 | Associate Degree 1,642 821 821 | Armed Forces 81|| Private School 67 36 | Bachelor�s Degree 6,350 2,948 3,402 | Wife Unemployed 22|| College: Undergraduate: 8,736 7,800 | Masters Degree 3,245 1,560 1,685 | Wife Not in Labor || Public School 8,558 7,588 | Professional Degree 700 518 182 | Force 5|| Private School 178 212 | Doctorate Degree 1,601 1,274 327 | || Graduate/Professional: 1,446 1,044 | | Husband Not in || Public School 1,386 1,007 |_____________________________________________________________| Labor Force: 1,814|| Private School 60 37 |P45. EMPLOYMENT STATUS OF WOMEN BY PRESENCE OF OWN CHILDREN | Wife in Labor Force: 627|| Not Enrolled in School 17,451 15,113 | UNDER 18 YEARS BY AGE OF OWN CHILDREN | Wife Employed or in ||________________________________________________|Universe: Females 16 Years and Over | Armed Forces 610||P38. EMPLOYMENT STATUS BY SCHOOL ENROLLMENT | | Wife Unemployed 17||Universe: Population 16 To 19 Years |Total Females 16 and Over: 24,347 | Wife Not in Labor || | | Force 1,187||Total Population 16 to 19: 6,991 | With Own Children Under 18 Years: 6,078 | || | Under 6 Years Only: 1,764 | Other Families: 2,107|| In Armed Forces: 664 | In Labor Force: 1,112 | Male Householder, || Enrolled in School: 42 | Employed or in Armed Forces 1,045 | no Wife Present: 553|| High School Graduate 30 | Unemployed 67 | In Labor Force: 437|| Not High School Graduate 12 | Not in Labor Force 652 | Employed or in || Not Enrolled in School: 622 | Under 6 and 6 to 17 Years: 1,189 | Armed Forces 417|| High School Graduate 593 | In Labor Force: 784 | Unemployed 20|| Not High School Graduate 29 | Employed or in Armed Forces 763 | Not in Labor Force 116|| Civilian: 6,327 | Unemployed 21 | || Enrolled in School: 5,624 | Not in Labor Force 405 | Female Householder, || Employed 2,211 | 6 to 17 Years Only: 3,125 | no Husband Present: 1,554|| Unemployed 682 | In Labor Force: 2,615 | In Labor Force: 1,281|| Not in Labor Force 2,731 | Employed or in Armed Forces 2,532 | Employed or in || Not Enrolled in School: 703 | Unemployed 83 | Armed Forces 1,235|| High School Graduate: 488 | Not in Labor Force 510 | Unemployed 46|| Employed 395 | | Not in Labor Force 273|| Unemployed 46 | No Own Children Under 18 Years: 18,269 | || Not in Labor Force 47 | In Labor Force: 11,722 | || Not High School Graduate: 215 | Employed or in Armed Forces 10,771 | || Employed 83 | Unemployed 951 | || Unemployed 48 | Not in Labor Force 6,547 | || Not in Labor Force 84 | | |+===================================================================================================================================================+Source: Census 2000 Summary File 3 [machine−readable data file]/prepared by the U.S.Census Bureau, 2002 (www.census.gov) 27AUG02: Area 1, Page 5 Profile prepared by the Policy Research Institute (PRI), University of Kansas URL: http://www.ku.edu/pri email: [email protected]
22
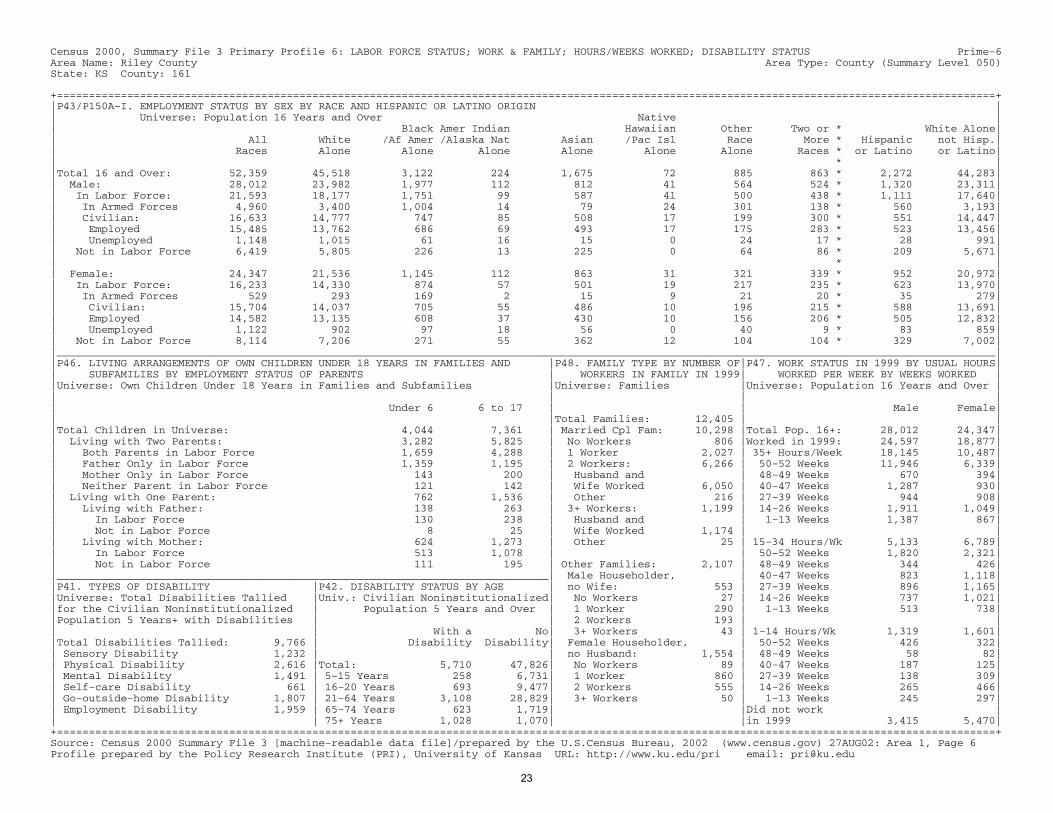
Census 2000, Summary File 3 Primary Profile 6: LABOR FORCE STATUS; WORK & FAMILY; HOURS/WEEKS WORKED; DISABILITY STATUS Prime−6Area Name: Riley County Area Type: County (Summary Level 050)State: KS County: 161 +===================================================================================================================================================+|P43/P150A−I. EMPLOYMENT STATUS BY SEX BY RACE AND HISPANIC OR LATINO ORIGIN || Universe: Population 16 Years and Over Native || Black Amer Indian Hawaiian Other Two or * White Alone|| All White /Af Amer /Alaska Nat Asian /Pac Isl Race More * Hispanic not Hisp.|| Races Alone Alone Alone Alone Alone Alone Races * or Latino or Latino|| * ||Total 16 and Over: 52,359 45,518 3,122 224 1,675 72 885 863 * 2,272 44,283|| Male: 28,012 23,982 1,977 112 812 41 564 524 * 1,320 23,311|| In Labor Force: 21,593 18,177 1,751 99 587 41 500 438 * 1,111 17,640|| In Armed Forces 4,960 3,400 1,004 14 79 24 301 138 * 560 3,193|| Civilian: 16,633 14,777 747 85 508 17 199 300 * 551 14,447|| Employed 15,485 13,762 686 69 493 17 175 283 * 523 13,456|| Unemployed 1,148 1,015 61 16 15 0 24 17 * 28 991|| Not in Labor Force 6,419 5,805 226 13 225 0 64 86 * 209 5,671|| * || Female: 24,347 21,536 1,145 112 863 31 321 339 * 952 20,972|| In Labor Force: 16,233 14,330 874 57 501 19 217 235 * 623 13,970|| In Armed Forces 529 293 169 2 15 9 21 20 * 35 279|| Civilian: 15,704 14,037 705 55 486 10 196 215 * 588 13,691|| Employed 14,582 13,135 608 37 430 10 156 206 * 505 12,832|| Unemployed 1,122 902 97 18 56 0 40 9 * 83 859|| Not in Labor Force 8,114 7,206 271 55 362 12 104 104 * 329 7,002||___________________________________________________________________________________________________________________________________________________||P46. LIVING ARRANGEMENTS OF OWN CHILDREN UNDER 18 YEARS IN FAMILIES AND |P48. FAMILY TYPE BY NUMBER OF|P47. WORK STATUS IN 1999 BY USUAL HOURS|| SUBFAMILIES BY EMPLOYMENT STATUS OF PARENTS | WORKERS IN FAMILY IN 1999| WORKED PER WEEK BY WEEKS WORKED ||Universe: Own Children Under 18 Years in Families and Subfamilies |Universe: Families |Universe: Population 16 Years and Over || | | || Under 6 6 to 17 | | Male Female|| |Total Families: 12,405 | ||Total Children in Universe: 4,044 7,361 | Married Cpl Fam: 10,298 |Total Pop. 16+: 28,012 24,347|| Living with Two Parents: 3,282 5,825 | No Workers 806 |Worked in 1999: 24,597 18,877|| Both Parents in Labor Force 1,659 4,288 | 1 Worker 2,027 | 35+ Hours/Week 18,145 10,487|| Father Only in Labor Force 1,359 1,195 | 2 Workers: 6,266 | 50−52 Weeks 11,946 6,339|| Mother Only in Labor Force 143 200 | Husband and | 48−49 Weeks 670 394|| Neither Parent in Labor Force 121 142 | Wife Worked 6,050 | 40−47 Weeks 1,287 930|| Living with One Parent: 762 1,536 | Other 216 | 27−39 Weeks 944 908|| Living with Father: 138 263 | 3+ Workers: 1,199 | 14−26 Weeks 1,911 1,049|| In Labor Force 130 238 | Husband and | 1−13 Weeks 1,387 867|| Not in Labor Force 8 25 | Wife Worked 1,174 | || Living with Mother: 624 1,273 | Other 25 | 15−34 Hours/Wk 5,133 6,789|| In Labor Force 513 1,078 | | 50−52 Weeks 1,820 2,321|| Not in Labor Force 111 195 | Other Families: 2,107 | 48−49 Weeks 344 426||_____________________________________________________________________________| Male Householder, | 40−47 Weeks 823 1,118||P41. TYPES OF DISABILITY |P42. DISABILITY STATUS BY AGE | no Wife: 553 | 27−39 Weeks 896 1,165||Universe: Total Disabilities Tallied |Univ.: Civilian Noninstitutionalized| No Workers 27 | 14−26 Weeks 737 1,021||for the Civilian Noninstitutionalized | Population 5 Years and Over | 1 Worker 290 | 1−13 Weeks 513 738||Population 5 Years+ with Disabilities | | 2 Workers 193 | || | With a No| 3+ Workers 43 | 1−14 Hours/Wk 1,319 1,601||Total Disabilities Tallied: 9,766 | Disability Disability| Female Householder, | 50−52 Weeks 426 322|| Sensory Disability 1,232 | | no Husband: 1,554 | 48−49 Weeks 58 82|| Physical Disability 2,616 |Total: 5,710 47,826| No Workers 89 | 40−47 Weeks 187 125|| Mental Disability 1,491 | 5−15 Years 258 6,731| 1 Worker 860 | 27−39 Weeks 138 309|| Self−care Disability 661 | 16−20 Years 693 9,477| 2 Workers 555 | 14−26 Weeks 265 466|| Go−outside−home Disability 1,807 | 21−64 Years 3,108 28,829| 3+ Workers 50 | 1−13 Weeks 245 297|| Employment Disability 1,959 | 65−74 Years 623 1,719| |Did not work || | 75+ Years 1,028 1,070| |in 1999 3,415 5,470|+===================================================================================================================================================+Source: Census 2000 Summary File 3 [machine−readable data file]/prepared by the U.S.Census Bureau, 2002 (www.census.gov) 27AUG02: Area 1, Page 6 Profile prepared by the Policy Research Institute (PRI), University of Kansas URL: http://www.ku.edu/pri email: [email protected]
23
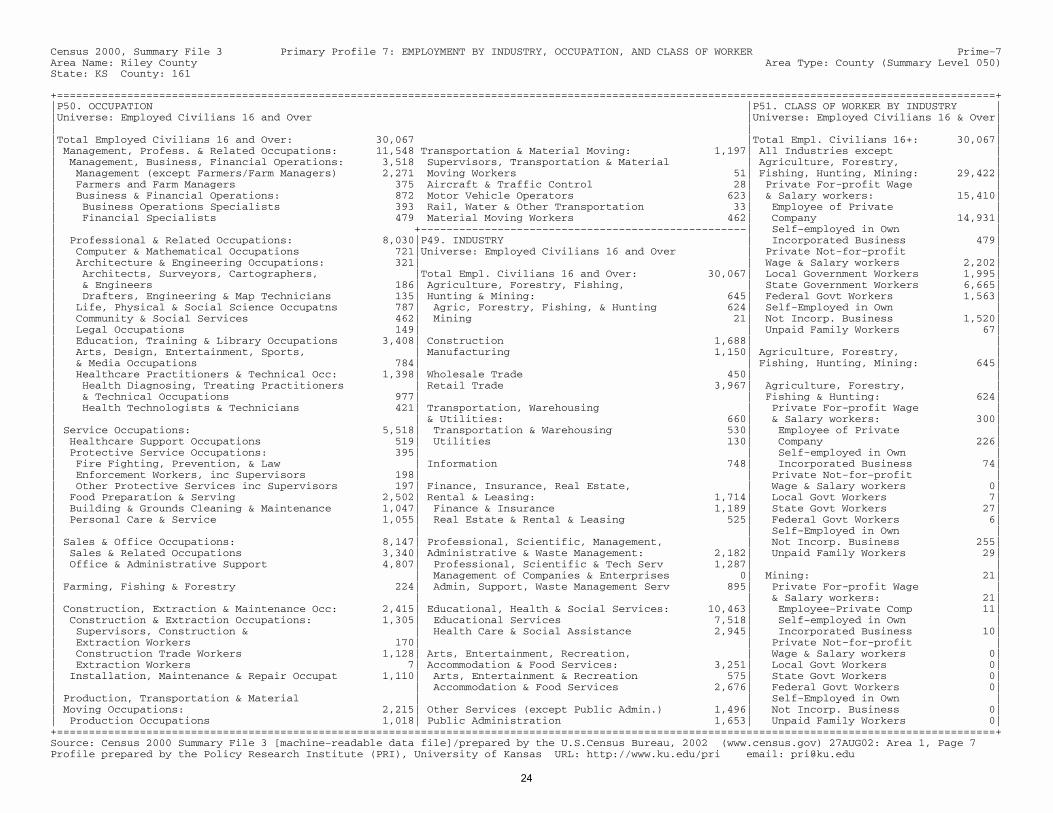
Census 2000, Summary File 3 Primary Profile 7: EMPLOYMENT BY INDUSTRY, OCCUPATION, AND CLASS OF WORKER Prime−7Area Name: Riley County Area Type: County (Summary Level 050)State: KS County: 161 +===================================================================================================================================================+|P50. OCCUPATION |P51. CLASS OF WORKER BY INDUSTRY ||Universe: Employed Civilians 16 and Over |Universe: Employed Civilians 16 & Over|| | ||Total Employed Civilians 16 and Over: 30,067 |Total Empl. Civilians 16+: 30,067|| Management, Profess. & Related Occupations: 11,548 Transportation & Material Moving: 1,197| All Industries except || Management, Business, Financial Operations: 3,518 Supervisors, Transportation & Material | Agriculture, Forestry, || Management (except Farmers/Farm Managers) 2,271 Moving Workers 51| Fishing, Hunting, Mining: 29,422|| Farmers and Farm Managers 375 Aircraft & Traffic Control 28| Private For−profit Wage || Business & Financial Operations: 872 Motor Vehicle Operators 623| & Salary workers: 15,410|| Business Operations Specialists 393 Rail, Water & Other Transportation 33| Employee of Private || Financial Specialists 479 Material Moving Workers 462| Company 14,931|| +−−−−−−−−−−−−−−−−−−−−−−−−−−−−−−−−−−−−−−−−−−−−−−−−−−−| Self−employed in Own || Professional & Related Occupations: 8,030|P49. INDUSTRY | Incorporated Business 479|| Computer & Mathematical Occupations 721|Universe: Employed Civilians 16 and Over | Private Not−for−profit || Architecture & Engineering Occupations: 321| | Wage & Salary workers 2,202|| Architects, Surveyors, Cartographers, |Total Empl. Civilians 16 and Over: 30,067| Local Government Workers 1,995|| & Engineers 186| Agriculture, Forestry, Fishing, | State Government Workers 6,665|| Drafters, Engineering & Map Technicians 135| Hunting & Mining: 645| Federal Govt Workers 1,563|| Life, Physical & Social Science Occupatns 787| Agric, Forestry, Fishing, & Hunting 624| Self−Employed in Own || Community & Social Services 462| Mining 21| Not Incorp. Business 1,520|| Legal Occupations 149| | Unpaid Family Workers 67|| Education, Training & Library Occupations 3,408| Construction 1,688| || Arts, Design, Entertainment, Sports, | Manufacturing 1,150| Agriculture, Forestry, || & Media Occupations 784| | Fishing, Hunting, Mining: 645|| Healthcare Practitioners & Technical Occ: 1,398| Wholesale Trade 450| || Health Diagnosing, Treating Practitioners | Retail Trade 3,967| Agriculture, Forestry, || & Technical Occupations 977| | Fishing & Hunting: 624|| Health Technologists & Technicians 421| Transportation, Warehousing | Private For−profit Wage || | & Utilities: 660| & Salary workers: 300|| Service Occupations: 5,518| Transportation & Warehousing 530| Employee of Private || Healthcare Support Occupations 519| Utilities 130| Company 226|| Protective Service Occupations: 395| | Self−employed in Own || Fire Fighting, Prevention, & Law | Information 748| Incorporated Business 74|| Enforcement Workers, inc Supervisors 198| | Private Not−for−profit || Other Protective Services inc Supervisors 197| Finance, Insurance, Real Estate, | Wage & Salary workers 0|| Food Preparation & Serving 2,502| Rental & Leasing: 1,714| Local Govt Workers 7|| Building & Grounds Cleaning & Maintenance 1,047| Finance & Insurance 1,189| State Govt Workers 27|| Personal Care & Service 1,055| Real Estate & Rental & Leasing 525| Federal Govt Workers 6|| | | Self−Employed in Own || Sales & Office Occupations: 8,147| Professional, Scientific, Management, | Not Incorp. Business 255|| Sales & Related Occupations 3,340| Administrative & Waste Management: 2,182| Unpaid Family Workers 29|| Office & Administrative Support 4,807| Professional, Scientific & Tech Serv 1,287| || | Management of Companies & Enterprises 0| Mining: 21|| Farming, Fishing & Forestry 224| Admin, Support, Waste Management Serv 895| Private For−profit Wage || | | & Salary workers: 21|| Construction, Extraction & Maintenance Occ: 2,415| Educational, Health & Social Services: 10,463| Employee−Private Comp 11|| Construction & Extraction Occupations: 1,305| Educational Services 7,518| Self−employed in Own || Supervisors, Construction & | Health Care & Social Assistance 2,945| Incorporated Business 10|| Extraction Workers 170| | Private Not−for−profit || Construction Trade Workers 1,128| Arts, Entertainment, Recreation, | Wage & Salary workers 0|| Extraction Workers 7| Accommodation & Food Services: 3,251| Local Govt Workers 0|| Installation, Maintenance & Repair Occupat 1,110| Arts, Entertainment & Recreation 575| State Govt Workers 0|| | Accommodation & Food Services 2,676| Federal Govt Workers 0|| Production, Transportation & Material | | Self−Employed in Own || Moving Occupations: 2,215| Other Services (except Public Admin.) 1,496| Not Incorp. Business 0|| Production Occupations 1,018| Public Administration 1,653| Unpaid Family Workers 0|+===================================================================================================================================================+Source: Census 2000 Summary File 3 [machine−readable data file]/prepared by the U.S.Census Bureau, 2002 (www.census.gov) 27AUG02: Area 1, Page 7 Profile prepared by the Policy Research Institute (PRI), University of Kansas URL: http://www.ku.edu/pri email: [email protected]
24
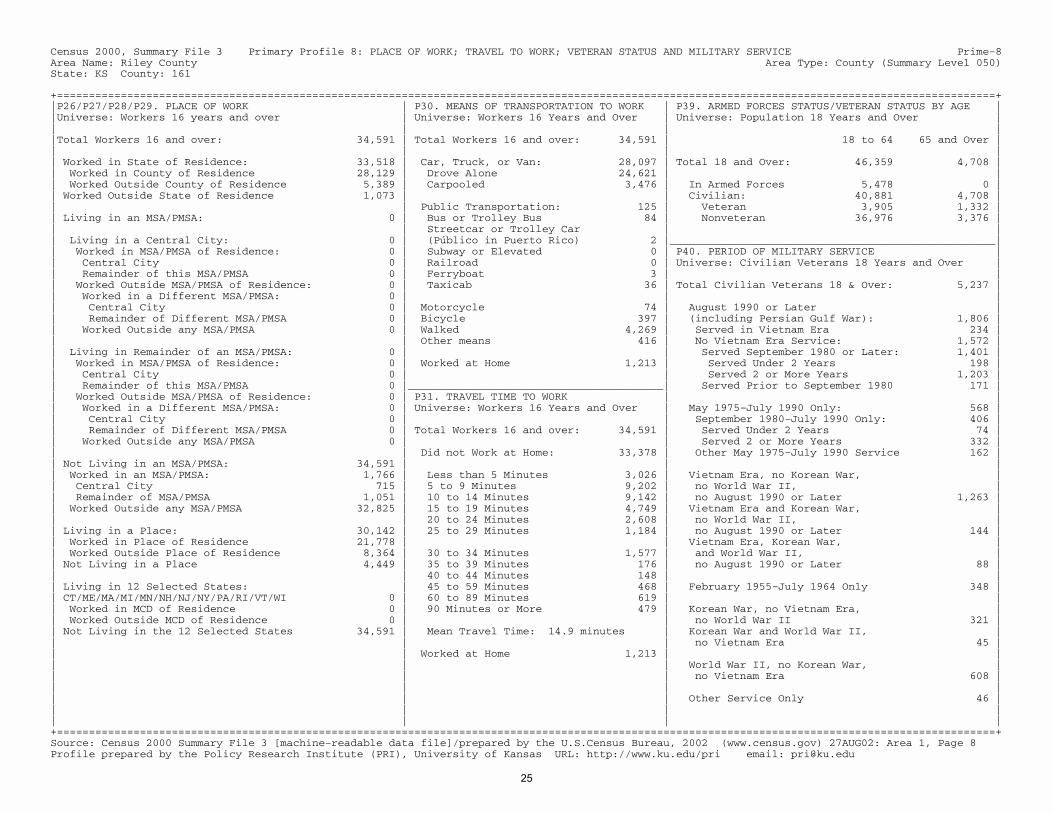
Census 2000, Summary File 3 Primary Profile 8: PLACE OF WORK; TRAVEL TO WORK; VETERAN STATUS AND MILITARY SERVICE Prime−8Area Name: Riley County Area Type: County (Summary Level 050)State: KS County: 161 +===================================================================================================================================================+|P26/P27/P28/P29. PLACE OF WORK | P30. MEANS OF TRANSPORTATION TO WORK | P39. ARMED FORCES STATUS/VETERAN STATUS BY AGE ||Universe: Workers 16 years and over | Universe: Workers 16 Years and Over | Universe: Population 18 Years and Over || | | ||Total Workers 16 and over: 34,591 | Total Workers 16 and over: 34,591 | 18 to 64 65 and Over || | | || Worked in State of Residence: 33,518 | Car, Truck, or Van: 28,097 | Total 18 and Over: 46,359 4,708 || Worked in County of Residence 28,129 | Drove Alone 24,621 | || Worked Outside County of Residence 5,389 | Carpooled 3,476 | In Armed Forces 5,478 0 || Worked Outside State of Residence 1,073 | | Civilian: 40,881 4,708 || | Public Transportation: 125 | Veteran 3,905 1,332 || Living in an MSA/PMSA: 0 | Bus or Trolley Bus 84 | Nonveteran 36,976 3,376 || | Streetcar or Trolley Car | || Living in a Central City: 0 | (Público in Puerto Rico) 2 |___________________________________________________|| Worked in MSA/PMSA of Residence: 0 | Subway or Elevated 0 | P40. PERIOD OF MILITARY SERVICE || Central City 0 | Railroad 0 | Universe: Civilian Veterans 18 Years and Over || Remainder of this MSA/PMSA 0 | Ferryboat 3 | || Worked Outside MSA/PMSA of Residence: 0 | Taxicab 36 | Total Civilian Veterans 18 & Over: 5,237 || Worked in a Different MSA/PMSA: 0 | | || Central City 0 | Motorcycle 74 | August 1990 or Later || Remainder of Different MSA/PMSA 0 | Bicycle 397 | (including Persian Gulf War): 1,806 || Worked Outside any MSA/PMSA 0 | Walked 4,269 | Served in Vietnam Era 234 || | Other means 416 | No Vietnam Era Service: 1,572 || Living in Remainder of an MSA/PMSA: 0 | | Served September 1980 or Later: 1,401 || Worked in MSA/PMSA of Residence: 0 | Worked at Home 1,213 | Served Under 2 Years 198 || Central City 0 | | Served 2 or More Years 1,203 || Remainder of this MSA/PMSA 0 |________________________________________| Served Prior to September 1980 171 || Worked Outside MSA/PMSA of Residence: 0 | P31. TRAVEL TIME TO WORK | || Worked in a Different MSA/PMSA: 0 | Universe: Workers 16 Years and Over | May 1975−July 1990 Only: 568 || Central City 0 | | September 1980−July 1990 Only: 406 || Remainder of Different MSA/PMSA 0 | Total Workers 16 and over: 34,591 | Served Under 2 Years 74 || Worked Outside any MSA/PMSA 0 | | Served 2 or More Years 332 || | Did not Work at Home: 33,378 | Other May 1975−July 1990 Service 162 || Not Living in an MSA/PMSA: 34,591 | | || Worked in an MSA/PMSA: 1,766 | Less than 5 Minutes 3,026 | Vietnam Era, no Korean War, || Central City 715 | 5 to 9 Minutes 9,202 | no World War II, || Remainder of MSA/PMSA 1,051 | 10 to 14 Minutes 9,142 | no August 1990 or Later 1,263 || Worked Outside any MSA/PMSA 32,825 | 15 to 19 Minutes 4,749 | Vietnam Era and Korean War, || | 20 to 24 Minutes 2,608 | no World War II, || Living in a Place: 30,142 | 25 to 29 Minutes 1,184 | no August 1990 or Later 144 || Worked in Place of Residence 21,778 | | Vietnam Era, Korean War, || Worked Outside Place of Residence 8,364 | 30 to 34 Minutes 1,577 | and World War II, || Not Living in a Place 4,449 | 35 to 39 Minutes 176 | no August 1990 or Later 88 || | 40 to 44 Minutes 148 | || Living in 12 Selected States: | 45 to 59 Minutes 468 | February 1955−July 1964 Only 348 || CT/ME/MA/MI/MN/NH/NJ/NY/PA/RI/VT/WI 0 | 60 to 89 Minutes 619 | || Worked in MCD of Residence 0 | 90 Minutes or More 479 | Korean War, no Vietnam Era, || Worked Outside MCD of Residence 0 | | no World War II 321 || Not Living in the 12 Selected States 34,591 | Mean Travel Time: 14.9 minutes | Korean War and World War II, || | | no Vietnam Era 45 || | Worked at Home 1,213 | || | | World War II, no Korean War, || | | no Vietnam Era 608 || | | || | | Other Service Only 46 || | | || | | |+===================================================================================================================================================+Source: Census 2000 Summary File 3 [machine−readable data file]/prepared by the U.S.Census Bureau, 2002 (www.census.gov) 27AUG02: Area 1, Page 8 Profile prepared by the Policy Research Institute (PRI), University of Kansas URL: http://www.ku.edu/pri email: [email protected]
25
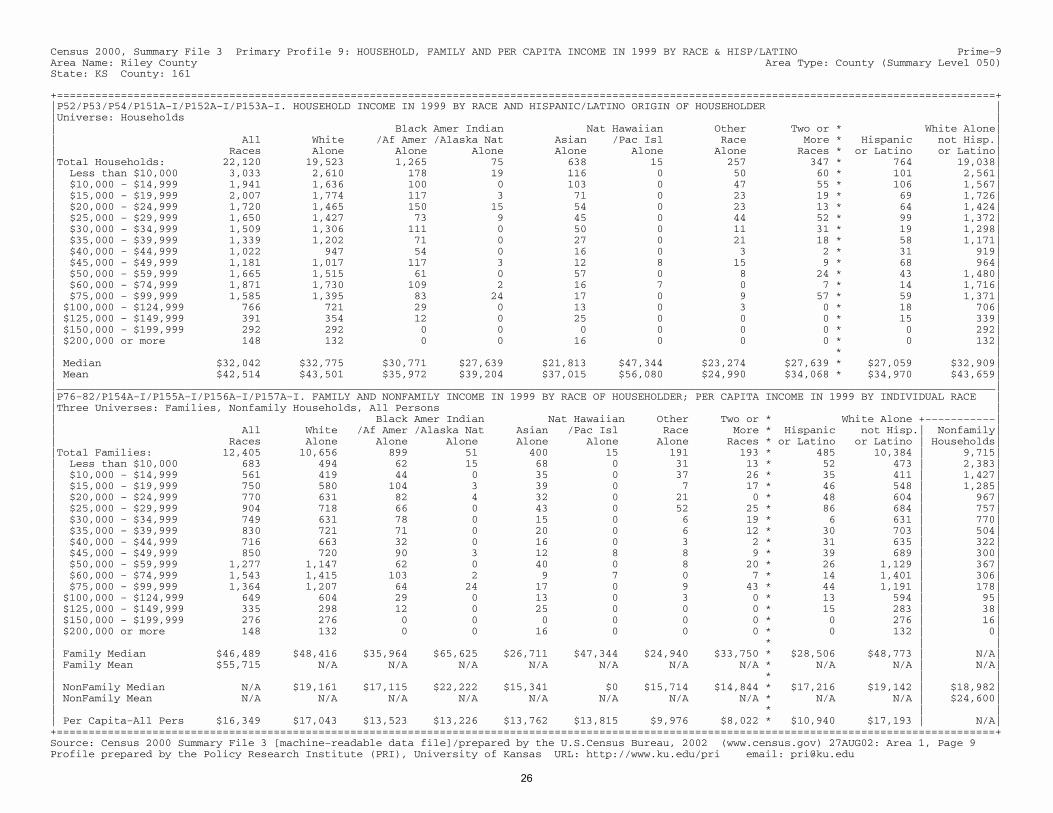
Census 2000, Summary File 3 Primary Profile 9: HOUSEHOLD, FAMILY AND PER CAPITA INCOME IN 1999 BY RACE & HISP/LATINO Prime−9Area Name: Riley County Area Type: County (Summary Level 050)State: KS County: 161 +===================================================================================================================================================+|P52/P53/P54/P151A−I/P152A−I/P153A−I. HOUSEHOLD INCOME IN 1999 BY RACE AND HISPANIC/LATINO ORIGIN OF HOUSEHOLDER ||Universe: Households || Black Amer Indian Nat Hawaiian Other Two or * White Alone|| All White /Af Amer /Alaska Nat Asian /Pac Isl Race More * Hispanic not Hisp.|| Races Alone Alone Alone Alone Alone Alone Races * or Latino or Latino||Total Households: 22,120 19,523 1,265 75 638 15 257 347 * 764 19,038|| Less than $10,000 3,033 2,610 178 19 116 0 50 60 * 101 2,561|| $10,000 − $14,999 1,941 1,636 100 0 103 0 47 55 * 106 1,567|| $15,000 − $19,999 2,007 1,774 117 3 71 0 23 19 * 69 1,726|| $20,000 − $24,999 1,720 1,465 150 15 54 0 23 13 * 64 1,424|| $25,000 − $29,999 1,650 1,427 73 9 45 0 44 52 * 99 1,372|| $30,000 − $34,999 1,509 1,306 111 0 50 0 11 31 * 19 1,298|| $35,000 − $39,999 1,339 1,202 71 0 27 0 21 18 * 58 1,171|| $40,000 − $44,999 1,022 947 54 0 16 0 3 2 * 31 919|| $45,000 − $49,999 1,181 1,017 117 3 12 8 15 9 * 68 964|| $50,000 − $59,999 1,665 1,515 61 0 57 0 8 24 * 43 1,480|| $60,000 − $74,999 1,871 1,730 109 2 16 7 0 7 * 14 1,716|| $75,000 − $99,999 1,585 1,395 83 24 17 0 9 57 * 59 1,371|| $100,000 − $124,999 766 721 29 0 13 0 3 0 * 18 706|| $125,000 − $149,999 391 354 12 0 25 0 0 0 * 15 339|| $150,000 − $199,999 292 292 0 0 0 0 0 0 * 0 292|| $200,000 or more 148 132 0 0 16 0 0 0 * 0 132|| * || Median $32,042 $32,775 $30,771 $27,639 $21,813 $47,344 $23,274 $27,639 * $27,059 $32,909|| Mean $42,514 $43,501 $35,972 $39,204 $37,015 $56,080 $24,990 $34,068 * $34,970 $43,659||___________________________________________________________________________________________________________________________________________________||P76−82/P154A−I/P155A−I/P156A−I/P157A−I. FAMILY AND NONFAMILY INCOME IN 1999 BY RACE OF HOUSEHOLDER; PER CAPITA INCOME IN 1999 BY INDIVIDUAL RACE ||Three Universes: Families, Nonfamily Households, All Persons || Black Amer Indian Nat Hawaiian Other Two or * White Alone +−−−−−−−−−−−|| All White /Af Amer /Alaska Nat Asian /Pac Isl Race More * Hispanic not Hisp.| Nonfamily|| Races Alone Alone Alone Alone Alone Alone Races * or Latino or Latino | Households||Total Families: 12,405 10,656 899 51 400 15 191 193 * 485 10,384 | 9,715|| Less than $10,000 683 494 62 15 68 0 31 13 * 52 473 | 2,383|| $10,000 − $14,999 561 419 44 0 35 0 37 26 * 35 411 | 1,427|| $15,000 − $19,999 750 580 104 3 39 0 7 17 * 46 548 | 1,285|| $20,000 − $24,999 770 631 82 4 32 0 21 0 * 48 604 | 967|| $25,000 − $29,999 904 718 66 0 43 0 52 25 * 86 684 | 757|| $30,000 − $34,999 749 631 78 0 15 0 6 19 * 6 631 | 770|| $35,000 − $39,999 830 721 71 0 20 0 6 12 * 30 703 | 504|| $40,000 − $44,999 716 663 32 0 16 0 3 2 * 31 635 | 322|| $45,000 − $49,999 850 720 90 3 12 8 8 9 * 39 689 | 300|| $50,000 − $59,999 1,277 1,147 62 0 40 0 8 20 * 26 1,129 | 367|| $60,000 − $74,999 1,543 1,415 103 2 9 7 0 7 * 14 1,401 | 306|| $75,000 − $99,999 1,364 1,207 64 24 17 0 9 43 * 44 1,191 | 178|| $100,000 − $124,999 649 604 29 0 13 0 3 0 * 13 594 | 95|| $125,000 − $149,999 335 298 12 0 25 0 0 0 * 15 283 | 38|| $150,000 − $199,999 276 276 0 0 0 0 0 0 * 0 276 | 16|| $200,000 or more 148 132 0 0 16 0 0 0 * 0 132 | 0|| * | || Family Median $46,489 $48,416 $35,964 $65,625 $26,711 $47,344 $24,940 $33,750 * $28,506 $48,773 | N/A|| Family Mean $55,715 N/A N/A N/A N/A N/A N/A N/A * N/A N/A | N/A|| * | || NonFamily Median N/A $19,161 $17,115 $22,222 $15,341 $0 $15,714 $14,844 * $17,216 $19,142 | $18,982|| NonFamily Mean N/A N/A N/A N/A N/A N/A N/A N/A * N/A N/A | $24,600|| * | || Per Capita−All Pers $16,349 $17,043 $13,523 $13,226 $13,762 $13,815 $9,976 $8,022 * $10,940 $17,193 | N/A|+===================================================================================================================================================+Source: Census 2000 Summary File 3 [machine−readable data file]/prepared by the U.S.Census Bureau, 2002 (www.census.gov) 27AUG02: Area 1, Page 9 Profile prepared by the Policy Research Institute (PRI), University of Kansas URL: http://www.ku.edu/pri email: [email protected]
26
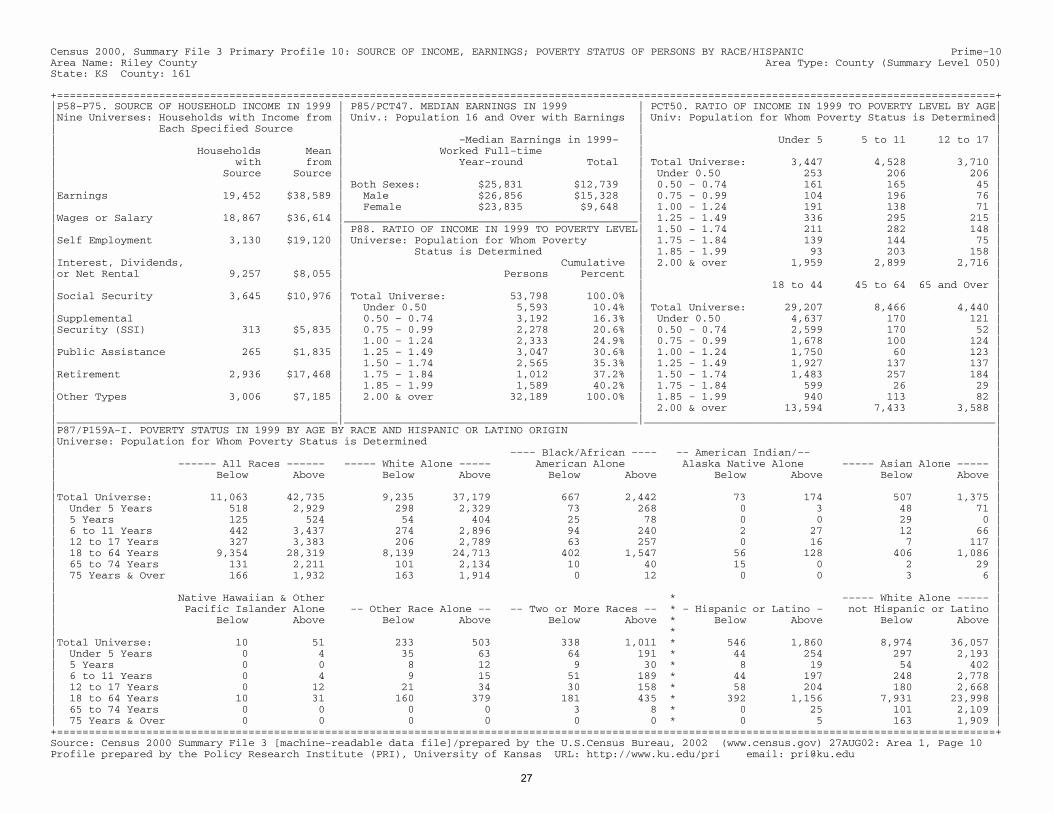
Census 2000, Summary File 3 Primary Profile 10: SOURCE OF INCOME, EARNINGS; POVERTY STATUS OF PERSONS BY RACE/HISPANIC Prime−10Area Name: Riley County Area Type: County (Summary Level 050)State: KS County: 161 +===================================================================================================================================================+|P58−P75. SOURCE OF HOUSEHOLD INCOME IN 1999 | P85/PCT47. MEDIAN EARNINGS IN 1999 | PCT50. RATIO OF INCOME IN 1999 TO POVERTY LEVEL BY AGE||Nine Universes: Households with Income from | Univ.: Population 16 and Over with Earnings | Univ: Population for Whom Poverty Status is Determined|| Each Specified Source | | || | −Median Earnings in 1999− | Under 5 5 to 11 12 to 17 || Households Mean | Worked Full−time | || with from | Year−round Total | Total Universe: 3,447 4,528 3,710 || Source Source | | Under 0.50 253 206 206 || | Both Sexes: $25,831 $12,739 | 0.50 − 0.74 161 165 45 ||Earnings 19,452 $38,589 | Male $26,856 $15,328 | 0.75 − 0.99 104 196 76 || | Female $23,835 $9,648 | 1.00 − 1.24 191 138 71 ||Wages or Salary 18,867 $36,614 |______________________________________________| 1.25 − 1.49 336 295 215 || | P88. RATIO OF INCOME IN 1999 TO POVERTY LEVEL| 1.50 − 1.74 211 282 148 ||Self Employment 3,130 $19,120 | Universe: Population for Whom Poverty | 1.75 − 1.84 139 144 75 || | Status is Determined | 1.85 − 1.99 93 203 158 ||Interest, Dividends, | Cumulative | 2.00 & over 1,959 2,899 2,716 ||or Net Rental 9,257 $8,055 | Persons Percent | || | | 18 to 44 45 to 64 65 and Over ||Social Security 3,645 $10,976 | Total Universe: 53,798 100.0% | || | Under 0.50 5,593 10.4% | Total Universe: 29,207 8,466 4,440 ||Supplemental | 0.50 − 0.74 3,192 16.3% | Under 0.50 4,637 170 121 ||Security (SSI) 313 $5,835 | 0.75 − 0.99 2,278 20.6% | 0.50 − 0.74 2,599 170 52 || | 1.00 − 1.24 2,333 24.9% | 0.75 − 0.99 1,678 100 124 ||Public Assistance 265 $1,835 | 1.25 − 1.49 3,047 30.6% | 1.00 − 1.24 1,750 60 123 || | 1.50 − 1.74 2,565 35.3% | 1.25 − 1.49 1,927 137 137 ||Retirement 2,936 $17,468 | 1.75 − 1.84 1,012 37.2% | 1.50 − 1.74 1,483 257 184 || | 1.85 − 1.99 1,589 40.2% | 1.75 − 1.84 599 26 29 ||Other Types 3,006 $7,185 | 2.00 & over 32,189 100.0% | 1.85 − 1.99 940 113 82 || | | 2.00 & over 13,594 7,433 3,588 ||____________________________________________|______________________________________________|_______________________________________________________||P87/P159A−I. POVERTY STATUS IN 1999 BY AGE BY RACE AND HISPANIC OR LATINO ORIGIN ||Universe: Population for Whom Poverty Status is Determined || −−−− Black/African −−−− −− American Indian/−− || −−−−−− All Races −−−−−− −−−−− White Alone −−−−− American Alone Alaska Native Alone −−−−− Asian Alone −−−−− || Below Above Below Above Below Above Below Above Below Above || ||Total Universe: 11,063 42,735 9,235 37,179 667 2,442 73 174 507 1,375 || Under 5 Years 518 2,929 298 2,329 73 268 0 3 48 71 || 5 Years 125 524 54 404 25 78 0 0 29 0 || 6 to 11 Years 442 3,437 274 2,896 94 240 2 27 12 66 || 12 to 17 Years 327 3,383 206 2,789 63 257 0 16 7 117 || 18 to 64 Years 9,354 28,319 8,139 24,713 402 1,547 56 128 406 1,086 || 65 to 74 Years 131 2,211 101 2,134 10 40 15 0 2 29 || 75 Years & Over 166 1,932 163 1,914 0 12 0 0 3 6 || || Native Hawaiian & Other * −−−−− White Alone −−−−− || Pacific Islander Alone −− Other Race Alone −− −− Two or More Races −− * − Hispanic or Latino − not Hispanic or Latino || Below Above Below Above Below Above * Below Above Below Above || * ||Total Universe: 10 51 233 503 338 1,011 * 546 1,860 8,974 36,057 || Under 5 Years 0 4 35 63 64 191 * 44 254 297 2,193 || 5 Years 0 0 8 12 9 30 * 8 19 54 402 || 6 to 11 Years 0 4 9 15 51 189 * 44 197 248 2,778 || 12 to 17 Years 0 12 21 34 30 158 * 58 204 180 2,668 || 18 to 64 Years 10 31 160 379 181 435 * 392 1,156 7,931 23,998 || 65 to 74 Years 0 0 0 0 3 8 * 0 25 101 2,109 || 75 Years & Over 0 0 0 0 0 0 * 0 5 163 1,909 |+===================================================================================================================================================+Source: Census 2000 Summary File 3 [machine−readable data file]/prepared by the U.S.Census Bureau, 2002 (www.census.gov) 27AUG02: Area 1, Page 10 Profile prepared by the Policy Research Institute (PRI), University of Kansas URL: http://www.ku.edu/pri email: [email protected]
27
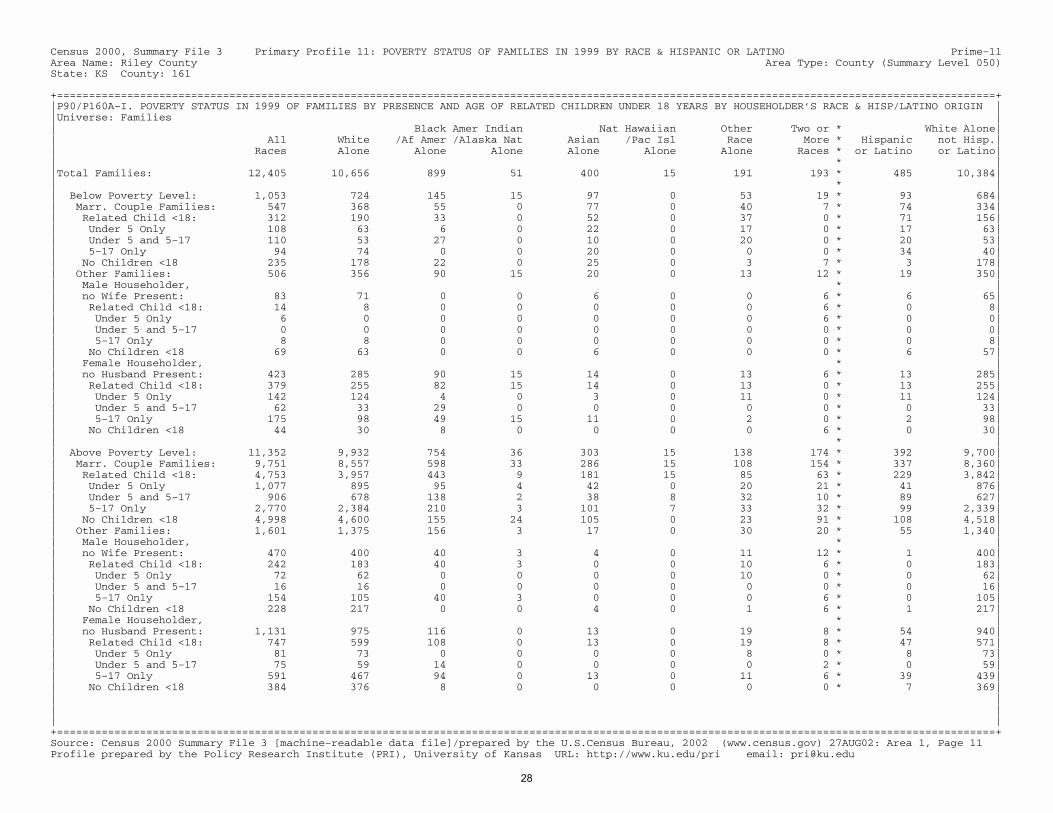
Census 2000, Summary File 3 Primary Profile 11: POVERTY STATUS OF FAMILIES IN 1999 BY RACE & HISPANIC OR LATINO Prime−11Area Name: Riley County Area Type: County (Summary Level 050)State: KS County: 161 +===================================================================================================================================================+|P90/P160A−I. POVERTY STATUS IN 1999 OF FAMILIES BY PRESENCE AND AGE OF RELATED CHILDREN UNDER 18 YEARS BY HOUSEHOLDER�S RACE & HISP/LATINO ORIGIN ||Universe: Families || Black Amer Indian Nat Hawaiian Other Two or * White Alone|| All White /Af Amer /Alaska Nat Asian /Pac Isl Race More * Hispanic not Hisp.|| Races Alone Alone Alone Alone Alone Alone Races * or Latino or Latino|| * ||Total Families: 12,405 10,656 899 51 400 15 191 193 * 485 10,384|| * || Below Poverty Level: 1,053 724 145 15 97 0 53 19 * 93 684|| Marr. Couple Families: 547 368 55 0 77 0 40 7 * 74 334|| Related Child <18: 312 190 33 0 52 0 37 0 * 71 156|| Under 5 Only 108 63 6 0 22 0 17 0 * 17 63|| Under 5 and 5−17 110 53 27 0 10 0 20 0 * 20 53|| 5−17 Only 94 74 0 0 20 0 0 0 * 34 40|| No Children <18 235 178 22 0 25 0 3 7 * 3 178|| Other Families: 506 356 90 15 20 0 13 12 * 19 350|| Male Householder, * || no Wife Present: 83 71 0 0 6 0 0 6 * 6 65|| Related Child <18: 14 8 0 0 0 0 0 6 * 0 8|| Under 5 Only 6 0 0 0 0 0 0 6 * 0 0|| Under 5 and 5−17 0 0 0 0 0 0 0 0 * 0 0|| 5−17 Only 8 8 0 0 0 0 0 0 * 0 8|| No Children <18 69 63 0 0 6 0 0 0 * 6 57|| Female Householder, * || no Husband Present: 423 285 90 15 14 0 13 6 * 13 285|| Related Child <18: 379 255 82 15 14 0 13 0 * 13 255|| Under 5 Only 142 124 4 0 3 0 11 0 * 11 124|| Under 5 and 5−17 62 33 29 0 0 0 0 0 * 0 33|| 5−17 Only 175 98 49 15 11 0 2 0 * 2 98|| No Children <18 44 30 8 0 0 0 0 6 * 0 30|| * || Above Poverty Level: 11,352 9,932 754 36 303 15 138 174 * 392 9,700|| Marr. Couple Families: 9,751 8,557 598 33 286 15 108 154 * 337 8,360|| Related Child <18: 4,753 3,957 443 9 181 15 85 63 * 229 3,842|| Under 5 Only 1,077 895 95 4 42 0 20 21 * 41 876|| Under 5 and 5−17 906 678 138 2 38 8 32 10 * 89 627|| 5−17 Only 2,770 2,384 210 3 101 7 33 32 * 99 2,339|| No Children <18 4,998 4,600 155 24 105 0 23 91 * 108 4,518|| Other Families: 1,601 1,375 156 3 17 0 30 20 * 55 1,340|| Male Householder, * || no Wife Present: 470 400 40 3 4 0 11 12 * 1 400|| Related Child <18: 242 183 40 3 0 0 10 6 * 0 183|| Under 5 Only 72 62 0 0 0 0 10 0 * 0 62|| Under 5 and 5−17 16 16 0 0 0 0 0 0 * 0 16|| 5−17 Only 154 105 40 3 0 0 0 6 * 0 105|| No Children <18 228 217 0 0 4 0 1 6 * 1 217|| Female Householder, * || no Husband Present: 1,131 975 116 0 13 0 19 8 * 54 940|| Related Child <18: 747 599 108 0 13 0 19 8 * 47 571|| Under 5 Only 81 73 0 0 0 0 8 0 * 8 73|| Under 5 and 5−17 75 59 14 0 0 0 0 2 * 0 59|| 5−17 Only 591 467 94 0 13 0 11 6 * 39 439|| No Children <18 384 376 8 0 0 0 0 0 * 7 369|| || || |+===================================================================================================================================================+Source: Census 2000 Summary File 3 [machine−readable data file]/prepared by the U.S.Census Bureau, 2002 (www.census.gov) 27AUG02: Area 1, Page 11 Profile prepared by the Policy Research Institute (PRI), University of Kansas URL: http://www.ku.edu/pri email: [email protected]
28