Embed Size (px)
Citation preview
Required Report - public distribution
Date: 10/3/2005
GAIN Report Number: FR5065
FR5065
France
Fishery Products
Annual
2005 Approved by: Elizabeth B. Berry U.S. Embassy
Prepared by: Marie-Cécile Hénard Report Highlights: France is a major consumer of seafood products and a net importer of many seafood products. In 2004, the best export opportunities for U.S. seafood were Alaska pollack fillets, surimi base, salmon, lobster, and scallops. In 2004, salmon remained French consumers' preferred fish. U.S. salmon exports to France in 2004 were favored by the U.S. dollar/euro exchange rate and a French media campaign against farm-raised European salmon. The U.S. market share of groundfish fillet products increased from 7 percent to 9 percent in 2004 and the potential for continued growth remains positive. The United States was France's largest supplier of live lobster in 2004 ahead of Canadian lobster. The United States has become a major supplier of scallops to France and this trend continues in 2005. France is the largest market for surimi in Europe and the United States is France's leading supplier of surimi base.
Includes PSD Changes: Yes Includes Trade Matrix: Yes
Annual Report Paris [FR1]
[FR]
USDA Foreign Agricultural Service
GAIN ReportGlobal Agriculture Information Network
Template Version 2.09
GAIN Report - FR5065 Page 2 of 29
UNCLASSIFIED USDA Foreign Agricultural Service
Table of Contents Executive Summary .............................................................................................3 Situation and Outlook..........................................................................................3 Section I: Total Fishery Product ...........................................................................5
Production.......................................................................................................... 5 Consumption ...................................................................................................... 6 Trade ................................................................................................................ 7 Marketing .......................................................................................................... 8
Trade Shows.................................................................................................... 8 U.S. Seafood Cooperators in France ..................................................................... 9 Marketing Activities........................................................................................... 9
Section II: Salmon ........................................................................................... 11 Production........................................................................................................ 11 Consumption .................................................................................................... 11 Trade .............................................................................................................. 13 Policy.............................................................................................................. 14
Section III: Groundfish Fillets ........................................................................... 15 Production........................................................................................................ 15 Consumption .................................................................................................... 16
French Household Consumption: ....................................................................... 16 HRI Consumption ........................................................................................... 16
Trade .............................................................................................................. 16 Section IV: Lobster........................................................................................... 19
Production........................................................................................................ 19 Consumption .................................................................................................... 20 Trade .............................................................................................................. 20
Section V: Scallops ........................................................................................... 22 Production........................................................................................................ 22 Consumption .................................................................................................... 23 Trade .............................................................................................................. 23
Section VI: Surimi ............................................................................................. 25 Production........................................................................................................ 25 Consumption .................................................................................................... 26 Trade .............................................................................................................. 28
GAIN Report - FR5065 Page 3 of 29
UNCLASSIFIED USDA Foreign Agricultural Service
Executive Summary France is a major consumer of seafood products and a net importer of many seafood products. In 2004, the best export opportunities for U.S. seafood were Alaska pollack fillets, surimi base, salmon, lobster, and scallops. In 2004, salmon remained French consumers’ preferred fish. U.S. salmon exports to France in 2004 were favored by the U.S. dollar/euro exchange rate and a French media campaign against farm-raised European salmon. The U.S. market share of groundfish fillet products increased from 7 percent to 9 percent in 2004 and the potential for continued growth remains positive. The United States was France's largest supplier of live lobster in 2004 ahead of Canadian lobster. The United States has become a major supplier of scallops to France and this trend continues in 2005. France is the largest market for surimi in Europe and the United States is France's leading supplier of surimi base.
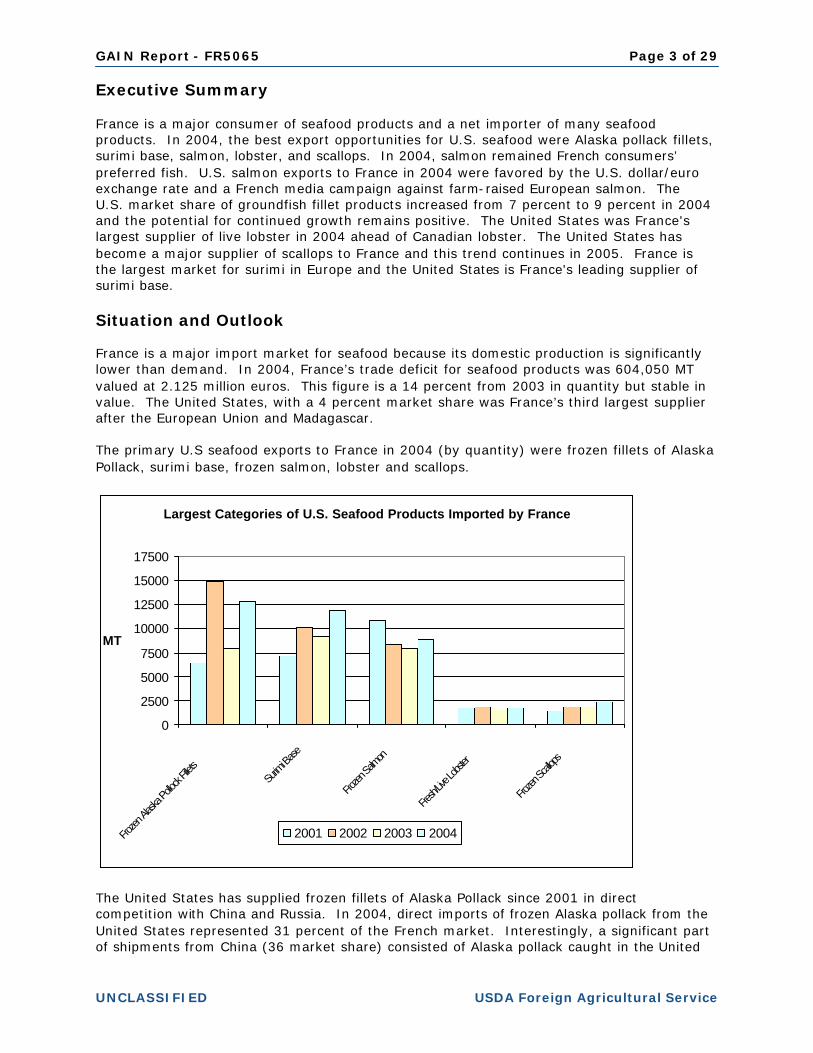
Situation and Outlook France is a major import market for seafood because its domestic production is significantly lower than demand. In 2004, France’s trade deficit for seafood products was 604,050 MT valued at 2.125 million euros. This figure is a 14 percent from 2003 in quantity but stable in value. The United States, with a 4 percent market share was France’s third largest supplier after the European Union and Madagascar. The primary U.S seafood exports to France in 2004 (by quantity) were frozen fillets of Alaska Pollack, surimi base, frozen salmon, lobster and scallops.
Largest Categories of U.S. Seafood Products Imported by France
0
2500
5000
7500
10000
12500
15000
17500
Frozen
Alask
a Pollo
ck Fille
tsSu
rimi Ba
se
Frozen
Salmon
Fresh/
Live L
obster
Frozen
Scallo
ps
MT
2001 2002 2003 2004
The United States has supplied frozen fillets of Alaska Pollack since 2001 in direct competition with China and Russia. In 2004, direct imports of frozen Alaska pollack from the United States represented 31 percent of the French market. Interestingly, a significant part of shipments from China (36 market share) consisted of Alaska pollack caught in the United
GAIN Report - FR5065 Page 4 of 29
UNCLASSIFIED USDA Foreign Agricultural Service
States, exported to China for cutting, and re-exported to France. In 2005, with the recent reduction of Total Authorized Catch (TAC) set by the EU authorities in 2005 for pollack (22 percent decline from 2004), the potential for increased market share for U.S. Pollack is very positive. France is the largest European market for surimi base for further processing. The French market for surimi continued to expand in 2004 but less rapidly than the previous year’s annual expansion of 10 percent on average. This slowing down in the expansion of the French surimi market resulted from increased sales by hard discounters. The United States is France’s largest supplier of surimi base, with 65 percent market share in 2004. U.S. surimi base principally competes in the French market with Chilean products. In addition, France has imported increasing quantities of processed surimi products from Lithuania since 2001. That country now has 66 percent of the French market, due to the development of the industrial surimi processor, Viciunai. France is the largest market for salmon in Europe, and with 13 percent market share, it is the French consumers’ favorite finfish specie. In France, Alaska salmon (8 percent in 2004) competes with Norwegian (42 percent), Scottish (23 percent) and Irish salmon (8 percent). Price and seasonality of supply are drawbacks of Alaska salmon compared to farm-raised European salmon. However, the French media campaign against farm-raised fish benefited imports of U.S. salmon in 2004. The United States is, by far, France’s largest supplier of lobster, and more specifically live lobster. Canadian lobster is the strongest competitor to U.S. lobster on the French market, although most of Canadian products are imported frozen into France. In 2004, the market share for U.S. products on the French market was 24 percent, ahead of Canadian lobster (19 percent). The French market for scallops is growing, and the United States is now a major supplier to France, with 11 percent market share in 2004. During the first half of 2005, U.S. scallop imports increased from the same period in 2004. U.S. products compete principally against products from Argentina and Chile on the French market. Acronyms used in this report are the following: ADISUR: French surimi organization GIRA Food Service: Food service survey agency MinAg: French Ministry of Agriculture, Food, Fisheries and Rural Affairs OFIMER: French seafood board SECODIP: Consumer survey agency
GAIN Report - FR5065 Page 5 of 29
UNCLASSIFIED USDA Foreign Agricultural Service
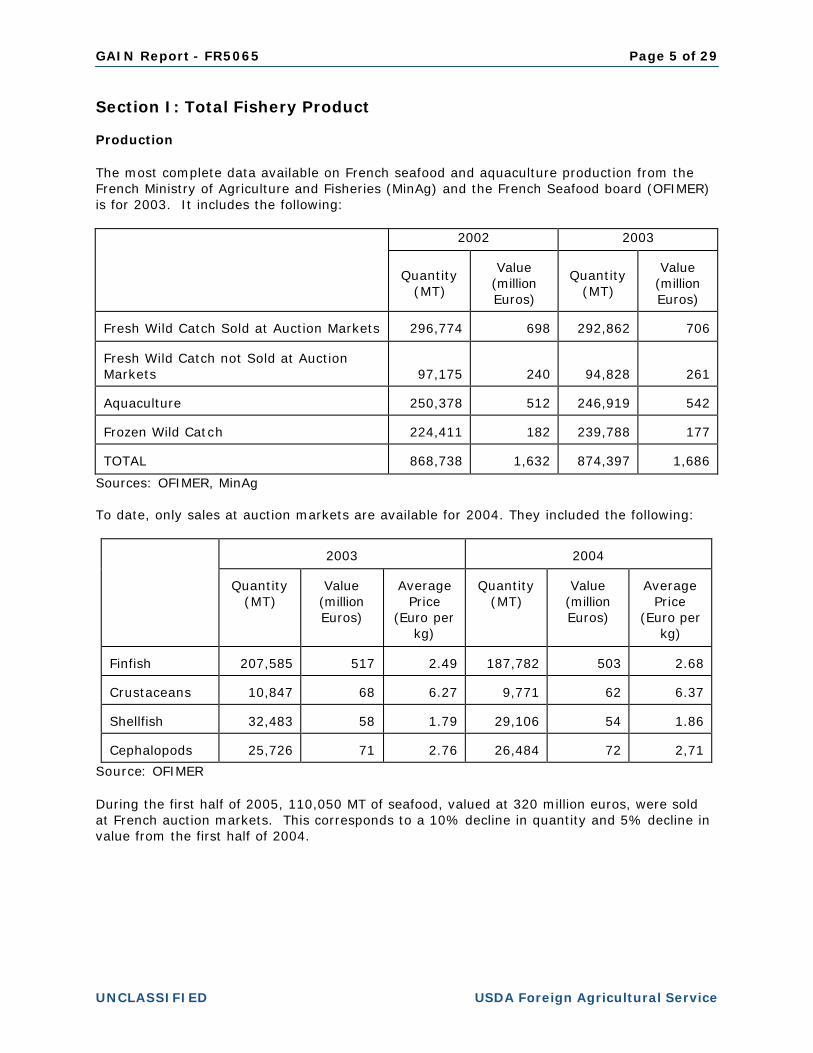
Section I: Total Fishery Product Production The most complete data available on French seafood and aquaculture production from the French Ministry of Agriculture and Fisheries (MinAg) and the French Seafood board (OFIMER) is for 2003. It includes the following:
2002 2003
Quantity
(MT)
Value
(million Euros)
Quantity
(MT)
Value
(million Euros)
Fresh Wild Catch Sold at Auction Markets 296,774 698 292,862 706 Fresh Wild Catch not Sold at Auction Markets 97,175 240 94,828 261 Aquaculture 250,378 512 246,919 542 Frozen Wild Catch 224,411 182 239,788 177 TOTAL 868,738 1,632 874,397 1,686
Sources: OFIMER, MinAg To date, only sales at auction markets are available for 2004. They included the following:
2003
2004
Quantity
(MT)
Value
(million Euros)
Average
Price (Euro per
kg)
Quantity
(MT)
Value
(million Euros)
Average
Price (Euro per
kg) Finfish 207,585 517 2.49 187,782 503 2.68 Crustaceans 10,847 68 6.27 9,771 62 6.37 Shellfish 32,483 58 1.79 29,106 54 1.86 Cephalopods 25,726 71 2.76 26,484 72 2,71
Source: OFIMER During the first half of 2005, 110,050 MT of seafood, valued at 320 million euros, were sold at French auction markets. This corresponds to a 10% decline in quantity and 5% decline in value from the first half of 2004.
GAIN Report - FR5065 Page 6 of 29
UNCLASSIFIED USDA Foreign Agricultural Service
Canned Fishery Products France is a major producer of canned fishery products. As indicated in the following table, the major species canned in France are tuna, sardines and mackerel.
2002 2003 Raw material used (whole fish equivalent, MT)
Processed Products (net weight, MT)
Raw material used (whole fish equivalent, MT)
Processed Products (net weight, MT)
Sardines 18,774 9,956 17,417 8,782 Tuna 39,960 43,005 43,277 46,272 Mackerel 33,885 21,305 26,584 16,283 Salmon/Trout 702 223 727 302 Other (incl. Herring, shellfish and other)
6,241 9,187 4,187 9,164
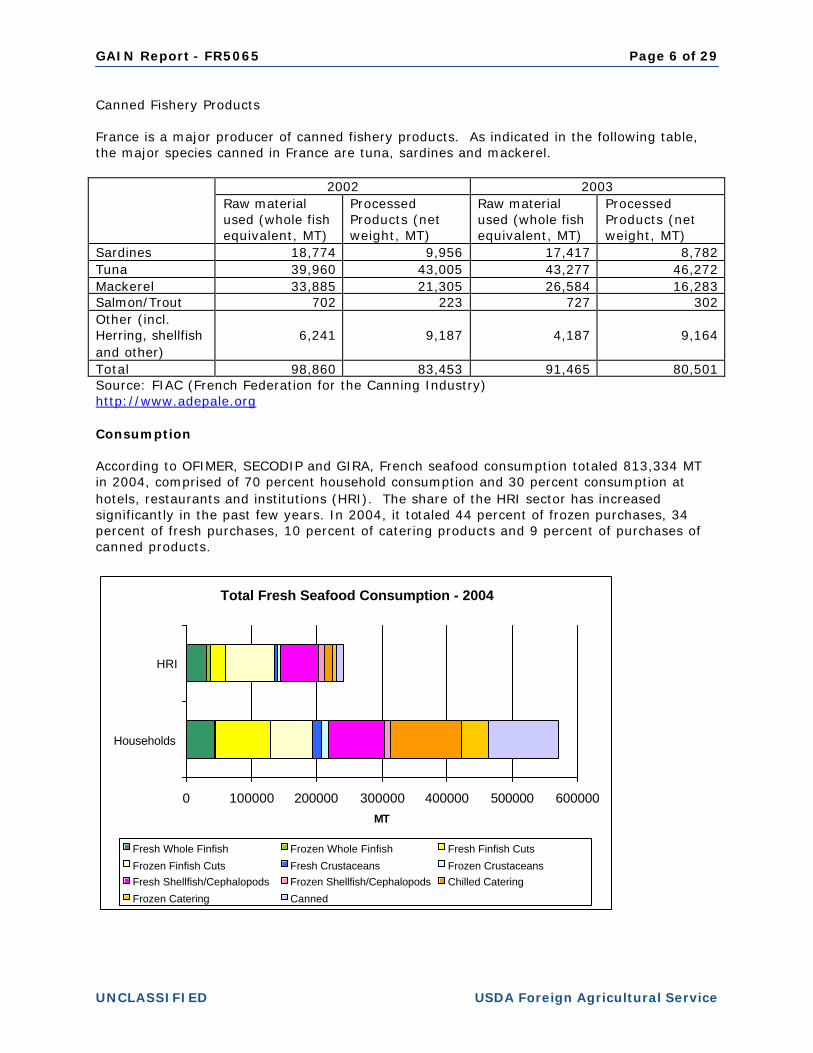
Total 98,860 83,453 91,465 80,501 Source: FIAC (French Federation for the Canning Industry) http://www.adepale.org Consumption According to OFIMER, SECODIP and GIRA, French seafood consumption totaled 813,334 MT in 2004, comprised of 70 percent household consumption and 30 percent consumption at hotels, restaurants and institutions (HRI). The share of the HRI sector has increased significantly in the past few years. In 2004, it totaled 44 percent of frozen purchases, 34 percent of fresh purchases, 10 percent of catering products and 9 percent of purchases of canned products.
Total Fresh Seafood Consumption - 2004
0 100000 200000 300000 400000 500000 600000
Households
HRI
MT
Fresh Whole Finfish Frozen Whole Finfish Fresh Finfish Cuts
Frozen Finfish Cuts Fresh Crustaceans Frozen CrustaceansFresh Shellfish/Cephalopods Frozen Shellfish/Cephalopods Chilled Catering
Frozen Catering Canned
GAIN Report - FR5065 Page 7 of 29
UNCLASSIFIED USDA Foreign Agricultural Service
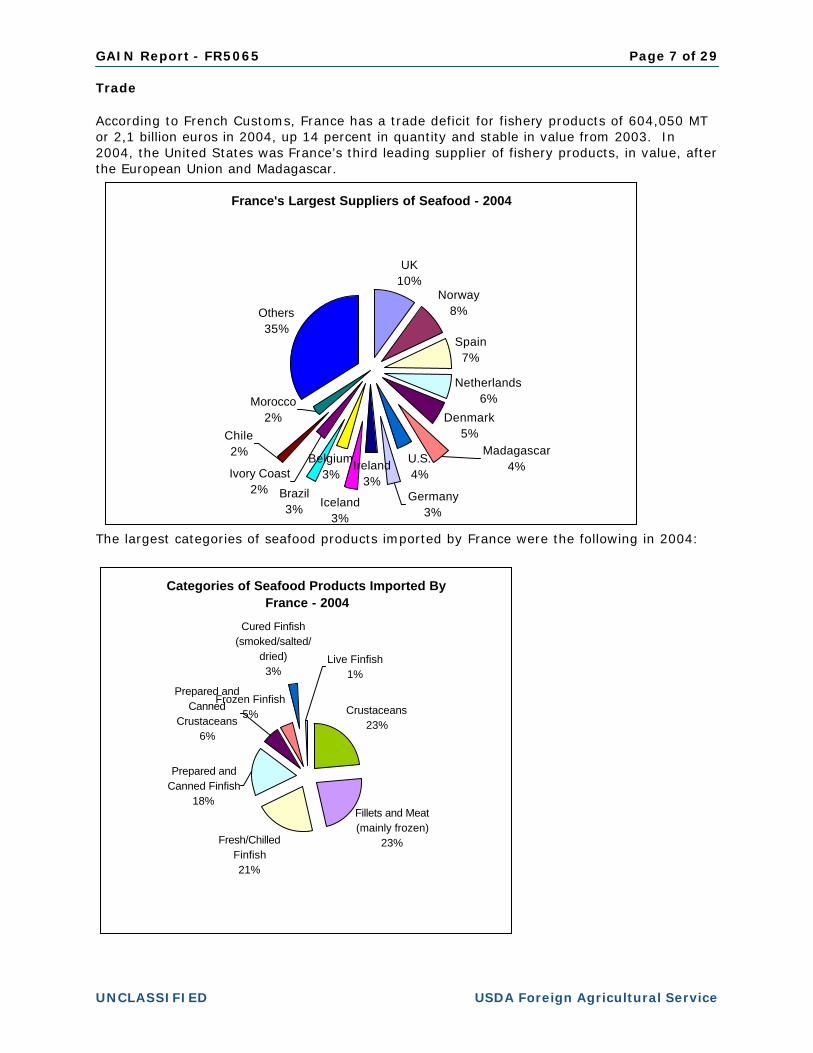
Trade According to French Customs, France has a trade deficit for fishery products of 604,050 MT or 2,1 billion euros in 2004, up 14 percent in quantity and stable in value from 2003. In 2004, the United States was France’s third leading supplier of fishery products, in value, after the European Union and Madagascar.
France's Largest Suppliers of Seafood - 2004
UK10%
Norway8%
Spain7%
Netherlands6%
Denmark5%
U.S.4%
Ireland3%
Iceland3%
Brazil3%
Others35%
Madagascar4%
Germany3%
Belgium3%
Morocco2%
Ivory Coast2%
Chile2%
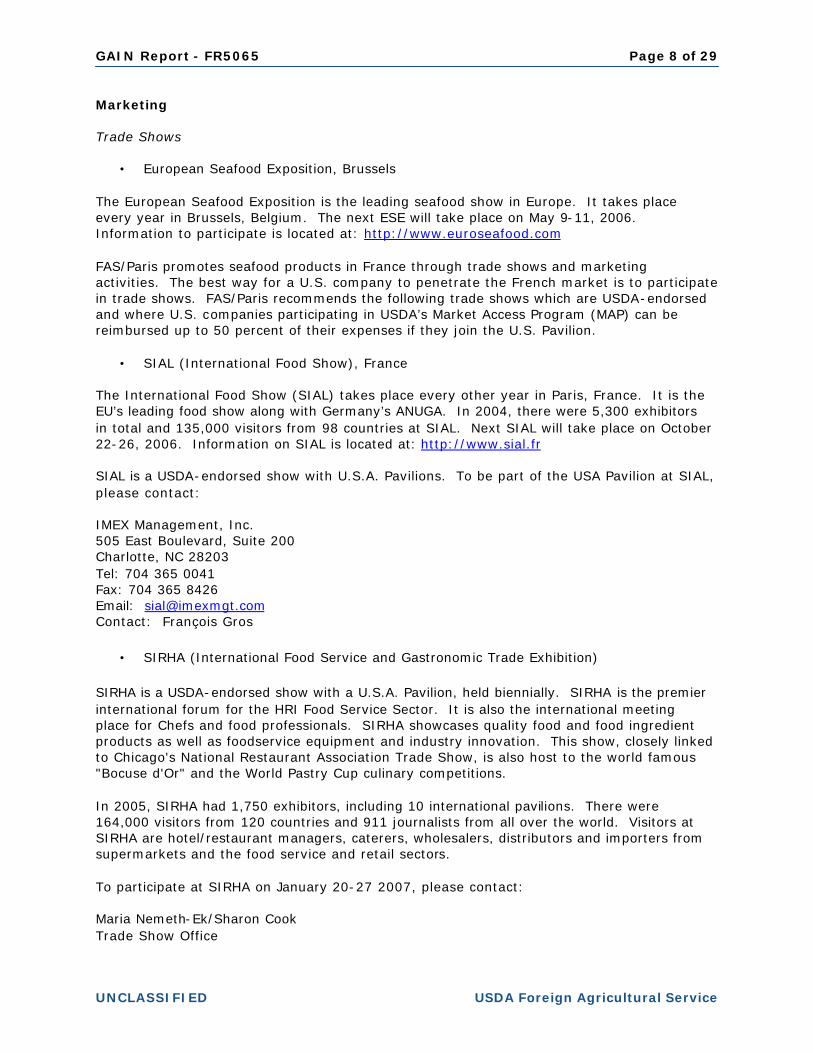
The largest categories of seafood products imported by France were the following in 2004:
Categories of Seafood Products Imported By France - 2004
Crustaceans23%
Fillets and Meat (mainly frozen)
23%Fresh/Chilled Finfish21%
Frozen Finfish5%
Cured Finfish (smoked/salted/
dried)3%
Prepared and Canned Finfish
18%
Prepared and Canned
Crustaceans6%
Live Finfish1%
GAIN Report - FR5065 Page 8 of 29
UNCLASSIFIED USDA Foreign Agricultural Service
Marketing Trade Shows
• European Seafood Exposition, Brussels
The European Seafood Exposition is the leading seafood show in Europe. It takes place every year in Brussels, Belgium. The next ESE will take place on May 9-11, 2006. Information to participate is located at: http://www.euroseafood.com FAS/Paris promotes seafood products in France through trade shows and marketing activities. The best way for a U.S. company to penetrate the French market is to participate in trade shows. FAS/Paris recommends the following trade shows which are USDA-endorsed and where U.S. companies participating in USDA’s Market Access Program (MAP) can be reimbursed up to 50 percent of their expenses if they join the U.S. Pavilion.
• SIAL (International Food Show), France
The International Food Show (SIAL) takes place every other year in Paris, France. It is the EU’s leading food show along with Germany’s ANUGA. In 2004, there were 5,300 exhibitors in total and 135,000 visitors from 98 countries at SIAL. Next SIAL will take place on October 22-26, 2006. Information on SIAL is located at: http://www.sial.fr SIAL is a USDA-endorsed show with U.S.A. Pavilions. To be part of the USA Pavilion at SIAL, please contact: IMEX Management, Inc. 505 East Boulevard, Suite 200 Charlotte, NC 28203 Tel: 704 365 0041 Fax: 704 365 8426 Email: [email protected] Contact: François Gros
• SIRHA (International Food Service and Gastronomic Trade Exhibition) SIRHA is a USDA-endorsed show with a U.S.A. Pavilion, held biennially. SIRHA is the premier international forum for the HRI Food Service Sector. It is also the international meeting place for Chefs and food professionals. SIRHA showcases quality food and food ingredient products as well as foodservice equipment and industry innovation. This show, closely linked to Chicago's National Restaurant Association Trade Show, is also host to the world famous "Bocuse d'Or" and the World Pastry Cup culinary competitions. In 2005, SIRHA had 1,750 exhibitors, including 10 international pavilions. There were 164,000 visitors from 120 countries and 911 journalists from all over the world. Visitors at SIRHA are hotel/restaurant managers, caterers, wholesalers, distributors and importers from supermarkets and the food service and retail sectors. To participate at SIRHA on January 20-27 2007, please contact: Maria Nemeth-Ek/Sharon Cook Trade Show Office
GAIN Report - FR5065 Page 9 of 29
UNCLASSIFIED USDA Foreign Agricultural Service
USDA - FAS 1400 Independence Ave., SW - Stop 1052 Room 4939 - South Building Washington, D.C. 20250-1052 Tel: (202) 720 3623 Fax: (202) 690 4374 Email: [email protected] [email protected] or: SEPELCOM Marie-Odile Fondeur Avenue Louise Bleriot - BP 87 69683 Chassieu Cedex Tel: (33-4) 72 22 3241 Fax: (33-4) 72 22 3218 Email: [email protected] Internet: http://www.sirha.com/ U.S. Seafood Cooperators in France ASMI and Food Export USA, representing seafood of the East Coast, is represented in France by MARKONSULT 58, rue Pottier 78150 Le Chesnay Tel: (33-1) 39 23 20 07 Fax: (33-1) 39 23 20 17 [email protected] East Coast Seafood France SARL (U.S. lobster) Dominique Moreau 1, rue de la Corderie 94586 Rungis Cedex tel: (33-1) 49 78 92 54 fax: (33-1) 46 86 35 74 [email protected] FAS/Paris and the State Regional Trade Groups (SUSTA, WUSATA, Food-Export-USA and MIATCO) conduct promotional activities and buyer missions for seafood products in France. For more information on these activities, please visit our website or contact FAS/Paris directly. For additional information on above trade shows and activities, please contact FAS/Paris at: [email protected] or visit our website at: http://www.amb-usa.fr/fas/hfas.htm Marketing Activities The upcoming marketing activities organized by FAS/Paris in cooperation with U.S. Trade Associations and State Regional Trade Groups to promote seafood products in France are the following:
GAIN Report - FR5065 Page 10 of 29
UNCLASSIFIED USDA Foreign Agricultural Service
US Food Service Promotion "Flavors of America" (June 2006): the promotion will entice the French food service trade (hotels/restaurants and institutions) and media to discover U.S. food products, including seafood, under the theme of Flavors of America. This is a multi-cooperator project targeting food service trade, brokers, buyers, importers, distributors, cooking schools and chefs from leading restaurants, as well as the specialized food press. Seafood Initiative Promotion with Auchan Supermarket Stores (July/September 2006): the promotion will aim to educate French consumers about U.S. seafood and to increase sales of fresh and frozen seafood, complementary products, and methods of preparation from all regions of the United States. The operation will be the "engine" for the promotion through Agence MBI (Auchan special promotions Agency). "Western Regional Cuisine" A Food and Food Service Promotion with Casino and Casino Cafeterias (date to be determined): "Western Cuisine" theme menu/dish promotion with Casino cafeterias in their 230 stores throughout France. The promotion is designed to educate French consumers about Western Regional cuisine, food and flavors. The promotion will be coupled with a retail promotion of products that tie-in to the promotion and will be available for purchase in Casino supermarkets. A variety of products from the West coast of the United States will be offered to Casino, including seafood.
GAIN Report - FR5065 Page 11 of 29
UNCLASSIFIED USDA Foreign Agricultural Service
Section II: Salmon
PSD Table
Country France
Commodity Salmon, Whole/Eviscerated (MT)
2003 Revised 2004 Estimate 2005 Forecast
USDA Official [Old] Post
Estimate[New]
USDA Official [Old]
Post Estimate[New]
USDA Official [Old]
Post Estimate[New]
Market Year Begin 01/2003 01/2004 01/2005
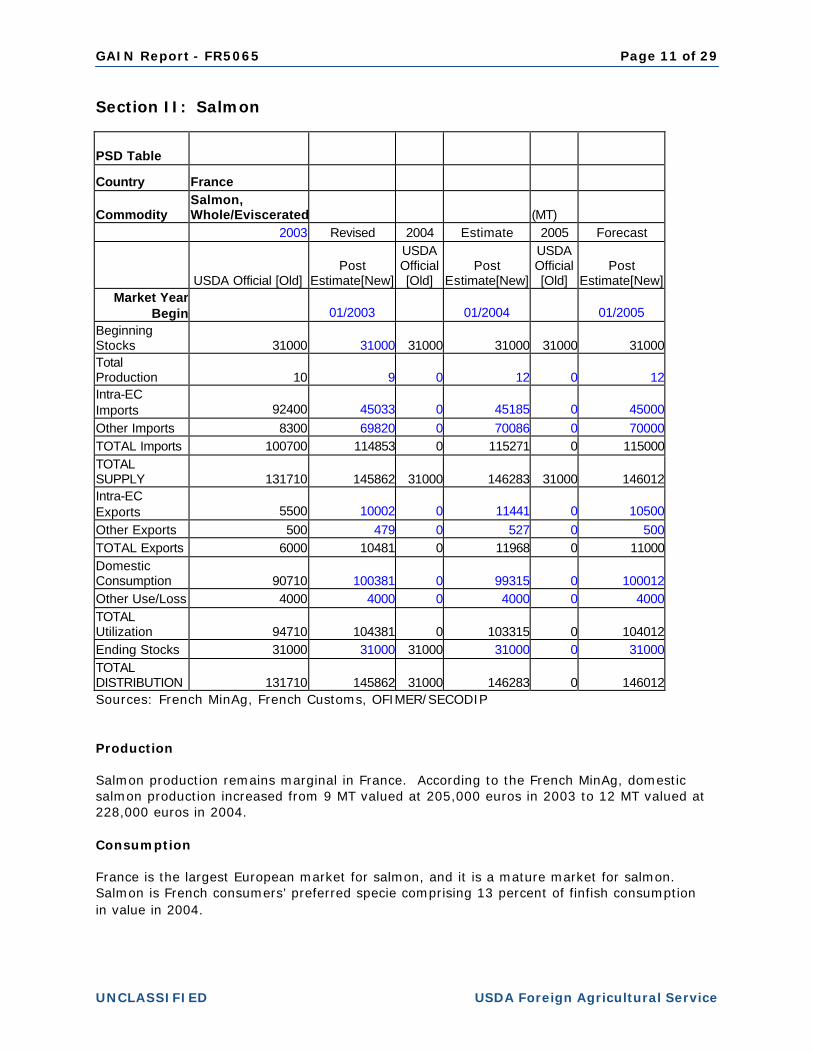
Beginning Stocks 31000 31000 31000 31000 31000 31000Total Production 10 9 0 12 0 12Intra-EC Imports 92400 45033 0 45185 0 45000Other Imports 8300 69820 0 70086 0 70000TOTAL Imports 100700 114853 0 115271 0 115000TOTAL SUPPLY 131710 145862 31000 146283 31000 146012Intra-EC Exports 5500 10002 0 11441 0 10500Other Exports 500 479 0 527 0 500TOTAL Exports 6000 10481 0 11968 0 11000Domestic Consumption 90710 100381 0 99315 0 100012Other Use/Loss 4000 4000 0 4000 0 4000TOTAL Utilization 94710 104381 0 103315 0 104012Ending Stocks 31000 31000 31000 31000 0 31000TOTAL DISTRIBUTION 131710 145862 31000 146283 0 146012Sources: French MinAg, French Customs, OFIMER/SECODIP Production Salmon production remains marginal in France. According to the French MinAg, domestic salmon production increased from 9 MT valued at 205,000 euros in 2003 to 12 MT valued at 228,000 euros in 2004. Consumption France is the largest European market for salmon, and it is a mature market for salmon. Salmon is French consumers’ preferred specie comprising 13 percent of finfish consumption in value in 2004.
GAIN Report - FR5065 Page 12 of 29
UNCLASSIFIED USDA Foreign Agricultural Service
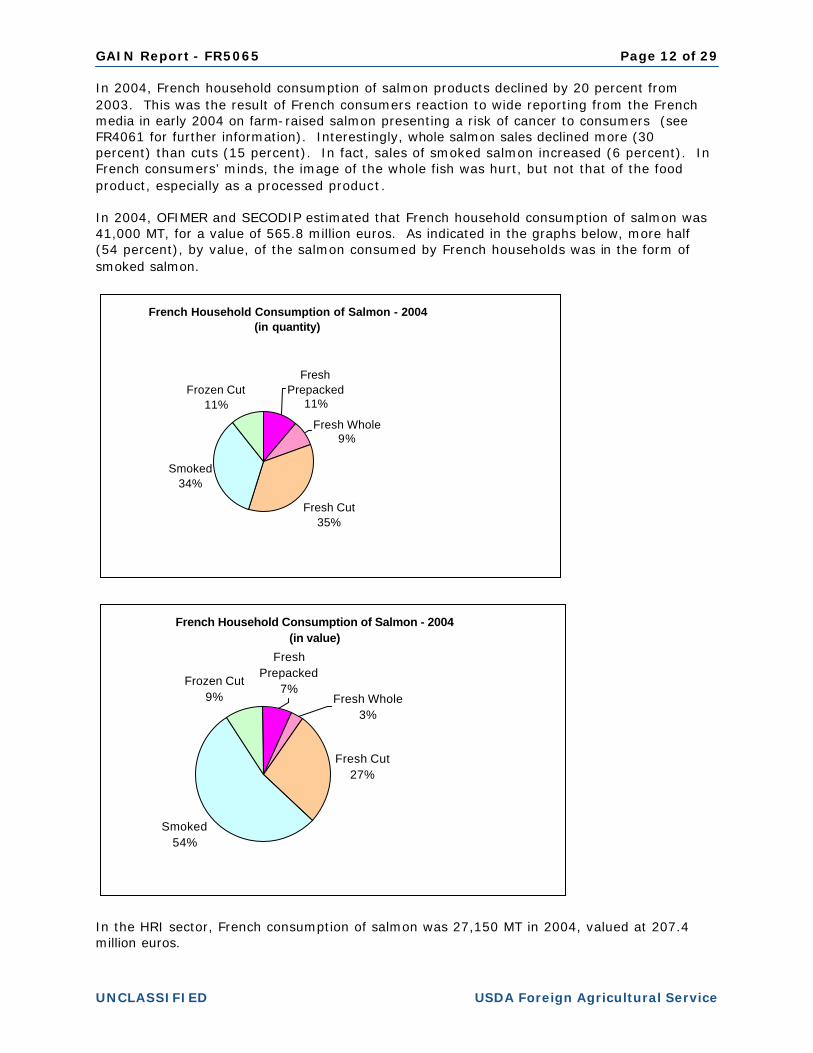
In 2004, French household consumption of salmon products declined by 20 percent from 2003. This was the result of French consumers reaction to wide reporting from the French media in early 2004 on farm-raised salmon presenting a risk of cancer to consumers (see FR4061 for further information). Interestingly, whole salmon sales declined more (30 percent) than cuts (15 percent). In fact, sales of smoked salmon increased (6 percent). In French consumers’ minds, the image of the whole fish was hurt, but not that of the food product, especially as a processed product. In 2004, OFIMER and SECODIP estimated that French household consumption of salmon was 41,000 MT, for a value of 565.8 million euros. As indicated in the graphs below, more half (54 percent), by value, of the salmon consumed by French households was in the form of smoked salmon.
French Household Consumption of Salmon - 2004 (in quantity)
Fresh Prepacked
11%
Fresh Whole9%
Fresh Cut35%
Smoked34%
Frozen Cut11%
French Household Consumption of Salmon - 2004 (in value)
Fresh Cut27%
Smoked54%
Frozen Cut9% Fresh Whole
3%
Fresh Prepacked
7%
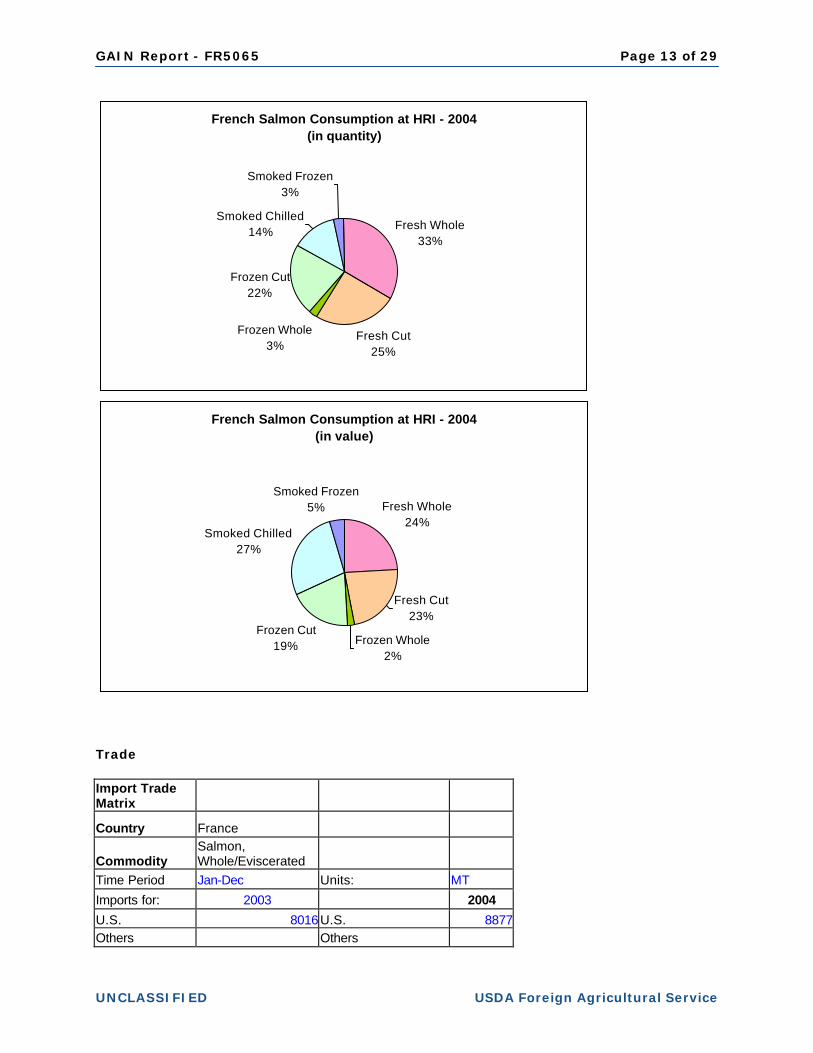
In the HRI sector, French consumption of salmon was 27,150 MT in 2004, valued at 207.4 million euros.
GAIN Report - FR5065 Page 13 of 29
UNCLASSIFIED USDA Foreign Agricultural Service
French Salmon Consumption at HRI - 2004(in quantity)
Fresh Whole33%
Fresh Cut25%
Frozen Whole3%
Frozen Cut22%
Smoked Chilled14%
Smoked Frozen3%
French Salmon Consumption at HRI - 2004(in value)
Fresh Whole24%
Fresh Cut23%
Frozen Whole2%
Frozen Cut19%
Smoked Chilled27%
Smoked Frozen5%
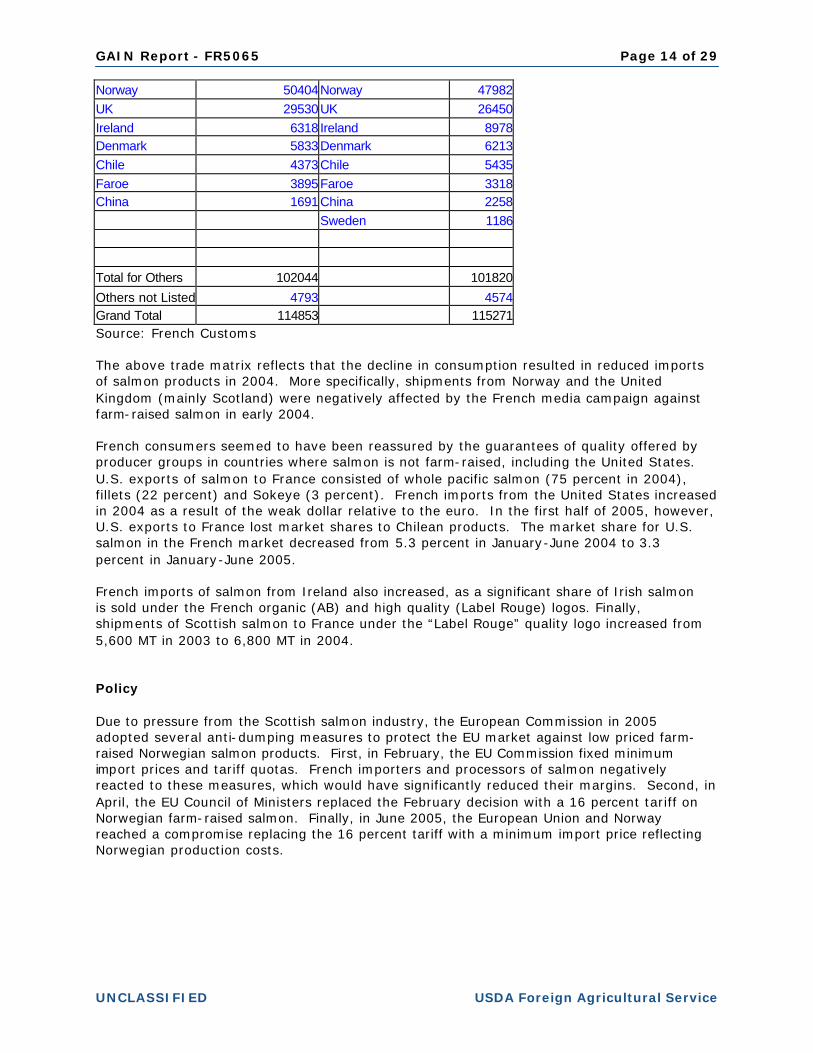
Trade Import Trade Matrix
Country France
Commodity Salmon, Whole/Eviscerated
Time Period Jan-Dec Units: MT
Imports for: 2003 2004
U.S. 8016U.S. 8877Others Others
GAIN Report - FR5065 Page 14 of 29
UNCLASSIFIED USDA Foreign Agricultural Service
Norway 50404Norway 47982UK 29530UK 26450Ireland 6318 Ireland 8978Denmark 5833Denmark 6213Chile 4373Chile 5435Faroe 3895Faroe 3318China 1691China 2258 Sweden 1186
Total for Others 102044 101820
Others not Listed 4793 4574Grand Total 114853 115271Source: French Customs The above trade matrix reflects that the decline in consumption resulted in reduced imports of salmon products in 2004. More specifically, shipments from Norway and the United Kingdom (mainly Scotland) were negatively affected by the French media campaign against farm-raised salmon in early 2004. French consumers seemed to have been reassured by the guarantees of quality offered by producer groups in countries where salmon is not farm-raised, including the United States. U.S. exports of salmon to France consisted of whole pacific salmon (75 percent in 2004), fillets (22 percent) and Sokeye (3 percent). French imports from the United States increased in 2004 as a result of the weak dollar relative to the euro. In the first half of 2005, however, U.S. exports to France lost market shares to Chilean products. The market share for U.S. salmon in the French market decreased from 5.3 percent in January-June 2004 to 3.3 percent in January-June 2005. French imports of salmon from Ireland also increased, as a significant share of Irish salmon is sold under the French organic (AB) and high quality (Label Rouge) logos. Finally, shipments of Scottish salmon to France under the “Label Rouge” quality logo increased from 5,600 MT in 2003 to 6,800 MT in 2004. Policy Due to pressure from the Scottish salmon industry, the European Commission in 2005 adopted several anti-dumping measures to protect the EU market against low priced farm-raised Norwegian salmon products. First, in February, the EU Commission fixed minimum import prices and tariff quotas. French importers and processors of salmon negatively reacted to these measures, which would have significantly reduced their margins. Second, in April, the EU Council of Ministers replaced the February decision with a 16 percent tariff on Norwegian farm-raised salmon. Finally, in June 2005, the European Union and Norway reached a compromise replacing the 16 percent tariff with a minimum import price reflecting Norwegian production costs.
GAIN Report - FR5065 Page 15 of 29
UNCLASSIFIED USDA Foreign Agricultural Service
Section III: Groundfish Fillets
PSD Table
Country France
Commodity Groundfish, Fillets (MT)
2003 Revised 2004 Estimate 2005 Forecast
USDA
Official [Old] Post
Estimate[New]
USDA Official [Old]
Post Estimate[New]
USDA Official [Old]
Post Estimate[New]
Market Year Begin 01/2003 01/2004 01/2005
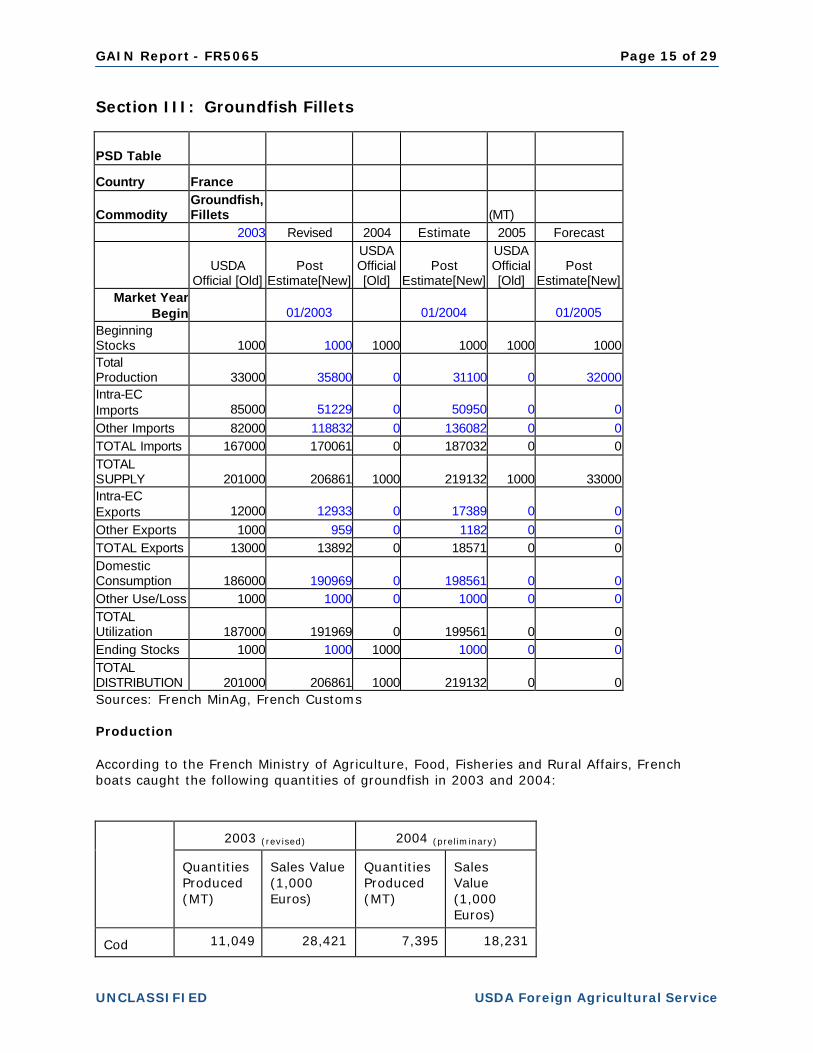
Beginning Stocks 1000 1000 1000 1000 1000 1000 Total Production 33000 35800 0 31100 0 32000 Intra-EC Imports 85000 51229 0 50950 0 0 Other Imports 82000 118832 0 136082 0 0 TOTAL Imports 167000 170061 0 187032 0 0 TOTAL SUPPLY 201000 206861 1000 219132 1000 33000 Intra-EC Exports 12000 12933 0 17389 0 0 Other Exports 1000 959 0 1182 0 0 TOTAL Exports 13000 13892 0 18571 0 0 Domestic Consumption 186000 190969 0 198561 0 0 Other Use/Loss 1000 1000 0 1000 0 0 TOTAL Utilization 187000 191969 0 199561 0 0 Ending Stocks 1000 1000 1000 1000 0 0 TOTAL DISTRIBUTION 201000 206861 1000 219132 0 0 Sources: French MinAg, French Customs Production According to the French Ministry of Agriculture, Food, Fisheries and Rural Affairs, French boats caught the following quantities of groundfish in 2003 and 2004:
2003 (revised)
2004 (preliminary)
Quantities Produced (MT)
Sales Value (1,000 Euros)
Quantities Produced (MT)
Sales Value (1,000 Euros)
Cod 11,049 28,421 7,395 18,231
GAIN Report - FR5065 Page 16 of 29
UNCLASSIFIED USDA Foreign Agricultural Service
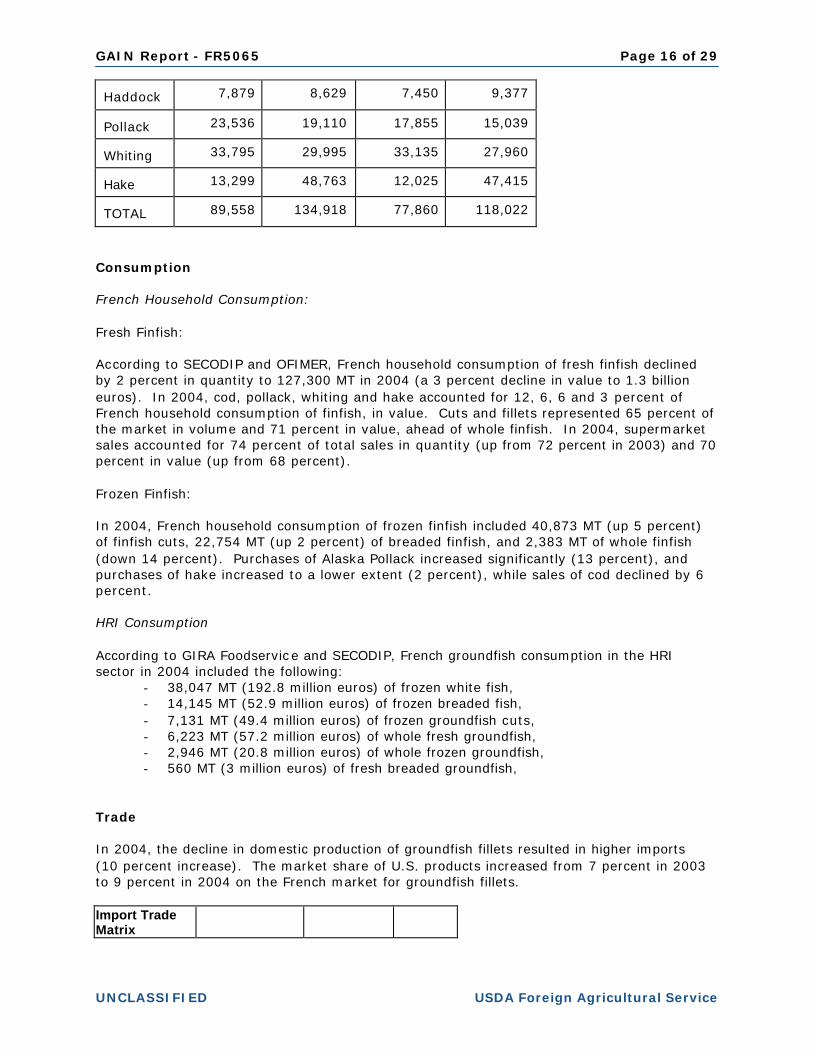
Haddock 7,879 8,629 7,450 9,377
Pollack 23,536 19,110 17,855 15,039 Whiting 33,795 29,995 33,135 27,960 Hake 13,299 48,763 12,025 47,415 TOTAL 89,558 134,918 77,860 118,022
Consumption French Household Consumption: Fresh Finfish: According to SECODIP and OFIMER, French household consumption of fresh finfish declined by 2 percent in quantity to 127,300 MT in 2004 (a 3 percent decline in value to 1.3 billion euros). In 2004, cod, pollack, whiting and hake accounted for 12, 6, 6 and 3 percent of French household consumption of finfish, in value. Cuts and fillets represented 65 percent of the market in volume and 71 percent in value, ahead of whole finfish. In 2004, supermarket sales accounted for 74 percent of total sales in quantity (up from 72 percent in 2003) and 70 percent in value (up from 68 percent). Frozen Finfish: In 2004, French household consumption of frozen finfish included 40,873 MT (up 5 percent) of finfish cuts, 22,754 MT (up 2 percent) of breaded finfish, and 2,383 MT of whole finfish (down 14 percent). Purchases of Alaska Pollack increased significantly (13 percent), and purchases of hake increased to a lower extent (2 percent), while sales of cod declined by 6 percent. HRI Consumption According to GIRA Foodservice and SECODIP, French groundfish consumption in the HRI sector in 2004 included the following:
- 38,047 MT (192.8 million euros) of frozen white fish, - 14,145 MT (52.9 million euros) of frozen breaded fish, - 7,131 MT (49.4 million euros) of frozen groundfish cuts, - 6,223 MT (57.2 million euros) of whole fresh groundfish, - 2,946 MT (20.8 million euros) of whole frozen groundfish, - 560 MT (3 million euros) of fresh breaded groundfish,
Trade In 2004, the decline in domestic production of groundfish fillets resulted in higher imports (10 percent increase). The market share of U.S. products increased from 7 percent in 2003 to 9 percent in 2004 on the French market for groundfish fillets. Import Trade Matrix
GAIN Report - FR5065 Page 17 of 29
UNCLASSIFIED USDA Foreign Agricultural Service
Country France
Commodity Groundfish, Fillets
Time Period Jan-Dec Units: MT Imports for: 2003 2004
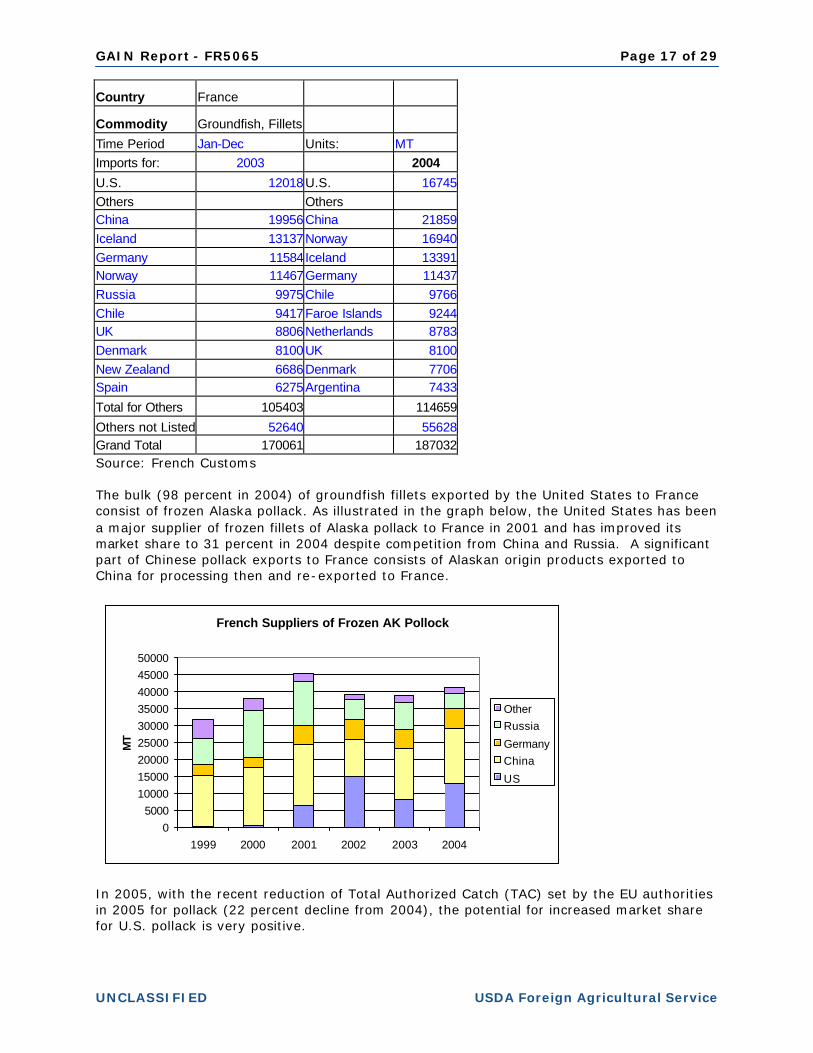
U.S. 12018U.S. 16745Others Others China 19956China 21859Iceland 13137Norway 16940Germany 11584Iceland 13391Norway 11467Germany 11437Russia 9975Chile 9766Chile 9417Faroe Islands 9244UK 8806Netherlands 8783Denmark 8100UK 8100New Zealand 6686Denmark 7706Spain 6275Argentina 7433
Total for Others 105403 114659
Others not Listed 52640 55628Grand Total 170061 187032Source: French Customs The bulk (98 percent in 2004) of groundfish fillets exported by the United States to France consist of frozen Alaska pollack. As illustrated in the graph below, the United States has been a major supplier of frozen fillets of Alaska pollack to France in 2001 and has improved its market share to 31 percent in 2004 despite competition from China and Russia. A significant part of Chinese pollack exports to France consists of Alaskan origin products exported to China for processing then and re-exported to France.
French Suppliers of Frozen AK Pollock
05000
100001500020000250003000035000400004500050000
1999 2000 2001 2002 2003 2004
MT
OtherRussia
GermanyChina
US
In 2005, with the recent reduction of Total Authorized Catch (TAC) set by the EU authorities in 2005 for pollack (22 percent decline from 2004), the potential for increased market share for U.S. pollack is very positive.
GAIN Report - FR5065 Page 18 of 29
UNCLASSIFIED USDA Foreign Agricultural Service
During the first half of 2005, U.S. exports of Alaska Pollack to France increased by 6 percent to 6,630 MT and Chinese imports fell by 16 percent to 6,890 MT. With total French imports of Alaska pollack fillets declining to 18,311 MT, U.S. market share is at 36 percent in the first half of 2005.
GAIN Report - FR5065 Page 19 of 29
UNCLASSIFIED USDA Foreign Agricultural Service
Section IV: Lobster
PSD Table
Country France
Commodity Lobster (MT) 2003 Revised 2004 Estimate 2005 Forecast
USDA Official [Old]
Post Estimate[New]
USDA Official [Old]
Post Estimate[New]
USDA Official [Old]
Post Estimate[New]
Market Year Begin 01/2003 01/2004 01/2005
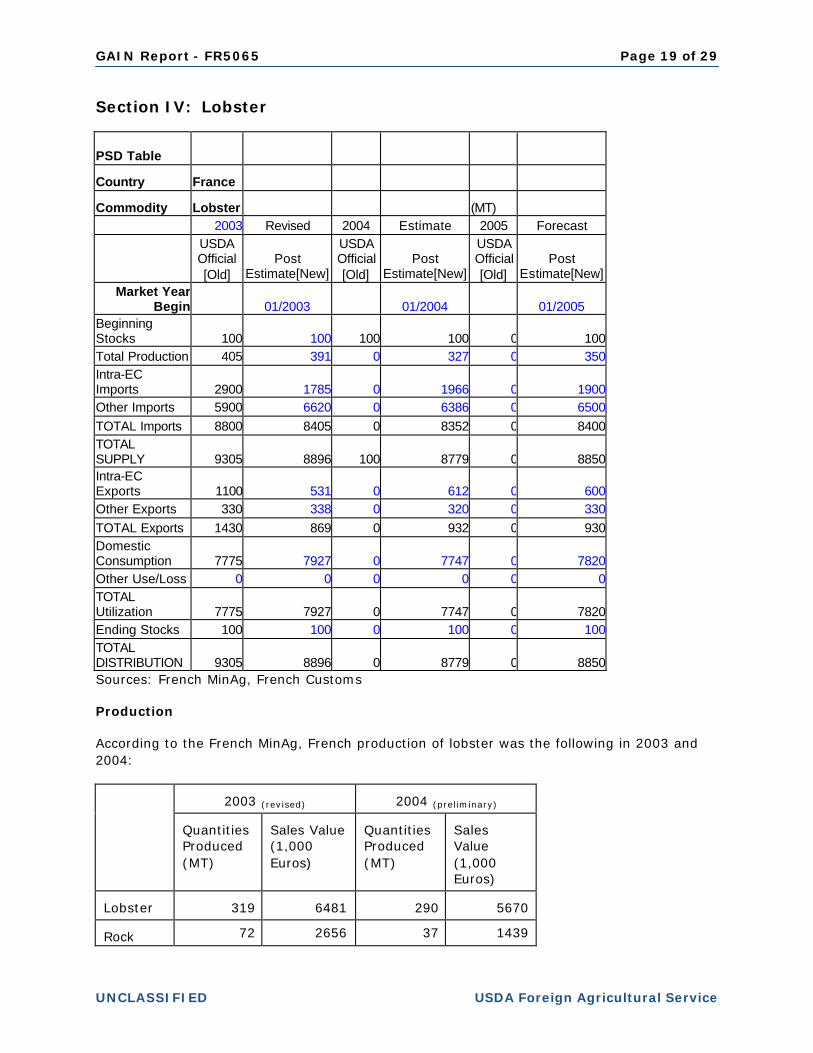
Beginning Stocks 100 100 100 100 0 100Total Production 405 391 0 327 0 350Intra-EC Imports 2900 1785 0 1966 0 1900Other Imports 5900 6620 0 6386 0 6500TOTAL Imports 8800 8405 0 8352 0 8400TOTAL SUPPLY 9305 8896 100 8779 0 8850Intra-EC Exports 1100 531 0 612 0 600Other Exports 330 338 0 320 0 330TOTAL Exports 1430 869 0 932 0 930Domestic Consumption 7775 7927 0 7747 0 7820Other Use/Loss 0 0 0 0 0 0TOTAL Utilization 7775 7927 0 7747 0 7820Ending Stocks 100 100 0 100 0 100TOTAL DISTRIBUTION 9305 8896 0 8779 0 8850Sources: French MinAg, French Customs Production According to the French MinAg, French production of lobster was the following in 2003 and 2004:
2003 (revised)
2004 (preliminary)
Quantities Produced (MT)
Sales Value (1,000 Euros)
Quantities Produced (MT)
Sales Value (1,000 Euros)
Lobster 319 6481 290 5670 Rock 72 2656 37 1439
GAIN Report - FR5065 Page 20 of 29
UNCLASSIFIED USDA Foreign Agricultural Service
Lobster TOTAL 391 9137 327 7106
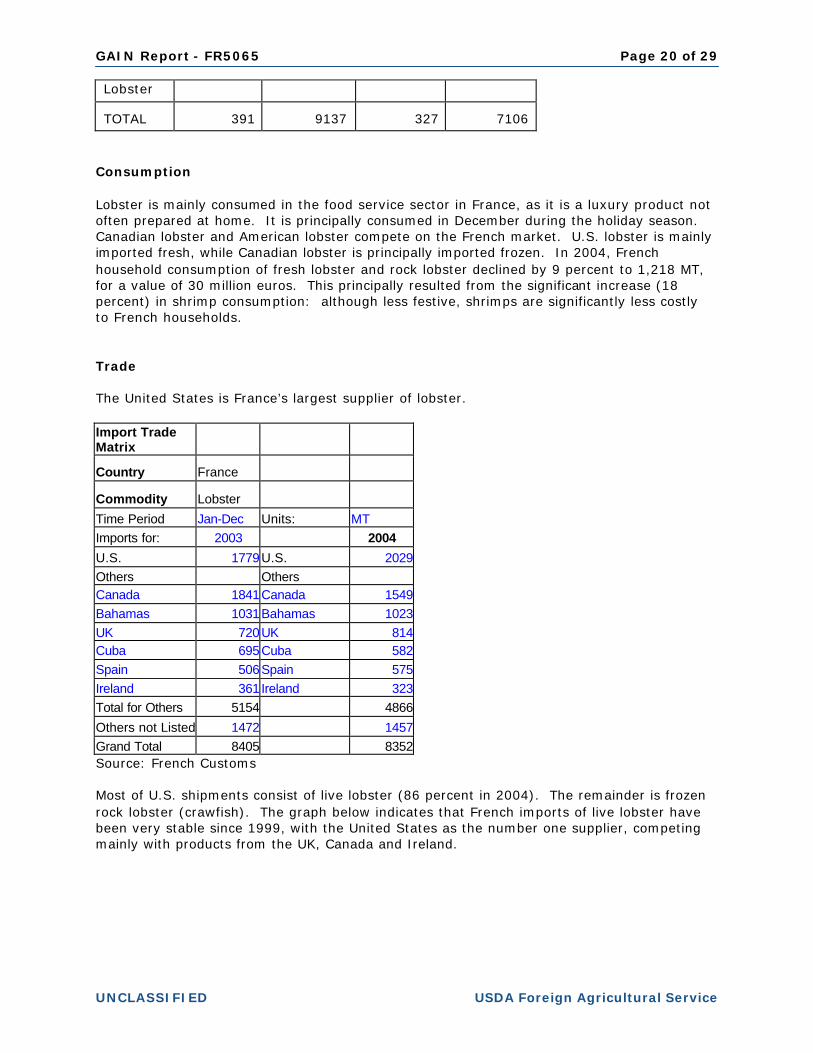
Consumption Lobster is mainly consumed in the food service sector in France, as it is a luxury product not often prepared at home. It is principally consumed in December during the holiday season. Canadian lobster and American lobster compete on the French market. U.S. lobster is mainly imported fresh, while Canadian lobster is principally imported frozen. In 2004, French household consumption of fresh lobster and rock lobster declined by 9 percent to 1,218 MT, for a value of 30 million euros. This principally resulted from the significant increase (18 percent) in shrimp consumption: although less festive, shrimps are significantly less costly to French households. Trade The United States is France’s largest supplier of lobster. Import Trade Matrix
Country France
Commodity Lobster
Time Period Jan-Dec Units: MT Imports for: 2003 2004
U.S. 1779U.S. 2029Others Others Canada 1841Canada 1549Bahamas 1031Bahamas 1023UK 720UK 814Cuba 695Cuba 582Spain 506Spain 575Ireland 361 Ireland 323Total for Others 5154 4866
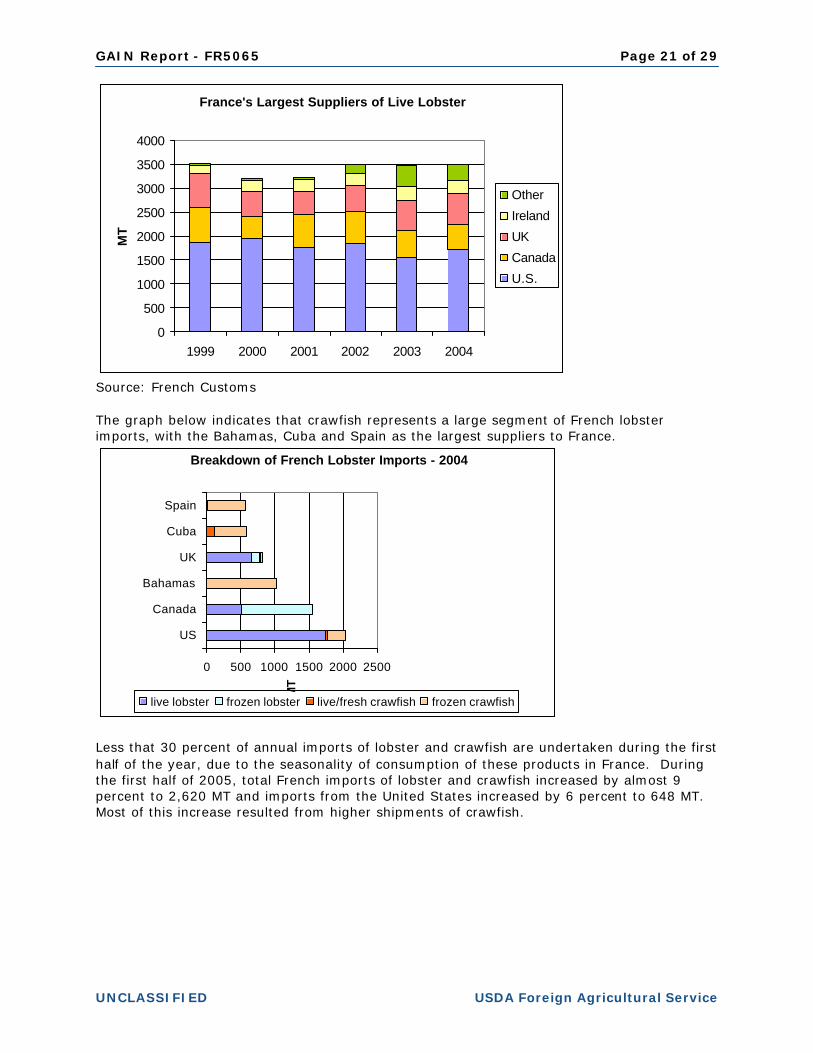
Others not Listed 1472 1457Grand Total 8405 8352Source: French Customs Most of U.S. shipments consist of live lobster (86 percent in 2004). The remainder is frozen rock lobster (crawfish). The graph below indicates that French imports of live lobster have been very stable since 1999, with the United States as the number one supplier, competing mainly with products from the UK, Canada and Ireland.
GAIN Report - FR5065 Page 21 of 29
UNCLASSIFIED USDA Foreign Agricultural Service
France's Largest Suppliers of Live Lobster
0
500
1000
1500
2000
2500
3000
3500
4000
1999 2000 2001 2002 2003 2004
MT
Other
Ireland
UK
Canada
U.S.
Source: French Customs The graph below indicates that crawfish represents a large segment of French lobster imports, with the Bahamas, Cuba and Spain as the largest suppliers to France.
Breakdown of French Lobster Imports - 2004
0 500 1000 1500 2000 2500
US
Canada
Bahamas
UK
Cuba
Spain
MT
live lobster frozen lobster live/fresh crawfish frozen crawfish
Less that 30 percent of annual imports of lobster and crawfish are undertaken during the first half of the year, due to the seasonality of consumption of these products in France. During the first half of 2005, total French imports of lobster and crawfish increased by almost 9 percent to 2,620 MT and imports from the United States increased by 6 percent to 648 MT. Most of this increase resulted from higher shipments of crawfish.
GAIN Report - FR5065 Page 22 of 29
UNCLASSIFIED USDA Foreign Agricultural Service
Section V: Scallops
PSD Table
Country France
Commodity Scallops (MT) 2003 Revised 2004 Estimate 2005 Forecast
USDA Official [Old]
Post Estimate[New]
USDA Official [Old]
Post Estimate[New]
USDA Official [Old]
Post Estimate[New]
Market Year Begin 01/2003 01/2004 01/2005
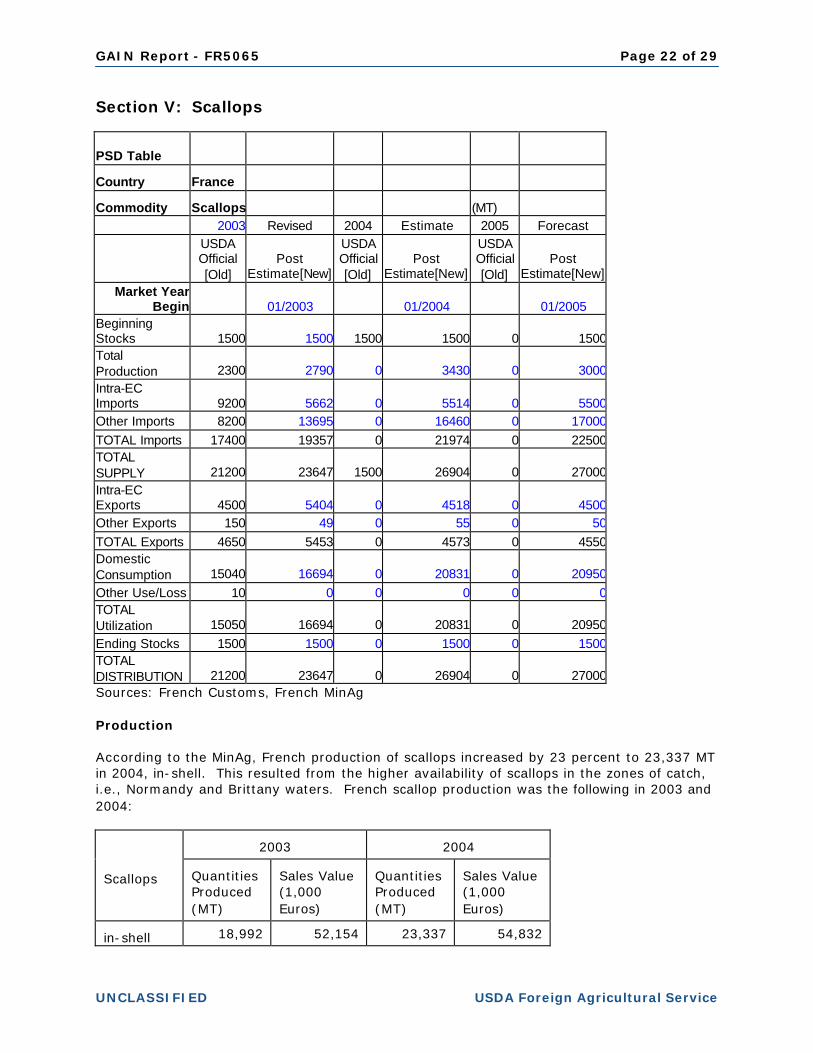
Beginning Stocks 1500 1500 1500 1500 0 1500Total Production 2300 2790 0 3430 0 3000Intra-EC Imports 9200 5662 0 5514 0 5500Other Imports 8200 13695 0 16460 0 17000TOTAL Imports 17400 19357 0 21974 0 22500TOTAL SUPPLY 21200 23647 1500 26904 0 27000Intra-EC Exports 4500 5404 0 4518 0 4500Other Exports 150 49 0 55 0 50TOTAL Exports 4650 5453 0 4573 0 4550Domestic Consumption 15040 16694 0 20831 0 20950Other Use/Loss 10 0 0 0 0 0TOTAL Utilization 15050 16694 0 20831 0 20950Ending Stocks 1500 1500 0 1500 0 1500TOTAL DISTRIBUTION 21200 23647 0 26904 0 27000Sources: French Customs, French MinAg Production According to the MinAg, French production of scallops increased by 23 percent to 23,337 MT in 2004, in-shell. This resulted from the higher availability of scallops in the zones of catch, i.e., Normandy and Brittany waters. French scallop production was the following in 2003 and 2004:
2003
2004
Scallops
Quantities Produced (MT)
Sales Value (1,000 Euros)
Quantities Produced (MT)
Sales Value (1,000 Euros)
in-shell 18,992 52,154 23,337 54,832
GAIN Report - FR5065 Page 23 of 29
UNCLASSIFIED USDA Foreign Agricultural Service
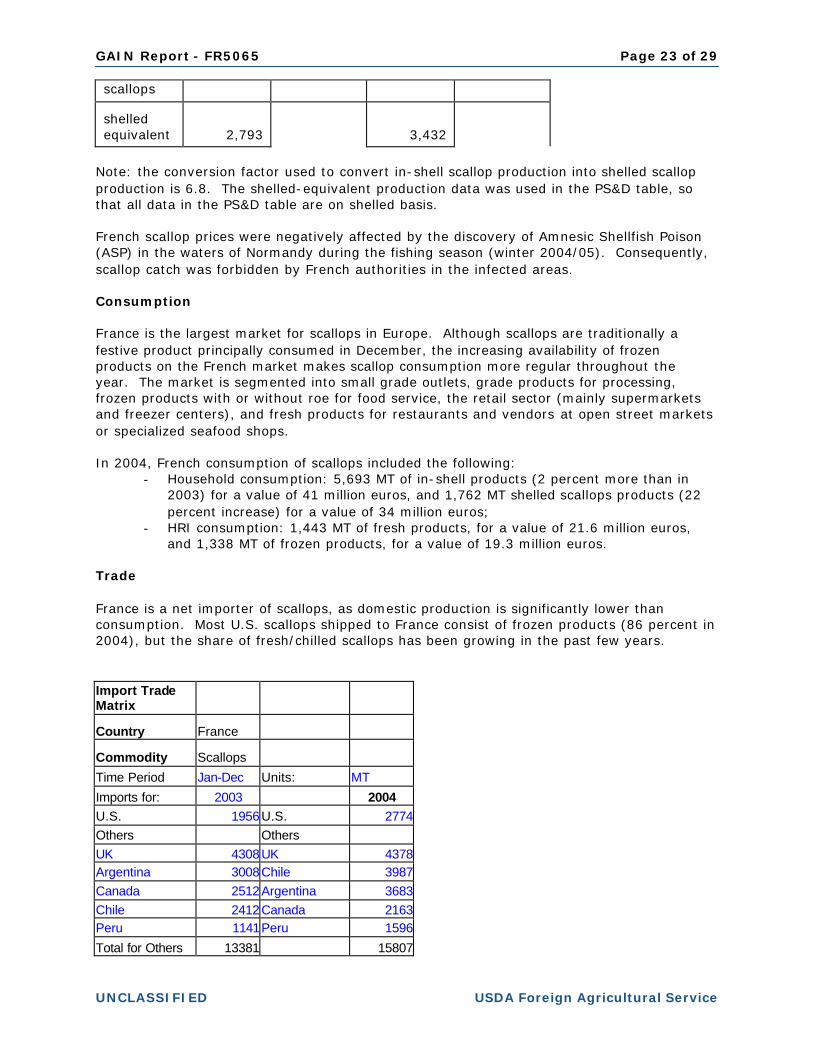
scallops shelled equivalent 2,793 3,432
Note: the conversion factor used to convert in-shell scallop production into shelled scallop production is 6.8. The shelled-equivalent production data was used in the PS&D table, so that all data in the PS&D table are on shelled basis. French scallop prices were negatively affected by the discovery of Amnesic Shellfish Poison (ASP) in the waters of Normandy during the fishing season (winter 2004/05). Consequently, scallop catch was forbidden by French authorities in the infected areas. Consumption France is the largest market for scallops in Europe. Although scallops are traditionally a festive product principally consumed in December, the increasing availability of frozen products on the French market makes scallop consumption more regular throughout the year. The market is segmented into small grade outlets, grade products for processing, frozen products with or without roe for food service, the retail sector (mainly supermarkets and freezer centers), and fresh products for restaurants and vendors at open street markets or specialized seafood shops. In 2004, French consumption of scallops included the following:
- Household consumption: 5,693 MT of in-shell products (2 percent more than in 2003) for a value of 41 million euros, and 1,762 MT shelled scallops products (22 percent increase) for a value of 34 million euros;
- HRI consumption: 1,443 MT of fresh products, for a value of 21.6 million euros, and 1,338 MT of frozen products, for a value of 19.3 million euros.
Trade France is a net importer of scallops, as domestic production is significantly lower than consumption. Most U.S. scallops shipped to France consist of frozen products (86 percent in 2004), but the share of fresh/chilled scallops has been growing in the past few years. Import Trade Matrix
Country France
Commodity Scallops
Time Period Jan-Dec Units: MT
Imports for: 2003 2004 U.S. 1956U.S. 2774Others Others UK 4308UK 4378Argentina 3008Chile 3987Canada 2512Argentina 3683Chile 2412Canada 2163Peru 1141Peru 1596
Total for Others 13381 15807
GAIN Report - FR5065 Page 24 of 29
UNCLASSIFIED USDA Foreign Agricultural Service
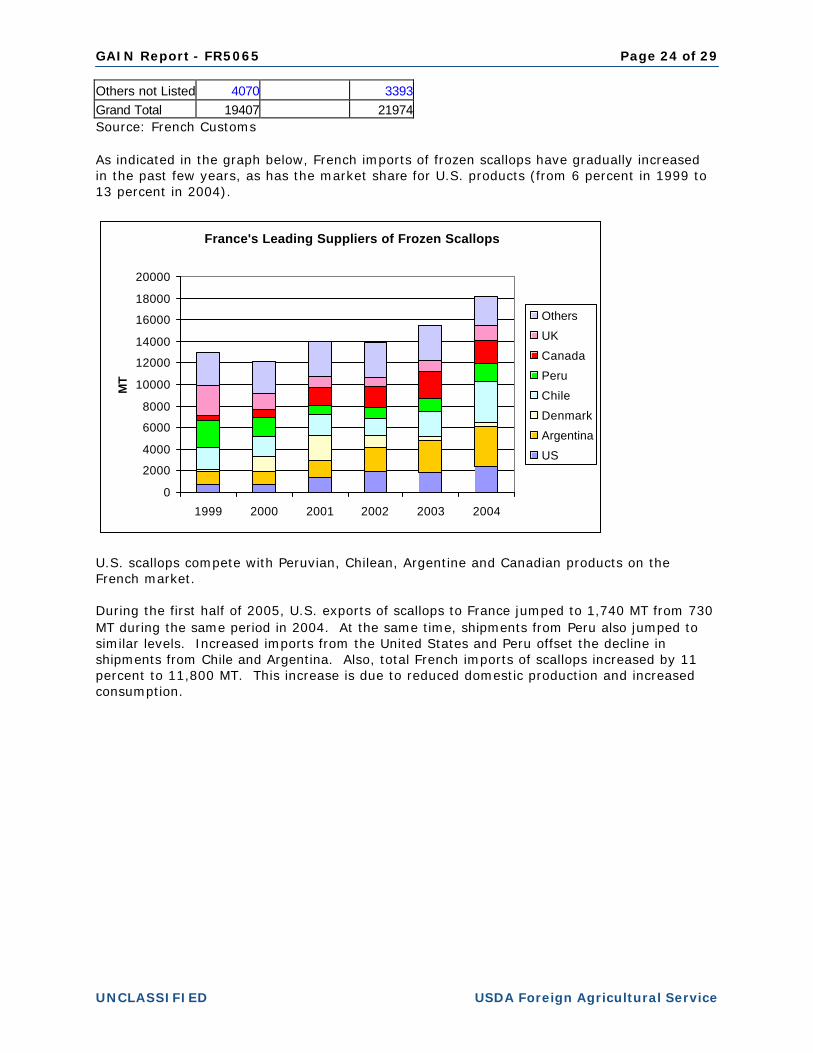
Others not Listed 4070 3393Grand Total 19407 21974Source: French Customs As indicated in the graph below, French imports of frozen scallops have gradually increased in the past few years, as has the market share for U.S. products (from 6 percent in 1999 to 13 percent in 2004).
France's Leading Suppliers of Frozen Scallops
0
2000
4000
6000
8000
10000
12000
14000
16000
18000
20000
1999 2000 2001 2002 2003 2004
MT
Others
UK
Canada
Peru
Chile
Denmark
Argentina
US
U.S. scallops compete with Peruvian, Chilean, Argentine and Canadian products on the French market. During the first half of 2005, U.S. exports of scallops to France jumped to 1,740 MT from 730 MT during the same period in 2004. At the same time, shipments from Peru also jumped to similar levels. Increased imports from the United States and Peru offset the decline in shipments from Chile and Argentina. Also, total French imports of scallops increased by 11 percent to 11,800 MT. This increase is due to reduced domestic production and increased consumption.
GAIN Report - FR5065 Page 25 of 29
UNCLASSIFIED USDA Foreign Agricultural Service
Section VI: Surimi
PSD Table
Country France
Commodity Surimi (MT) 2003 Revised 2004 Estimate 2005 Forecast
USDA Official [Old]
Post Estimate[New]
USDA Official [Old]
Post Estimate[New]
USDA Official [Old]
Post Estimate[New]
Market Year Begin 01/2003 01/2004 01/2005
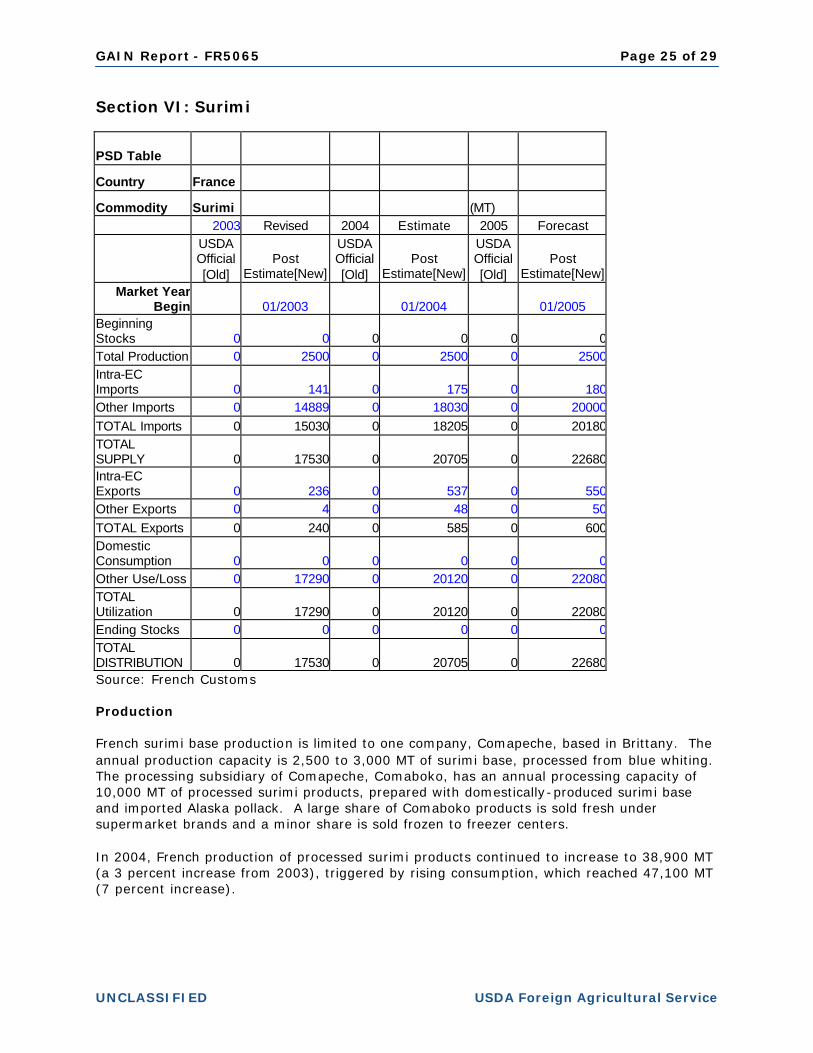
Beginning Stocks 0 0 0 0 0 0Total Production 0 2500 0 2500 0 2500Intra-EC Imports 0 141 0 175 0 180Other Imports 0 14889 0 18030 0 20000TOTAL Imports 0 15030 0 18205 0 20180TOTAL SUPPLY 0 17530 0 20705 0 22680Intra-EC Exports 0 236 0 537 0 550Other Exports 0 4 0 48 0 50TOTAL Exports 0 240 0 585 0 600Domestic Consumption 0 0 0 0 0 0Other Use/Loss 0 17290 0 20120 0 22080TOTAL Utilization 0 17290 0 20120 0 22080Ending Stocks 0 0 0 0 0 0TOTAL DISTRIBUTION 0 17530 0 20705 0 22680Source: French Customs Production French surimi base production is limited to one company, Comapeche, based in Brittany. The annual production capacity is 2,500 to 3,000 MT of surimi base, processed from blue whiting. The processing subsidiary of Comapeche, Comaboko, has an annual processing capacity of 10,000 MT of processed surimi products, prepared with domestically-produced surimi base and imported Alaska pollack. A large share of Comaboko products is sold fresh under supermarket brands and a minor share is sold frozen to freezer centers. In 2004, French production of processed surimi products continued to increase to 38,900 MT (a 3 percent increase from 2003), triggered by rising consumption, which reached 47,100 MT (7 percent increase).
GAIN Report - FR5065 Page 26 of 29
UNCLASSIFIED USDA Foreign Agricultural Service
French Surimi Production and Consumption
0
10000
20000
30000
40000
50000
1994
1995
1996
1997
1998
1999
2000
2001
2002
2003
2004
MT
Production Consumption
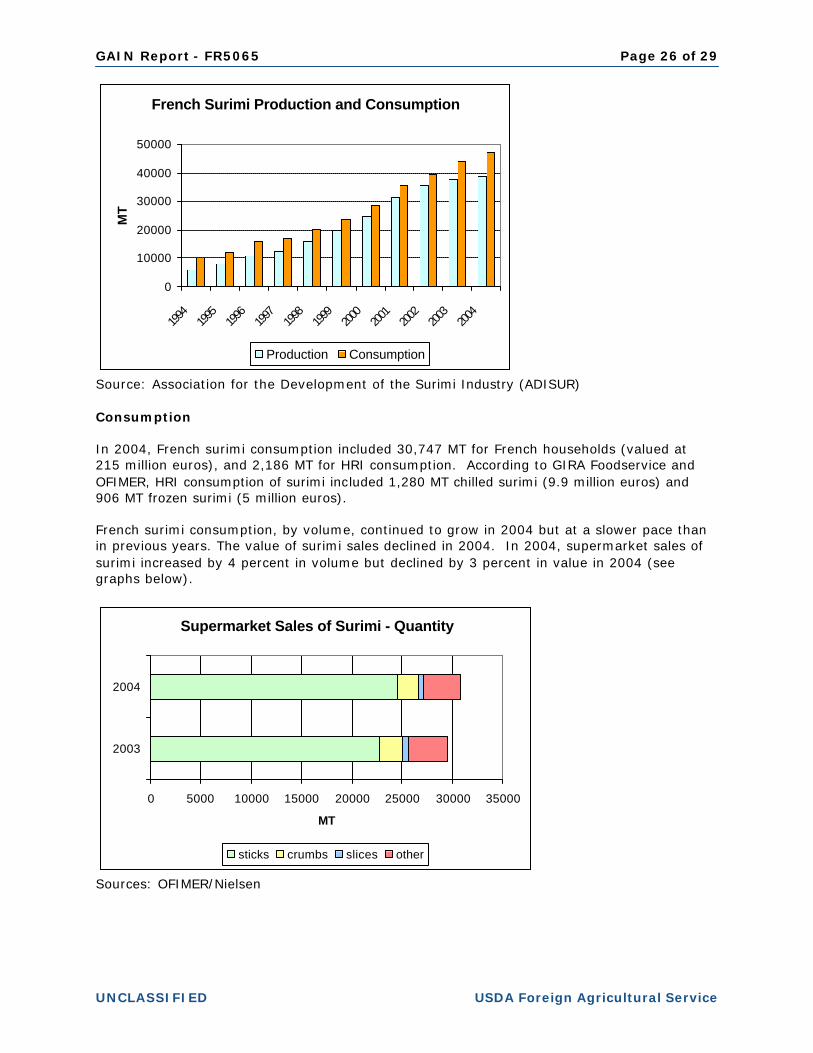
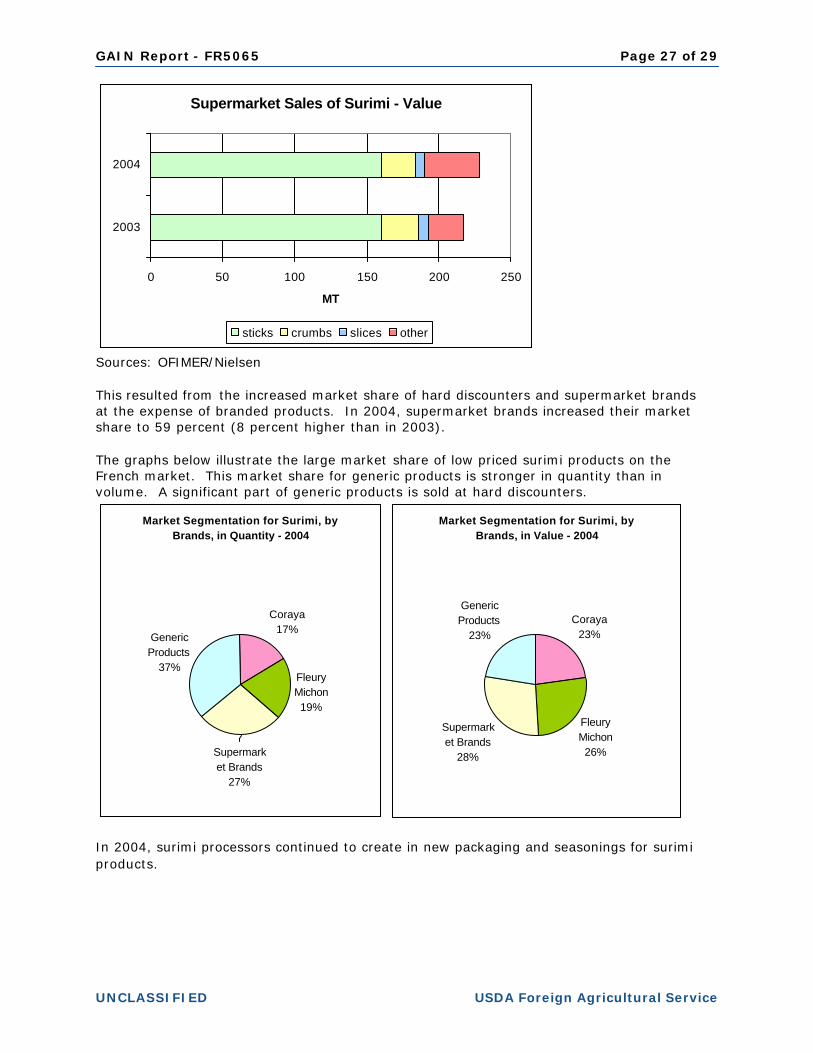
Source: Association for the Development of the Surimi Industry (ADISUR) Consumption In 2004, French surimi consumption included 30,747 MT for French households (valued at 215 million euros), and 2,186 MT for HRI consumption. According to GIRA Foodservice and OFIMER, HRI consumption of surimi included 1,280 MT chilled surimi (9.9 million euros) and 906 MT frozen surimi (5 million euros). French surimi consumption, by volume, continued to grow in 2004 but at a slower pace than in previous years. The value of surimi sales declined in 2004. In 2004, supermarket sales of surimi increased by 4 percent in volume but declined by 3 percent in value in 2004 (see graphs below).
Supermarket Sales of Surimi - Quantity
0 5000 10000 15000 20000 25000 30000 35000
2003
2004
MT
sticks crumbs slices other
Sources: OFIMER/Nielsen
GAIN Report - FR5065 Page 27 of 29
UNCLASSIFIED USDA Foreign Agricultural Service
Supermarket Sales of Surimi - Value
0 50 100 150 200 250
2003
2004
MT
sticks crumbs slices other
Sources: OFIMER/Nielsen This resulted from the increased market share of hard discounters and supermarket brands at the expense of branded products. In 2004, supermarket brands increased their market share to 59 percent (8 percent higher than in 2003). The graphs below illustrate the large market share of low priced surimi products on the French market. This market share for generic products is stronger in quantity than in volume. A significant part of generic products is sold at hard discounters.
Market Segmentation for Surimi, by Brands, in Quantity - 2004
Coraya17%
Fleury Michon19%
Generic Products
37%
Supermarket Brands
27%
Market Segmentation for Surimi, by Brands, in Value - 2004
Coraya23%
Fleury Michon26%
Supermarket Brands
28%
Generic Products
23%
In 2004, surimi processors continued to create in new packaging and seasonings for surimi products.
GAIN Report - FR5065 Page 28 of 29
UNCLASSIFIED USDA Foreign Agricultural Service
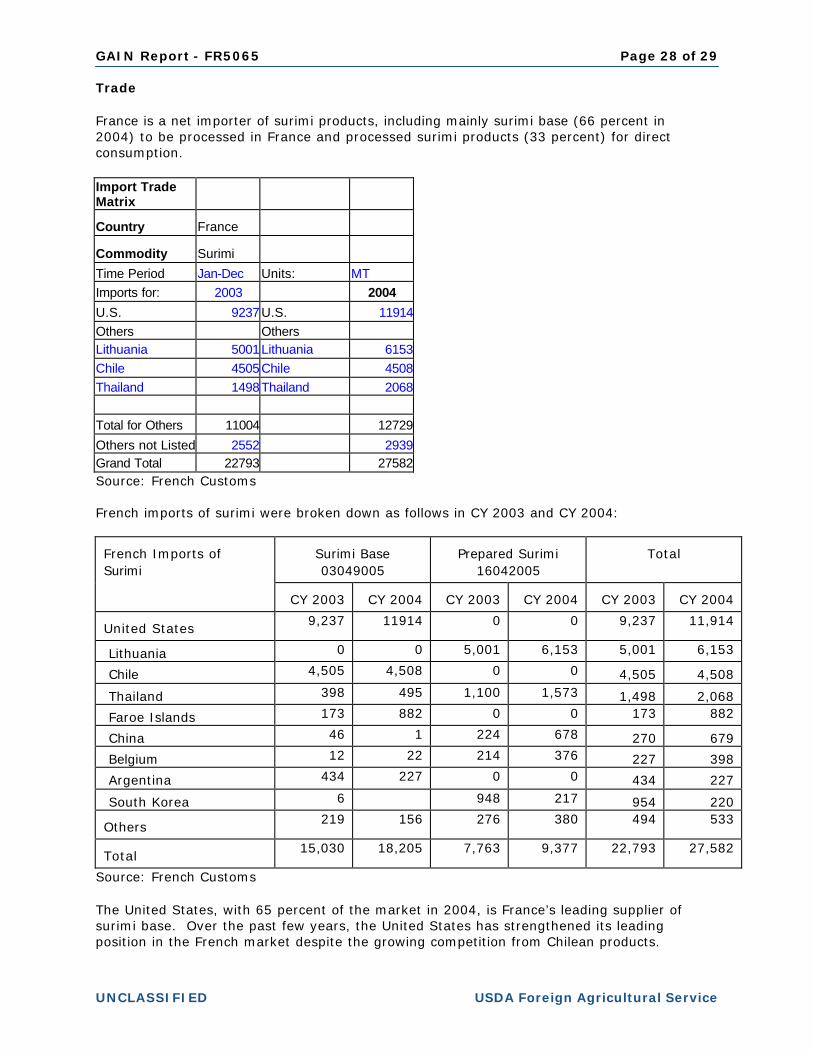
Trade France is a net importer of surimi products, including mainly surimi base (66 percent in 2004) to be processed in France and processed surimi products (33 percent) for direct consumption. Import Trade Matrix
Country France
Commodity Surimi
Time Period Jan-Dec Units: MT Imports for: 2003 2004
U.S. 9237U.S. 11914Others Others Lithuania 5001Lithuania 6153Chile 4505Chile 4508Thailand 1498Thailand 2068
Total for Others 11004 12729
Others not Listed 2552 2939Grand Total 22793 27582Source: French Customs French imports of surimi were broken down as follows in CY 2003 and CY 2004:
Surimi Base 03049005
Prepared Surimi
16042005
Total
French Imports of Surimi
CY 2003
CY 2004
CY 2003
CY 2004
CY 2003
CY 2004
United States
9,237 11914 0 0 9,237 11,914
Lithuania 0 0 5,001 6,153 5,001 6,153
Chile 4,505 4,508 0 0 4,505 4,508
Thailand 398 495 1,100 1,573 1,498 2,068
Faroe Islands 173 882 0 0 173 882
China 46 1 224 678 270 679
Belgium 12 22 214 376 227 398
Argentina 434 227 0 0 434 227
South Korea 6 948 217 954 220 Others
219 156 276 380 494 533
Total
15,030 18,205 7,763 9,377 22,793 27,582
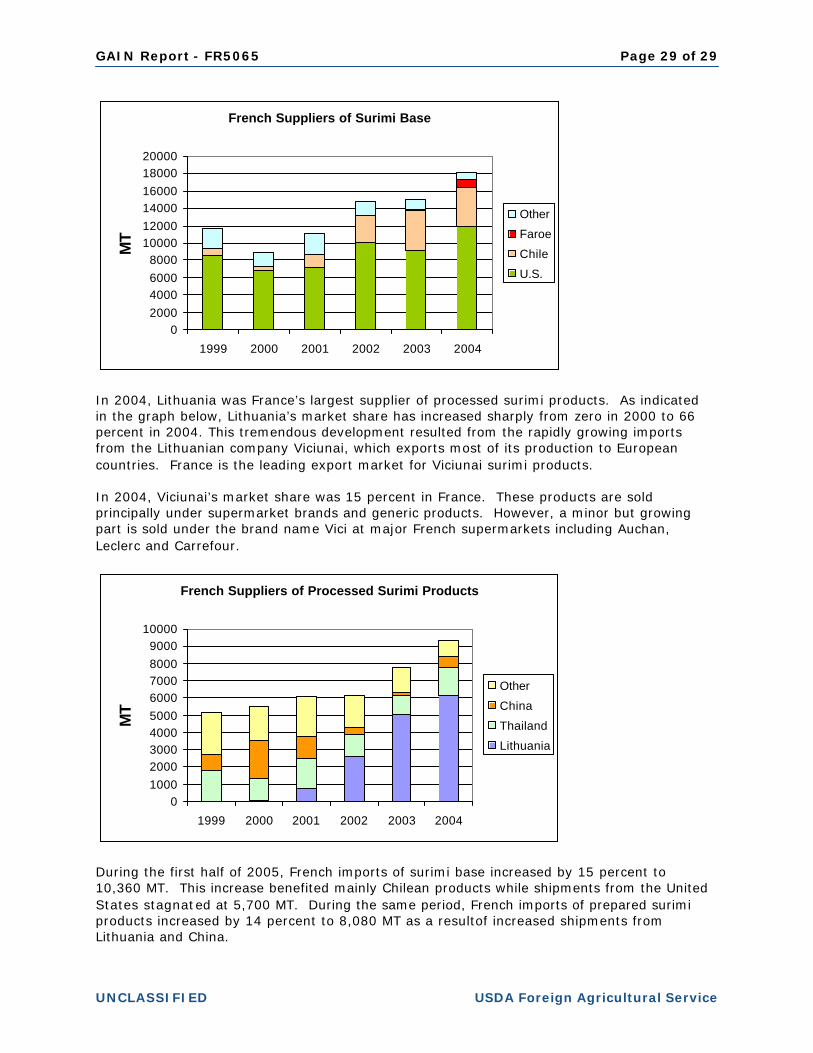
Source: French Customs The United States, with 65 percent of the market in 2004, is France’s leading supplier of surimi base. Over the past few years, the United States has strengthened its leading position in the French market despite the growing competition from Chilean products.
GAIN Report - FR5065 Page 29 of 29
UNCLASSIFIED USDA Foreign Agricultural Service
French Suppliers of Surimi Base
02000400060008000
100001200014000160001800020000
1999 2000 2001 2002 2003 2004
MT
Other
Faroe
Chile
U.S.
In 2004, Lithuania was France’s largest supplier of processed surimi products. As indicated in the graph below, Lithuania’s market share has increased sharply from zero in 2000 to 66 percent in 2004. This tremendous development resulted from the rapidly growing imports from the Lithuanian company Viciunai, which exports most of its production to European countries. France is the leading export market for Viciunai surimi products. In 2004, Viciunai’s market share was 15 percent in France. These products are sold principally under supermarket brands and generic products. However, a minor but growing part is sold under the brand name Vici at major French supermarkets including Auchan, Leclerc and Carrefour.
French Suppliers of Processed Surimi Products
0100020003000400050006000700080009000
10000
1999 2000 2001 2002 2003 2004
MT
Other
China
Thailand
Lithuania
During the first half of 2005, French imports of surimi base increased by 15 percent to 10,360 MT. This increase benefited mainly Chilean products while shipments from the United States stagnated at 5,700 MT. During the same period, French imports of prepared surimi products increased by 14 percent to 8,080 MT as a resultof increased shipments from Lithuania and China.