Embed Size (px)
Citation preview

Required Report - public distribution
Date: 1/24/2006
GAIN Report Number: LH6001
LH6001
Lithuania
Exporter Guide
Lithuania Exporter Guide
2005 Approved by: Charles Rush US Embassy
Prepared by: International Business Network, Vilnius, Lithuania Report Highlights: In recent years Lithuania's economy has been one of the fastest growing in Central and Eastern Europe. The private sector accounts for more than 80 percent of the gross domestic product (GDP). The retail and food sectors were among those with the highest growth in part due to European Union (EU) accession.
Includes PSD Changes: No Includes Trade Matrix: No
Unscheduled Report Warsaw [PL1]
[LH]
USDA Foreign Agricultural Service
GAIN ReportGlobal Agriculture Information Network
Template Version 2.09

GAIN Report - LH6001 Page 2 of 35
UNCLASSIFIED USDA Foreign Agricultural Service
Table of Contents Market Overview.................................................................................................3 Lithuania Agricultural Trade ................................................................................6 Country Group.....................................................................................................9 Third countries....................................................................................................9
Market indicators:.............................................................................................. 11 Supplier Strengths / Weaknesses – Market Opportunities and Competitive Threats ........ 12
Food Sector Structure ........................................................................................ 13 Local Business Customs/Practices......................................................................... 13 Consumer Tastes and Preferences......................................................................... 14 Labeling Requirements ....................................................................................... 14 Food Additives Regulations .................................................................................. 15
Market Sector Structure and Trends ................................................................... 16 Wholesale and Retail Sector................................................................................. 16 Hotel, Restaurant and Institutional Sector .............................................................. 18
Key Contacts and Further Information................................................................ 20 Lithuanian State Institutions, Associations, Chamber of Commerce............................. 20 Main Lithuanian Food and Agricultural Sector Companies .......................................... 22 Trade Fairs in Lithuania ....................................................................................... 24
Appendix 1. Statistics ........................................................................................ 25 Key Trade and Demographic Information................................................................ 25 Employment by Economic Sector.......................................................................... 26 Household consumption expenditures (percent) ...................................................... 27 Average annual retail prices for main foodstuffs ($ per kilo)....................................... 27 Producer price indices of agricultural products (2001-2003) ....................................... 28 Producer prices of crop products ($ per ton) ........................................................... 28 Consumption of main foodstuffs per capita (kilograms) ............................................. 29 Foodstuffs and agricultural products exports and imports .......................................... 30 Trade between Lithuania and USA;........................................................................ 32 Foreign Trade in Agricultural and Food Products in 2004 ............................................ 34

GAIN Report - LH6001 Page 3 of 35
UNCLASSIFIED USDA Foreign Agricultural Service
Market Overview Lithuania’s economy has shown robust growth in recent years and has not been hindered by the economic slowdown plaguing EU-15 countries. It has successfully recovered from the Russian economic crisis of 1998 and is among the fastest growing economies in Central and Eastern Europe. The private sector now produces about 80 percent of Lithuania’s GDP. Lithuania’s GDP grew 8 percent in the second quarter of 2005 compared with the same period of 2004. In 2003 Lithuania’s GDP edged up a dramatic 9.7 percent, the fourth most robust in the world, only Tajikistan, Armenia and Kazakhstan posted higher GDP growth. Economic Indicators Indicator 2001 Annual
change (%)
2002 Annual change (%)
2003 Annual change (%)
2004 Annual change (%)
Real GDP 6.4 6.8 9.7 6.7 Nominal GDP (billion $)
17,035 6.3 18,184 6.7 19,781 8.8 21,795 10.2
Exports of Goods and Services (billion $)
8,515 18.3 9,652 13.4 10,254 6.2 11,491 12.1
Imports of Goods and Services (billion $)
9,433 14.8 10,666 13.1 11,399 6.9 12,862 12.8
Current Account Deficit (% of GDP)
4.7 5.2 6.9 7.2
Inflation (%) 2.0 -1.0 -1.3 2.9 Average Monthly Earnings ($)
383 1.3
403 5.3
425 5.5
461 8.5
Unemployment Rate (%)
17.4 13.8 12.4 11.4
Average interest rates on loans
8.13 6.08 5.07 5.64
Loan portfolio of commercial banks (billion $)
2,290
26.3
2,793
22
4,260
52.5
5,950
39.7
Deposits and Letters of Credit
3,668
21.2
4,112
12.1
4,780
16.2
6,289
31.6
Lithuania’s economy stabilized when the Lita was pegged to the Dollar in 1994 at a rate of $1 = 4 Litas, and later, in February 2002 by re-pegging the Lita to the Euro at 1 Euro = 3.4

GAIN Report - LH6001 Page 4 of 35
UNCLASSIFIED USDA Foreign Agricultural Service
Litas. This change is credited with attracting foreign investments into manufacturing, energy, the food industry, services sector, and other sectors of the economy. A new income tax rate of 27 percent (currently 33 percent) will be introduced in mid-2006 and is expected decrease to 24 percent in 2008. The reform is expected to increase disposable income as well as improve Lithuania’s appeal to foreign investors.
Growth of Lithuanian GDP in 1996 - 2004 (%)
4.7
7.0 7.3
-1.7
3.9
6.4 6.8
9.7
6.7
-4.0
0.0
4.0
8.0
12.0
1996 1997 1998 1999 2000 2001 2002 2003 2004
Lithuanian GDP 1996 - 2004, Billion Dollars
11.413.9
15.7 15.3 16.0 17.0 18.219.8
21.8
0.0
4.0
8.0
12.0
16.0
20.0
24.0
1996 1997 1998 1999 2000 2001 2002 2003 2004
Inflation remained low in 2004 at 2.9 percent; however, it has been on the rise in 2005, mainly due to constant increases in prices for energy resources, raw materials, salaries, and companies’ production expenditures. Inflation was negative in 2002 and 2003 leading to increased consumer purchasing power. The appreciation of the Lita with respect to the Dollar and relatively cheaper imported goods; lower prices for agricultural and food products; relative overproduction of food products in the domestic market due to slower export growth all contributed to Lithuania’s robust economy. Lithuania is expected to join the Euro zone in January 2007.

GAIN Report - LH6001 Page 5 of 35
UNCLASSIFIED USDA Foreign Agricultural Service
Inflation in Lithuania 1996 - 2004
13.1
8.4
2.40.3 1.4 2
-1 -1.3
2.9
-4
0
4
8
12
16
1996 1997 1998 1999 2000 2001 2002 2003 2004
The increase in consumption is a result of higher incomes, decreasing unemployment, better access to financial services (credit and leasing requirements are more flexible) as well as the shadow economy which accounted for 20 percent of the GDP. Earnings continue rise, reaching $462/month in the 2004. Unemployment has significantly decreased from 17.4 percent in 2001 to 11.4 percent in 2004, and decreased further to 7.2 percent in the third quarter of 2005. In 2004 foreign direct investment (FDI) amounted to $5.70 billion (16.19 billion Litas) an increase of 18 percent compared with 2003. FDI per capita in Lithuania was $1,664. FDI in Lithuania soared to $0.76 billion in 2004, from $194.44 million in 2003.
Cummulative FDI as of January 1, 2005 (Billion $)
1.01.5
2.32.9
3.33.8
4.6 4.9
5.7
0.0
1.0
2.0
3.0
4.0
5.0
6.0
1996 1997 1998 1999 2000 2001 2002 2003 2004
Foreign investment in equity amounted to $307.99 million, reinvestment to $400 million, and privatization proceeds to $40 million. The manufacturing sector received the largest percentage of the FDI, at $410 million, followed by the utilities sector with $92 million, wholesale and retail trade with $86 million and banks and other financial institutions with $77 million. The manufacturing sector accounted for 34 percent of FDI in 2004, wholesale

GAIN Report - LH6001 Page 6 of 35
UNCLASSIFIED USDA Foreign Agricultural Service
and retail trade for 16 percent, financial institutions for 14.4 percent, and transportation, warehousing and telecommunications for 14.3 percent. Cumulative FDI by Sector as of January 1, 2005 Sector Amount (million $) Percent of total Manufacturing 1.9 34% Trade 909 16% Financial intermediation 823 14.4% Communication services 817 14.3% Real estate 485 8.5% Other 729 12.8% The largest investor was Denmark with 15.2 percent of FDI, followed by Sweden with 15.0 percent, Germany with 11.4 percent, Russia with 8.4 percent, Finland with 7.8 percent and Estonia with 7.6 percent. The EU-25 countries accounted for 76.3 percent of the total investment, the EU-15 for 63.7 percent and the CIS for 8.7 percent. Top Foreign Investors in the Food Sector Investor Origin Joint
Venture/Investment Industry Sector
Million $
Philip Morris International
USA Philip Morris Lietuva Tobacco Products 102
Carlsberg Breweries A/S; Baltic Beverages Holding
Sweden/ Finland/ Denmark
Svyturys Brewery
95 Mars Inc. USA Masterfoods Lietuva Pet Food 53 Bryggerigruppen (The Danish Brewery Group)
Denmark Kalnapilis Brewery 47
Dansico Sugar A/S
Denmark Sugar Factories Sugar Production 47
Kraft Foods International
USA Kraft Foods Lietuva Confectionary & Snacks 45
The Coca-Cola Company
USA The Coca-Cola Bottlers Lietuva
Soft Drinks 44
Danish Brewery Group
Denmark Vilniaus Tauras Brewery 15
Lithuania Agricultural Trade
Foreign trade revenue in 2004 was $21.03 billion. Exports were valued to $9.06 billion, while imports were valued at $12 billion. In 2004 Lithuania’s exports and imports increased 21 percent and 16 percent respectively.
EU accession had a significant impact on Lithuania’s foreign trade in foodstuffs. In 2004, compared to 2003, exports of Lithuanian agricultural and food products increased 24 percent and imports 23 percent. The negative food product trade balance decreased to $4 million. Exports to EU-15 countries and new member countries increased 50 percent, while exports to third countries decreased 10 percent, compared to 2003.

GAIN Report - LH6001 Page 7 of 35
UNCLASSIFIED USDA Foreign Agricultural Service
The increase in food product imports from EU-15 and new member countries was smaller, 10 percent and 40 percent respectively. In 2004 the largest agricultural and food products export partners were Germany, Latvia, Estonia, The Netherlands, and Poland. Trade with these countries represented 57 percent of the total value of foreign trade in 2004. The value of imported agricultural and food products (for internal consumption) were valued at $1 million as were exports of these products. Lithuanian Foreign Trade in Agricultural and Food Products in 2004 (Million $)
681
829
1031
778838
1035
-97-9
-4
-200
0
200
400
600
800
1000
1200
2002 2003 2004
Exports
Imports
Balance
Animal product imports increased 40 percent in 2004 compared with 2003. Imports of vegetables, oils, prepared food products increased 20 percent. The most significant negative trade balance is in vegetable products, primarily due to unfavorable climate conditions which make such production impossible.

GAIN Report - LH6001 Page 8 of 35
UNCLASSIFIED USDA Foreign Agricultural Service
Lithuanian Foreign Trade in Agricultural and Food Products by Product Group 2004 (Million $)
384.86
227.82
21.13
397.18
191.55
310.92
75.70
456.34
193.31
-83.10-54.58 -59.15
-200.00
-100.00
0.00
100.00
200.00
300.00
400.00
500.00
Animal products Vegetableproducts
Fats and Oils Prepared foodproducts
Exports
Imports
Balance
Structure of Exports and Imports of Lithuanian Agricultural and Food Products by Product Group in 2004

GAIN Report - LH6001 Page 9 of 35
UNCLASSIFIED USDA Foreign Agricultural Service
Imports
19%
30%7%
44% Animal products
Vegetable products
Fats and oils
Prepared foodproducts
Foreign Trade in Agricultural and Food Products by Country Group in 2004 (Million $)
Country Group 2002 2003 2004
Exports 433.1 490.4 736.8
Imports 650.4 669.1 803.9
Balance -217.3 -178.7 -67.2
Of which:
EU-15
Exports 250.3 284.5 429.3
Imports 425.1 426.6 470.9
Balance -174.8 -142.1 -41.6
EU-10 (new members)*
Exports 182.7 205.9 307.4
Imports 225.2 242.5 333.0
Balance -42.5 -36.6 -25.6
Third countries
Exports 248.2 338.9 293.9
Imports 127.7 169.4 230.7
Balance 120.5 169.5 63.2
Of which:
CIS countries
Exports 150.1 236.6 242.7
Imports 55.5 78.7 87.7
Balance 94.6 157.9 155.0
USA
Exports 68.3 55.7 22.2

GAIN Report - LH6001 Page 10 of 35
UNCLASSIFIED USDA Foreign Agricultural Service
Imports 10.7 15.7 20.0
Balance 57.6 40.0 2.2
Other countries
Exports 29.9 46.6 29.0
Imports 61.5 74.9 123.0
Balance -31.7 -28.3 -94.0 *New EU member countries since May 1, 2004 Cheese continued to be the number one export in 2004 as it was in 2003, with exports valued at $155.63 million, about 15 percent of all exports. The majority of cheese exports were to the United States in 2003, however, in 2004 only 11 percent of cheese was exported to the United States, with 29 percent exported to Russia and 22 percent to Italy. The decreasing value of the Dollar exchange rate against the Euro, was the primary reason for the change. Baby food, special and medical purpose foodstuffs, sugar and sweeteners, were the largest imports with a total value of about $49 million. These products were imported primarily from Germany (19 percent), Poland (11 percent), Denmark (9 percent) and Austria (8 percent). Other major imported food products were fish fillet and fish meat, with a total import value of $41.55 million in 2004. About 19 percent of fish was imported from the United States, 17 percent from Iceland and 13 percent from Norway. There were significant changes in imports and exports of food and agricultural products in 2004. As export to EU-15 and EU-10 countries increased 50 percent ($144.72 and $101.41 million, respectively) exports to third countries were only 90 percent of the previous year’s level. Imports from EU-10 and EU-15 countries also increased, but at a slower pace, 10 percent ($44.37 million) to EU-15 and 40 percent ($90.49 million) to EU-10 countries. There was an increase of 40 percent in imports from third countries in 2004. Although the agricultural and food products trade deficit with EU countries remains, it did decrease. Major import partners and products: - Germany (13 percent or $139.08 million): soybean oil, coffee, baby food, special and medical foodstuffs; - Poland (11 percent or $113.73 million): pork, coffee, apples, and various foodstuffs; - The Netherlands (10 percent or $102.46 million): poultry, citrus fruits and nuts.

GAIN Report - LH6001 Page 11 of 35
UNCLASSIFIED USDA Foreign Agricultural Service
Agricultural and Food Product Exports and Imports 2002 - 2004 (Thousand Dollars) 2002 2003 2004 Export Import Export Import Export Import Total (01-24 product groups) 681,323.17 778,056.69 829,278.20 838,462.04 1,041,009.26 1,040,358.70 Germany 99,515.81 118,348.87 99,418.70 113,292.82 142,887.89 139,121.41 Poland 10,528.17 51,295.88 21,619.08 55,720.99 29,302.11 113,913.20 The Netherlands 32,559.72 42,917.39 41,081.62 46,054.51 46,986.62 102,534.68 Latvia 123,932.43 45,705.63 121,936.48 50,203.80 178,301.90 97,455.53 Estonia 46,490.25 40,218.91 57,333.91 52,707.15 87,478.77 81,469.30 Denmark 25,156.90 43,797.54 21,825.11 42,108.80 30,869.65 60,468.42 Russia 98,371.97 19,536.80 132,469.15 37,485.85 132,541.44 38,509.05 Spain 7,637.29 28,992.18 6,209.54 33,444.37 19,316.09 35,215.81 France 13,120.56 29,379.26 26,498.24 30,279.12 35,904.65 31,213.84 Ukraine 9,779.79 23,045.35 60,191.27 26,203.84 20,120.42 31,120.63 Hungary 172.99 21,250.11 2,130.42 19,911.30 4,407.04 26,775.95 Italy 14,425.21 19,792.71 18,796.76 21,056.34 54,534.05 23,463.35 Belgium 3,593.10 26,611.23 5,739.72 25,022.85 12,488.13 19,883.42 USA 68,268.98 30,766.16 55,669.15 23,872.75 21,534.08 19,226.16 Source: Lithuania Statistics Department Market indicators:
- Lithuania is a relatively small county with a population of 3.4 million, a considerable percentage of which (33 percent) resides in rural areas.
- From 1995 – 2005 the number of children (age 0 – 14) and people age 15 – 59 decreased 26.7 percent and 2.7 percent respectively, while the number of elderly people increased by 9.2 percent.
- The average gross monthly wage was about $461 in 2004, an increase of 7.9 percent compared with 2003.
- About 18 percent of employment is in the agriculture sector including hunting and fishing
- Food and non-alcoholic beverages account for almost 40 percent of total consumption expenditures. Alcoholic beverage consumption is 2.3 percent, and tobacco is 1.5 percent.
- Average household consumption expenditure for food and non-alcoholic beverages was $67.71 (per capita per month), $3.87 for alcoholic beverages and $2.64 for tobacco products.

GAIN Report - LH6001 Page 12 of 35
UNCLASSIFIED USDA Foreign Agricultural Service
Supplier Strengths / Weaknesses – Market Opportunities and Competitive Threats
Advantages Challenges
Economic stability. Fast growing economy and rising incomes.
Strong competition among manufacturers of food products, especially for traditional foods - milk products, bread, meat.
Well-developed food industry that has gone through privatization and restructuring after regaining independence in 1990.
Significant competition from EU food manufacturers.
Well developed distribution and retail trade systems, rapidly increasing number of supermarkets.
Long shipping distance increases lead-time and price of American food products.
Constant increase of agricultural and food product imports.
Undeveloped business relations between Lithuanian importers of food products and U.S. exporters.
Significant inflows of EU Structural Funds into agriculture, the food industry and rural development in Lithuania.
Lack of information about American achievements and innovations in the agricultural and food processing sectors.
Food producers and processors are open to innovations and place a premium on the quality of raw materials and food additives.
Some EU import restrictions on food produced in U.S.
Need for safe and environmentally friendly food technologies.
The agricultural sector is still undergoing reform, and most small farm production is inefficient.
High quality of American food products. High market entrance fee.
The value of the Litas has grown 33 percent against the Dollar since being pegged to the Euro.
Market is not very big (3.4 million inhabitants), and food consumption is low.
With the increase of real incomes Lithuanians can afford higher quality food products, organic food and dietary products, etc.
More favorable trade conditions in the EU-25 marketplace.
Purchasing habits are changing fast, and more people are increasingly using shopping centers instead of marketplaces.
Lithuanians tend to buy domestic food products.
Geographical location favorable for east-west transit.
Lack of entrepreneurial culture and lack of access to capital for small and medium enterprises.

GAIN Report - LH6001 Page 13 of 35
UNCLASSIFIED USDA Foreign Agricultural Service
Food Sector Structure The food industry is one of the key sectors of Lithuania’s economy. Food and beverage production accounted for 16 percent of total industrial output. It accounts for 4 percent of the GDP, 16 percent of industrial enterprises, and approximately 17 percent of the total employment. The food industry uses a significant amount domestically produced agricultural raw materials, and is closely linked to the agriculture sector. Lithuania has competitive milk products, cheese, meat, poultry, sugar, soft drinks and alcoholic beverage producers. EU subsidies were very important to the competitiveness of Lithuanian food products in third countries.
Local Business Customs/Practices For business meetings (both in the office and restaurant) it is common to wear a suit and tie. Jeans and sneakers are acceptable casual wear. During office meetings quite often soft drinks, tea, coffee, cookies, and similar snack are served. It is common in Lithuania to shake hands and exchange business cards. Business cards in English are sufficient as English is widely spoken by business people. It is recommended that company brochures, products specifications and other printed materials be available for meeting participants. Lithuanians may be delighted if one makes an effort to say few words in Lithuanian at the beginning of the meeting. During the first meeting usually product quality, technical specifications, supply terms and similar questions are discussed, while contracts and agreements are signed after a series of meetings or even later. Contracts should be clear, concise, and translated into both Lithuanian and English. As there is strong competition on the foodstuffs market, importers may require deferred payment terms even if they buy products from manufacturers or wholesalers for the first time. Letters of credit are possible, but not popular due to higher costs and additional bureaucratic formalities that banks require. Western manufacturers and exporters have established subsidiaries or joint ventures in Lithuania which generally manage logistics, payment and advertisement.

GAIN Report - LH6001 Page 14 of 35
UNCLASSIFIED USDA Foreign Agricultural Service
Consumer Tastes and Preferences Lithuanians are increasingly interested in food quality and safety. They became more concerned in the wake of outbreaks of BSE in the United Kingdom and bird flu in Asia. However, no cases of BSE or other dangerous diseases have been reported in Lithuania. Lithuanians are increasingly aware of genetically modified food products, although there is a lack of knowledge about this issue in Lithuania. The average monthly salary in Lithuania is about $461, however, 20 percent of all employed people earn a minimum salary of $194, as a result Lithuanians are very price sensitive. In light of this, most trade centers are primarily oriented toward cheap foodstuffs, however, some offer more expensive products. An example of this trend is IKI’s (major retailer) current development of a network of low price shops. These shops known as Leader Price, will offer about 1,800 food items usually with longer shelf life or frozen food; many of which will be imported from Poland. Another retailer, “RIMI Lietuva” is adopting this strategy and in the summer of 2005 opened extra-low price shops known as SupperNetto. Lidl, a German company has also begun developing a network of low price shops in Lithuania. According to a recent opinion poll conducted by RAIT Market Research, almost three-fourths of Lithuanians prefer locally produced food to imported food. About 72 percent of those polled indicated product origin significantly influences their buying decisions. Only about 11 percent indicated a neutral attitude toward the origin of products, and 17.4 percent indicated that origin of product was not considered when purchasing food. As for manufactured goods, nearly 33 percent of those polled indicated a preference for domestic products. Among those who prefer domestic food to imports, about 61 percent indicated that Lithuanian products were of higher quality, another 35.6 percent indicated that they wanted to support local producers, 11.5 percent said that local products were cheaper, and 2.2 percent indicated that they were environmentally safer. The poll found that the origin of food products was more important to women than men. The percentage of those who indicated a preference for domestic food was about 76 percent among women and 67.3 percent among men. The poll was conducted February 17–22, 2005. Labeling Requirements The rules for labeling products sold in Lithuania are regulated by the Ministry of Economy in accordance with the rules for Labeling and Providing Information on Prices of Goods Sold in Lithuania (State News, 2002, No 50-1927, 2002 May 15, No. 170), as amended on May 8, 2004 (State News, 2004, No. 76-2630) and June 20, 2004 (State News, 2004, No. 96-3551) to be harmonized with relevant EU legislation of foodstuff labeling: European Parliament and EU Council directives 2000/13/EC (labeling, presentation and advertising foodstuffs), 79/112/EEC (labeling foodstuffs), 90/496/EEC (nutrition labeling for foodstuffs), 89/396/EEC (identifying the batch of foodstuff). This Order and its amendments are available at Seimas (Parliament of Lithuania) data base at: http://www3.lrs.lt/cgi-bin/preps2?Condition1=166589&Condition2, http://www3.lrs.lt/cgi-bin/preps2?Condition1=232834&Condition2 and http://www3.lrs.lt/cgi-bin/preps2?Condition1=235710&Condition2. The labeling order also lists other legal acts related to labeling, importing and storing agricultural products, foodstuffs and food additives. These laws apply to all entities importing, selling, transporting or packaging foodstuffs: manufacturers, importers, and representatives of manufacturers, distributors, and sellers.

GAIN Report - LH6001 Page 15 of 35
UNCLASSIFIED USDA Foreign Agricultural Service
According to the requirements of the Order “Regarding Rules on Labeling and Providing Information on Prices of Goods Sold in the Republic of Lithuania” The following information is required on all labels to be placed on foodstuffs:
- Name of the product; - Name of the manufacturer or trademark; - For imported goods – name of the country of residence of the manufacturer; - Country of product origin, if it is different from the country of the manufacturer’s residence; - Name of the importer or trademark and address; - Date of expiration of the product. Depending on the product, terms ‘Suitable for use until…’, ‘Best until…’ can be used; - Date of manufacturing of the product; - Storage conditions; - Purpose of product, if it is not clear from its name; instructions for use, if needed for the safe and proper use of product; - Sale price and price of one standard unit of product; - Composition (ingredients) of the product, in descending order by mass of the ingredient.
All labels must be in the Lithuanian language, visible, easily readable, non-erasable, clear, and not misleading to consumers. Information describing product safety requirements, product purpose, and product use can be in graphical form, but pictures cannot be used instead of the name of the product. Adhesive labels in the Lithuanian language are allowed. Food Additives Regulations Hygienic Norm HN 53:2003, (State News, 2004, No. 45-1491), regulates the use of food additives in Lithuania. It is available at http://www3.lrs.lt/cgi-bin/preps2?Condition1=230886&Condition2 (in the Lithuanian language). It contains a list of food additives, food additives allowed for use by Quantum Satis principle, antioxidants, sweeteners, colors, and the maximum allowed concentrations in different foodstuffs. This Hygienic Norm is harmonized with the following EU legislation on food additives: - Directive 2003/52/EC of the European Parliament and of the Council of June 18, 2003 amending Directive 95/2/EC as regards the conditions of use for a food additive E 425 konjac; - Directive 97/60/EC of the European Parliament and of the Council of October 27, 1997 (third amendment) Directive 88/344/EEC on the approximation of the laws of the Member States on extraction solvents used in the production of foodstuffs and food ingredients; - Directive 96/83/EC of the European Parliament and of the Council of December 19, 1996 amending Directive 94/35/EC on sweeteners for use in foodstuffs; - Decision No 292/97/EC of the European Parliament and of the Council of December 19, 1996 on the maintenance of national laws prohibiting the use of certain additives in the production of certain specific foodstuffs; - European Parliament and Council Directive no 95/2/EC of February 20, 1995 on food additives other than colors and sweeteners; - European Parliament and Council Directive 94/34/EC of June 30, 1994 amending Directive 89/107/EEC on the approximation of the laws of Member States concerning food additives authorized for use in foodstuffs intended for human consumption; - European Parliament and Council Directive 94/35/EC of June 30, 1994 on sweeteners for use in foodstuffs; - European Parliament and Council Directive 94/36/EC of June 30, 1994 on colors for use in foodstuffs;

GAIN Report - LH6001 Page 16 of 35
UNCLASSIFIED USDA Foreign Agricultural Service
- Council Directive of December 21, 1988 on the approximation of the laws of the member states concerning food additives authorized for use in foodstuffs intended for human consumption (89/107/EEC); - Council Directive of June 13, 1988 on the approximation of the laws of the member states on extraction solvents used in the production of foodstuffs and food ingredients (88/344/EEC). As the list of allowed food additives may vary slightly from country to country, it is recommended that U.S. exporters check whether the product to be exported to Lithuania meets all local ingredient requirements. All food additives are required to be identified on the product label. Food additives must be marked with the letter E followed by the three-digit or four-digit European Union registration number. Foodstuffs are not required to have labels in the Lithuanian language upon entry into Lithuania. Usually labels in the Lithuanian language are affixed at the wholesale and retail levels; however, it is mandatory that each product be labeled in the Lithuanian language prior to being sold. Market Sector Structure and Trends Wholesale and Retail Sector Retail trade is one of the most rapidly developing sectors in Lithuania’s economy. With domestic demand rapidly increasing, retail sector revenue totaled $6.9 million in 2004 a 9.3 percent increase compared with 2003. Revenue for sales of alcoholic beverages and tobacco products increased 7.2 percent. Retail trade revenue at market places totaled $428 million in 2004, a 1.1 percent decrease compared to 2003. In 2004 the largest retailers continued to expand rapidly both domestically and regionally. These retailers have expanded to neighboring counties including Latvia, Estonia, Poland and well as Romania. The potential for developing shopping centers beyond the major cities of Vilnius, Kaunas and Klaipeda remains high. There are in general five categories of retail outlets: supermarkets, small- and medium-sized stores, kiosks, gas stations and marketplaces. The total number of shops in the retail sector has stabilized at 16,000, however, the tendency toward market concentration into hyper- and supermarkets may influence the numbers downward. As major retailers continue to develop large shopping centers, small retailers are being forced into bankruptcy or into forming retail associations. VP Market continues to be the largest retail company in Lithuania with a 22.4 percent share of the retail market and 34.5 percent share in the food product category. Other important retail chains are “Iki” (10.1 percent), “RIMI Lietuva” (5.3 percent), “Aibes mazmena” (5 percent) and “Norfos mazmena” (4.2 percent). Food retailers source supplies primarily through wholesalers or directly from food producers. These retail chains account for about 47 percent of the retail market in Lithuania. This level of market penetration is considered low compared to the level of retail penetration in Western countries, where they usually account for 80-90 percent of the market. The largest Baltic retail chain, VP Market is a privately owned Lithuanian company with sales in 2004 of $1.4 billion. VP Market has grown into an international chain and now owns 195 shopping centers in Lithuania, 89 in Latvia, 21 in Estonia, 8 in Romania and 1 in Bulgaria. In 2005 VP Market plans to open 100 new shopping centers, an investment of about $120 million. VP Market has subsidiaries such as Minima, Media, Maxima, Maxima Baze and Hyper Maxima.

GAIN Report - LH6001 Page 17 of 35
UNCLASSIFIED USDA Foreign Agricultural Service
VP Market and Rimi have developed large hypermarkets. Rimi and Maxima hypermarkets offer a range of products from food to household tools, car accessories and electronics, while “Iki” continues to develop neighborhood supermarkets and stores offering a similar range of products at low prices. Supermarkets and hypermarkets in major cities are becoming more popular, as they attract significant flows of customers, serving as host to restaurants, cinemas, and dry cleaning, etc. Market Shares of Major Retail Chains (2002)
Market shares of major retail chains
Type:
Retail chain Total Billion $ Food products Non-food products
Revenue 2,938.35 1,545.56 1,392.78
VP Market 22.4% 34.5% 8.9%
IKI 10.1% 16.5% 3%
RIMI Lietuva 5.3% 8% 2.2%
Norfos mazmena 4.2% 6.8% 1.3%
Aibes mazmena 5% 6.9% 1.9% Major Retail Chains (2002)
Shops Size of shops by sales area
Up to 394
394-1,309
1,312-3,276
3,280-8,197
Retail chain Number
Sales area, sq.
feet sq. feet sq. feet sq. feet sq. feet
8,200 sq feet and above
Total 8,049 4,189,170 19,942 4,747 1,151 475 85
75.5% 18.0% 4.4% 1.8% 0.3%
VP Market 161 369,397 16 305 131 52 23
3% 57% 24.8% 9.9% 4.3%
IKI 107 271,919 10 135 108 92 6.5
2.8% 38.3% 30.8% 26.2% 1.9%
RIMI Lietuva 35 148,047 0 16.4 72. 16.4 10
0 14.3% 62.9% 14.3% 8.6%
Norfos mazmena 45 109,632 0 49 62 33 3.28

GAIN Report - LH6001 Page 18 of 35
UNCLASSIFIED USDA Foreign Agricultural Service
0 33.3% 42.2% 22.2% 2.2%
Aibes mazmena 362 235,872 708 400 55.7 19.6 3.28
59.6% 33.7% 4.7% 1.7% 0.3%
Source: Competition Council of the Republic of Lithuania According to a recent AC Nielsen survey, the number of small and average size shops is decreasing, as large trade centers dominant the retail market. There are 9,700 food retail stores in Lithuania, although trade centers (with sales space of 984 – 8,202 sq. feet) and hypermarkets (more than 8,202 sq. feet) account for only 3 percent of the total number of stores (compared with 20 percent in Western Europe). This is significant because they now represent nearly 56 percent of the retail market. During 2004 revenue from retail trade for the four largest retail chains increased 8 percent and represented 66 percent of total retail trade.
According to the survey, the average Lithuanian visits large trade centers – supermarkets or hypermarkets every other day and spends 93 percent of his/her total expenditure there. Market places remain competitive with big trade centers for products such as vegetables and fresh meat, while kiosks and gas stations compete with supermarkets in sales of such products as cigarettes and alcoholic beverages. Hotel, Restaurant and Institutional Sector
Hotels, restaurants and the catering sector began to develop in the late eighties and gained momentum during the 1990s. Over the past several years, revenue for restaurants, bars and catering enterprises has increased steadily. In 2003 the increase was 17 percent above the 2002 level.

GAIN Report - LH6001 Page 19 of 35
UNCLASSIFIED USDA Foreign Agricultural Service
Restaurant and Bar Revenue (million $ VAT excluded)
2000 2001 2002 2003 Retail sale of food products, alcoholic beverages and food products 2.0 1.9 2.1 2.3 Retail sale of non food products 1.3 1.4 1.5 1.6 Restaurants, bars and other catering enterprises 123 127 151 178 In 2004 revenue for restaurants, bars and catering enterprises was $206 million, a 14 percent increase compared with 2003. This high growth can be attributed to the constantly increasing number of foreign tourists (3.6 million visitors in 2004), especially from Western Europe, and an increasing number of Lithuanians who can afford to dine at restaurants. Revenue from tourism was $800 million in 2004, 17 percent more than in 2003. The total number of guests in Lithuania’s lodging establishments rose 32.5 percent to 1.12 million in 2004. At least 53 percent were foreign visitors. For instance, hotels and other lodging in Vilnius posted a 42.7 percent rise, to 378,200, in total number of guest s in 2004. The number of foreign guests surged 45.6 percent to 221,200. Budget airline Ryanair planed to begin operations in Kaunas by the end of 2005, as a result tourism is expected to continue to grow. The following international hotel chains are present in Lithuania: Holiday Inn, Le Meridien, Novotel, Radisson SAS, Reval, however, the majority of the hotels in Lithuania are owned by local entrepreneurs and are generally small to medium size and located in major cities and resort areas. Pizza restaurants are gaining in popularity, especially with young people, in addition to the popularity of foreign cuisines, such as French, Italian, Russian, but in particular Asian. Chinese restaurants can be found in major Lithuanian cities. The highest quality catering companies are located in major cities and health resorts. Most restaurants are locally owned and small to medium in size. As for American restaurant chains, only McDonalds has several restaurants in Vilnius, Kaunas and Klaipeda. Number of Restaurants and other Catering Enterprises 2000 2001 2002 2003 Number of Restaurants, bars and canteens
2,489 2,433 2,563 2,752
Number of seats, thousands
108 107 116 130
Average seats per catering unit
43.4 44.0 45.3 47.2
GAIN Report - LH6001 Page 20 of 35
UNCLASSIFIED USDA Foreign Agricultural Service
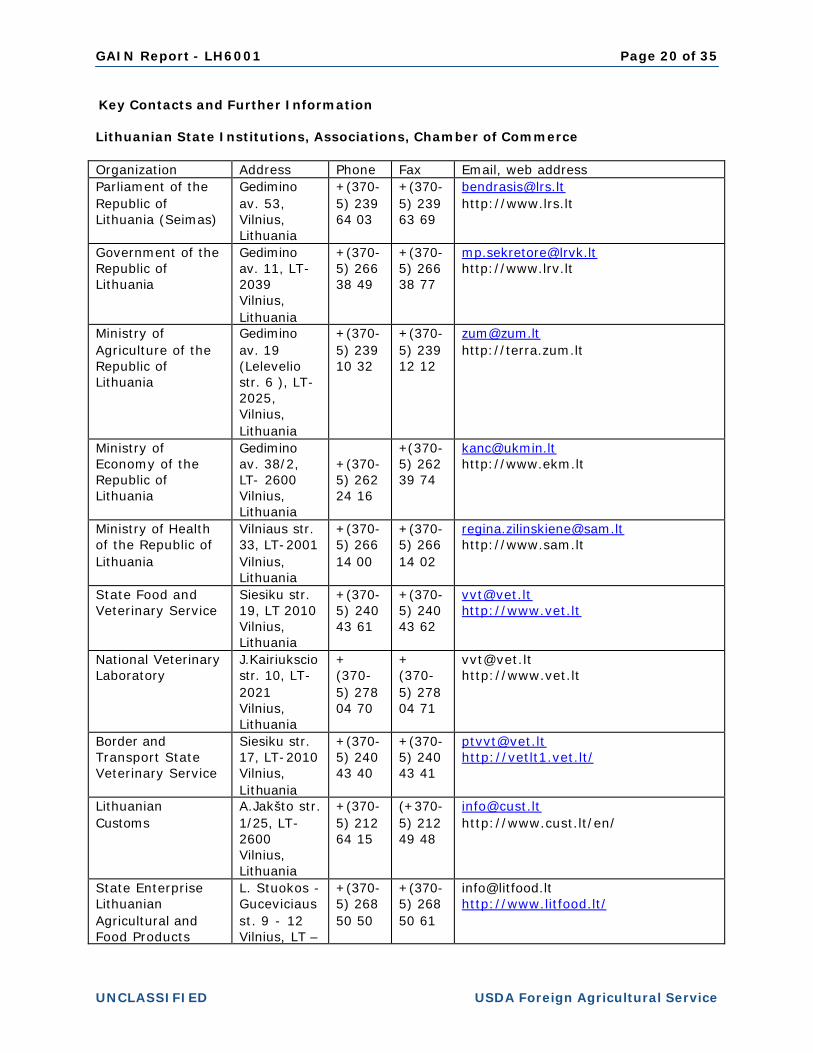
Key Contacts and Further Information Lithuanian State Institutions, Associations, Chamber of Commerce
Organization Address Phone Fax Email, web address Parliament of the Republic of Lithuania (Seimas)
Gedimino av. 53, Vilnius, Lithuania
+(370-5) 239 64 03
+(370-5) 239 63 69
[email protected] http://www.lrs.lt
Government of the Republic of Lithuania
Gedimino av. 11, LT-2039 Vilnius, Lithuania
+(370-5) 266 38 49
+(370-5) 266 38 77
[email protected] http://www.lrv.lt
Ministry of Agriculture of the Republic of Lithuania
Gedimino av. 19 (Lelevelio str. 6 ), LT-2025, Vilnius, Lithuania
+(370-5) 239 10 32
+(370-5) 239 12 12
[email protected] http://terra.zum.lt
Ministry of Economy of the Republic of Lithuania
Gedimino av. 38/2, LT- 2600 Vilnius, Lithuania
+(370-5) 262 24 16
+(370-5) 262 39 74
[email protected] http://www.ekm.lt
Ministry of Health of the Republic of Lithuania
Vilniaus str. 33, LT-2001 Vilnius, Lithuania
+(370-5) 266 14 00
+(370-5) 266 14 02
[email protected] http://www.sam.lt
State Food and Veterinary Service
Siesiku str. 19, LT 2010 Vilnius, Lithuania
+(370-5) 240 43 61
+(370-5) 240 43 62
[email protected] http://www.vet.lt
National Veterinary Laboratory
J.Kairiukscio str. 10, LT-2021 Vilnius, Lithuania
+ (370-5) 278 04 70
+ (370-5) 278 04 71
[email protected] http://www.vet.lt
Border and Transport State Veterinary Service
Siesiku str. 17, LT-2010 Vilnius, Lithuania
+(370-5) 240 43 40
+(370-5) 240 43 41
[email protected] http://vetlt1.vet.lt/
Lithuanian Customs
A.Jakšto str. 1/25, LT-2600 Vilnius, Lithuania
+(370-5) 212 64 15
(+370-5) 212 49 48
[email protected] http://www.cust.lt/en/
State Enterprise Lithuanian Agricultural and Food Products
L. Stuokos - Guceviciaus st. 9 - 12 Vilnius, LT –
+(370-5) 268 50 50
+(370-5) 268 50 61
[email protected] http://www.litfood.lt/

GAIN Report - LH6001 Page 21 of 35
UNCLASSIFIED USDA Foreign Agricultural Service
Market Regulation Agency
01122, Lithuania
Association of Lithuanian Chambers of Commerce, Industry and Crafts
J.Tumo-Vaižganto st. 9/1-63a, Vilnius, Lithuania
+(370-5) 2612102
[email protected] http://www.chambers.lt/en/index.php
American Chamber of Commerce in Lithuania
Lukiskiu st. 5, Room 204 LT-01108, Vilnius, Lithuania
(370-5) 261 11 81
(370-5) 212 6128
[email protected]; [email protected] http://www.acc.lt/en/index.php
Lithuanian Association of Breweries
Aludariu st..1/2, 2649 Vilnius.
+370 5 249 8495
+370 5 249 6916
Lithuanian Association of Agricultural Machinery
Verkiu st.5, 2005 Vilnius.
+370 5 275 24 52
. +370 5 275 2452
Lithuanian Association of Dairy Enterprises "Pieno centras"
Vykinto 7-3 st., 2004 Vilnius, Lithuania
:+370 5 271 55 52,
:+370 5 271 55 53,
Association of Lithuanian Food Producers"Lietuvos maisto pramone"
A.Vienuolio st. 8, 2600 Vilnius.
:+370 5 262 70 22
:+370 5 212 44 47
Lithuanian Association of Grain Processing Enterprises
A.Smetonos st. 8-5, 2600 Vilnius, Lithuania
:+370 5 210 71 00
:+370 5 262 51 04
Lithuanian Association of Meat Processing Enterprises
A.Vienuolio st. 8, 2600 Vilnius, Lithuania
+370 5 212 68 14
+370 5 212 68 14
Lithuanian Association of Sugar Industry Enterprises "Cukrus"
Kaštonu st. 3-8, 2001 Vilnius, Lithuania
+370 5 262 84 22
+370 5 262 84 22

GAIN Report - LH6001 Page 22 of 35
UNCLASSIFIED USDA Foreign Agricultural Service
Main Lithuanian Food and Agricultural Sector Companies Company Turnover
in 2004, Thousand $
Main activities
Number of Employees
Address Tel./Fax Email, Web Page
VP Market, UAB
1,281,097Trade in food and non food products, management of retail chain
20,570Vilnius, Savanoriu st. 247
+370 (5)2686787/2686700
[email protected], www.vpmarket.lt
Palink, UAB 363,609Trade in food and non food products, management of retail chain
5,300Vilnius, Lentvario st. 33
+370 (5)2601700/2601781
[email protected], www.iki.lt
Sanitex, UAB 313,380Wholesale trade, logistics
1,650Kaunas, Raudondvario rd. 131
+370 (37)401111/401111
[email protected], www.sanitex.lt
MG Baltic 282,125Wholesale trade, logistics
n.d. Vilnius, J.Jasinskio st. 16
+370 (5)2786219/2786206
[email protected], www.mgbaltic.lt
Norfos mažmena, UAB
276,107Trade in food and non food products, management of retail chain
3,308Vilnius, Verkiu st. 29
+370 (5)2700046/2737032
[email protected], www.norfa.lt
Rokiškio suris, AB,
158,941Dairy production
1,998Rokiškis, Pramones st. 3
+370 (458)55200/55300
[email protected]; www.rsuris.lt
Rimi Lietuva, UAB
157,746Trade in food and non food products, management of retail chain
2,000Vilnius, Savanoriu pr. 16
+370 (5)2461100/2461033
[email protected] , www.rimi.lt
CBA Aibe 146,831Trade in food and non food products, management of retail chain
n.d. Vilnius, Savanoriu pr. 247
+370 (5)2686686/2686665
[email protected], www.aibe.lt
Pieno žvaigždes, group of companies
139,969Dairy production
2,882Vilnius, Laisves pr.125
+370 (5)2461414/2461415
[email protected], www.pienozvaigzdes.lt
Žemaitijos pienas, AB
119,357Dairy production
2,253Telšiai, Sedos st. 35
+370 (444)22201/74897
Masterfoods, UAB
111,202Production of animal food, wholessale trade in foodstuff
n.d. Gargzdai, Statybininku st. 2
+370 (46)394901/394909

GAIN Report - LH6001 Page 23 of 35
UNCLASSIFIED USDA Foreign Agricultural Service
Švyturys-Utenos alus, UAB
106,620Brewery 469Vilnius, Metalo st. 2
+370 (5)2397600/2397610
[email protected] , www.svyturys.lt, http://www.utenosalus.lt
Litagros grupe, 89,192Production and sales of agricultural products
714Vilnius, Savanoriu pr. 173
+370 (5)2361600/2361601
[email protected]; http://www.lytagra.lt/
Kraft Foods Lietuva, AB
83,883Production of foodstuffs, trade
600Kaunas, Taikos pr. 33
+370 (37)305110/305244
www.kraftfoods.lt
Bennet Distributors, UAB
64,789Wholesale trade, logistics
250Vilnius, Metalo st. 2b
+370 (5)2131611/2339184
[email protected], www.bennet.lt
Marijampoles pieno konservai, UAB
51,783Production of foodstuffs, trade
647Marijampole, Kauno st. 117
+370 (343)98450/98431
[email protected], www.milk.lt
Krekenavos agrofirma, group of companies
46,709Meat processing
1,011Panevežys distr., Krekenava
+370 (45)505300/505331
[email protected], www.krekenavos.lt
Danisco Sugar Panevezys, AB
44,636Sugar production
n.d. Panevezys, Imoniu st. 22
+370 (45)503666/503630
Malsena, AB 36,543Grain processing
295Panevežys, J.Janonio st. 12
+370 (45)461133/466235
[email protected], www.malsena.lt
Kalnapilio-Tauro grupe, AB
35,402Brewery n.d. Panevežys, Taikos al. 1
+370 (5)2123754 [email protected], www.kalnapilis.lt
Alita, AB 35,286Production of alcoholic beverages
413Alytus, Miškininku st. 17
+370 (315)57243/79467
[email protected], www.alita.lt
Kretingos grudai, AB
33,419Grain processing
126Kretinga, Tiekeju st. 41
+370 (445)77066/77072
[email protected], www.kgrudai.lt
Agrovet, UAB 33,099Meat processing
240Klaipedos r., Kretingale
+370 (46)446576/446515
[email protected], www.agrovet.lt
Stumbras, AB 31,612Production of alcoholic beverages
650Kaunas, K.Bugos st. 7
+370 (37)308800/308833
[email protected], www.stumbras.lt
Nematekas, ŽUB
26,831Meat processing
573Kaišiadoriu distr., Rumšiškiu sen., Dovainoniu village
+370 (346)46723 /69377
[email protected] , http://www.nematekas.lt/
Vilkyškiu pienine, UAB
26,461Production of milk products
403Pagegiu municipality, Vilkyškiai
+370 (441)55330/55242
[email protected] , www.cheese.lt
Ragutis, AB 22,852Brewery 191Kaunas, Kaunakiemio st. 2
+370 (37)324345/321503
[email protected], www.ragutis.lt

GAIN Report - LH6001 Page 24 of 35
UNCLASSIFIED USDA Foreign Agricultural Service
Kraitene, UAB 22,239Production of fish and milk products, distribution of frozen food
700Marijampoles distr., Fabriko st. 8
+370 (343)92745/92747
[email protected], www.kraitene.lt
Kaišiadoriu paukštynas, AB
21,981Poultry production
683Kaišiadorys, Paukštininku st. 15
+370 (346)51034/52310
[email protected], http://www.kaispauk.lt/
Alvas ir Ko, UAB
18,310Wholesale trade
150Panevežys, Rekliu st. 1a
+370 (45)516131/508586
[email protected], www.alvas.lt
Gubernija, AB 17,736Brewery 338Šiauliai, Dvaro st. 179
+370 (41)591900/591911
http://www.gubernija.lt/
Delano, UAB 14,472Catering 729Vilnius, Naugarduko st. 99
+370 (5)2744 608/ 2744 603
[email protected], www.delano.lt
Lupra, UAB 13,098Wholesale and retail trade
291Šiauliai, Pramones st. 21
+370 (41)501032/540181
* - as of December 2004 n.d. - data not available UAB - closed stock company
AB - stock company Trade Fairs in Lithuania
Show dates Organizers
May 10 – 13, 2006 Agrobalt Trade fair for agriculture, food and packaging industry Lithuanian Exhibition Center "Litexpo", Laisves ave. 5, LT- 04215 Vilnius Project Manager Mrs. Saule Skaceviciene phone: (+370-5) 2686829, fax: (+370-5) 2686826, e-mail: [email protected], http://www.litexpo.lt
November 09 – 11, 2006 BaltShop.BaltHotel.BaltGastro International Exhibition of Shop, Hotel, Restaurant requisites and Grocery Lithuanian Exhibition Center "Litexpo", http://www.litexpo.lt Project Manager Mrs. Saule Skaceviciene

GAIN Report - LH6001 Page 25 of 35
UNCLASSIFIED USDA Foreign Agricultural Service
Appendix 1. Statistics Key Trade and Demographic Information Territory 65,300 sq. kl
25,206 sq. miles Total population (as of January 1, 2004) / Annual Growth Rate (%) 3,445,857 / -3.0% Urban Areas / Annual Growth Rate (%) 2,297,400 / -1.7 % Rural Areas / Annual Growth Rate (%) 1,148,457 / -5.6% Density, population per sq. km 52.8 Real GDP Growth 6.7 % Labor force 1,641,900 Employed: Public sector 403,900 Private sector 1,034,100 Unemployed 203,900 Labor force employment rate (age 15 – 64): Males 63.7% Females 58.4% Unemployment rate (in 2005) 7.2% Average monthly gross earnings (in 2004) $462 The Lita is pegged to the Euro at a rate of 1 EUR = 3.4528 Litas. An exchange rate of $1 = 2.84 LTL was used to convert Litas into US dollars. This is the official Central Bank of Lithuania exchange rate as of August 22, 2005.

GAIN Report - LH6001 Page 26 of 35
UNCLASSIFIED USDA Foreign Agricultural Service
Employment by Economic Sector
0.0
2.0
4.0
6.0
8.0
10.0
12.0
14.0
16.0
18.0
20.0
1 2 3 4 5 6 7 8 9 10 11 12 13 14 15
2002
2003
Percent
2002 2003
1Agriculture, hunting, forestry and fishing 17.8 17.9
2Mining and quarrying 0.3 0.4
3Manufacturing 18.5 18.4
4Electricity, gas and water supply 2.0 1.9
5Construction 6.7 7.4
6
Wholesale and retail trade; repair of motor vehicles, motorcycles and personal and household goods 15.0 14.9
7Hotels and restaurants 2.0 2.0
8Transport, storage and communication 6.2 6.4
9Financial mediation 1.0 1.2
10Real estate, business activities 3.9 3.7
11Public administration and defense, compulsory social security 5.8 5.2
12Education 9.9 9.4
13Health and social work 6.7 6.9
14Other community, social and personal service activities 3.8 3.8
15Private households with employed persons 0.4 0.5

GAIN Report - LH6001 Page 27 of 35
UNCLASSIFIED USDA Foreign Agricultural Service
Household consumption expenditures (percent)
2002 2003
Consumption expenditure 100.0 100.0
Food and non-alcoholic beverages 38.4 39.5
Alcoholic beverages 2.0 2.3
Tobacco 1.6 1.5
Clothing and footwear 7.9 7.9
Housing, water, electricity, gas and other fuel 13.2 12.7
Furnishings, household equipment and routine maintenance of the house 5.3 3.8
Health care 5.3 4.9
Transport 7.1 8.6
Communication 5.0 5.2
Recreation and culture 4.9 4.3
Education 0.6 0.8
Hotels, cafes, restaurants, canteens 4.3 4.2
Miscellaneous goods and services 4.4 4.3 Average annual retail prices for main foodstuffs ($ per kilo)
2001 2002 2003
Beef with bone (I category) 3.66 3.32 2.20
Chicken boilers (I category) 3.37 2.75 2.15
Boiled sausages 4.60 4.46 4.00
Alive carp 2.27 2.85 2.47
Butter 2.99 3.60 4.03
Pasteurized milk (2.5% fat) 0.49 0.48 0.57
Sour cream (25% fat) 2.32 2.01 2.15
Curd (9% fat) 2.78 3.02 3.38
Hen's eggs, per 10 pieces 0.98 0.81 0.97
Sugar 1.05 1.13 1.14
Wheat flour, best quality 0.49 0.47 0.46
Rye-wheat bread 0.76 0.76 0.75
Rice 0.70 0.62 0.56
Potatoes 0.26 0.43 0.26
Vodka produced in Lithuania of 40% alcohol, per liter 8.77 8.42 8.44

GAIN Report - LH6001 Page 28 of 35
UNCLASSIFIED USDA Foreign Agricultural Service
Producer price indices of agricultural products (2001-2003)
2001 2002 2003
Total index 114.7 99.6 89.2
Crop products 113.3 112.6 90.0
Cereals 95.5 104.3 98.3
Soft wheat 93.4 101.2 98.0
Rye 95.5 107.5 95.2
Barley 96.8 108.7 97.9
Industrial crops 97.6 96.3 99.3
Rape seed 109.3 107.7 100.6
Sugar beet 93.2 92.4 99.8
Flax fiber 65.4 92.3 100.1
Protein crops 103.7 91.7 94.2
Vegetables 97.1 75.1 172.2
Tomatoes 113.2 80.3 130.7
Cabbages 79.3 98.0 161.8
Cucumbers 123.7 51.0 235.5
Carrots 92.6 58.9 217.4 Producer prices of crop products ($ per ton)
2001 2002 2003
Cereals grain
wheat 132 136 133
rye 136 138 137
barley 130 135 125
oat 100 106 111
triticale 106 113 110
buckwheat 254 169 179
Dried pulses 192 170 160
Sugar beet 57 53 50
Flax fiber 339 312 325
Rapeseed 244 262 264
Potatoes 152 90 86
Vegetables 381 301 383
cabbages 140 225 182
cucumbers 680 406 586
onions 160 235 295
beetroot 116 127 139
GAIN Report - LH6001 Page 29 of 35
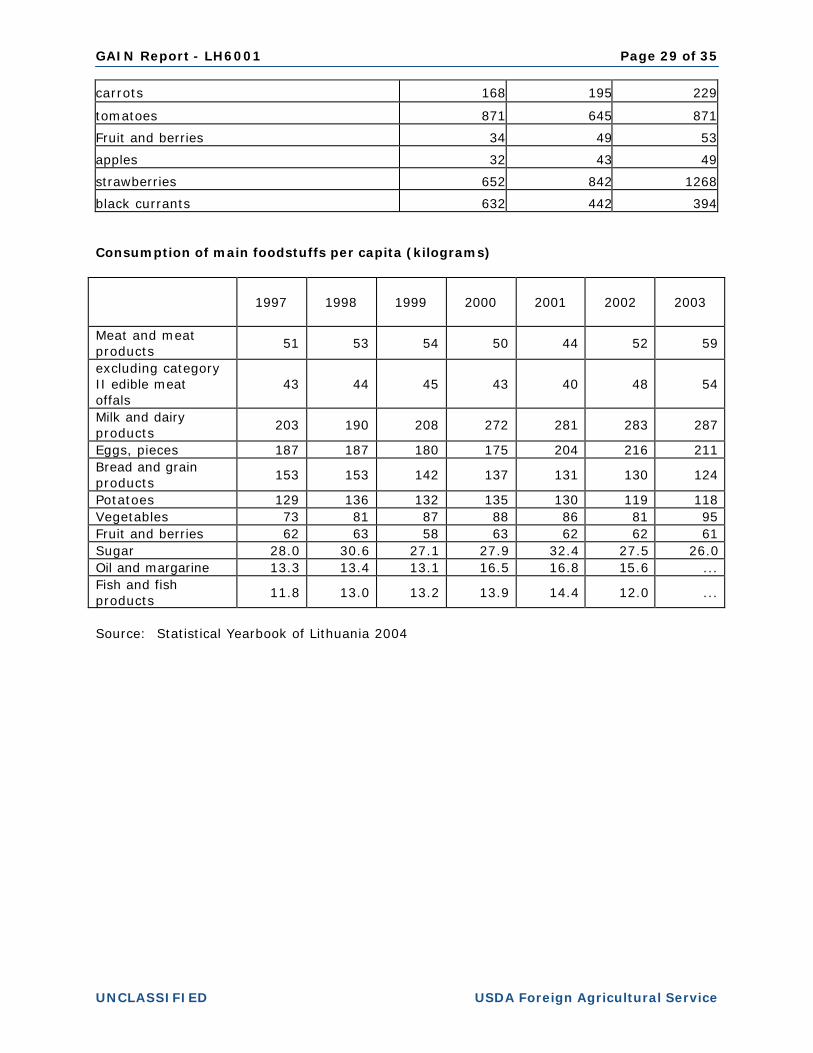
UNCLASSIFIED USDA Foreign Agricultural Service
carrots 168 195 229
tomatoes 871 645 871
Fruit and berries 34 49 53
apples 32 43 49
strawberries 652 842 1268
black currants 632 442 394 Consumption of main foodstuffs per capita (kilograms)
1997 1998 1999 2000 2001 2002 2003
Meat and meat products
51 53 54 50 44 52 59
excluding category II edible meat offals
43 44 45 43 40 48 54
Milk and dairy products
203 190 208 272 281 283 287
Eggs, pieces 187 187 180 175 204 216 211 Bread and grain products
153 153 142 137 131 130 124
Potatoes 129 136 132 135 130 119 118 Vegetables 73 81 87 88 86 81 95 Fruit and berries 62 63 58 63 62 62 61 Sugar 28.0 30.6 27.1 27.9 32.4 27.5 26.0 Oil and margarine 13.3 13.4 13.1 16.5 16.8 15.6 ... Fish and fish products
11.8 13.0 13.2 13.9 14.4 12.0 ...
Source: Statistical Yearbook of Lithuania 2004

GAIN Report - LH6001 Page 30 of 35
UNCLASSIFIED USDA Foreign Agricultural Service
Foodstuffs and agricultural products exports and imports (2002 - 2004 and first quarter of 2005), thousand $ Exports
2002 2003 20042005 I Q
Total 6,731,493 7,486,842 9,059,142 4,320,371
Foodstuffs and Agricultural products 681,323 829,278 1,030,626 476,048
Section I 01-05 254,174 270,798 388,288 160,538
Live animals; animal products
1Live animals 15,852 13,048 16,880 7,884
2Meat and edible meat offal 14,370 16,097 33,353 20,839
3Fish and crustaceans, molluscs and other aquatic invertebrates
35,993 48,886 59,371 31,806
4Dairy produce; birds' eggs; natural honey; edible products of animal origin, not elsewhere specified or included
186,656 190,720 275,159 98,470
5Products of animal origin, not elsewhere specified or included
1,305 2,046 3,525 1,539
Section II 06-14 108,159 202,135 224,122 119,249
Vegetable products
6Live trees and other plants; bulbs, roots and the like; cut flowers and ornamental foliage
581 1,032 2,005 613
7Edible vegetables and certain roots and tubers 18,784 36,829 44,466 9,343
8Edible fruit and nuts; peel of citrus fruits or melons 15,638 19,656 32,811 17,9479Coffee, tea, maté and spices 6,915 9,064 8,010 4,115
10Cereals 39,634 92,355 88,156 61,430
11Products of the milling industry; malt; starches; inulin; wheat gluten
2,004 4,542 12,178 6,447
12Oil seeds and oleaginous fruits; miscellaneous grains, seeds and fruit; industrial or medicinal plants; straw and fodder
24,457 38,362 36,087 19,128
13Lac; gums, resins and other vegetable saps and extracts
114 186 318 174
14Vegetable plaiting materials; vegetable products not elsewhere specified or included
32 107 93 51
Section III 15 17,246 14,755 20,997 10,395
15Animal or vegetable fats and oils and their cleavage products; prepared edible fats; animal or vegetable waxes
17,246 14,755 20,997 10,395
Section IV 16-24 301,744 341,591 397,219 185,865
Prepared foodstuffs; beverages, spirits and vinegar; tobacco and manufactured tobacco substitutes

GAIN Report - LH6001 Page 31 of 35
UNCLASSIFIED USDA Foreign Agricultural Service
16Preparations of meat, of fish or of crustaceans, molluscs or other aquatic invertebrates
42,323 50,322 62,628 33,296
17Sugars and sugar confectionery 14,220 20,135 39,651 20,234
18Cocoa and cocoa preparations 23,261 34,692 32,030 12,971
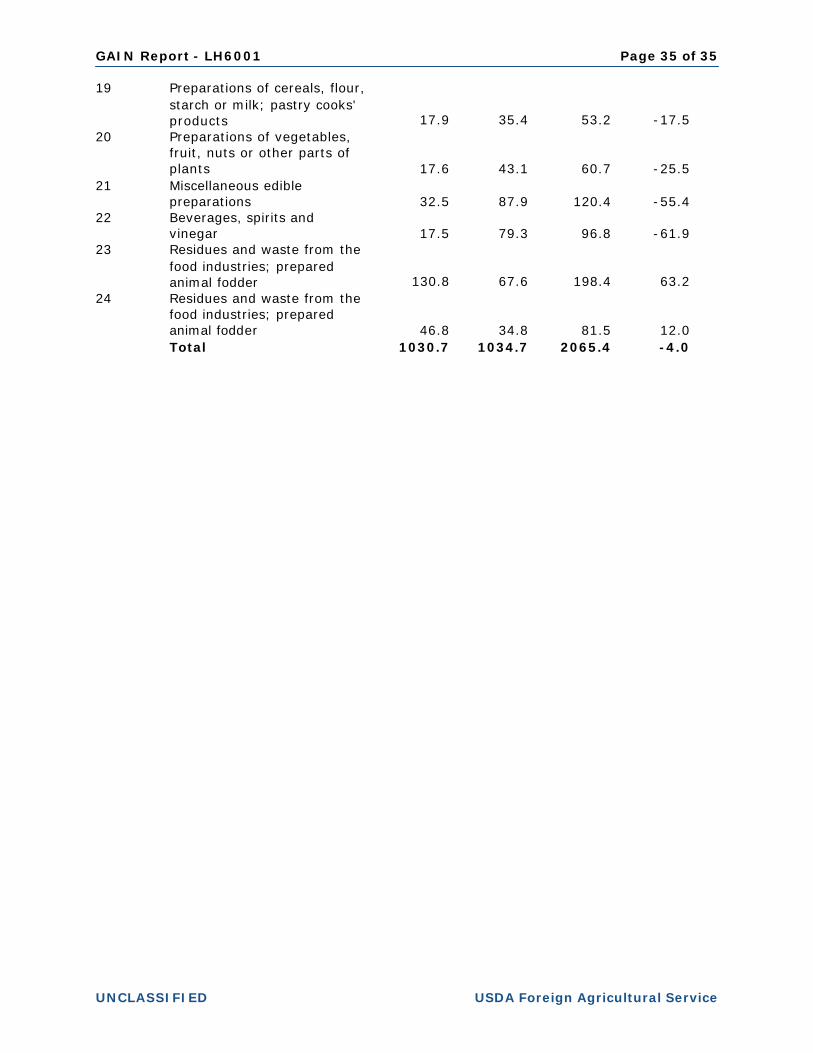
19Preparations of cereals, flour, starch or milk; pastrycooks' products
8,816 10,788 17,853 9,015
20Preparations of vegetables, fruit, nuts or other parts of plants
17,929 21,067 17,558 6,764
21Miscellaneous edible preparations 22,321 23,146 32,486 13,832
22Beverages, spirits and vinegar 16,714 14,460 17,461 7,231
23Residues and waste from the food industries; prepared animal fodder
119,283 134,867 130,804 62,731
24Tobacco and manufactured tobacco substitutes 36,877 32,115 46,747 19,790

GAIN Report - LH6001 Page 32 of 35
UNCLASSIFIED USDA Foreign Agricultural Service
Trade between Lithuania and USA; 2002 – 2004 and January – April 2005, Thousand $ Exports
2002 2003 20042005 01-04
Total 137,391.27
111,583.59
44,517.43
3,905.70
Section I 01-05 124,530.81
99,539.37 34,813.45
888.17
Live animals; animal products
1Live animals 273.20 188.52 336.94 59.30
2Meat and edible meat offal 117.08 23.45 52.46 65.32
3Fish and crustaceans, molluscs and other aquatic invertebrates
954.54 598.84 518.80 185.14
4Dairy produce; birds' eggs; natural honey; edible products of animal origin, not elsewhere specified or included
123,185.77 98,728.56 33,905.21 578.38
5Products of animal origin, not elsewhere specified or included
0.18- - -
Section II 06-14 3,048.84 2,609.44 1,094.08 107.46
Vegetable products
6Live trees and other plants; bulbs, roots and the like; cut flowers and ornamental foliage
26.48 5.81 11.65 0.14
7Edible vegetables and certain roots and tubers 970.70 1,151.62 350.67 4.088Edible fruit and nuts; peel of citrus fruits or melons 386.44 324.89 429.79-
9Coffee, tea, maté and spices 1,440.18 872.64 203.20 69.54
10Cereals 7.57 1.30 1.06-
11Products of the milling industry; malt; starches; inulin; wheat gluten
72.54 169.19 31.65 3.77
12Oil seeds and oleaginous fruits; miscellaneous grains, seeds and fruit; industrial or medicinal plants; straw and fodder
135.99 79.19 66.06 29.93
13Lac; gums, resins and other vegetable saps and extracts
- 4.75- -
14Vegetable plaiting materials; vegetable products not elsewhere specified or included
8.94- - -
Section III 15 43.17 19.23 12.82-
15Animal or vegetable fats and oils and their cleavage products; prepared edible fats; animal or vegetable waxes
43.17 19.23 12.82-
Section IV 16-24 9,768.49 9,415.56 8,597.08 2,910.07
Prepared foodstuffs; beverages, spirits and vinegar; tobacco and manufactured tobacco substitutes
16Preparations of meat, of fish or of crustaceans, molluscs or other aquatic invertebrates
3,183.59 1,997.32 1,665.25 392.22

GAIN Report - LH6001 Page 33 of 35
UNCLASSIFIED USDA Foreign Agricultural Service
17Sugars and sugar confectionery 223.52 184.65 339.65 18.73
18Cocoa and cocoa preparations 497.43 507.92 693.13 241.51
19Preparations of cereals, flour, starch or milk; pastrycooks' products
2,426.51 2,966.97 1,895.88 678.94
20Preparations of vegetables, fruit, nuts or other parts of plants
638.77 1,519.82 925.00 102.46
21Miscellaneous edible preparations 1,424.79 1,265.21 1,225.63 1,174.12
22Beverages, spirits and vinegar 1,055.39 862.50 1,707.64 289.44
23Residues and waste from the food industries; prepared animal fodder
318.45 111.16 144.86 12.68
24Tobacco and manufactured tobacco substitutes - - - - Source: Lithuania Statistics Department

GAIN Report - LH6001 Page 34 of 35
UNCLASSIFIED USDA Foreign Agricultural Service
Foreign Trade in Agricultural and Food Products in 2004 Source: Lithuanian Statistics Department, million $ CN Code
Commodity Export Import Turnover Balance
1 Live animals 16.9 6.5 23.5 10.3 2 Meat and edible meat offal 33.3 74.0 107.4 -40.7 3 Fish and crustaceans,
mollusks and other aquatic invertebrates 59.4 92.2 151.6 -32.9
4 Dairy produce; birds' eggs; natural honey; edible products of animal origin, not elsewhere specified or included 275.2 18.9 294.0 256.3
5 Products of animal origin, not elsewhere specified or included 3.5 21.6 25.1 -18.1
6 Live trees and other plants; bulbs, roots and the like; cut flowers and ornamental foliage 2.0 12.8 14.8 -10.8
7 Edible vegetables and certain roots and tubers 44.5 51.7 96.2 -7.2
8 Edible fruit and nuts; peel of citrus fruit or melons 32.8 108.9 141.8 -76.1
9 Coffee, tea, mate and spices 8.0 43.1 51.1 -35.1 10 Cereals 88.2 23.9 112.0 64.3 11 Products of the milling
industry; malt; starches; inulin; wheat gluten 12.2 19.2 31.4 -7.0
12 Oil seeds and oleaginous fruits; miscellaneous grains, seeds and fruit; industrial or medicinal plants; straw and fodder 36.1 26.2 62.3 9.9
13 Lac; gums, resins and other vegetable saps and extracts 0.3 3.2 3.5 -2.9
14 Vegetable plaiting materials; vegetable products not elsewhere specified or included 0.1 0.2 0.3 -0.1
15 Animal or vegetable fats and oils and their cleavage products; prepared edible fats; animal or vegetable waxes 21.0 75.8 96.8 -54.8
16 Preparations of meat, of fish or of crustaceans, mollusks or other aquatic invertebrates 62.6 21.3 84.0 41.3
17 Sugars and sugar confectionery 39.6 57.9 97.6 -18.3
18 Cocoa and cocoa preparations 32.0 29.0 61.1 3.0
GAIN Report - LH6001 Page 35 of 35
UNCLASSIFIED USDA Foreign Agricultural Service
19 Preparations of cereals, flour, starch or milk; pastry cooks' products 17.9 35.4 53.2 -17.5
20 Preparations of vegetables, fruit, nuts or other parts of plants 17.6 43.1 60.7 -25.5
21 Miscellaneous edible preparations 32.5 87.9 120.4 -55.4
22 Beverages, spirits and vinegar 17.5 79.3 96.8 -61.9
23 Residues and waste from the food industries; prepared animal fodder 130.8 67.6 198.4 63.2
24 Residues and waste from the food industries; prepared animal fodder 46.8 34.8 81.5 12.0
Total 1030.7 1034.7 2065.4 -4.0