Embed Size (px)
Citation preview

www.davidconsultinggroup.com
Use A Balanced Scorecard - The Answer is CLEAR!
Sheila DennisISMA Conference

9/7/2006 ©2005 The David Consulting Group, Inc. 2
Order of Business
• Overview of the Balanced Score Card (BSC)
• Benefits of using the BSC• How Size Fits into the IT BSC• CLEAR Approach to the BSC

9/7/2006 ©2005 The David Consulting Group, Inc. 3
BSC Overview
Balanced Score Card (BSC) is an actionable tool that provides senior management a comprehensive view of how the organization is progressing towards achieving its strategic goals.
• What it is?• How does this work?• Will this work for me?

9/7/2006 ©2005 The David Consulting Group, Inc. 4
BSC Overview
EXECUTIVE MANAGEMENT
Information Technology
Human Resources
Accounting Sales Operations
• Typical Hierarchical Structure• Each department may have own goals and targets• Department goals and targets may or may not be in alignment with company vision, goals and targets• Executive levels may have separate or different requirements (and may or may not support vision)

9/7/2006 ©2005 The David Consulting Group, Inc. 5
BSC Overview – Typical Measures
• Business based metrics – revenue, cost, profit • Customer metrics – satisfaction, quality, defects • Project metrics – size, effort, cost, duration • Demand metrics – backlog, type of work

9/7/2006 ©2005 The David Consulting Group, Inc. 6
BSC Overview - Perspectives
Financial CustomerA Different Perspective
STRATEGIC PLAN
Goals & Objectives
v i s i o n
Growth and LearningInternal
Processes

9/7/2006 ©2005 The David Consulting Group, Inc. 7
BSC Overview
Vision What objectives does our company have?
What financial goals do we have to achieve to meet our objectives?Financial
What goals do we need to achieve in our customer measures to reach our financial targets?
Customer
What performance goals must our internal processes achieve to gain desired customer satisfaction?
Internal Processes
Growth and Learning
What training must we provide to the organization to achieve the desired level of performance?

9/7/2006 ©2005 The David Consulting Group, Inc. 8
BSC Overview(Strategic Level)EXECUTIVE MANAGEMENT
Information Technology
OperationsAccounting Human Resources
Sales
Direction Collection
•Each site and/or department will feed into the organizational level BSC with a singular focus•Departments have goals and targets that are in alignment and/or support company goals and targets•Executive levels see a uniform, comprehensive and strategic view•BSC will necessarily have corporate sponsorship

9/7/2006 ©2005 The David Consulting Group, Inc. 9
BSC Overview - Example
• Strategic Goal: To be in the top 10% of national companies in software quality
IT BALANCED SCORE CARD
PERSPECTIVES Metric
CUSTOMER Customer Quality Survey - Product Score
FINANCIAL Cost of Defect Removal in Production
INTERNAL PROCESSDefects per function point delivered within warranty period
GROWTH & LEARNINGNumber of project teams and/or individuals trained in quality reviews and code inspections

9/7/2006 ©2005 The David Consulting Group, Inc. 10
BSC Overview
• Generally 3-5 metrics per perspective• Usually designed to roll-up or flow-down within a perspective• Provides a balance of measures
• Long and short term metrics• Balances financial and non-financial metrics• Balances strategic and operational metrics • Future (Leading) and Past (Lagging) Metrics
Financial Customer
Internal Process
Growth and Learning
•Set of metrics supporting a strategic goal•Each metric has a minimum specific set of attributes
–defined measures–target–schedule
Perspective

9/7/2006 ©2005 The David Consulting Group, Inc. 11
BSC Overview - Example• Strategic Goal: To be in the top 10% of national companies in software quality*
IT BALANCED SCORE CARD
PERSPECTIVE Metric Target First Quarter
CUSTOMERCustomer Quality Survey -
Product Score 95% or better CQS Score/100
FINANCIALCost of Defect Removal in
Production
$160/defect 1st qtr; $145/defect 2nd qtr; $125/3rd qtr;
$120/defect EOY
(Removal Effort/Defects) x
Hrly Rate
INTERNAL PROCESS
Defects per function point delivered within warranty
period 2.4 defects/1000 fp delivered
Warranty Defects/(Fps
Delivered/1000)
GROWTH & LEARNING
Number of project teams (individuals) trained in
quality reviews and code inspections
100% of teams trained in one year with at least 25% each
quarter
Trainees/Yearly Projected Trainees
*2.4 defects delivered/1000 fp; Production defect removal cost = $120/defect (Assumption)

9/7/2006 ©2005 The David Consulting Group, Inc. 12
Order of Business
• Overview of the Balanced Score Card (BSC)
• Benefits of using the BSC• How Size Fits into the IT BSC• CLEAR Approach to the BSC

9/7/2006 ©2005 The David Consulting Group, Inc. 13
BSC Benefits
Benefits of the BSC Methodology
• Aligned with business needs and the needs of the development organization
• Goal oriented/Results are strategically useful at executive level• Multiple levels of relational reporting – Useful at all levels• Different perspectives of the strategic goals can produce a greater
understanding of particular issue (cause and effect relationships)• Use industry standard metrics to facilitate comparisons with other
organizations (real-time benchmarking approach)• Flexible enough to allow metrics to change and evolve as the
organization matures• Adaptable to changes in strategic direction

9/7/2006 ©2005 The David Consulting Group, Inc. 14
BSC Benefits
Benefits of the BSC Methodology (cont.)
• Can produce cost saving benefits by providing organization focus• Focus purposely limits number of metrics to implement • Streamline data collection• Eliminate non-supporting or non-operational metrics• Eliminate redundant and/or useless reporting
• Leverage your present measurement knowledge – Not new metrics just a new way to view and report metrics (a tool)• Common measurement formulas• Goal – Question – Metric (GQM) method• Practical Software Measurement (PSM)• Benchmarking initiatives

9/7/2006 ©2005 The David Consulting Group, Inc. 15
BSC Benefits – Reuse Knowledge
Example of using the Goal-Question-Metric paradigmGoal• Improve application development productivity by 15%Question • Do we have a methodology for tracking productivity (IP)?• What is the effect on value to the customer versus profitability (C)?• Do we have accurate time tracking capabilities (IP)?• Do we want to collect size/or effort data on new and/or enhancement
projects (IP)?• Is cost data readily available and/or calculable (F)?• Is training data available and reliable (GL)?Metric
Metrics are derived using the answers to cause & effect questions.

9/7/2006 ©2005 The David Consulting Group, Inc. 16
Order of Business
• Overview of the Balanced Score Card (BSC)
• Benefits of using the BSC• How Size Fits into the IT BSC• CLEAR Approach to the BSC

9/7/2006 ©2005 The David Consulting Group, Inc. 17
Sizing in the IT BSC
• Organizations focused on managing costs and improving IT performance must rely on measured outcomes
• Typical measures in the BSC include cost, time to market and quality
• Accurate evaluation of these measures must include size as the common denominator
• Without size, a relative value can not be established • Size is the natural output of an input process where effort
is the input

9/7/2006 ©2005 The David Consulting Group, Inc. 18
Sizing in the IT BSC
Benefits of Sizing• Quantitative (Objective) Measure• Basis for Comparison - Industry• Manage Expectations (Perceived Customer Value)• Satisfies Software Process Improvement Requirements
(relating to Internal Process perspective)• Satisfies Practical Software and Systems Measurement
(PSM) objectives or ISO standards

9/7/2006 ©2005 The David Consulting Group, Inc. 19
Sizing in the IT BSC
Characteristics of an effective IT BSC size component• Meaningful to developer, user (customer), and other key
members of the organization• Defined (industry recognized)• Consistent (methodology)• Easy to learn and apply• Accurate, statistically based• Available when needed (early in the life cycle)• Flexible – will normalize across the organization's
platforms and development environments
We recommend the use of function points for the IT BSC.

9/7/2006 ©2005 The David Consulting Group, Inc. 20
Common Metrics Formulas
• Productivity Rate = Effort in Hours / Size in Function Points• Rework Percentage = Rework Hours / Total Project Hours• Defect Removal Efficiency = Total Number of Defects Found Prior to Delivery / Total Number
of Defects Discovered (before and after delivery)• Production Defect Rate = Total Production Defects / Function Points Installed• Warranty Defect Rate = Defects during Warranty Period/Function Points Delivered• Scope Creep = Add + Del + Chg Function Points / Original Function Point Count• Cost Efficiency = Actual Cost / Function Points Installed• Project Duration = Project End Date – Project Start Date• Estimated Project Duration = Estimated Project End Date – Estimated Project Start Date• Development cost = Effort*Hourly Rate (or Effort Costs)/Function Points Delivered• Cost Variance = Actual Cost - Estimated Cost / Estimated Cost• Effort Variance = Actual Effort - Estimated Effort / Estimated Effort (in hours)• Duration Variance = Actual Duration – Est. Duration / Est. Duration (in months)• Production Support Rate = Full time equivalent (FTEs)/Application Function Points
Supported

9/7/2006 ©2005 The David Consulting Group, Inc. 21
Common Metrics FormulasDevelopment Scorecard• Productivity Rate = Effort in Hours / Size in Function Points• Scope Creep = Added + Deleted + Changed Function Points / Original
Function Point Count• Warranty Defect Rate = Defects during Warranty Period/Function Points
Delivered• Delivery costs = Project Costs (Effort)/Function Points DeliveredApplication Support Scorecard• Production Support Rate = Full time equivalent (FTEs)/Function Points
(Installed) Supported• Production Defect Rate = Total Production Defects / Function Points
Installed• Cost Efficiency = Actual Cost / Function Points Installed• Application Portfolio Ratio = Total Application Counts (Installed)
Before/Total Application Counts (Installed) After

9/7/2006 ©2005 The David Consulting Group, Inc. 22
Order of Business
• Overview of the Balanced Score Card (BSC)
• Benefits of using the BSC• How Size Fits into the IT BSC• CLEAR Approach to the BSC

9/7/2006 ©2005 The David Consulting Group, Inc. 23
CLEAR Approach
• Phase 1 – Developing the BSC• Objectives• Measures• Metrics
• Phase 2 – Transitioning the BSC• Targets• Reporting• Maintenance

9/7/2006 ©2005 The David Consulting Group, Inc. 24
Developing the BSC – Phase 1
• Create and/or review organizational strategic plans and vision.
• Link organizational strategy & goals to departmental and individual goals.
• Exercise cause & effect relationships.• Articulate objectives for time, quality, performance and
service.• Rank and review measures.
9/7/2006 ©2005 The David Consulting Group, Inc. 25
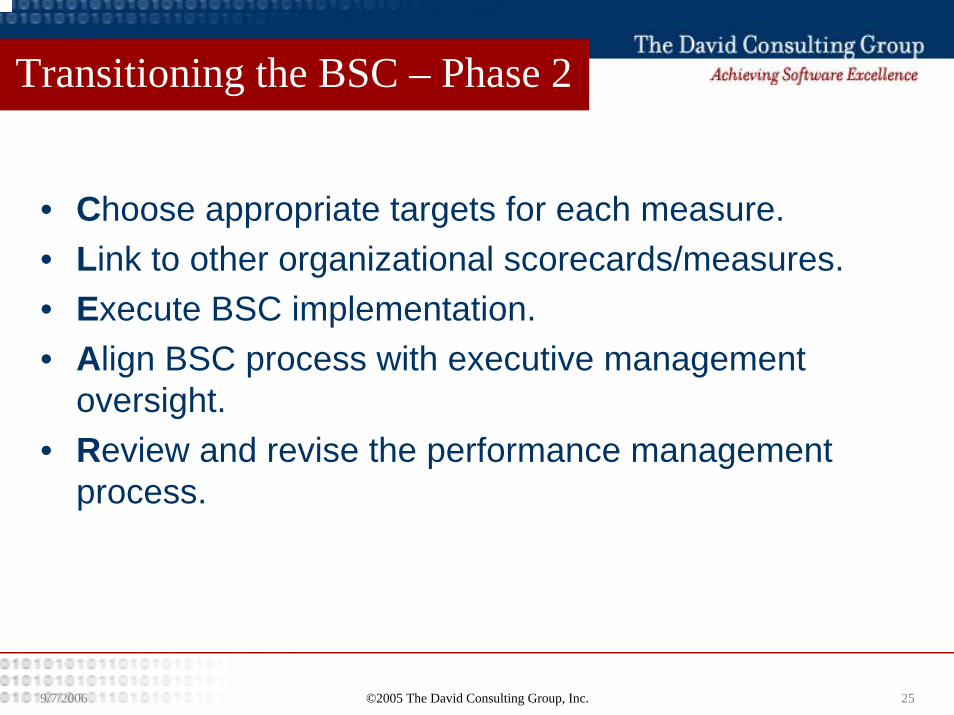
Transitioning the BSC – Phase 2
• Choose appropriate targets for each measure.• Link to other organizational scorecards/measures.• Execute BSC implementation. • Align BSC process with executive management
oversight.• Review and revise the performance management
process.
9/7/2006 ©2005 The David Consulting Group, Inc. 26
References
For more information:
• The David Consulting Group• www.davidconsultinggroup.com
• International Software Benchmarking Standards Group• www.isbsg.org.au
• International Function Point Users Group• www.ifpug.org