Embed Size (px)
Citation preview
7 th World Congress on the Management of eBusiness, July 2006
Use and Business Impacts of Internet Technologies and e Business Solutions among Small and Mediumsized
Enterprises (SMEs) in Atlantic Canada
Charles H. Davis Ryerson University [email protected]
YiJing (Carinna) Lin Ryerson University
Florin Vladica Ryerson University
Abstract This paper describes patterns of use of Internet technologies and e business solutions among over 700 SMEs in Atlantic Canada in 2005. It also describes patterns of facilitators and outcomes of ebusiness use. Atlantic SMEs have found the most value in ebusiness in customerfacing performance improvements in the regional market, and the least value in ebusiness as a facilator of external market expansion. The smallest firms are the most dependent on Internet sales. Between one quarter and one third of SMEs express interest in externally provided support services, especially illustrative examples, recommendations, and personalized advice.
Keywords: SMEs; Atlantic Canada; Internet technologies; ebusiness solutions; use and busi ness impacts
1. Introduction Atlantic Canada, one of the poorest regions of the country, faces major growth and development challenges in the knowledgebased economy. The region lacks large urban centers and financial centers; its economy is largely specialized in resource industries with low valueadded; its trans portation system is inadequate; and the region is located far from major markets (Ruggieri, 2003; Desjardins, 2005). Although Atlantic Canada has a variety of institutions of higher education, they are small and dispersed. On most indicators of science, technology, and innovation Atlantic Canada is well behind the rest of the country (Bourgeois & LeBlanc, 2003; Locke et al., 2004). The region suffers from relatively slow growth, relatively low levels of income, and demographic stagnation due to outmigration and inability to attract immigrants. Among its strengths are its educated labour pool, energy resources, a growing capability in health sciences, marine, and bioresource innovation, and an emerging generation of exportoriented entrepreneurs (Mac Millan, 2001).
Of the approximately 88,000 businesses in Atlantic Canada, 95% employ fewer than 500 people and are therefore considered small or mediumsized enterprises (SMEs). The Atlantic Canadian regional market of around 2 million people imposes limits to the growth of firms. Growthori ented Atlantic SMEs need to seize opportunities to reach new markets. Harnessing ecommerce in order to catch up and overcome the disadvantages of their peripheral location may be more

7 th World Congress on the Management of eBusiness, July 2006
2
important to SMEs in Atlantic Canada than in other parts of the country. However, lack of awareness, lack of qualified staff, and cost of implementing ecommerce solutions are known to have been obstacles that prevent many Atlantic Canadian SMEs from establishing an ecommerce presence (InnovaQuest, 2000). 1
This paper describes the use and impacts of Internet technologies and ebusiness solutions among more than 700 small and mediumsized enterprises (SMEs) in the four provinces of Atlantic Canada, based on an online survey carried out in June and July 2005. We describe the socio demographic characteristics of the respondents, perceived facilitators of adoption and barriers to adoption, and the perceived outcomes of adoption of Internet technologies and ebusiness solutions among Atlantic SMEs. 2 Our deliberately broad definition of ebusiness encompasses all Internetbased businesstobusiness and businesstoconsumer transactions, as well as non transactional electronic interactions throughout the customer transaction cycle. In this definition, a firm can be engaged in ebusiness without necessarily conducting online transactions, as long as some of the steps in the transaction cycle such as marketing or postsale service delivery take place online. We also consider the internal use of information and communication technologies to be a feature of ebusiness. However, here we focus on the business use of relatively advanced, complex, or emerging applications for purposes of internal process integration, coordination, or decision support.
Our regional survey extends a benchmarking study supported as part of the eBusiness Awareness Program currently being funded by the Atlantic Canada Opportunities Agency (ACOA) and executed by the Electronic Commerce Centre of the University of New Brunswick – Saint John. In 2004, under the auspices of this program, we surveyed SMEs in New Brunswick regarding their use of Internet technologies and ebusiness solutions (see Davis and Vladica, 2004). The present survey of Atlantic Canadian SMEs uses a modified version of the 2004 New Brunswick survey instrument.
Conventions have not yet been established for the measurement of eBusiness use and impacts (cf. Ven der Veen, 2004). Our survey included questions about the responding firm and its mar ket bahavior, its use of Internet technologies and ebusiness solutions, enablers of Internet busi ness, outcomes or effects of technology use, and training and support needs.
2. Characteristics of respondents Invitations were emailed to 8,520 Atlantic SMEs that were identified from a variety of mailing lists and business directories. The survey questionnaire was available online, on a secure pass word controlled website, linked from the email sent to participants. The response rate was about 9.11% (776 usable responses). Respondents could complete the questionnaire in English or in French. The questionnaire was completed in French by 6.57% of the respondents and in English by 93.42%. Although we made every attempt to ensure geographical representativeness in our mailing list, firms from Prince Edward Island are overrepresented in proportion to the population of the province, firms from New Brunswick and Nova Scotia are more or less proportionately represented, and firms from Newfoundland and Labrador are underrepresented among
1 In this report we use the terms electronic commerce, ecommerce, or ebusiness as shorthand for Internet technologies and ebusiness solutions. 2 For complete results of the survey see our longer technical report (Davis, Lin & Vladica, 2006).

7 th World Congress on the Management of eBusiness, July 2006
3
respondents (Table A). It is not possible to determine how closely our sample of firms replicates the sectoral distribution of Atlantic SMEs. Around twothirds of the respondents are in the fol lowing sectors: professional & business services, tourism, IT & telecommunications, and commerce (see Table B).
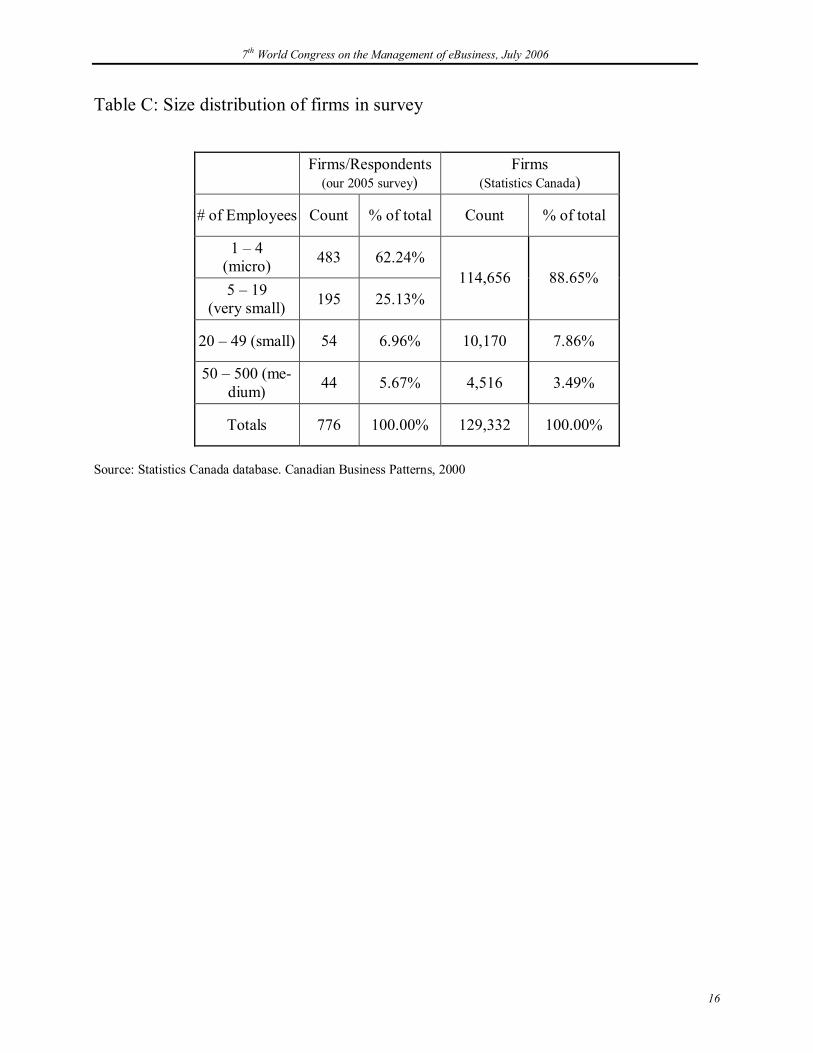
We distinguish five size classes of firms: microenterprises, which have fewer than 5 employees (including owners), very small firms (with 5 to 19 employees), small firms (with 20 to 49 em ployee), medium firms (50 to 499 employees), and large firms (500 or more employees). This classification of firm size follows convention in Canada, except that we have split the category “small firms” into two separate categories: very small firms and small firms.
62% of respondents are microenterprises (<5 employees), 25% are very small firms (519 em ployees), 7% are small firms (2049 employees), and 5.7% are medium firms (50 to 499 employ ees) (Table C). The size distribution of firms in the population of respondents is a fairly close approximation of the size distribution of firms in Canada (Table C), although microenterprises are underrepresented in our population of respondents. 78% of Canada’ SMEs are microenter prises, and only 3.5% of Canadian SMEs employ more than 50 people.
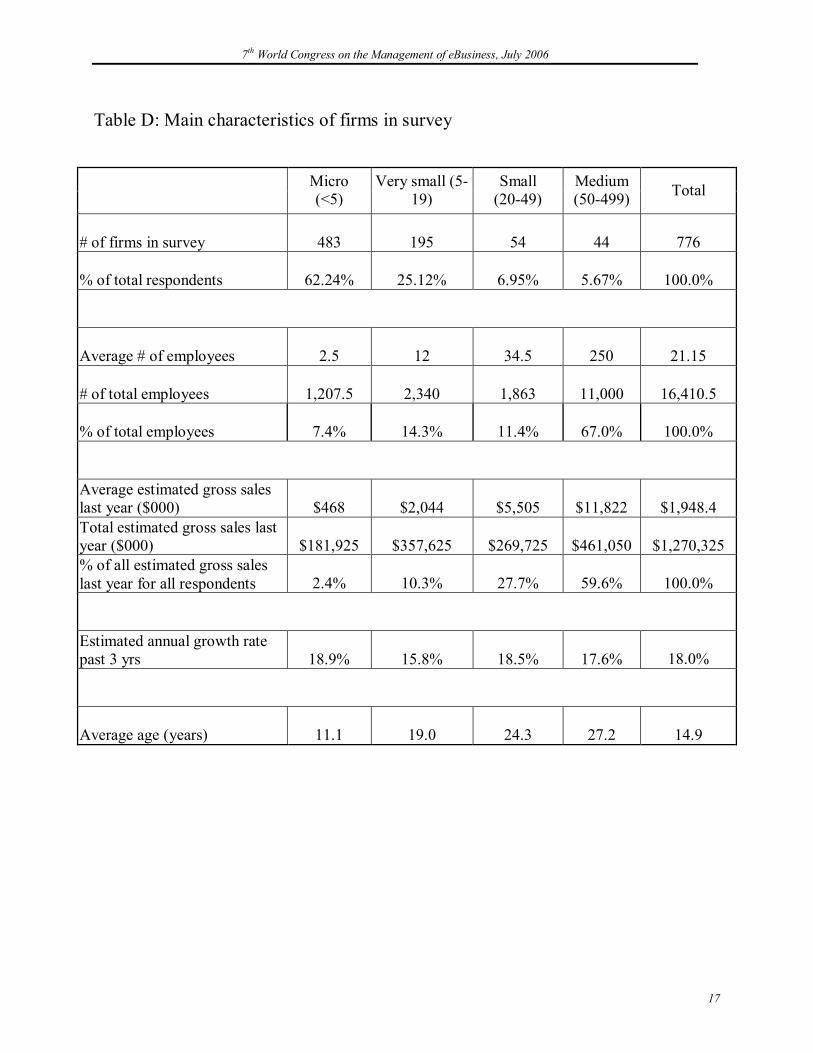
Table D provides information about the characteristics of the respondent firms. The SMEs that participated in this survey have an estimated 16,410 employees and conduct an estimated $1.27 billion in sales. Although microenterprises represent nearly 62% of the firms in the survey, they have only 7.4% of all employees and account for only 2.4% of all revenue. Firms from all size categories report 16% to 19% average annual sales growth over the past three years. These re ported rates of growth are undoubtedly higher than those of SMEs in general, especially micro enterprises. The average age of firms in the survey is greater than eleven years, rising to around 27 years in mediumsized firms. Smaller firms tend to be younger.
According to Industry Canada’s definition, rural and small town (RST) areas are those commu nities with fewer than 20,000 residents. Using this definition of rural and small town, 49% of participating businesses in our survey are in urban locations, while 51% are in rural and small town areas. Compared to the percentage (36%) of all firms in rural and small town areas in Can ada provided by Industry Canada, our survey included more respondents located in rural and small town areas (Table E).
3. Business climate and business behavior of Atlantic SMEs Atlantic SMEs earn nearly 60% of their revenue in their province, and almost 75% in Canada (see Table F). About 73% of the SMEs in our survey have no international sales. The United States is the most important international market, providing almost 11% of revenue. The U.S. market is a particularly important source of growth for small and medium firms (i.e. firms with 20 to 499 employees). Larger firms tend to earn a greater proportion of their revenue from international markets. Firms in the commerce, design and publishing, and construction sectors are the least exportoriented of the sectors in Atlantic Canada.
Competition is generally less intense in local (provincial or regional) markets than in national or international markets. Small firms (2049 employees) are exposed to the most intense competi tion. Medium size firms are in comparatively stable competitive situations, especially in inter national markets, and report lower levels of competition than firms of other sizes (Figure A).

7 th World Congress on the Management of eBusiness, July 2006
4
Younger companies experience intense competition in national and international markets; how ever, older companies experience higher competition in local markets (Figure B). Firms in Arts and Handicraft report the least intense competition, while firms in Commerce, Finance, IT & Telecommunications, and Manufacturing report the least intense local competition. Firms in design & publishing and IT & telecommunications report the most intense international compe tition (data not shown).
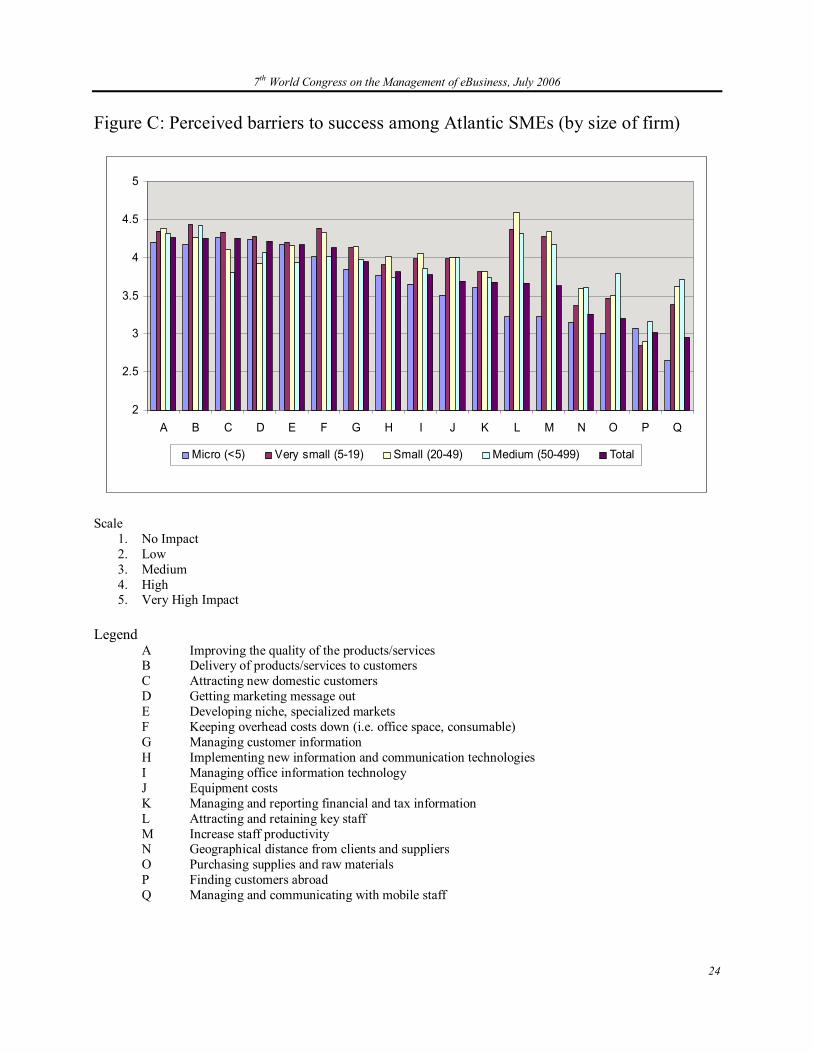
SMEs invest in technology, including Internet technologies and ebusiness solutions, in order to solve a problem or to pursue a business opportunity. We asked respondents to evaluate potential barriers to growth and to identify capabilities that they would like to develop. Ebusiness solu tions that help to solve these problems or develop these capabilities are of interest to SMEs in the region (Davis and Vladica, 2005). In general, Atlantic SMEs believe that they would improve their business performance if they could:
• Improve the quality of their products or services; • Deliver these products and services more effectively and efficiently to customers; • Attract new domestic customers; • Formulate and communicate their marketing messages more effectively; and • Develop specialized niches in the domestic market (see Figure C).
As we can see from Figure C, when firms have more than 5 employees, they consider staff re cruitment, retention, managing and communicating with staff, and productivity to be more sig nificant than other barriers to growth. Once firms grow to more than 50 employees, they face a different set of growth challenges that reflect the transition to a larger organization with more formal management and business routines. Older companies consider equipment costs, attracting and retaining key staff, increasing staff productivity, and managing and reporting financial and tax information as the most important barriers to growth. They report an increased interest in HR management and controlling business costs. However, younger firms are more concerned about business development; they consider that getting marketing messages out and finding customers abroad are the biggest barriers to success.
Firms acquire capabilities in order to compete more effectively. They often adopt ebusiness solutions and internet technologies in order to support the development of new capabilities (Davis & Vladica, 2004). Figure D provides a rankordered list of capabilities that Atlantic SMEs would like to acquire. Marketing, interactivity with customers, and strategic planning are the most highly desired capabilities. The profile of small firms (2049 employees) differs from the others. They share the interests of other SMEs but also express particular interest in capabilities related to technology, purchasing, supply management, and change management. Medium size firms are also interested in purchasing, supply management, and change management but place less emphasis on new product development and interactivity with customers.
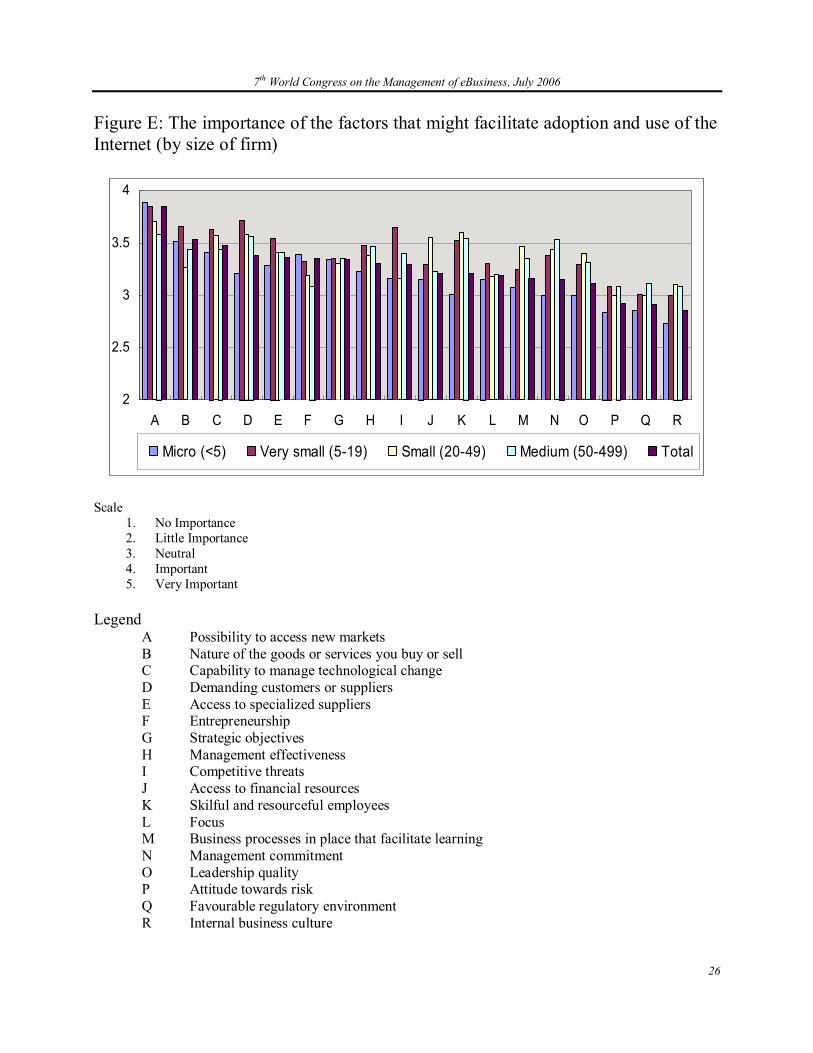
Figure E shows that the most important factors that might facilitate adoption and use of IT and e business are firms’ views about accessing new markets, the nature of the goods or services they buy or sell, their capability to manage technological change, demands that customers or suppliers make on them, and access to specialized suppliers. The emphasis seems to be on new market acquisition, management capability, and relationships with customers or suppliers.

7 th World Congress on the Management of eBusiness, July 2006
5
Although the benefits of ecommerce are often believed to be available to adopting firms re gardless of firm size, size is an important factor in ebusiness adoption and use. SMEs adopt e business technologies and Internet solutions less quickly than larger firms, and larger SMEs adopt these technologies more quickly than smaller SMEs. On the other hand, some smaller SMEs may have an advantage in identifying and adopting business models that are tailored to exploit the possibilities offered by online commerce (Davis and Vladica, 2006).
SMEs of different sizes face a somewhat different set of adoption facilitators. Larger firms be lieve skillful and resourceful employees, established business processes to facilitate learning, management commitment, leadership, and internal business culture are important factors that facilitate adoption of ebusiness. Combinations of market access, demanding customers and suppliers, capability to manage technological change, and access to specialized suppliers appear to induce very small and small SMEs to adopt Internet and ebusiness solutions and technologies.
To summarize this section, Atlantic SMEs are generally embedded in local markets where com petition is less intense than in national or international markets. Although patterns of “pain points” (barriers to growth), desired capabilities, and facilitators of technology adoption vary by firm size and industry sector, in general Atlantic SMEs are concerned about the quality of their products, services, and delivery processes in the domestic market. They consider that improved capabilities in marketing, planning and interactivity would improve their performance.
It is widely believed that competition, attitude toward risk, and business culture are factors that largely influence Atlantic SMEs’ behavior with respect to ebusiness. Our research shows that demanding customers, management capabilities, and suitability of products or services for e business are much more important facilitators of adoption.
4. Patterns of use of Internet technologies and ebusiness solutions among Atlantic SMEs The simplest IT and ebusiness solutions (such as email, PCs, and use of the Internet for infor mation searches) are in widespread use among respondents (more than 90%) (see Figure F). 3 Standalone solutions (such as websites) are widely used; however, integrated solutions (such as conducting secure business transactions with other businesses, government, or consumers; intra net; remote data storage) are much less common fewer than half of the firms use the integrated technologies or solutions. More than threefourths of all firms use network/information security technology and functional (application) software.
Larger SMEs adopt more complex IT and ecommerce solutions faster than their smaller coun terparts. For example, larger firms use shared file folders much more than smaller sized firms. Figure G shows patterns of use by size of firm. The data suggest that when firms reach the range of 20 employees, they become concerned about using IT for efficient communication among employees or with customers. Therefore, larger firms are either currently using or planning to use meetings over the Internet, remote data storage, extranets, and remote help desk assistance for their customers.
3 Because our survey was conducted online, firms without basic online capabilities are excluded from our sample. However, in 2005 very few firms lacked basic online capabilities such as email.

7 th World Congress on the Management of eBusiness, July 2006
6
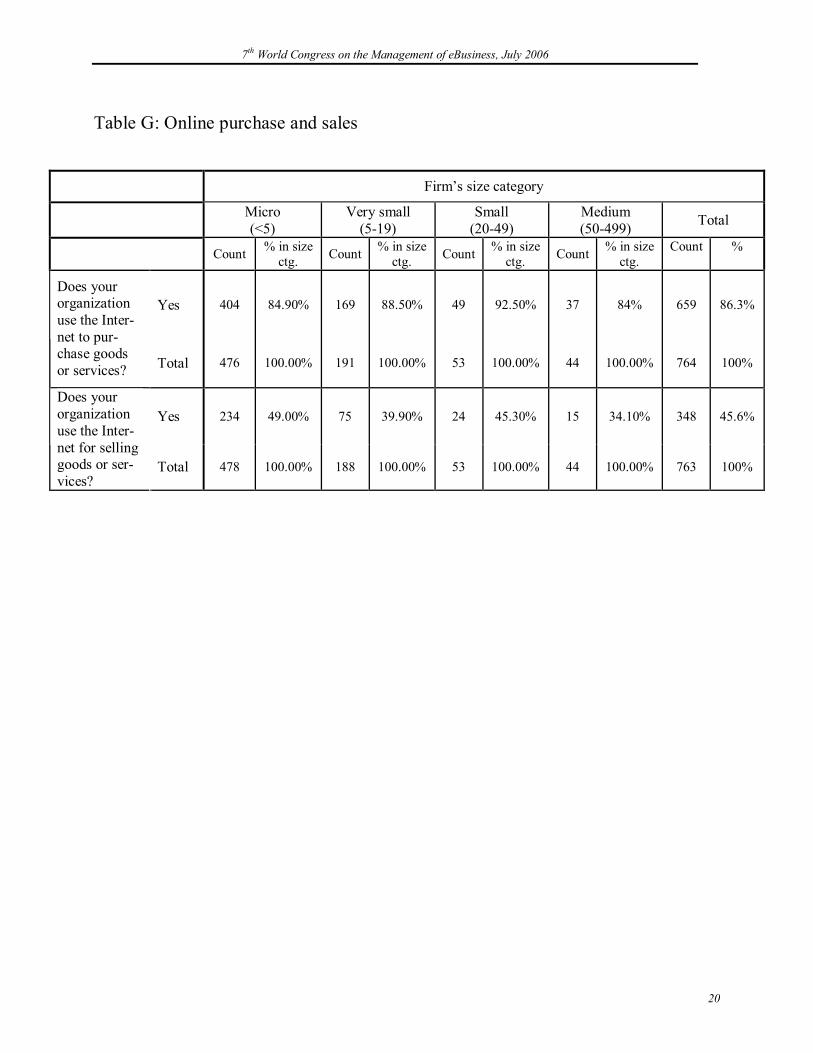
Almost 71% of Atlantic SMEs have their own web site, and 45.6% sell their products online (See Table G and Figure H). Use of the Internet for purchasing is widespread among Atlantic SMEs. 86% of these firms report using the internet for purchasing.
Sector affiliation is an important factor in owning a website. Over 80% of Atlantic SMEs in the tourism, IT and design & publishing industries have websites, whereas only 40% of SMEs in the food production & distribution categories have websites (see Figure H).
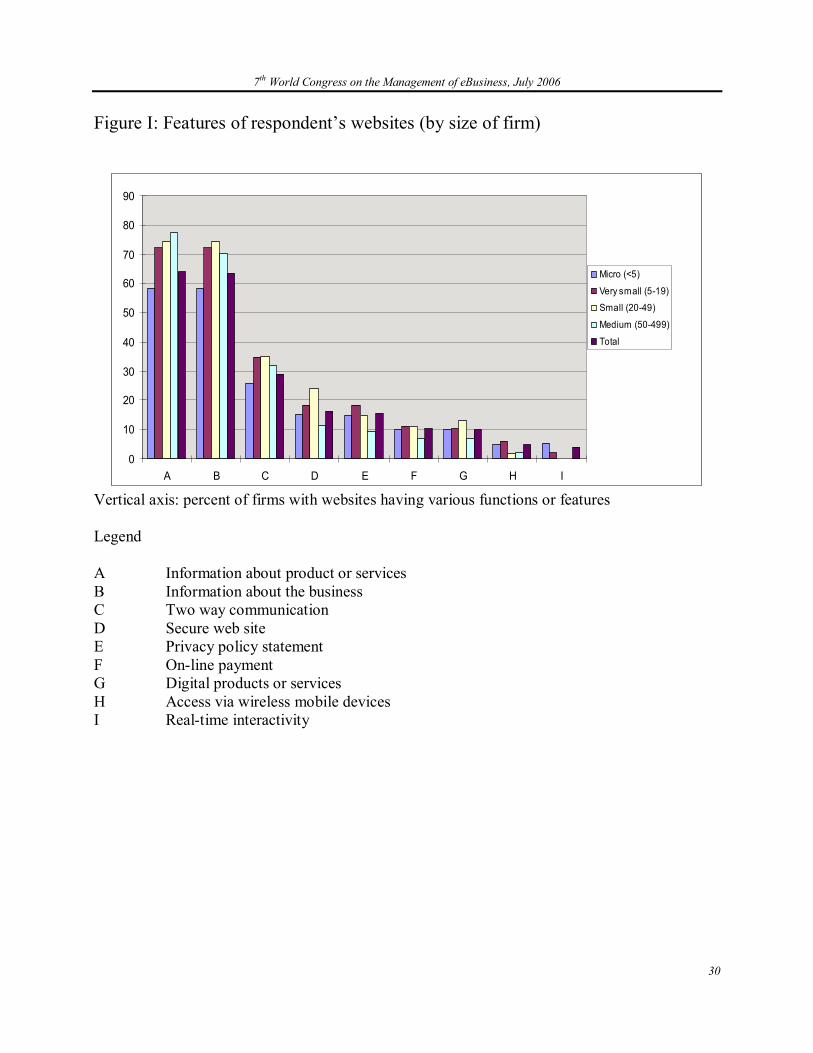
Most Atlantic SME’s websites offer information about products and services and information about the business. Fewer than onethird of Atlantic SMEs’ websites offer asynchronous two way communication, or transaction security. Fewer than one in five offers a privacy policy statement, online payment facilities, or other features (see Figure I). Facilities for online pay ment, digital products or services, wireless access through their websites, and synchronous two way communication are minor functions; fewer than 11% of SMEs offer such services. Although websites of microenterprises provide less information, security, and two way communications than the sites of larger firms, they provide more functions, such as access via wireless mobile de vices, interactivity, online payment, digital products or services, and privacy policy statements (although fewer than 20% actually do so).
Table H presents a high level summary of the degree of use of IT and ebusiness solutions by Atlantic SMEs. We used four indexes to measure overall use of Internet technologies and e business solutions:
1. The Connectivity Index (C); 2. The eBusiness Use Index (EBU); 3. The Website Functionality Index (WFI); 4. The Transaction Index (T).
The Connectivity Index measures the speed of the firm’s connection to the Internet. If a firm connects with dialup, it scores one point; if it connects with cable modem, ISDN, or wireless, 2 points; if it connects with a T1 line, 3 points. Because firms can connect to the Internet using multiple methods, the highest possible score on the Connectivity Index is 10. 4
In the survey, the highest Connectivity Index score received was 10, the average score was 2.73, and the median and mode were 2 (more than a half of the respondents scored 2 points). Micro firms have the highest Connectivity Index scores (Table I). We know that dialup connections are still in use among Atlantic SMEs (about 30% of respondents). The persistence of dialup connections shows that slow speed access to the Internet is still a fact of life for many firms. However, 60% of all firms have adopted high speed connections. Furthermore, faster and more flexible methods of connecting to the Internet, such as wireless connections, are increasingly utilized by SMEs. About 60% of respondents indicate they are using wireless.
4 That is, 1 + 2 + 2 + 2 +3 = 10. Please note that the Connectivity Index is calculated differently in the 2004 survey. However the other Indexes are comparable.

7 th World Congress on the Management of eBusiness, July 2006
7
The eBusiness Use Index measures use of 18 Internet and ebusiness technologies and solutions as well as ownership of a website (see Figure F for the list of technologies). If the firm possesses a website it scores three points; if not, it scores zero. If the firm uses a particular technology or solution it scores 2 points; if it plans to use a technology or solution it scores 1 point; otherwise it scores zero. The maximum possible score for the eBusiness Use Index is 39 points. In our sur vey, the maximum score received was 34 points. The average score on this Index is 17.3 points, the median is 17 and mode is 18 points. Micro (<5) SMEs have the lowest average eBusiness Use Index score (16.4) and medium SMEs have the highest average score (21.5). In general, the smaller the firm, the lower the average eBusiness Use score (Table H).
The Index of Website Functionality measures the extent of available functional features on a firm’s website. Only firms with websites can score on this index. For each of nine features util ized, a firm scores one point (see the list of features in Figure I). The maximum possible score is therefore nine points. Only two firms in our survey scored nine on the Index of Website Func tionality. The average score is 2.18, the median is 2, and mode is 0 points (248 responses scored zero). Small SMEs have the highest average Website Functionality Index score: 2.48 (Table H). The Transaction Index measures the firm’s use of the Internet for buying and selling. If the firm uses the Internet for purchasing products or services it receives a score of three, if not, zero. If the firm uses the Internet for selling it receives a score of three, otherwise zero. The maximum Transaction Index score is therefore six. In our service the Transaction Index scores ranged from six to zero and the average was 3.9. Most SMEs use the Internet for purchasing: the average rate of use is 86.3% (see Table H). However, fewer than half of SMEs use the Internet for selling. 49% of microenterprises, 39.9% of very small firms, 45.3% of small firms, and 34.1% of me dium firms sell via the Internet.
A composite Index of eBusiness Enablement combines the four indexes described above. The highest possible score is 64. In our survey, the highest score obtained by a firm is 49. The aver age score is 26.11, the median is 26 and mode is 24 points (51 respondents). Smaller firms tend to have lower eBusiness Enablement scores (Table H).
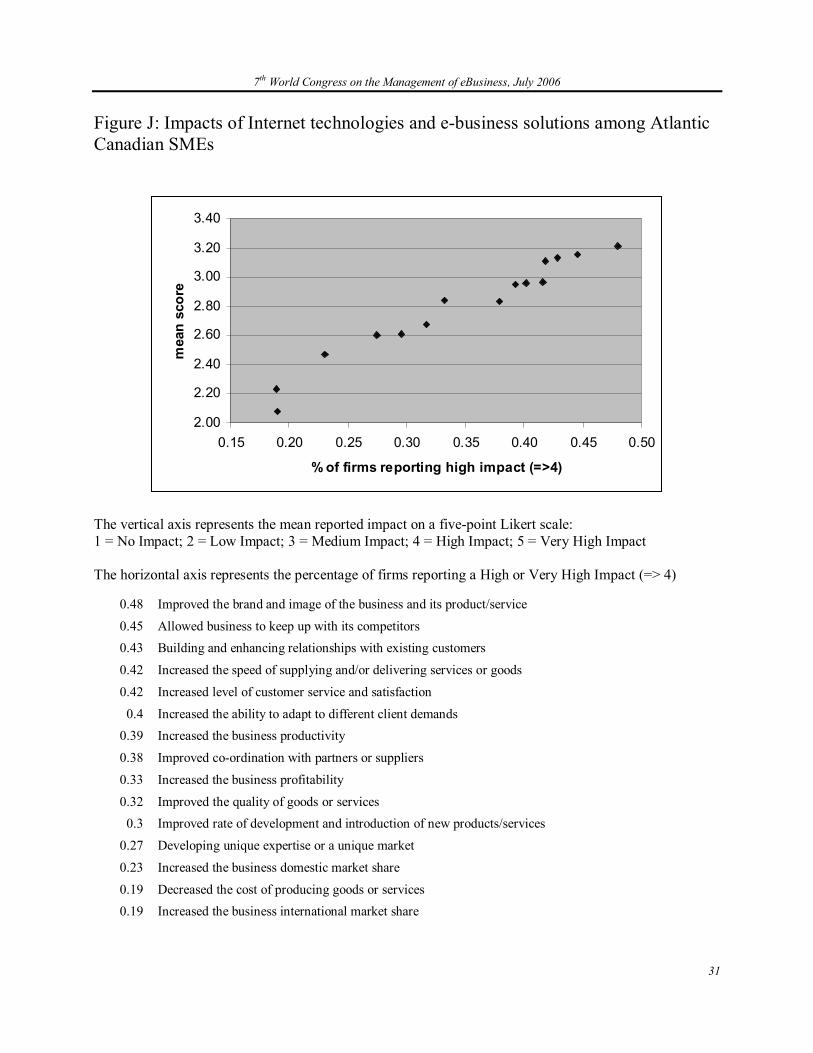
5. Impacts of use of Internet technologies and ebusiness solutions We asked respondents to assess the extent of fifteen possible impacts of using Internet technolo gies and ebusiness solutions. The results are shown in Figure J. On the vertical axis are shown the average scores of fifteen possible impacts. On the horizontal axis are shown the percentage of respondents reporting high or very high impacts (i.e. scores of 4 or higher).
Clearly, Atlantic SMEs have primarily used ebusiness to improve relationships with existing customers. They have used ebusiness for purposes of business development or economic ex pansion much less frequently. Figure J shows that over 40% of respondents reported High or Very High impacts of the following kinds:
• Improvement of the brand or image of the business and its products or service; • Permit the business to keep up with competitors; • Building and enhancing relationships with existing customers; • Increasing the level of customer service and satisfaction; • Increasing the speed of supplying products or services; and

7 th World Congress on the Management of eBusiness, July 2006
8
• Increasing the ability to adapt to different customer demands.
On the other hand, fewer than onethird of respondents reported High or Very High impacts of the following kinds:
• Increasing the domestic market share; • Increasing the international market share; • Decreasing the cost of producing goods or services; • Developing distinctiveness, improvement of rate of product or service innovation; • Improvement of the quality of products or services; or • Improvement of business profitability.
Around thirty percent of Atlantic SMEs’ gross sales are generated over the Internet. However, most of these are domestic sales (see Figure K). The Internet has not led to significant interna tionalization of Atlantic SMEs. Although microenterprises have the highest percentage of sales conducted over the Internet (about 34%), medium sized firms have the highest percentage of international Internet sales (about 29%).
Atlantic SMEs are planning to increase their involvement in ebusiness. Twothirds of respon dents report having plans for further investments in IT and ebusiness solutions. The coming wave of investment will focus on website content development and design, conducting secure transactions with business or government customers, and on marketing on the Internet (Figure L).
6. External services and support needs Most Atlantic SMEs have purchased externally supplied business services within the past three years. More than half of the surveyed microenterprises report having purchased such services, while over 75% of small and medium SMEs report having done the same. Technical services are the most frequently purchased business services, followed by marketing services, although de mand for services varies among size classes of firms. Smaller firms tend to purchase technical services, including information and communication technology, more so than their larger coun terparts.
Figure M provides a rankordered list of preferences for support tools or services related to IT or ebusiness solutions which Atlantic SMEs are most likely to use. More than onethird of respon dents would be likely to use examples (cases) of successful ebusiness use, recommendations about ecommerce solutions, personalized advice, sectorspecific online seminars, and directories of organizations that can offer help in using ecommerce.

7 th World Congress on the Management of eBusiness, July 2006
9
7. Issues regarding SMEs’ use of Internet technologies and ebusi ness solutions in Atlantic Canada In this section we ask five questions of the survey data.
7.1 Is ebusiness enablement associated with firm growth? The answer is a qualified Yes. We measured the correlation between reported average annual threeyear growth rates on the one hand, and the Connectivity Index, the eBusiness Use Index, the Transaction Index, and the Website Functionality Index on the other. Connectivity and Website Functionality are not significantly correlated with business growth. But greater degrees of eBusiness Use and electronic Transactions (as measured by their respective indexes) are significantly correlated with higher business growth rates. This means that faster growing firms are using more ebusiness technology, especially for purchasing and selling.
7.2 How does size affect a firm’s ability to adopt and take advantage of Internet technologies and ebusiness solutions?
We saw earlier that on the average, the smaller the firm, the lower the Index of eBusiness Enablement. We measured the correlation between the size of the firm (measured by revenue and by number of employees) and fifteen possible impacts of technology. We found that size is significantly positively correlated only with improvement in coordination with partners or sup pliers. It is significantly negatively correlated with reported increase in business profitability and reported increase in speed of delivering products or services. This may be evidence that some larger firms in Atlantic Canada have had unsatisfactory experiences with ebusiness systems.
Larger firms have more complex technological systems. High scores on the eBusiness Use In dex and on the Transaction Index are significantly correlated with higher technology impacts. High scores on the Website Functionality score are significantly correlated with international market expansion and improvement of brand and image. This suggests that depth of ebusiness capabilities influences business outcomes more than firm size per se.
7.3 Does rural or small town location inhibit ebusiness enablement? We compared Atlantic urban SMEs with Atlantic rural or small town SMEs for the four technol ogy Indexes. 5 Urban SMEs have a significantly lower Connectivity Index and significantly higher eBusiness Use Index. The Website Functionality Index and Transaction Index are not significantly different. As we saw earlier, the eBusiness Use Index and the Transaction Index are more closely linked to revenue growth and positive business outcomes than the other two indexes. We do not know at this point why rural and small town SMEs have significantly lower Index of eBusiness Use. However, urban SMEs report significantly higher impacts of using Internet technologies and ebusiness solutions in the areas of productivity, business speed en hancement, and product innovation. Furthermore, urban SMEs report significantly higher annual rates of growth than rural or small town SMEs. However, industries are distributed differently between urban and rural or small town settings. The differences between urban and small town or rural firms that we noted above may be a reflection of different degrees of sectoral engagement in ebusiness. When we compare sector by sector, we find that in some cases adoption of Internet technologies and ebusiness solutions has provided strong support to firms in rural or small town settings.
5 Urban SMEs are those located in population centres of 20,000 persons or more.
7 th World Congress on the Management of eBusiness, July 2006
10
7.4 Does ebusiness enablement support export development? Yes. The eBusiness Use Index, the Website Functionality Index, and the Transaction Index are significantly correlated with export intensity to the United States. The Connectivity Index is not correlated with export intensity. The Website Functionality Index and the Transaction Index are significantly correlated with exports to international destinations other than the U.S. 6
7.5 Does competition drive ebusiness enablement? Atlantic SMEs consider that “keeping up with competition” is one of the major benefits of using Internet technologies and ebusiness solutions. Is intensity of competition related to ebusiness enablement? We measured the correlation between reported intensity of competition at the local, national, and international levels and the four Indexes of technology use. We found no signifi cant correlation between intensity of competition at the local level and any of the technology use indexes. However, intensity of competition at the national and international levels is signifi cantly correlated with the eBusiness Use Index. In other words, use of eBusiness technologies is greater in competitive business environments, which tend to be export environments.
8. Implications for theory and practice Research reported here was undertaken to better understand the demand side of the Atlantic IT innovation system. Local and regional demand from SMEs is the major source of income for most small IT service providers (Davis and Schaefer, 2003). The the learning and value creation processes of SMEs ebusiness users are not well described in the scientific literature. We show that connectivity per se, and website functionality per se, are not highly associated with perceived value creation by adopters. These capabilities in themselves do not have substantial positive business impacts on users. Demand for ebusiness capability is driven primarily by customer requirements in the regional economy, and that perceived benefits frequently have to do with improved relationships with domestic customers. However, firms also invest in ebusiness capability for strategic reasons. Service providers and policymakers need to take these demand drivers and processes of value creation into account when strategic interventions to improve regional uptake of ebusiness are under consideration.
Relatively few Atlantic SMEs have found ways to create value with ebusiness in export markets. Ebusiness enablement in itself does not necessarily lead to export development. In Atlantic Canada, a peripheral region distant from major markets, complementary policies and programs for ebusiness enablement and export promotion need to be developed.
Based on the results of our 2004 survey of ebusiness technologies and Internet solutions among New Brunswick SMEs, we developed support services including case studies and a package of online ebusiness awareness and training modules. These are currently being delivered under the auspices of the Electronic Commerce Centre in Saint John.
9. Conclusions Use of the least complex Internet technologies and ebusiness solutions has become widespread among Atlantic Canadian SMEs. These firms are experiencing a range of significant business benefits from using ebusiness technologies and Internet solutions, and twothirds of our respon
6 We use the 5% level of significance.
7 th World Congress on the Management of eBusiness, July 2006
11
dents have plans for further investments in areas such as website content development and design, and marketing on the Internet.
While adoption of Internet technologies and ebusiness solutions is facilitated by many factors, the most important ones are the possibility to access new markets, the nature of products or ser vices that the firm buys or sells, the firm’s capability to manage technological change, and the presence of demanding customers or suppliers. These four facilitators portray an ebusiness in novation process in which market learning, technological learning, and interaction with customers and suppliers are the key drivers. The highest impacts of ebusiness adoption have to do with im provement of image, keeping up with competition, improvement of relationships with existing customers, and improvement of customer satisfaction.
Atlantic Canadian SMEs are not noticeably harnessing ecommerce in order to overcome the disadvantages of their peripheral location. Atlantic SMEs are primarily using Internet technolo gies and ebusiness solutions to improve relationships with existing customers in the regional market, where Atlantic SMEs gain the majority of their revenues and where competition is less intense than in national or international markets. In general, fastergrowing Atlantic SMEs use e business technologies more extensively, and have a stronger export orientation, than more slowlygrowing firms.
Acknowledgement Research reported here was supported by a grant from the Social Sciences and Humanities Re search Council to the Innovation Systems Research Network on innovation systems and eco nomic development in Canada. This support is gratefully acknowledged. We also gratefully acknowledge the inkind support provided by the Electronic Commerce Centre in Saint John.
References 1. Bourgeois, Yves, and Samuel LeBlanc (2003). Innovation in Atlantic Canada. Canadian Institute for Research on Regional Development, Université de Moncton.
2. Canada Atlantic Canada Opportunities Agency & Industry Canada. (2004). Innovation through eCommerce (Catalogue Number: C894/842001E).
3. Canada Atlantic Canada Opportunities Agency (2005). The State of Small Business and Entrepreneurship Atlantic Canada 2005 (Catalogue Number: IU89 – 4 / 7 – 2005). http://www.acoa.ca/e/library/reports/sosb/sosb2005.pdf.
4. Davis, Charles H., Carinna Lin, and Florin Vladica (2006). Report of a Survey on Patterns of Use and Business Impacts of Internet Technologies and eBusiness Solutions among Small and MediumSized Enterprises (SMEs) in Atlantic Canada. Unpublished report, Rogers Communica tions Centre, Ryerson University.
5. Davis, Charles H., and F. Vladica (2006). Microenterprises’ use of Internet Technologies and eBusiness Solutions: a Structural Model of Sources of Business Value, Proceedings of the Hawaii International Conference on Systems Science (HICSS 39).

7 th World Congress on the Management of eBusiness, July 2006
12
6. Davis, Charles H., and F. Vladica (2005). Demand for eBusiness Support Services Among New Brunswick SMEs, Proceedings of the 35 th Annual Conference of the Atlantic Schools of Business, Halifax.
7. Davis, Charles H. & Vladica, Florin (2004). Adoption of Internet Technologies and e Business solutions by Small and Medium Enterprises (SMEs) in New Brunswick, report prepared for the Atlantic Canada Opportunities Agency, November.
8. Davis, Charles H. & Schaefer, Norbert V. (2003). “Development Dynamics of a Startup Inno vation Cluster: the ICT Sector in New Brunswick,” pp. 121160 in D. Wolfe, ed., Clusters Old and New: the Transition to a Knowledge Economy in Canada’s Regions. Montreal: McGill Queen’s University Press.
9. Desjardins, PierreMarcel (2005). A SocioEconomic Profile of Atlantic Canada. Canadian Institute for Research on Regional Development, Université de Moncton.
10. Innova Quest (2000). The State of Electronic Commerce in Atlantic Canada. http://dsppsd.pwgsc.gc.ca/Collection/C894642000E.pdf.
11. Johnston, David, and Ron McLean (2004). Net Impact Study Canada: Strategies for In creasing SME Engagement in the eEconomy. Canadian eBusiness Initiative: Net Impact Study 4 [no other publication information provided].
12. Locke, Wade, Charles H. Davis, Ron Freedman, Benoît Godin, and Adam Holbrook (2004). Indicators for Benchmarking Innovation in Atlantic Canada. Report prepared for Industry Can ada, June.
13. MacMillan, Charles (2001). Focusing on the Future: Atlantic Canada’s Quiet Revolution (Council of Atlantic Provinces Premiers: Halifax).
14. Ruggieri, Joe (2003). Atlantic Canada in the KnowledgeBased Age. Policy Studies Centre, University of New Brunswick: Fredericton.
15. Van der Veen, Marijke (2004). “Measuring eBusiness Adoption in SME,” pp. 3153 in W. During, R. Oakey and S. Kauser, eds., New TechnologyBased Firms in the New Millennium, vol. 3. Elsevier: Amsterdam.

7 th World Congress on the Management of eBusiness, July 2006
13
Biographical Notes Charles Davis has worked as an educator and researcher in the area of innovation policy and management for over twentyfive years. His general area of interest is business innovation in the ICT and media industries. He holds the Edward S. Rogers Sr. Research Chair in Media Management and Entrepreneurship at Ryerson University in Toronto, where he teaches courses in entrepreneurship, business strategy, political economy, and the sociology of work and occupations. Previously he taught in the Faculty of Business at the University of New Brunswick in Saint John. He also worked for the International Development Research Centre and the former Science Council of Canada. Charles completed his doctoral studies at the Université de Montréal.
Yi Jing (Carinna) Lin currently works as a Business Systems Analyst at TFG Consulting Inc. in Toronto. Her major work consists of analyzing and translating business needs into specifications using requirement methodologies. Before immigrating to Canada, Carinna had 5 years of Internet technology field work experience in system integration and marketing environment plus one year of Computer Networking System Engineer training by the Taiwan government. Carinna holds SAS programmer certificate and is a Microsoft Certificated System Engineer. She received her M.B.A. in ebusiness from University of New Brunswick and a B.Sc. in economics from the National Taipei University.
Florin Vladica holds an engineering degree in radio navigation, an M.B.A in ebusiness from University of New Brunswick, and an Executive M.B.A from ASEBUSS Bucharest & Washington University in Seattle. Florin also teaches business courses for the University of New Brunswick in Saint John. He recently jointed the joint RyersonYork graduate program in Communication and Culture in Toronto. His research focuses on the use of the Internet by small firms. Florin managed a series of development projects that required comprehensive investigation about needs and challenges of moving business online. Results of this work include a comprehensive elearning package for small business owners in Atlantic Canada, a business plan for a Customer Intelligence Center of Excellence using data mining and neural networks, and a sales reporting system using the corporate intranet.

7 th World Congress on the Management of eBusiness, July 2006
14
Table A: Geographic distribution of respondents
Atlantic Province
Count and % of total respondents
(our 2005 survey)
Count and % of total population (2001 census)
New Brunswick 294 37.89% 729,498 31.92%
Nova Scotia 276 35.57% 908,007 39.73% Newfoundland & Lab rador 72 9.28% 512,930 22.44%
Prince Edward Island 132 17.01% 135,294 5.92%
Other 2 0.26%
Totals 776 2,285,729

7 th World Congress on the Management of eBusiness, July 2006
15
Table B: Sectoral affiliation of respondents by size of firm
Micro (<5) Very small (519) Small (2049) Medium (50499) Total
Count Row % Count Row % Count Row % Count Row % Count * sector arts, handicrafts,
decoration 38 95.0% 1 2.5% 1 2.5% 0 .0% 40
food production & distribution 23 50.0% 11 23.9% 5 10.9% 7 15.2% 46
natural resource 10 47.6% 6 28.6% 2 9.5% 3 14.3% 21
services, general 47 68.1% 12 17.4% 6 8.7% 4 5.8% 69
commerce 38 45.2% 32 38.1% 6 7.1% 8 9.5% 84
construction 13 25.5% 21 41.2% 9 17.6% 8 15.7% 51
tourism & recreation 84 84.0% 12 12.0% 3 3.0% 1 1.0% 100
manufacturing 21 29.2% 37 51.4% 8 11.1% 6 8.3% 72
IT & telecommunications 48 59.3% 26 32.1% 6 7.4% 1 1.2% 81
design & publishing 40 76.9% 11 21.2% 1 1.9% 0 .0% 52
professional and busi ness services 121 76.1% 25 15.7% 7 4.4% 6 3.8% 159
Total 483 62.3% 194 25.0% 54 7.0% 44 5.7% 775
7 th World Congress on the Management of eBusiness, July 2006
16
Table C: Size distribution of firms in survey
Firms/Respondents (our 2005 survey)
Firms (Statistics Canada)
# of Employees Count % of total Count % of total
1 – 4 (micro) 483 62.24%
5 – 19 (very small) 195 25.13%
114,656 88.65%
20 – 49 (small) 54 6.96% 10,170 7.86%
50 – 500 (me dium) 44 5.67% 4,516 3.49%
Totals 776 100.00% 129,332 100.00%
Source: Statistics Canada database. Canadian Business Patterns, 2000
7 th World Congress on the Management of eBusiness, July 2006
17
Table D: Main characteristics of firms in survey
Micro (<5)
Very small (5 19)
Small (2049)
Medium (50499) Total
# of firms in survey 483 195 54 44 776
% of total respondents 62.24% 25.12% 6.95% 5.67% 100.0%
Average # of employees 2.5 12 34.5 250 21.15
# of total employees 1,207.5 2,340 1,863 11,000 16,410.5
% of total employees 7.4% 14.3% 11.4% 67.0% 100.0%
Average estimated gross sales last year ($000) $468 $2,044 $5,505 $11,822 $1,948.4 Total estimated gross sales last year ($000) $181,925 $357,625 $269,725 $461,050 $1,270,325 % of all estimated gross sales last year for all respondents 2.4% 10.3% 27.7% 59.6% 100.0%
Estimated annual growth rate past 3 yrs 18.9% 15.8% 18.5% 17.6% 18.0%
Average age (years) 11.1 19.0 24.3 27.2 14.9

7 th World Congress on the Management of eBusiness, July 2006
18
Table E: Atlantic SMEs in survey by location (density of population)
Population levels Respondents (our 2005 survey)
All Canada
Count % of total
5 >100,000 123 19.16%
4 50,00099,999 111 17.29%
3 20,00049,999 81 12.62%
Total urban 315 49.07% 64%
2 10,00019,999 44 6.85%
1 <10,000 283 44.08% Total small town and
rural 327 50.93% 36%
Grand Totals 642 100%

7 th World Congress on the Management of eBusiness, July 2006
19
Table F: Geographic orientation of business activities by size of firm
Firm’s size category Micro (<5)
Very small (519)
Small (2049)
Medium (50499) Total
mean % revenue of last year only in province 60.1 62.4 53.4 49.4 59.6
% revenue of last year in all Atlantic Canada 60.9 69.0 56.6 62.4 62.7
% revenue of last year gross sales in all Canada 73.3 80.3 72.2 71.5 74.9
% revenue of last year gross sales only in US 10.8 8.5 16.2 15.4 10.8
% revenue of last in other international markets 4.1 2.2 2.5 5.3 3.6
7 th World Congress on the Management of eBusiness, July 2006
20
Table G: Online purchase and sales
Firm’s size category
Micro (<5)
Very small (519)
Small (2049)
Medium (50499) Total
Count % in size ctg. Count % in size
ctg. Count % in size ctg. Count % in size
ctg. Count %
Yes 404 84.90% 169 88.50% 49 92.50% 37 84% 659 86.3% Does your organization use the Inter net to pur chase goods or services? Total 476 100.00% 191 100.00% 53 100.00% 44 100.00% 764 100%
Yes 234 49.00% 75 39.90% 24 45.30% 15 34.10% 348 45.6% Does your organization use the Inter net for selling goods or ser vices?
Total 478 100.00% 188 100.00% 53 100.00% 44 100.00% 763 100%

7 th World Congress on the Management of eBusiness, July 2006
21
Table H: Indexes of Connectivity, eBusiness Use, Transactions, Website Functionality, and eBusiness Enablement by firm size
Micro (<5)
Very small (519)
Small (2049)
Medium (50499)
Index of Connectivity (C) 2.77 2.66 2.57 2.75
Index of eBusiness Use (EBU) 16.36 17.67 21.02 21.50
Index of Transaction (T) 3.96 3.75 4.06 3.55
Index of Website Functionality (WFI) 2.04 2.46 2.48 2.16
Index of eBusiness Enablement (C+EBU+T+WFI=EBE) 25.13 26.54 30.13 29.95

7 th World Congress on the Management of eBusiness, July 2006
22
Figure A: Perceived intensity of competition by size of firm
1.9
2
2.1
2.2
2.3
2.4
2.5
2.6
Micro (<5) Very small (5 19)
Small (2049) Medium (50 499)
Total
Locally In Canada Internationally
Intensity of competition
Scale: 1 = low 2 = medium 3 = high

7 th World Congress on the Management of eBusiness, July 2006
23
Figure B: Perceived intensity of competition by age of firm
1.8
1.9
2
2.1
2.2
2.3
2.4
2.5
before 1970
19701979 19801989 19901999 2000 to date
Total
Locally In Canada Internationally
Intensity of competition
Scale: 1 = low 2 = medium 3 = high
7 th World Congress on the Management of eBusiness, July 2006
24
Figure C: Perceived barriers to success among Atlantic SMEs (by size of firm)
2
2.5
3
3.5
4
4.5
5
A B C D E F G H I J K L M N O P Q
Micro (<5) Very small (519) Small (2049) Medium (50499) Total
Scale 1. No Impact 2. Low 3. Medium 4. High 5. Very High Impact
Legend A Improving the quality of the products/services B Delivery of products/services to customers C Attracting new domestic customers D Getting marketing message out E Developing niche, specialized markets F Keeping overhead costs down (i.e. office space, consumable) G Managing customer information H Implementing new information and communication technologies I Managing office information technology J Equipment costs K Managing and reporting financial and tax information L Attracting and retaining key staff M Increase staff productivity N Geographical distance from clients and suppliers O Purchasing supplies and raw materials P Finding customers abroad Q Managing and communicating with mobile staff

7 th World Congress on the Management of eBusiness, July 2006
25
Figure D Desired capabilities to develop (by size of firm)
0
10
20
30
40
50
60
70
A B C D E F G H I
Micro (<5) Very small (519) Small (2049) Medium (50499) Total
Vertical axis: percent of firms desiring to develop the capability in question
Legend: A Marketing B Interactivity with customers C Strategic planning D Technology E New product development F Entrepreneurship and leadership G Purchasing H Supply management I Change management
7 th World Congress on the Management of eBusiness, July 2006
26
Figure E: The importance of the factors that might facilitate adoption and use of the Internet (by size of firm)
2
2.5
3
3.5
4
A B C D E F G H I J K L M N O P Q R
Micro (<5) Very small (519) Small (2049) Medium (50499) Total
Scale 1. No Importance 2. Little Importance 3. Neutral 4. Important 5. Very Important
Legend A Possibility to access new markets B Nature of the goods or services you buy or sell C Capability to manage technological change D Demanding customers or suppliers E Access to specialized suppliers F Entrepreneurship G Strategic objectives H Management effectiveness I Competitive threats J Access to financial resources K Skilful and resourceful employees L Focus M Business processes in place that facilitate learning N Management commitment O Leadership quality P Attitude towards risk Q Favourable regulatory environment R Internal business culture

7 th World Congress on the Management of eBusiness, July 2006
27
Figure F: Use of IT and ebusiness solutions by Atlantic SMEs
0%
20%
40%
60%
80%
100%
A B C D E F G H I J K L M N O P Q R
Use Now Plan to Use Don't Use
Legend
A Email (electronic mail) B Personal computer, workstation or terminals C Internet; surfing the Internet, visiting websites, etc. D Network/information security technology (e.g. firewall, antivirus software, access control) E Functional software packages (e.g. accounting, HR, marketing) F Presenting own website (on the Internet) G Wireless communications H Shared file folders I Conducting secure business transactions with other businesses or government J Conducting secure transactions with consumers K Internal company website and communications (intranet) L Remote data storage M Hosted software solutions N Meeting over the network (e.g. videoconferencing) O Remote help desk assistance for your employees P Extranet Q Radio Frequency Identification (RFID) R Biometrics

7 th World Congress on the Management of eBusiness, July 2006
28
Figure G: Use of IT and ebusiness solutions (by size of firm)
0
10
20
30
40
50
60
70
80
90
100
A B C D E F G H I J K L M N O P Q R
Micro (<5) Very small (519) Small (2049) Medium (50499)
Vertical axis: percent of respondents using the technology or solution
Legend A Email (electronic mail) B Personal computer, workstation or terminals C Internet; surfing the Internet, visiting websites, etc. D Network/information security technology (e.g. firewall, antivirus software, access control) E Functional software packages (e.g. accounting, HR, marketing) F Presenting own website (on the Internet) G Wireless communications H Shared file folders I Conducting secure business transactions with other businesses or government J Conducting secure transactions with consumers K Internal company website and communications (intranet) L Remote data storage M Hosted software solutions N Meeting over the network (e.g. videoconferencing) O Remote help desk assistance for your employees P Extranet Q Radio Frequency Identification (RFID) R Biometrics

7 th World Congress on the Management of eBusiness, July 2006
29
Figure H: Website ownership by sector
0.00 0.10 0.20 0.30 0.40 0.50 0.60 0.70 0.80 0.90
tourism & recreation
IT & telecommunications
manufacturing
arts, handicrafts, decoration
design & publishing
commerce
construction
professional and business services
services, general
natural resources
food production & distribution
Total
Vertical axis: percent of firms having a website
7 th World Congress on the Management of eBusiness, July 2006
30
Figure I: Features of respondent’s websites (by size of firm)
0
10
20
30
40
50
60
70
80
90
A B C D E F G H I
Micro (<5)
Very small (519)
Small (2049)
Medium (50499)
Total
Vertical axis: percent of firms with websites having various functions or features
Legend
A Information about product or services B Information about the business C Two way communication D Secure web site E Privacy policy statement F Online payment G Digital products or services H Access via wireless mobile devices I Realtime interactivity
7 th World Congress on the Management of eBusiness, July 2006
31
Figure J: Impacts of Internet technologies and ebusiness solutions among Atlantic Canadian SMEs
2.00
2.20
2.40
2.60
2.80
3.00
3.20
3.40
0.15 0.20 0.25 0.30 0.35 0.40 0.45 0.50
% of firms reporting high impact (=>4)
mean score
The vertical axis represents the mean reported impact on a fivepoint Likert scale: 1 = No Impact; 2 = Low Impact; 3 = Medium Impact; 4 = High Impact; 5 = Very High Impact
The horizontal axis represents the percentage of firms reporting a High or Very High Impact (=> 4)
0.48 Improved the brand and image of the business and its product/service
0.45 Allowed business to keep up with its competitors 0.43 Building and enhancing relationships with existing customers
0.42 Increased the speed of supplying and/or delivering services or goods
0.42 Increased level of customer service and satisfaction
0.4 Increased the ability to adapt to different client demands 0.39 Increased the business productivity
0.38 Improved coordination with partners or suppliers
0.33 Increased the business profitability
0.32 Improved the quality of goods or services 0.3 Improved rate of development and introduction of new products/services
0.27 Developing unique expertise or a unique market
0.23 Increased the business domestic market share
0.19 Decreased the cost of producing goods or services 0.19 Increased the business international market share

7 th World Congress on the Management of eBusiness, July 2006
32
Figure K: Atlantic SMEs’ portion of sales conducted over the Internet and portion of Internetbased sales to international customers (by firm’s size)
0.0%
5.0%
10.0%
15.0%
20.0%
25.0%
30.0%
35.0%
40.0%
Micro (<5) Very small (519) Small (2049) Medium (50499) Total
percentage of your organization's gross sales conducted over the Internet percentage of your Internet sales to customers outside of Canada

7 th World Congress on the Management of eBusiness, July 2006
33
Figure L: Plans to use Internet technologies and related business solutions (by size of firm)
0
5
10
15
20
25
30
35
40
45
A B C D E F G H I J K L Micro (<5) Very small (519) Small (2049) Medium (50499) Total
Vertical axis: percent of firms reporting plans to use a technology or solution
Legend
A I have no plans in this regard B Website content development C Website design D Promotional/Internet marketing services E Payment services F Customer support G Delivery, fulfillment and order tracking H Shopping cart I Security/Access management J Catalogue management K Hosting L Technical consulting M Business process integration

7 th World Congress on the Management of eBusiness, July 2006
34
Figure M: Atlantic SMEs’ likely use of tools or services designed to assist with e commerce (by respondent firm’s size)
0
10
20
30
40
50
60
Micro (<5) Very small (5 19)
Small (2049) Medium (50 499)
Total
A
B
C
D
E
F
G
H
I
Vertical axis: percent of firms reporting likely use of tools or services
Legend
A Examples (case studies) of businesses similar to yours, currently using ecommerce successfully; B Recommendations about ecommerce solutions relevant to your type of sector or business; C Personalized, expert advice on ecommerce for your business; D Online seminars on ecommerce in your sector (i.e. tourism, fisheries, manufacturing, etc.); E Directory of organizations that can offer help in using ecommerce; F Visits to successful companies; G Interactive questionnaire to help you define an ecommerce strategy; H Classroombased seminars about ecommerce in your sector (i.e. tourism, fisheries, manufacturing, etc.); I Statistics and graphics about ecommerce adoption and use among different sizes or types of companies in Atlantic Canada.