Embed Size (px)
Citation preview

UseUse--Case for Risk Case for Risk
Analysis of Water Analysis of Water
Borne Vector DiseaseBorne Vector Disease
Prof. Nataliia Kussul,
Prof. Andrii ShelestovSpace Research Institute NASU-NSAU, Ukraine
UN-SPIDER Workshop
September 21-23, 2009
Bonn, Germany
Bonn
2009
Who we are: Current Expertise Who we are: Current Expertise
& International cooperation& International cooperation
• Space Research Institute National Academy of Science & National Space Agency of Ukraine, department of Space Information Technologies
• Active participation at Working Group on Information System and Services (WGISS) of the Committee on Earth Observation Satellites (CEOS).
• Participation in international collaborative activities within GEO Working Plan and creation of GEOSS Architecture Implementation Pilot (1st and 2nd
Calls) on topics Disasters and Sensor Web

Bonn
2009
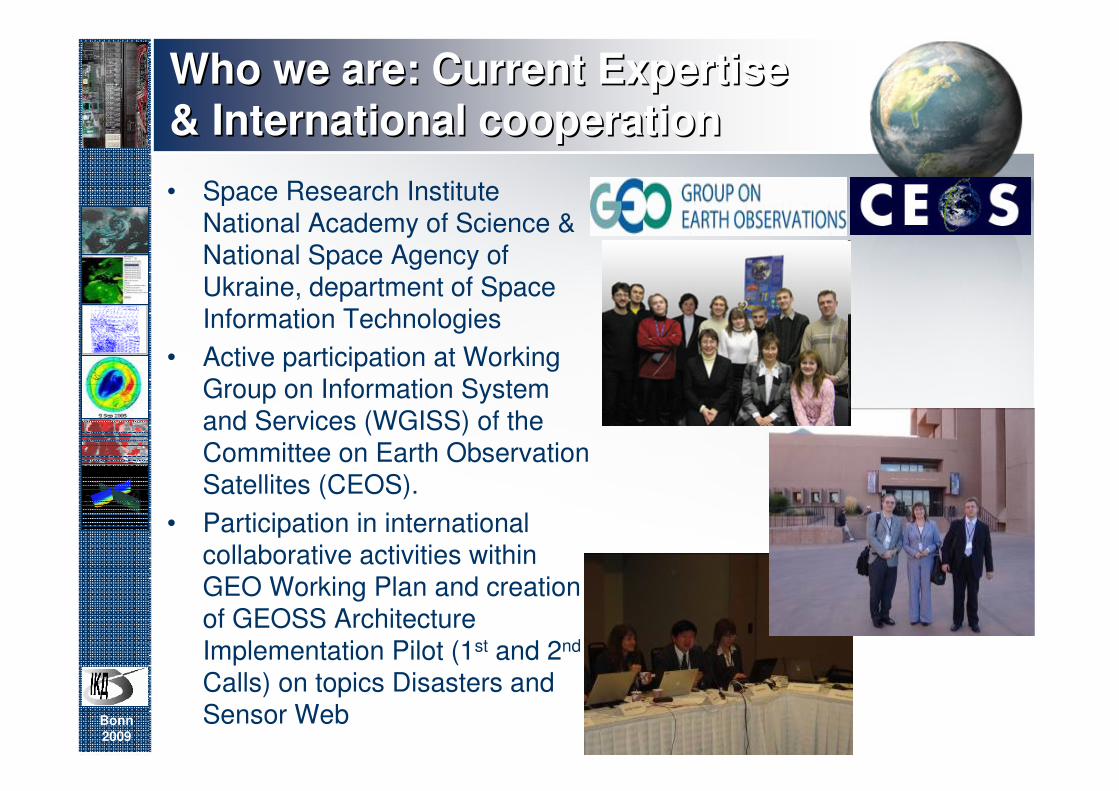
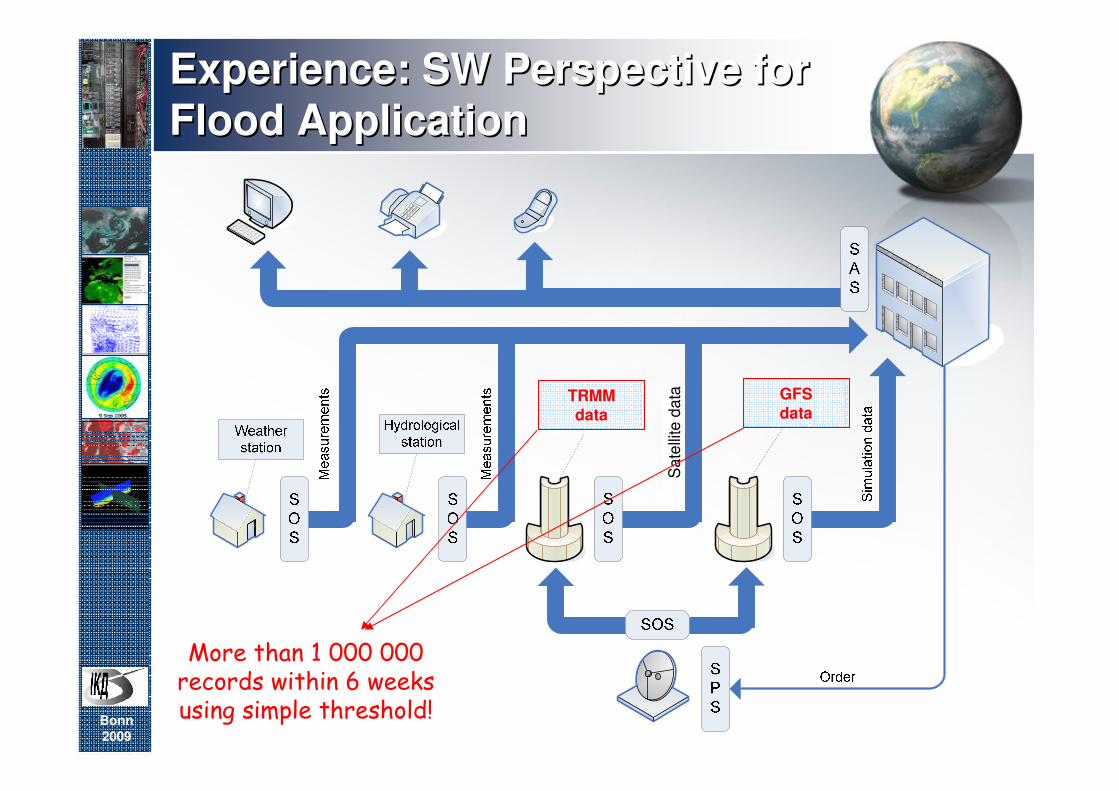
Experience: SW Perspective for Experience: SW Perspective for
Flood ApplicationFlood Application
Satellite
obs
Sa
telli
te d
ata
Bonn
2009
Experience: SW Perspective for Experience: SW Perspective for
Flood ApplicationFlood Application
TRMMdata
Sa
telli
te d
ata GFS
data
More than 1 000 000records within 6 weeks using simple threshold!

Bonn
2009
Scenario of GEOScenario of GEO--Ukraine Ukraine
Response to GEOSS AIP CFPResponse to GEOSS AIP CFP--22
SOS Interface to
GFS & TRMM dataSatellite
Observations
Data Processing in GridVisualization of Data
SPS
WPS
WMS

Bonn
2009
China, river Huaihe, 2007 Mozambique, river Zambezi, 2008
India and Nepal, river Koshi, 2008 Zambia, river Zambezi, 2009Vietnam, 2008
CaseCase--Study AreasStudy Areas
Ukraine, river Tisza, 2001

Bonn
2009
Scope of our activityScope of our activity

Bonn
2009
Challenge: To discover Flood Challenge: To discover Flood
Caused Risk of EpidemicsCaused Risk of Epidemics
• Africa
– rising flood waters intensifies health risks for
millions of people, and exacerbates health threats
for conditions including malaria, diarrhea and other
potentially fatal communicable diseases [UN, WHO]
• Ukraine
– major threats to health by water related diseases
– contamination of drinking water in wells
– leads to infectious diseases like hepatitis,
leptospirosis etc with long incubation period
[Ministry of Health of Ukraine]

Bonn
2009
Challenge (cont.)Challenge (cont.)
• GEOSS Health SBA
– “… Earth observation data can contribute to
improving our understanding of how the
environment affects human health and well-
being ”
– “… remote-sensing observations of weather, land
and ocean parameters can now be used to predict
outbreaks or trends in infectious diseases such
as meningitis, malaria and cholera…”

Bonn
2009
Challenge (cont.)Challenge (cont.)
• GEOSS Health SBA in WP 2009-2011– HE-07-01: Strengthen Observation and
Information Systems for Health• to improve in-situ environmental and health data
collection for the utilization and validation of remotely sensed data relevant to health
– HE-07-02: Environment and Health Monitoring and Modelling
• to further develop and integrate databases of remotely sensed and in-situ environmental measurements together with new observations characterizing atmospheric, soil, river, lake and coastal marine pollution, and develop models to relate these to exposure and health effects data

Bonn
2009
Our response: Initiated Project on Flood Our response: Initiated Project on Flood
Forecasting and Epidemics Risk Forecasting and Epidemics Risk
AssessmentAssessment
• Main goal– to investigate environmental indicators of infectious
disease and develop information technology for floods prediction and infectious disease risk assessment, in particular malaria
– Within the project we will work out the flowing chains of data processing:
• flood monitoring and forecasting,
• flood mapping,
• environmental parametersassessment,
• socio-economical factors assessment,
• infectious disease riskassessment.

Bonn
2009
STCUSTCU--NASU CallNASU Call
• Joint Call of the National Academy of Science of Ukraine and the Science and Technology Center in Ukraine “Targeted Research & Development Initiatives”
• Directions include
– Information technologies and systems for the needs
of biology and medicine
• Requires foreign collaborationsto be involved

Bonn
2009
UseUse--Case ScenarioCase Scenario
Flood warnings
EO products
Socio-economic inf
Infrastructure
Health risk analysis
Models

Bonn
2009
DataData
• Models– GFS, hydro-predictors, …
• Statistical data– on infectious diseases in Ukraine & Africa
• Remote sensing– land and water related products
– In-situ measurements
• Socio-economic information– distribution of population, administrative
boundaries…
• Infrastructure– wells, channels, …

Bonn
2009
MethodologyMethodology
• WP1 - "Diseases“
– to capture relationship between the environmental parameters
and the development of infectious diseases
• WP2 - "Environment“
– environmental parameters assessment from EO, in-situ data &
models
• WP3 - “Information technologies“
– development of models to forecast the spread of diseases
– risk = f( intensity of disaster, probability), error estimates
• WP4 - “Geoinformation services“
– integration and visualization of the information to better
manage infectious diseases

Bonn
2009
CaseCase--StudyStudy
• Floods in Ukraine
(Western regions), 2008
– 29 people were killed
– 17 201 people were evacuated
– 762 865 people were
examined by doctors
– 24 411 people were sick
• 1729 with infectious
diseases, among them
917 children
– Water quality issues
• 118000 objects
disinfected
• 31404 of water wells
Bonn
2009
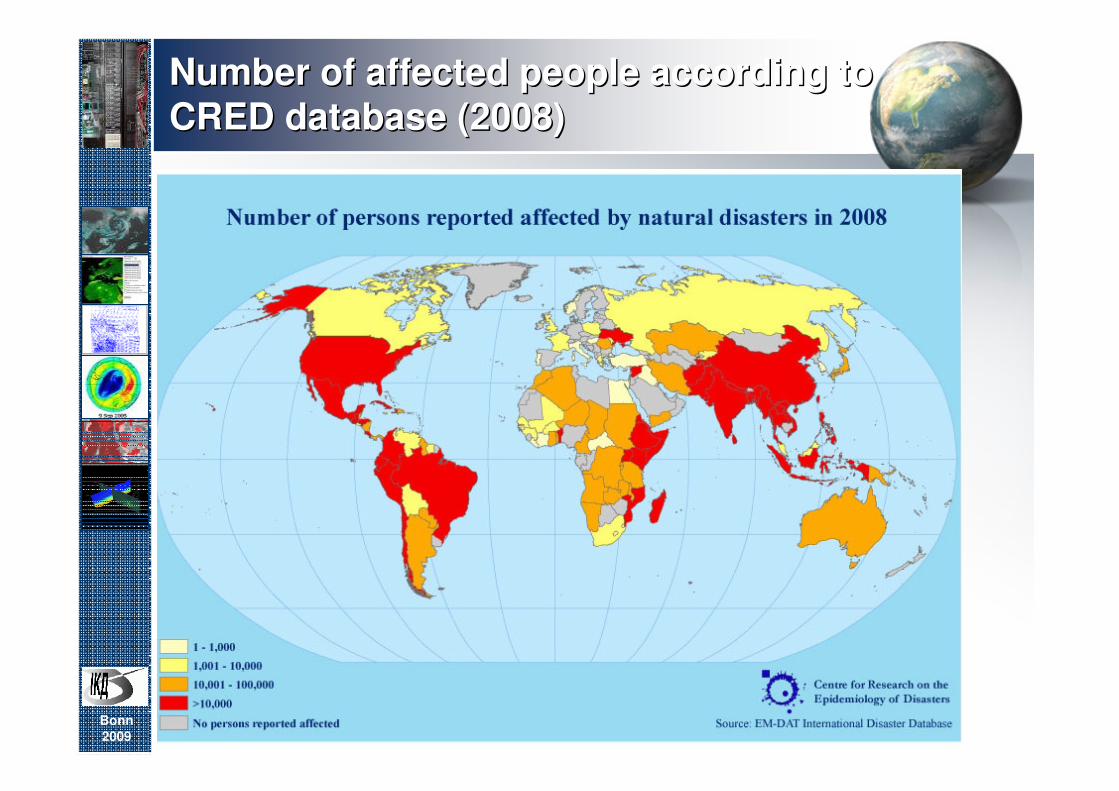
Number of affected people according to Number of affected people according to
CRED database (2008)CRED database (2008)

Bonn
2009
Charter Activation (for Charter Activation (for
Romania) Romania) –– too latetoo late

Bonn
2009
System
development in
2002-2008 after
the catastrophic
floods in
TransCarpathian
region
(Zakarpatska
oblast) in 1998
and 2000.
Nowadays more
then 40 automatic
water gage
stations, 25 of
them use satellite
communication
lines
Flood forecasting system for the Ukrainian Flood forecasting system for the Ukrainian
part of the Tisza River Basinpart of the Tisza River Basin

Bonn
2009
Zones of the catastrophic precipitation of 22-26 July 2008 on the Ukrainian
wind map simulated by MM5- Ukraine model on the grid 27*27 km
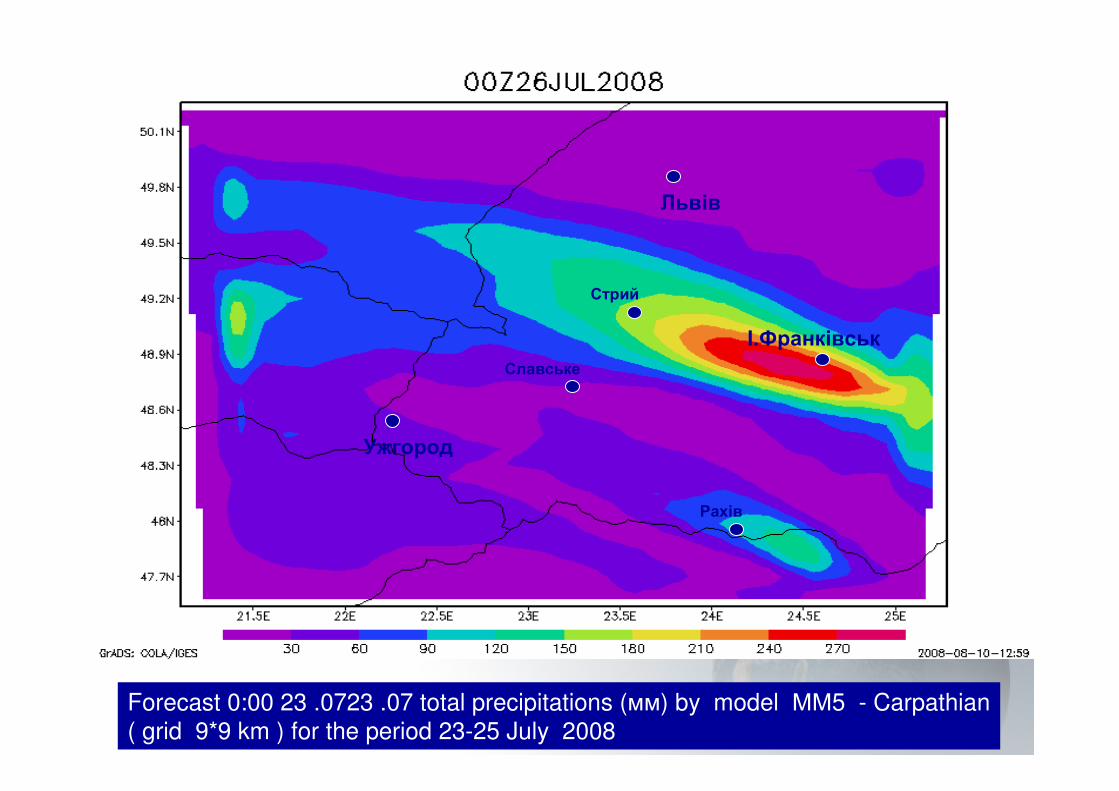
System testing for catastrophic System testing for catastrophic
flood July 2008 flood July 2008
Львів
І.Франківськ
Стрий
Славське
Рахів
Ужгород
Forecast 0:00 23 .0723 .07 total precipitations (мм) by model ММ5 - Carpathian
( grid 9*9 km ) for the period 23-25 July 2008

Bonn
2009
• Simulation of flow direction via DEM →
Distributed rainfall Distributed rainfall –– runoff model TOPKAPIrunoff model TOPKAPI--IMMSP IMMSP
based on watershedbased on watershed’’s maps map

Forecast ММ5 - MM5-Carpathian , grid 3*3 км. From 12:00 23 .07 total precipitation.
Dots –measured data
Турка
-20
0
20
40
60
80
100
120
140
160
180
0 10 20 30 40 50 60 70
години
опади
, мм
Великі Березни
-10
0
10
20
30
40
50
60
0 20 40 60 80
години
опади, мм
Коломия
0
50
100
150
200
0 20 40 60 80
години
опади
, мм
Славське
0
50
100
150
0 20 40 60 80
години
опади, мм

Bonn
2009
Simulation of the water levels and discharges of Uzh River near Uzhgorod based on the measured precipitations (solid line) and precipitations predicted by MM5- Carpathian models for 3*3 км grid

Bonn
2009
UngaugedUngauged watershed case watershed case
studystudy
0
5
10
15
20
25
04.0
1.9
8
04.0
2.9
8
04.0
3.9
8
04.0
4.9
8
04.0
5.9
8
04.0
6.9
8
04.0
7.9
8
04.0
8.9
8
04.0
9.9
8
04.1
0.9
8
04.1
1.9
8
04.1
2.9
8
0
0.05
0.1
0.15
0.2
0.25
0.3
20.01 11.03 30.04 19.06 08.08 27.09 16.11DEM of Kvasovo area
Observed time series of precipitation
Simulated runoff

Bonn
2009
Future Plans: Statistical and Future Plans: Statistical and
SocioSocio--economic information economic information
• L.V. Gromashevsky’s Institute of Epidemiology and Infectious Diseases from Ukraine
– will provide• expertise on infectious diseases
• statistical information over west Ukraine
• NOAA
– will provide statistical information on Malaria in Africa
– other partners?
• Challenges & Prospects • environmental information to be used for risk
assessment of health threats due to floods
• great interest in the use of modern geoinformationtechnologies
• visualization of geospatial information and time-series

Bonn
2009
• We are looking for collaboration!