Embed Size (px)
Citation preview
CONFIDENTIAL
Date
Use Facility Image if available
Information Session
February 2017
2017 Pediatric Subspecialty Physician Compensation Survey
CONFIDENTIAL
CONFIDENTIAL
Agenda
I. Introduction II. Survey Overview III. ECGVault Overview IV. 2017 Membership Appendix A — 2016 Survey Members Appendix B — 2016 Reported Specialties Appendix C — Sample Pediatric CPT Code Profiler Reports
1 1275.011\384615(pptx)-E2 DD 2-2-17

CONFIDENTIAL
I. Introduction
2 1275.011\384615(pptx)-E2 DD 2-2-17
CONFIDENTIAL
I. Introduction About ECG
OPERATIONS TECHNOLOGY
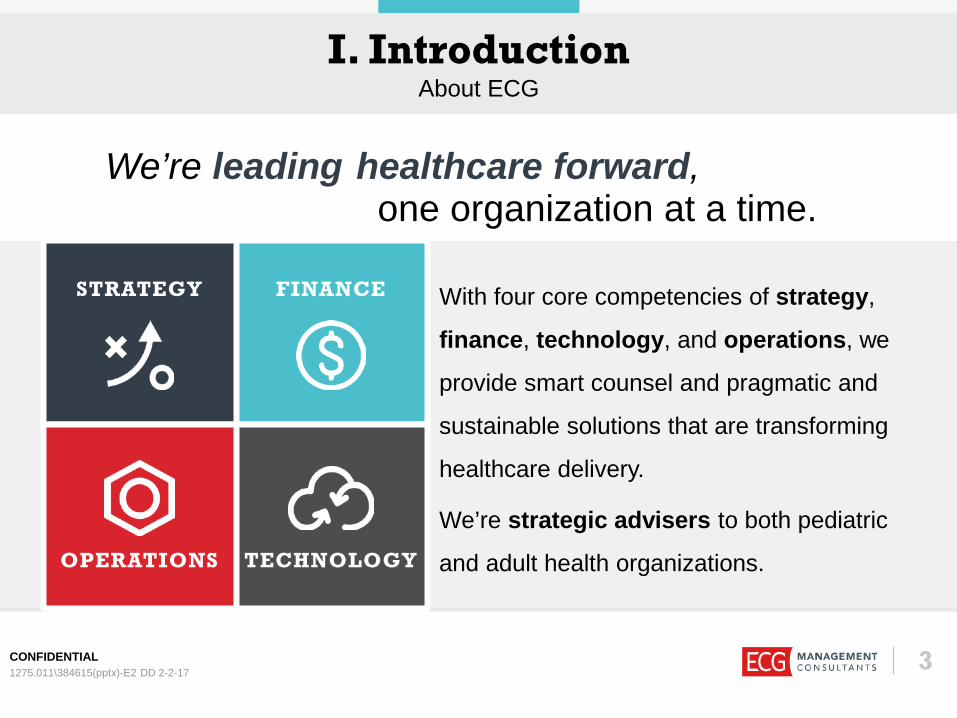
STRATEGY FINANCE With four core competencies of strategy,
finance, technology, and operations, we
provide smart counsel and pragmatic and
sustainable solutions that are transforming
healthcare delivery.
We’re strategic advisers to both pediatric
and adult health organizations.
We’re leading healthcare forward, one organization at a time.
3 1275.011\384615(pptx)-E2 DD 2-2-17
CONFIDENTIAL
I. Introduction ECG’s Custom Surveys
4
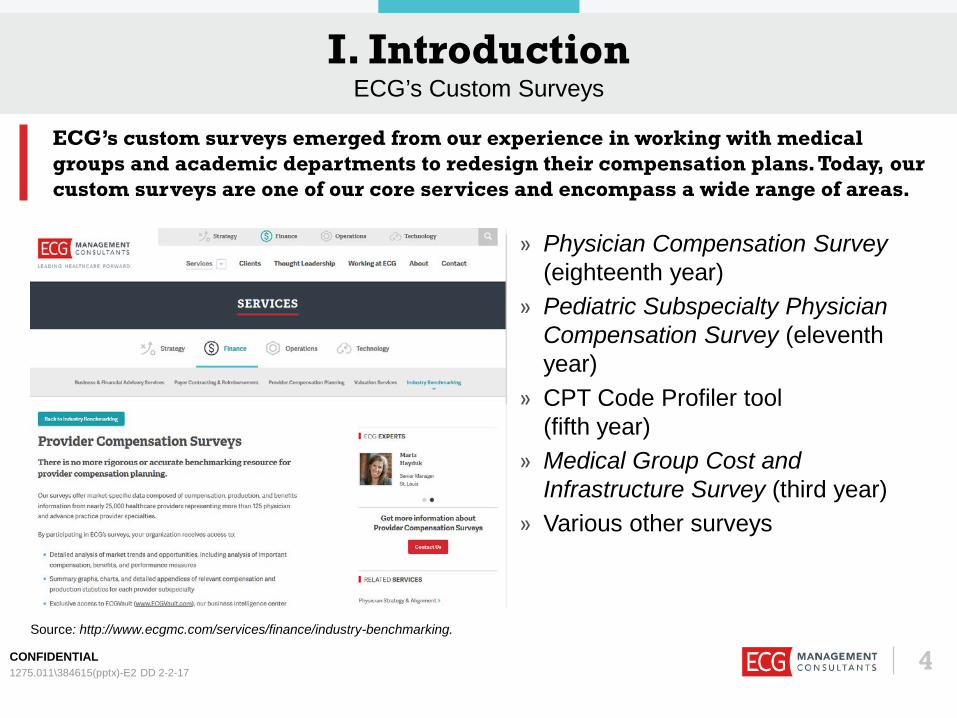
» Physician Compensation Survey (eighteenth year)
» Pediatric Subspecialty Physician Compensation Survey (eleventh year)
» CPT Code Profiler tool (fifth year)
» Medical Group Cost and Infrastructure Survey (third year)
» Various other surveys
ECG’s custom surveys emerged from our experience in working with medical groups and academic departments to redesign their compensation plans. Today, our custom surveys are one of our core services and encompass a wide range of areas.
1275.011\384615(pptx)-E2 DD 2-2-17
Source: http://www.ecgmc.com/services/finance/industry-benchmarking.
CONFIDENTIAL
I. Introduction Providing Critical Data
5
» Annual market assessments of compensation and production for physicians and advanced practice providers (APPs).
» Compensation plan redesign for physicians and APPs. » Operations improvement projects that include productivity evaluation and
benchmarking at both the individual provider and specialty levels. » Audits and market comparisons of coding practices (individual provider and specialty
levels). » Fair market value assessments and opinions. » Provider benefit benchmarking and design. » Market payor contracting strategies. » Recruiting and retention benchmarking.
Survey members utilize data and benchmarks from our surveys to inform themselves on key issues and support various analyses in their organizations, including:
Our surveys provide members with access to data that is more in-depth than what is offered by, or not available from, other
industry sources. 1275.011\384615(pptx)-E2 DD 2-2-17
CONFIDENTIAL
I. Introduction Survey Year-Over-Year Growth
6 1275.011\384615(pptx)-E2 DD 2-2-17
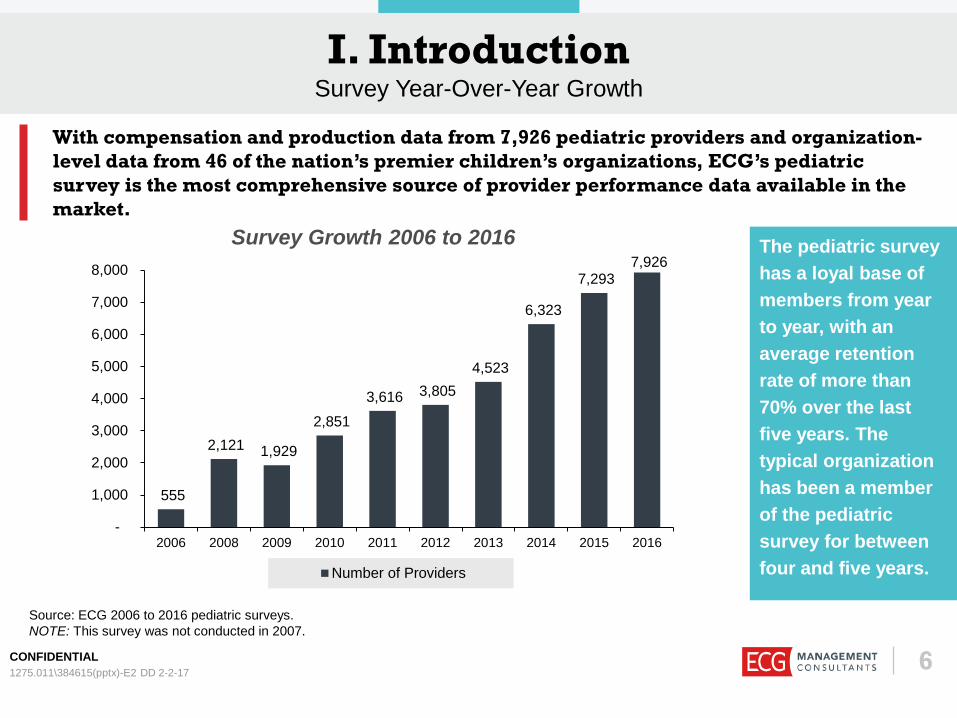
Survey Growth 2006 to 2016
555
2,121 1,929
2,851
3,616 3,805 4,523
6,323
7,293 7,926
-
1,000
2,000
3,000
4,000
5,000
6,000
7,000
8,000
2006 2008 2009 2010 2011 2012 2013 2014 2015 2016
Number of Providers
With compensation and production data from 7,926 pediatric providers and organization-level data from 46 of the nation’s premier children’s organizations, ECG’s pediatric survey is the most comprehensive source of provider performance data available in the market.
The pediatric survey has a loyal base of members from year to year, with an average retention rate of more than 70% over the last five years. The typical organization has been a member of the pediatric survey for between four and five years.
Source: ECG 2006 to 2016 pediatric surveys. NOTE: This survey was not conducted in 2007.
CONFIDENTIAL
I. Introduction Geographic Distribution
7 1275.011\384615(pptx)-E2 DD 2-2-17
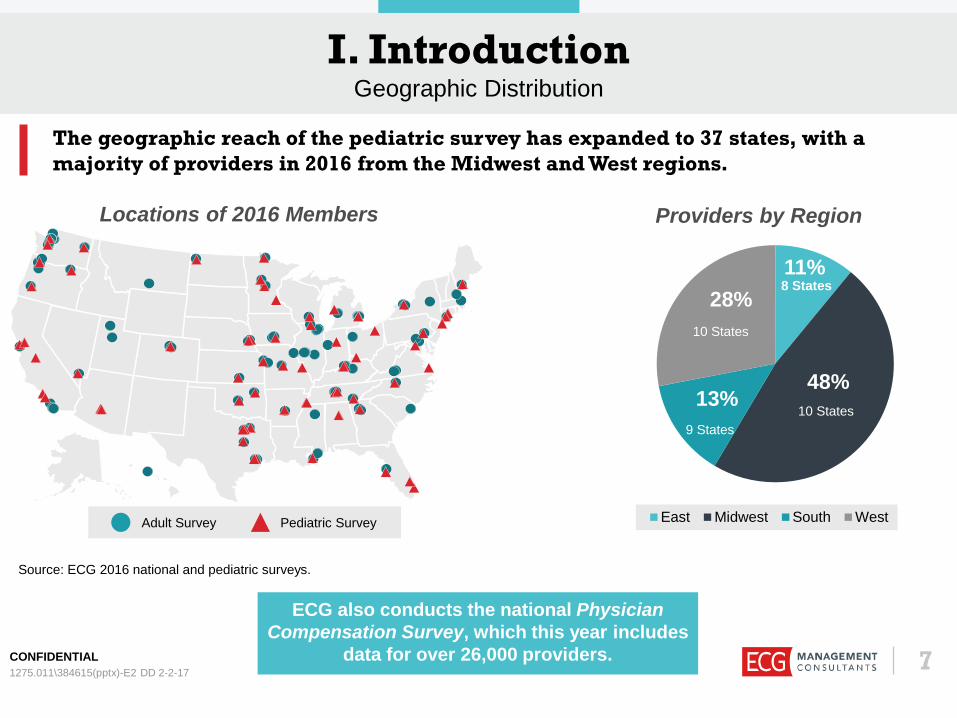
The geographic reach of the pediatric survey has expanded to 37 states, with a majority of providers in 2016 from the Midwest and West regions.
Locations of 2016 Members
Source: ECG 2016 national and pediatric surveys.
ECG also conducts the national Physician Compensation Survey, which this year includes
data for over 26,000 providers.
Providers by Region
11%
48% 13%
28%
East Midwest South West
8 States
10 States 9 States
10 States
Adult Survey Pediatric Survey
CONFIDENTIAL
I. Introduction Provider Demographics
8 1275.011\384615(pptx)-E2 DD 2-2-17
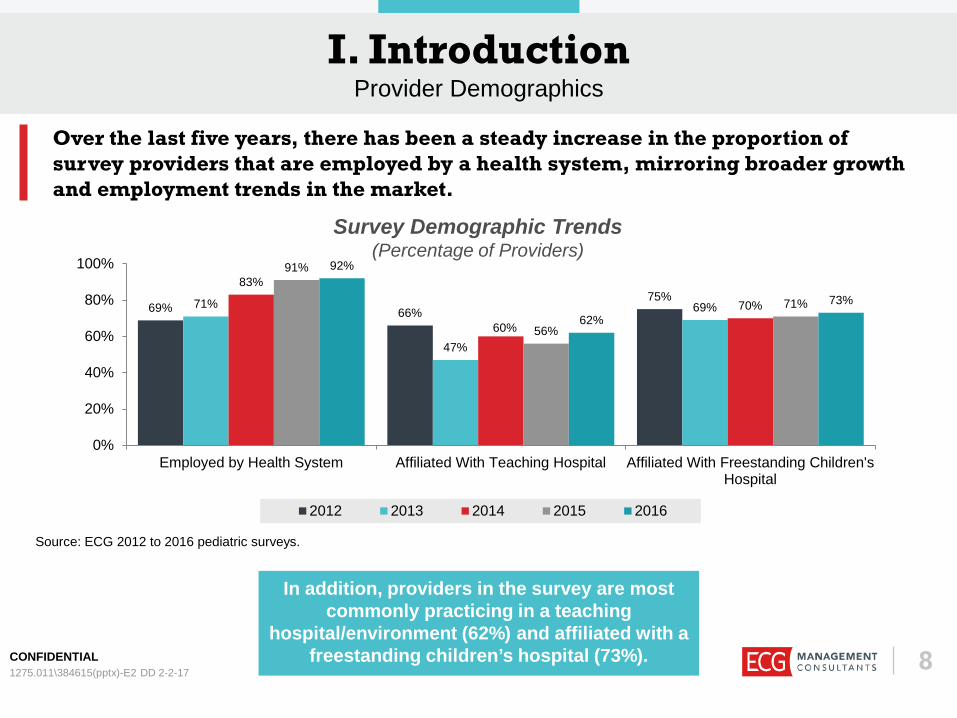
Survey Demographic Trends (Percentage of Providers)
Source: ECG 2012 to 2016 pediatric surveys.
69% 66% 75% 71%
47%
69%
83%
60%
70%
91%
56%
71%
92%
62%
73%
0%
20%
40%
60%
80%
100%
Employed by Health System Affiliated With Teaching Hospital Affiliated With Freestanding Children'sHospital
2012 2013 2014 2015 2016
In addition, providers in the survey are most commonly practicing in a teaching
hospital/environment (62%) and affiliated with a freestanding children’s hospital (73%).
Over the last five years, there has been a steady increase in the proportion of survey providers that are employed by a health system, mirroring broader growth and employment trends in the market.
CONFIDENTIAL
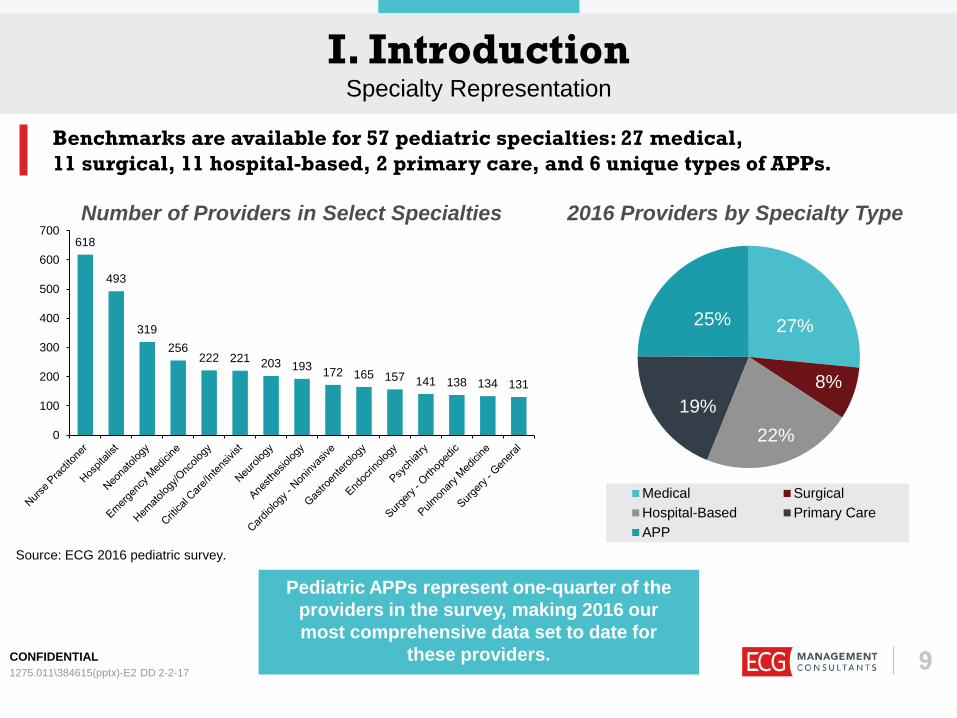
I. Introduction Specialty Representation
618
493
319 256
222 221 203 193 172 165 157 141 138 134 131
0
100
200
300
400
500
600
700Number of Providers in Select Specialties
Source: ECG 2016 pediatric survey.
Benchmarks are available for 57 pediatric specialties: 27 medical, 11 surgical, 11 hospital-based, 2 primary care, and 6 unique types of APPs.
Pediatric APPs represent one-quarter of the providers in the survey, making 2016 our most comprehensive data set to date for
these providers.
27%
8%
22% 19%
25%
Medical SurgicalHospital-Based Primary CareAPP
2016 Providers by Specialty Type
1275.011\384615(pptx)-E2 DD 2-2-17
9

CONFIDENTIAL
II. Survey Overview
10 1275.011\384615(pptx)-E2 DD 2-2-17
CONFIDENTIAL
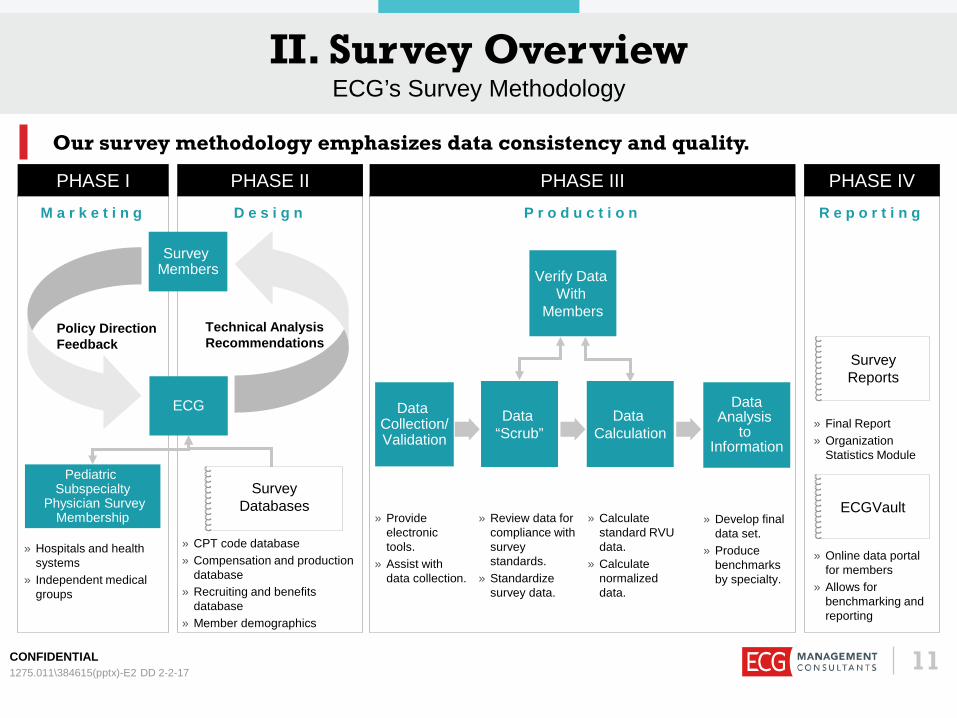
D e s i g n M a r k e t i n g P r o d u c t i o n R e p o r t i n g
» CPT code database » Compensation and production
database » Recruiting and benefits
database » Member demographics
Data Collection/ Validation
Data Calculation
Data Analysis
to Information
Technical Analysis Recommendations
Policy Direction Feedback
ECG
Survey Members
» Provide electronic tools.
» Assist with data collection.
» Review data for compliance with survey standards.
» Standardize survey data.
» Calculate standard RVU data.
» Calculate normalized data.
» Final Report » Organization
Statistics Module
PHASE II PHASE I PHASE IV
» Hospitals and health systems
» Independent medical groups
Pediatric Subspecialty
Physician Survey Membership
PHASE III
» Develop final data set.
» Produce benchmarks by specialty.
» Online data portal for members
» Allows for benchmarking and reporting
Verify Data With
Members
Data “Scrub”
II. Survey Overview ECG’s Survey Methodology
Our survey methodology emphasizes data consistency and quality.
Survey Reports
Survey Databases ECGVault
1275.011\384615(pptx)-E2 DD 2-2-17 11
CONFIDENTIAL
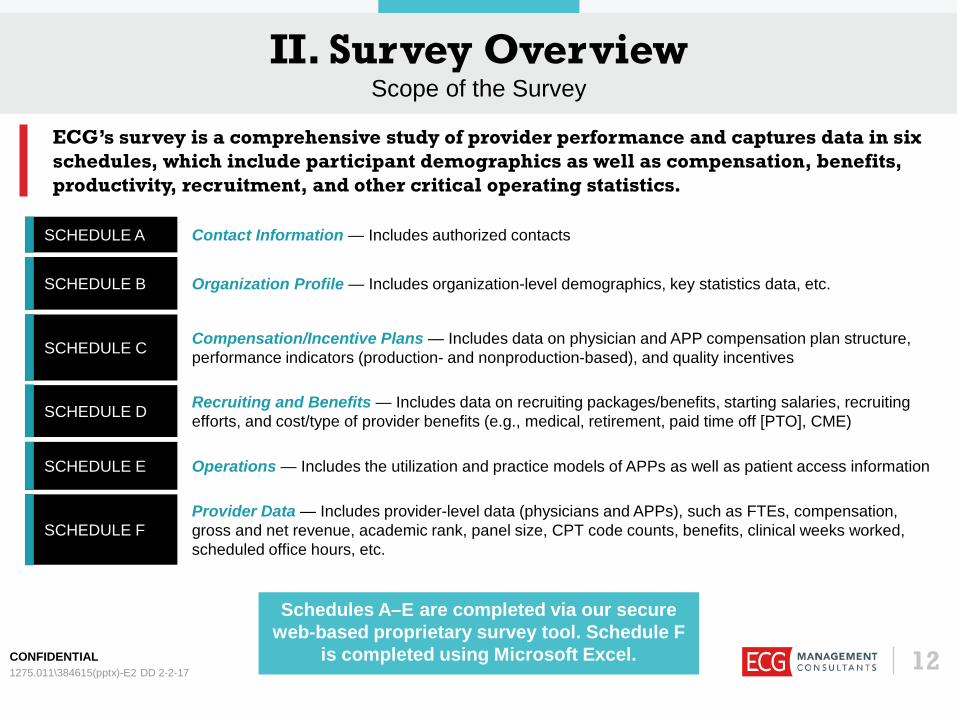
II. Survey Overview Scope of the Survey
Contact Information — Includes authorized contacts SCHEDULE A
Organization Profile — Includes organization-level demographics, key statistics data, etc. SCHEDULE B
Recruiting and Benefits — Includes data on recruiting packages/benefits, starting salaries, recruiting efforts, and cost/type of provider benefits (e.g., medical, retirement, paid time off [PTO], CME) SCHEDULE D
Compensation/Incentive Plans — Includes data on physician and APP compensation plan structure, performance indicators (production- and nonproduction-based), and quality incentives SCHEDULE C
Operations — Includes the utilization and practice models of APPs as well as patient access information SCHEDULE E
Provider Data — Includes provider-level data (physicians and APPs), such as FTEs, compensation, gross and net revenue, academic rank, panel size, CPT code counts, benefits, clinical weeks worked, scheduled office hours, etc.
SCHEDULE F
ECG’s survey is a comprehensive study of provider performance and captures data in six schedules, which include participant demographics as well as compensation, benefits, productivity, recruitment, and other critical operating statistics.
Schedules A–E are completed via our secure web-based proprietary survey tool. Schedule F
is completed using Microsoft Excel. 12 1275.011\384615(pptx)-E2 DD 2-2-17
CONFIDENTIAL
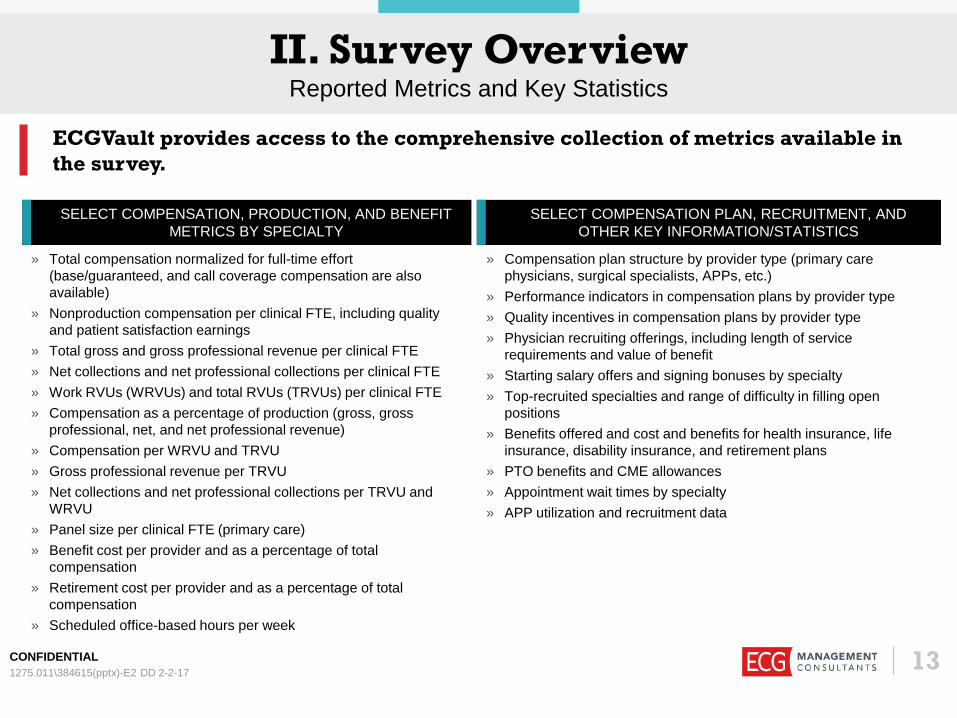
II. Survey Overview Reported Metrics and Key Statistics
» Total compensation normalized for full-time effort (base/guaranteed, and call coverage compensation are also available)
» Nonproduction compensation per clinical FTE, including quality and patient satisfaction earnings
» Total gross and gross professional revenue per clinical FTE » Net collections and net professional collections per clinical FTE » Work RVUs (WRVUs) and total RVUs (TRVUs) per clinical FTE » Compensation as a percentage of production (gross, gross
professional, net, and net professional revenue) » Compensation per WRVU and TRVU » Gross professional revenue per TRVU » Net collections and net professional collections per TRVU and
WRVU » Panel size per clinical FTE (primary care) » Benefit cost per provider and as a percentage of total
compensation » Retirement cost per provider and as a percentage of total
compensation » Scheduled office-based hours per week
» Compensation plan structure by provider type (primary care physicians, surgical specialists, APPs, etc.)
» Performance indicators in compensation plans by provider type » Quality incentives in compensation plans by provider type » Physician recruiting offerings, including length of service
requirements and value of benefit » Starting salary offers and signing bonuses by specialty » Top-recruited specialties and range of difficulty in filling open
positions » Benefits offered and cost and benefits for health insurance, life
insurance, disability insurance, and retirement plans » PTO benefits and CME allowances » Appointment wait times by specialty » APP utilization and recruitment data
SELECT COMPENSATION, PRODUCTION, AND BENEFIT METRICS BY SPECIALTY
SELECT COMPENSATION PLAN, RECRUITMENT, AND OTHER KEY INFORMATION/STATISTICS
ECGVault provides access to the comprehensive collection of metrics available in the survey.
13 1275.011\384615(pptx)-E2 DD 2-2-17
CONFIDENTIAL
II. Survey Overview Exclusive Member Benefits
» ECGVault — This data portal contains current and historical ECG physician and APP performance benchmarks at the market, organization, and provider levels.
» Final Report — This document summarizes key year-over-year market trends for all components of the survey.
» Members-Only Webinar — Hosted in the fall, this webinar focuses on key compensation, production, recruiting, and benefit trends of the 2017 survey.
» ECG’s Survey Team — Through the survey process, we cultivate a relationship with each of our members. By taking the time to interact with our members, we ensure that we understand your organization and data, which translates into the most accurate and reliable benchmarks available in the industry.
As members of ECG’s survey, organizations have exclusive access to:
ECG’s survey approach, methodology, and value-added deliverables set us apart from
other industry surveys. 1275.011\384615(pptx)-E2 DD 2-2-17 14
CONFIDENTIAL
III. ECGVault Overview
15 1275.011\384615(pptx)-E2 DD 2-2-17
CONFIDENTIAL
III. ECGVault Overview Background
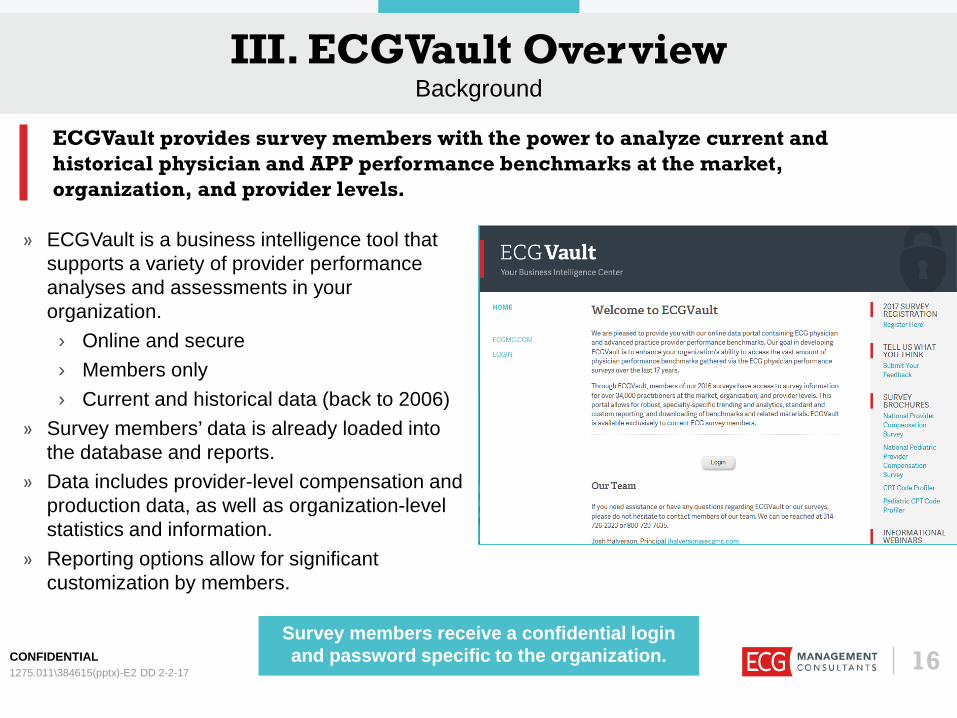
» ECGVault is a business intelligence tool that supports a variety of provider performance analyses and assessments in your organization.
› Online and secure › Members only › Current and historical data (back to 2006)
» Survey members’ data is already loaded into the database and reports.
» Data includes provider-level compensation and production data, as well as organization-level statistics and information.
» Reporting options allow for significant customization by members.
ECGVault provides survey members with the power to analyze current and historical physician and APP performance benchmarks at the market, organization, and provider levels.
Survey members receive a confidential login and password specific to the organization.
1275.011\384615(pptx)-E2 DD 2-2-17 16
CONFIDENTIAL
III. ECGVault Overview Your Business Intelligence Center
» Dynamic Reports —These reports allow for robust, specialty-specific trending and analysis capabilities, as well as standard and custom reporting, downloading of benchmarks, and access to related materials.
» Static Reports — These reports include the benchmark tables for physicians and APPs in Adobe PDF format. The benchmark tables provide averages and quartiles by specialty for each of the compensation and production metrics in ECG’s surveys.
» Organization Statistics Module — In addition to the organization data provided in ECG’s Final Report, comprehensive market data is available via our Organization Statistics Module.
ECGVault contains three primary types of reporting options:
ECGVault now includes the Pediatric CPT Code Profiler, an additional product that members
can subscribe to. 1275.011\384615(pptx)-E2 DD 2-2-17 17
CONFIDENTIAL
III. ECGVault Overview ECGVault: Dynamic Reports
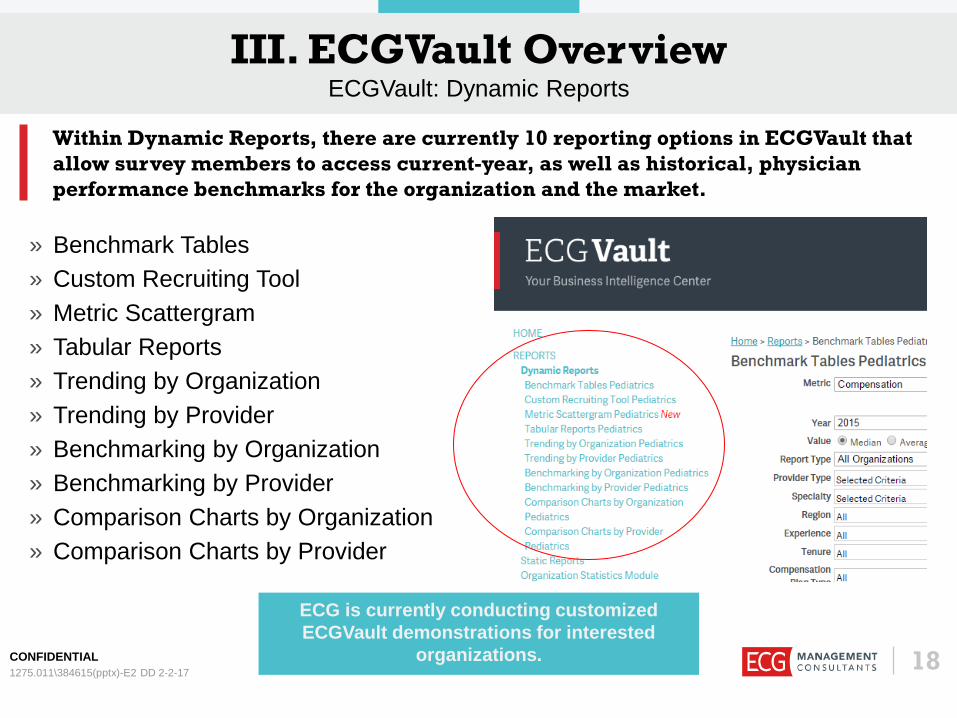
» Benchmark Tables » Custom Recruiting Tool » Metric Scattergram » Tabular Reports » Trending by Organization » Trending by Provider » Benchmarking by Organization » Benchmarking by Provider
» Comparison Charts by Organization » Comparison Charts by Provider
1275.011\384615(pptx)-E2 DD 2-2-17
ECG is currently conducting customized ECGVault demonstrations for interested
organizations.
Within Dynamic Reports, there are currently 10 reporting options in ECGVault that allow survey members to access current-year, as well as historical, physician performance benchmarks for the organization and the market.
18
CONFIDENTIAL
III. ECGVault Overview Reporting Criteria
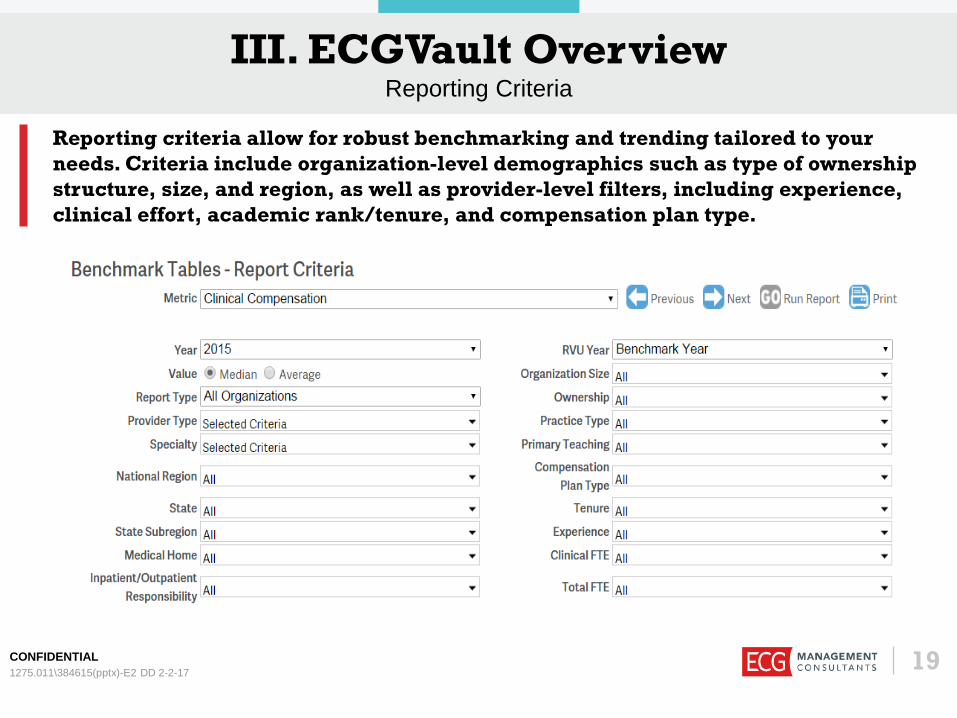
Reporting criteria allow for robust benchmarking and trending tailored to your needs. Criteria include organization-level demographics such as type of ownership structure, size, and region, as well as provider-level filters, including experience, clinical effort, academic rank/tenure, and compensation plan type.
19 1275.011\384615(pptx)-E2 DD 2-2-17
CONFIDENTIAL
III. ECGVault Overview Benchmarking by Organization
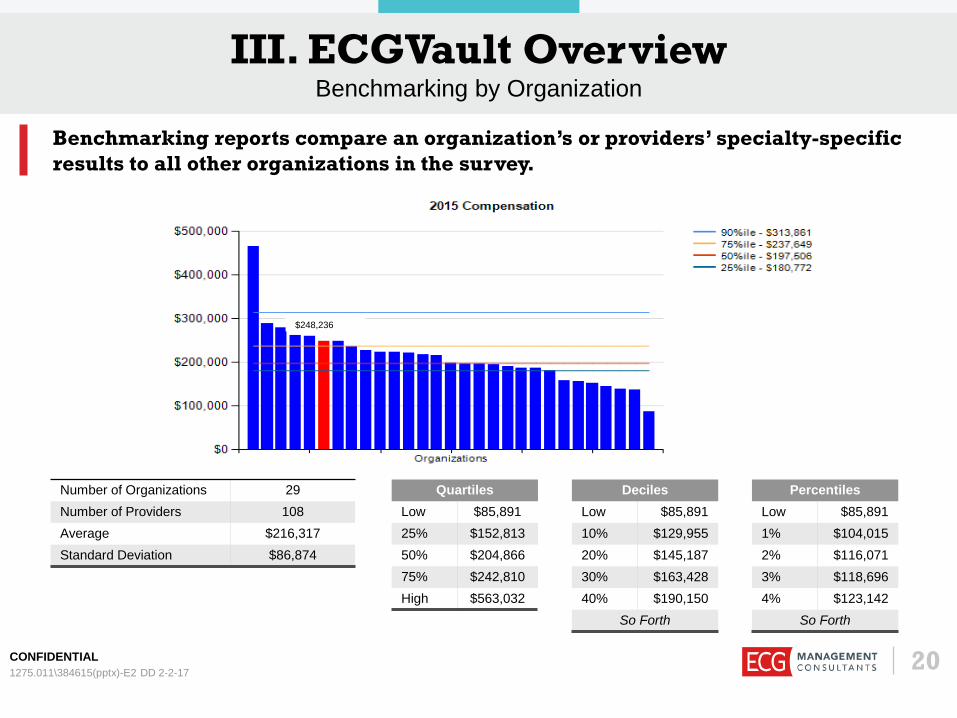
Number of Organizations 29 Number of Providers 108 Average $216,317 Standard Deviation $86,874
Quartiles Low $85,891 25% $152,813 50% $204,866 75% $242,810 High $563,032
Deciles Low $85,891 10% $129,955 20% $145,187 30% $163,428 40% $190,150
So Forth
Percentiles Low $85,891 1% $104,015 2% $116,071 3% $118,696 4% $123,142
So Forth
$248,236
Benchmarking reports compare an organization’s or providers’ specialty-specific results to all other organizations in the survey.
20 1275.011\384615(pptx)-E2 DD 2-2-17
CONFIDENTIAL
III. ECGVault Overview Comparison Charts
21
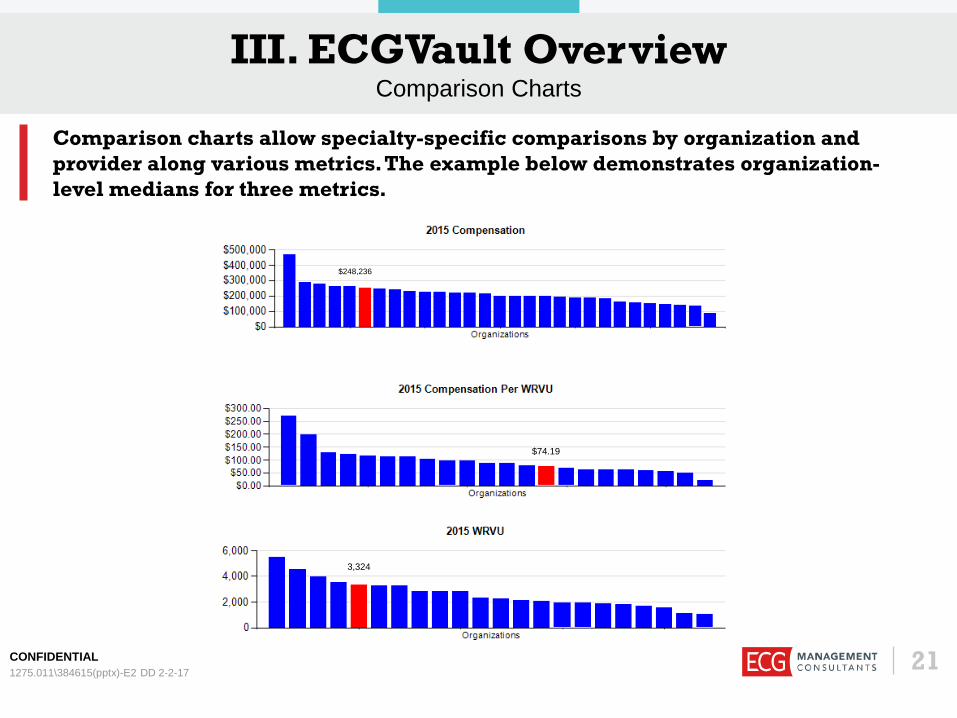
$248,236
$74.19
3,324
Comparison charts allow specialty-specific comparisons by organization and provider along various metrics. The example below demonstrates organization-level medians for three metrics.
1275.011\384615(pptx)-E2 DD 2-2-17
CONFIDENTIAL
III. ECGVault Overview Trending Reports by Organization
22
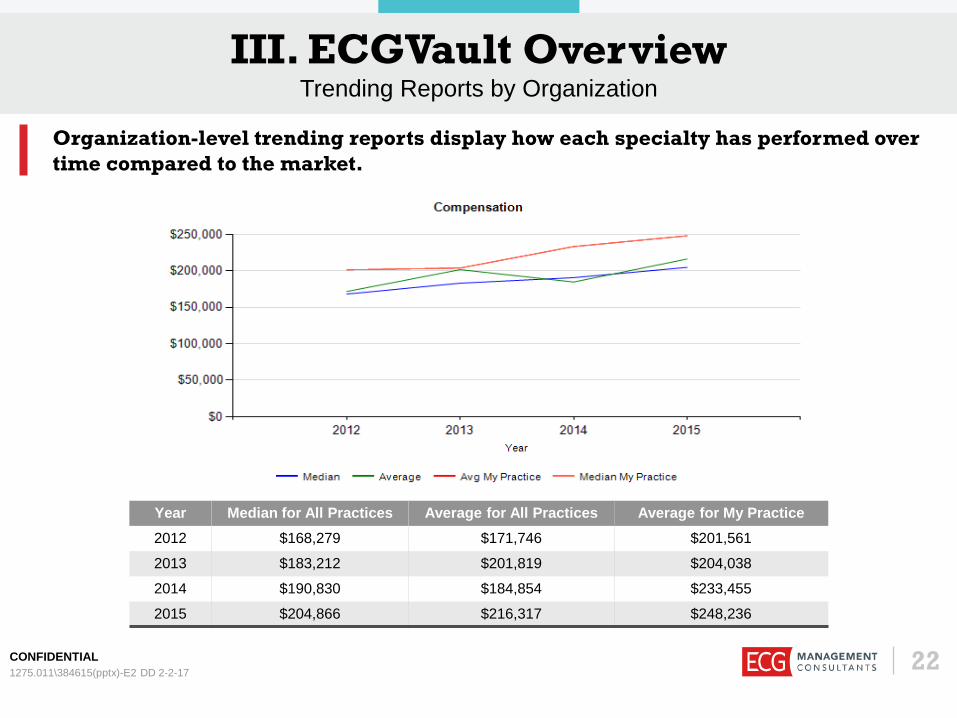
Year Median for All Practices Average for All Practices Average for My Practice 2012 $168,279 $171,746 $201,561
2013 $183,212 $201,819 $204,038
2014 $190,830 $184,854 $233,455
2015 $204,866 $216,317 $248,236
Organization-level trending reports display how each specialty has performed over time compared to the market.
1275.011\384615(pptx)-E2 DD 2-2-17
CONFIDENTIAL
III. ECGVault Overview Custom Recruiting Tool
23
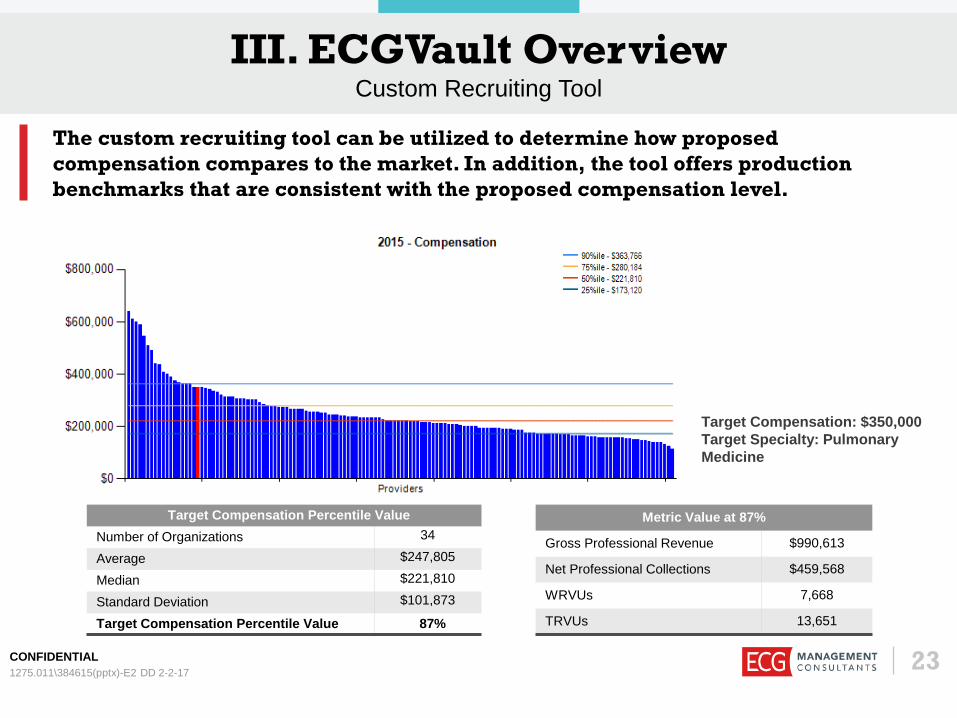
Target Compensation Percentile Value Number of Organizations 34
Average $247,805
Median $221,810
Standard Deviation $101,873
Target Compensation Percentile Value 87%
Metric Value at 87%
Gross Professional Revenue $990,613
Net Professional Collections $459,568
WRVUs 7,668
TRVUs 13,651
Target Compensation: $350,000 Target Specialty: Pulmonary Medicine
The custom recruiting tool can be utilized to determine how proposed compensation compares to the market. In addition, the tool offers production benchmarks that are consistent with the proposed compensation level.
1275.011\384615(pptx)-E2 DD 2-2-17
CONFIDENTIAL
III. ECGVault Overview Pediatric CPT Code Profiler
» Specialty Practice Profile Summary Reports — Identify variances in your physicians’ CPT code profiles compared to providers within your medical group and the market; key metrics include a summary of WRVU and TRVU productivity, the distribution of WRVUs among CPT code categories (i.e., E&M, medicine, ancillary, and surgery) and subcategories, and the average acuity of procedures
» Provider CPT Code Frequency Reports — Include reports for your providers, specialty, group of providers, and the market; data sets can be customized by procedure category and subcategory, place of service, inpatient/outpatient provider responsibilities, medical group demographics, and several other key practice differentiators; CPT code reports include procedure code ranking of frequency for market variance comparisons
» Provider CPT Code E&M Distribution Reports by Specialty — Include the isolation of E&M frequency for place of service, as well as provider and organization demographics
The Pediatric CPT Code Profiler is available to pediatric compensation survey members at a
discounted fee. Sample reports are shown in APPENDIX C.
The Pediatric CPT Code Profiler transforms provider-level CPT code data into meaningful information and analytics on practice profiles, top-performed CPT codes, and the distribution of evaluation and management (E&M) codes.
24 1275.011\384615(pptx)-E2 DD 2-2-17

CONFIDENTIAL
IV. 2017 Membership
25 1275.011\384615(pptx)-E2 DD 2-2-17
CONFIDENTIAL
IV. 2017 Membership Survey Timeline
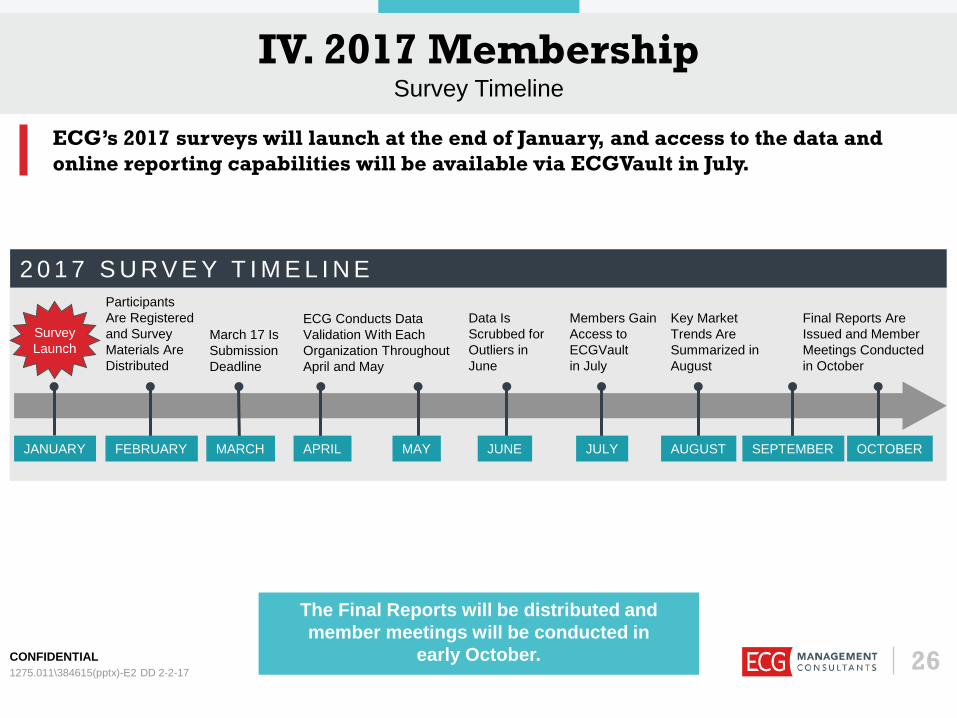
Participants Are Registered and Survey Materials Are Distributed
Survey Launch
March 17 Is Submission Deadline
ECG Conducts Data Validation With Each Organization Throughout April and May
Data Is Scrubbed for Outliers in June
Members Gain Access to ECGVault in July
Final Reports Are Issued and Member Meetings Conducted in October
Key Market Trends Are Summarized in August
2 0 1 7 S U R V E Y T I M E L I N E
ECG’s 2017 surveys will launch at the end of January, and access to the data and online reporting capabilities will be available via ECGVault in July.
The Final Reports will be distributed and member meetings will be conducted in
early October.
MARCH APRIL JUNE FEBRUARY SEPTEMBER AUGUST JULY MAY JANUARY
26 1275.011\384615(pptx)-E2 DD 2-2-17
OCTOBER
CONFIDENTIAL
IV. 2017 Membership Membership Fee
» The annual membership fee is all-inclusive and covers the cost of performing the survey.
» There is no additional cost to obtain/access the compensation and production survey reports available via ECGVault. › Unlimited users › Available 24/7 › Current and historical data accessible
» There is no additional fee: › To participate in the member meeting. › For most custom data requests.
Membership in ECG’s survey is typically $5,000 per year. This fee is waived for new organizations; thus, there is no cost for membership in the first year of participation.
27 1275.011\384615(pptx)-E2 DD 2-2-17
CONFIDENTIAL
IV. 2017 Membership Next Steps
28
We look forward to working with you during ECG’s 2017 Pediatric Subspecialty Physician Compensation Survey.
» Register — Register your organization for ECG’s 2017 Pediatric Subspecialty Physician Compensation Survey.
» Receive Welcome and Survey Materials — The 2017 survey materials will be distributed via email in February to registered organizations.
» Submit Data — Completed survey materials/data are due on March 17.
» Access Available Support — We work with each organization during the submission process and are available to answer any questions that may arise as you complete the survey.
MORE QUESTIONS
?
Please contact Angie Collins at 314-726-2323 or [email protected]. » Q&A session » Custom ECGVault
demonstration » Review of data
requirements
Online registration is currently open at http://www.ecgmc.com/services/finance/
industry-benchmarking/survey-registration. 1275.011\384615(pptx)-E2 DD 2-2-17

CONFIDENTIAL
Appendix A 2016 Survey Members
29 1275.011\384615(pptx)-E2 DD 2-2-17
CONFIDENTIAL
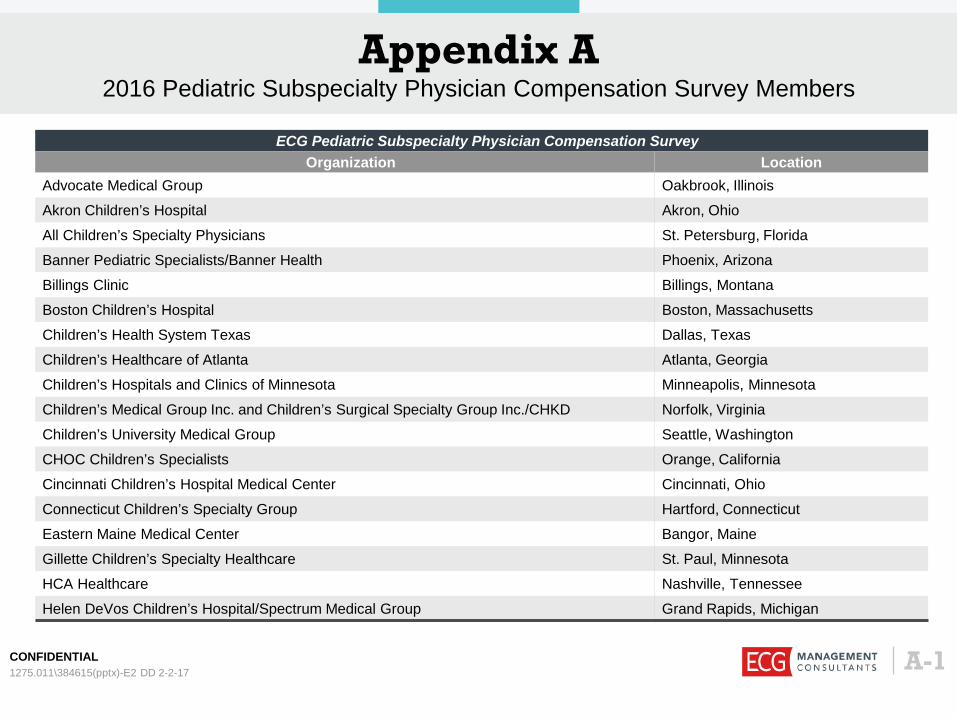
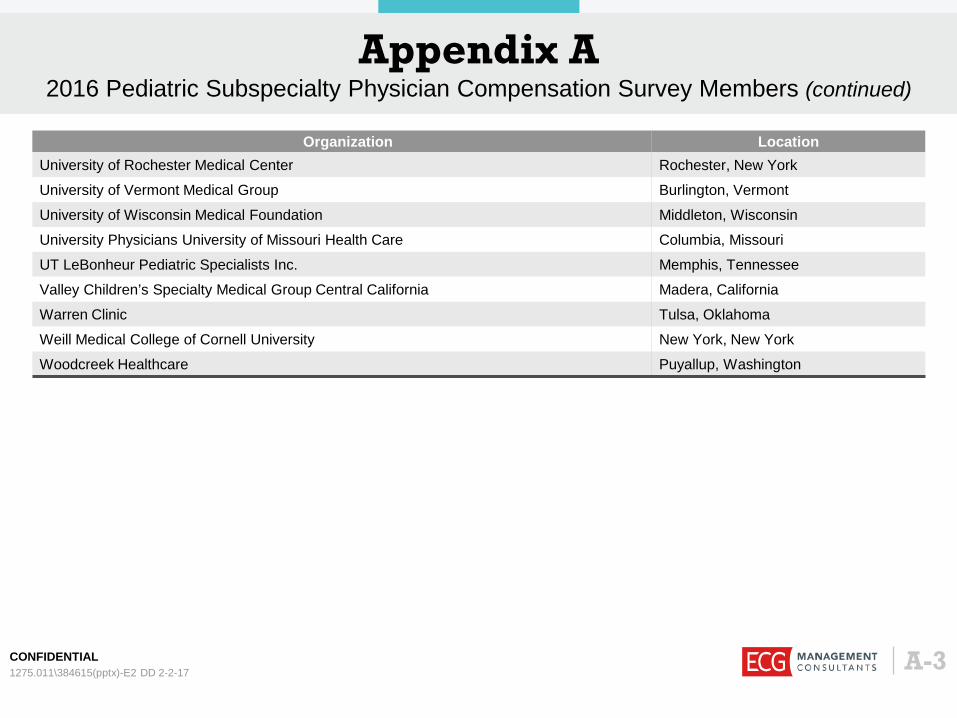
Appendix A 2016 Pediatric Subspecialty Physician Compensation Survey Members
A-1 1275.011\384615(pptx)-E2 DD 2-2-17
ECG Pediatric Subspecialty Physician Compensation Survey Organization Location
Advocate Medical Group Oakbrook, Illinois
Akron Children’s Hospital Akron, Ohio
All Children’s Specialty Physicians St. Petersburg, Florida
Banner Pediatric Specialists/Banner Health Phoenix, Arizona
Billings Clinic Billings, Montana
Boston Children’s Hospital Boston, Massachusetts
Children’s Health System Texas Dallas, Texas
Children’s Healthcare of Atlanta Atlanta, Georgia
Children’s Hospitals and Clinics of Minnesota Minneapolis, Minnesota
Children’s Medical Group Inc. and Children’s Surgical Specialty Group Inc./CHKD Norfolk, Virginia
Children’s University Medical Group Seattle, Washington
CHOC Children’s Specialists Orange, California
Cincinnati Children’s Hospital Medical Center Cincinnati, Ohio
Connecticut Children’s Specialty Group Hartford, Connecticut
Eastern Maine Medical Center Bangor, Maine
Gillette Children’s Specialty Healthcare St. Paul, Minnesota
HCA Healthcare Nashville, Tennessee
Helen DeVos Children’s Hospital/Spectrum Medical Group Grand Rapids, Michigan
CONFIDENTIAL
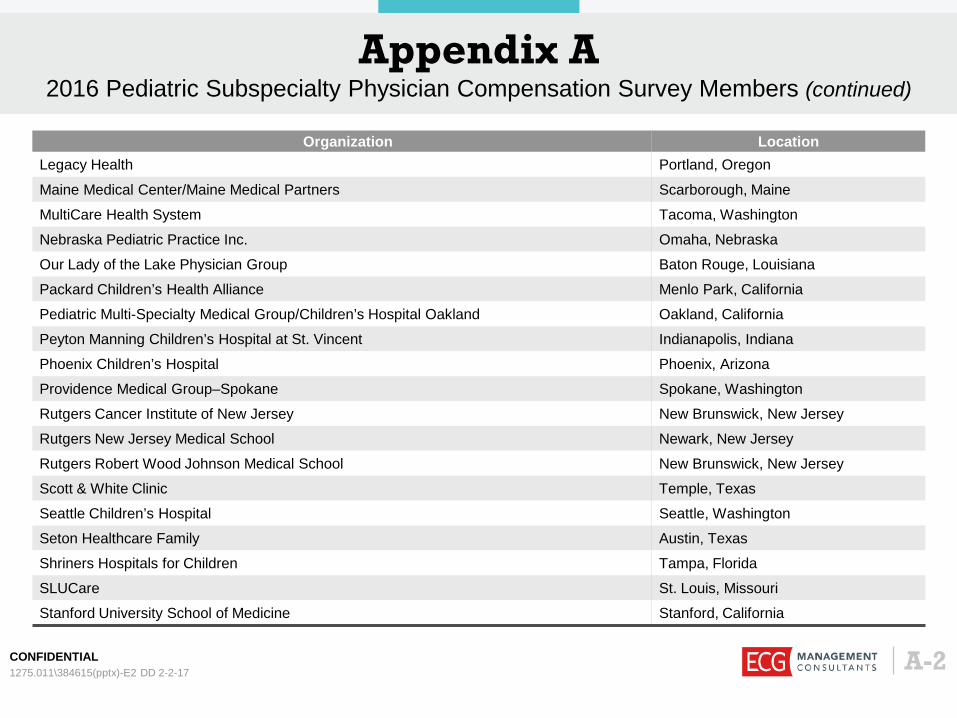
Appendix A 2016 Pediatric Subspecialty Physician Compensation Survey Members (continued)
A-2 1275.011\384615(pptx)-E2 DD 2-2-17
Organization Location Legacy Health Portland, Oregon
Maine Medical Center/Maine Medical Partners Scarborough, Maine
MultiCare Health System Tacoma, Washington
Nebraska Pediatric Practice Inc. Omaha, Nebraska
Our Lady of the Lake Physician Group Baton Rouge, Louisiana
Packard Children’s Health Alliance Menlo Park, California
Pediatric Multi-Specialty Medical Group/Children’s Hospital Oakland Oakland, California
Peyton Manning Children’s Hospital at St. Vincent Indianapolis, Indiana
Phoenix Children’s Hospital Phoenix, Arizona
Providence Medical Group–Spokane Spokane, Washington
Rutgers Cancer Institute of New Jersey New Brunswick, New Jersey
Rutgers New Jersey Medical School Newark, New Jersey
Rutgers Robert Wood Johnson Medical School New Brunswick, New Jersey
Scott & White Clinic Temple, Texas
Seattle Children’s Hospital Seattle, Washington
Seton Healthcare Family Austin, Texas
Shriners Hospitals for Children Tampa, Florida
SLUCare St. Louis, Missouri
Stanford University School of Medicine Stanford, California
CONFIDENTIAL
Appendix A 2016 Pediatric Subspecialty Physician Compensation Survey Members (continued)
A-3 1275.011\384615(pptx)-E2 DD 2-2-17
Organization Location University of Rochester Medical Center Rochester, New York
University of Vermont Medical Group Burlington, Vermont
University of Wisconsin Medical Foundation Middleton, Wisconsin
University Physicians University of Missouri Health Care Columbia, Missouri
UT LeBonheur Pediatric Specialists Inc. Memphis, Tennessee
Valley Children’s Specialty Medical Group Central California Madera, California
Warren Clinic Tulsa, Oklahoma
Weill Medical College of Cornell University New York, New York
Woodcreek Healthcare Puyallup, Washington
CONFIDENTIAL
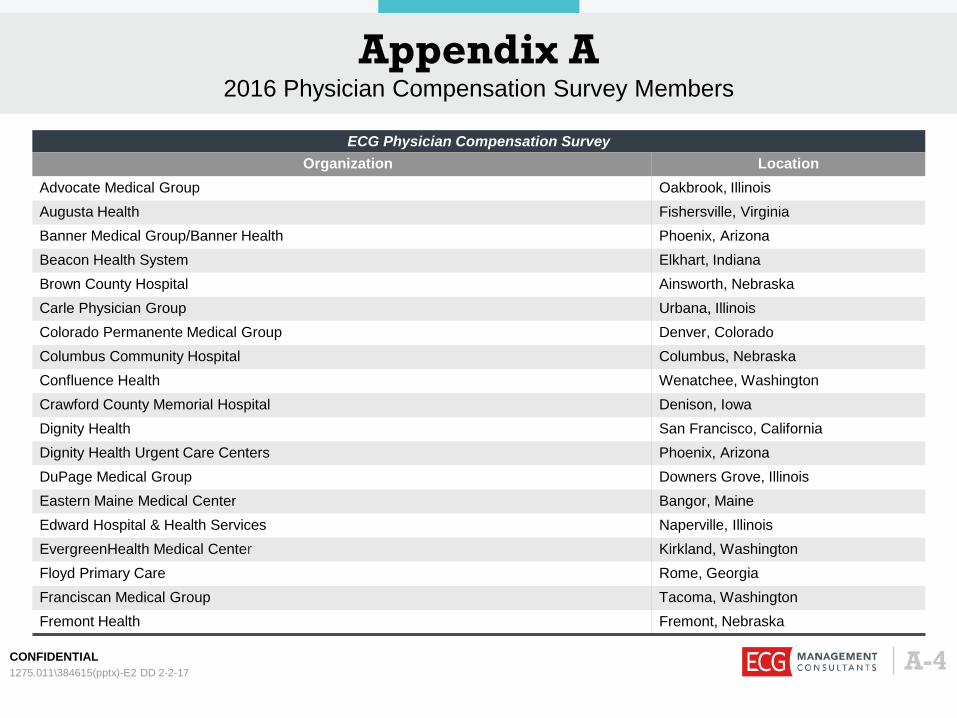
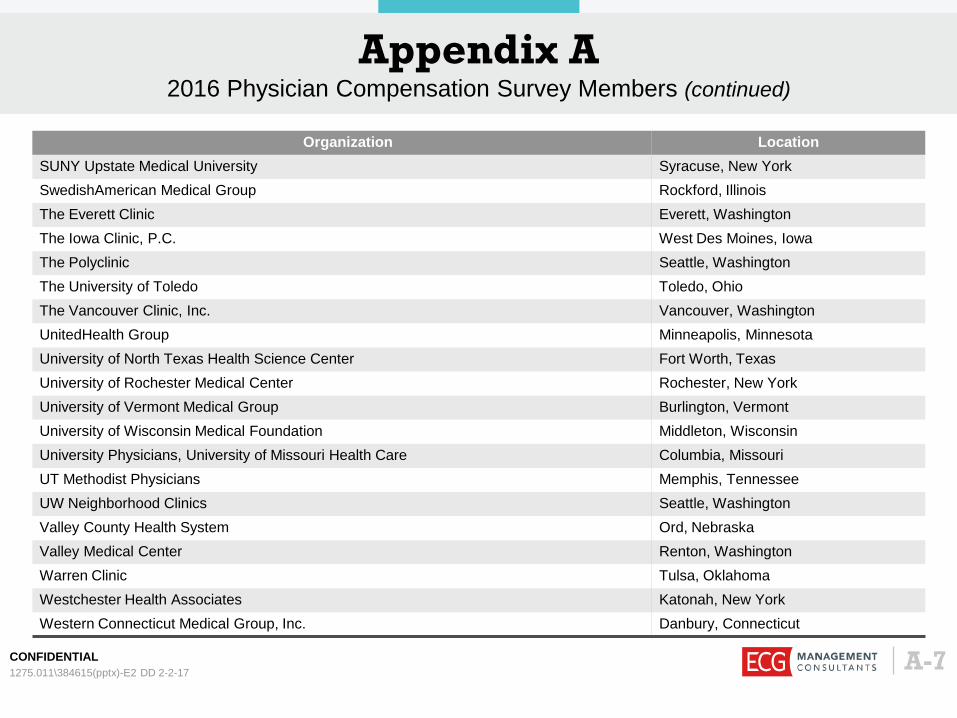
Appendix A 2016 Physician Compensation Survey Members
A-4 1275.011\384615(pptx)-E2 DD 2-2-17
ECG Physician Compensation Survey Organization Location
Advocate Medical Group Oakbrook, Illinois Augusta Health Fishersville, Virginia Banner Medical Group/Banner Health Phoenix, Arizona Beacon Health System Elkhart, Indiana Brown County Hospital Ainsworth, Nebraska Carle Physician Group Urbana, Illinois Colorado Permanente Medical Group Denver, Colorado Columbus Community Hospital Columbus, Nebraska Confluence Health Wenatchee, Washington Crawford County Memorial Hospital Denison, Iowa Dignity Health San Francisco, California Dignity Health Urgent Care Centers Phoenix, Arizona DuPage Medical Group Downers Grove, Illinois Eastern Maine Medical Center Bangor, Maine Edward Hospital & Health Services Naperville, Illinois EvergreenHealth Medical Center Kirkland, Washington Floyd Primary Care Rome, Georgia Franciscan Medical Group Tacoma, Washington Fremont Health Fremont, Nebraska
CONFIDENTIAL
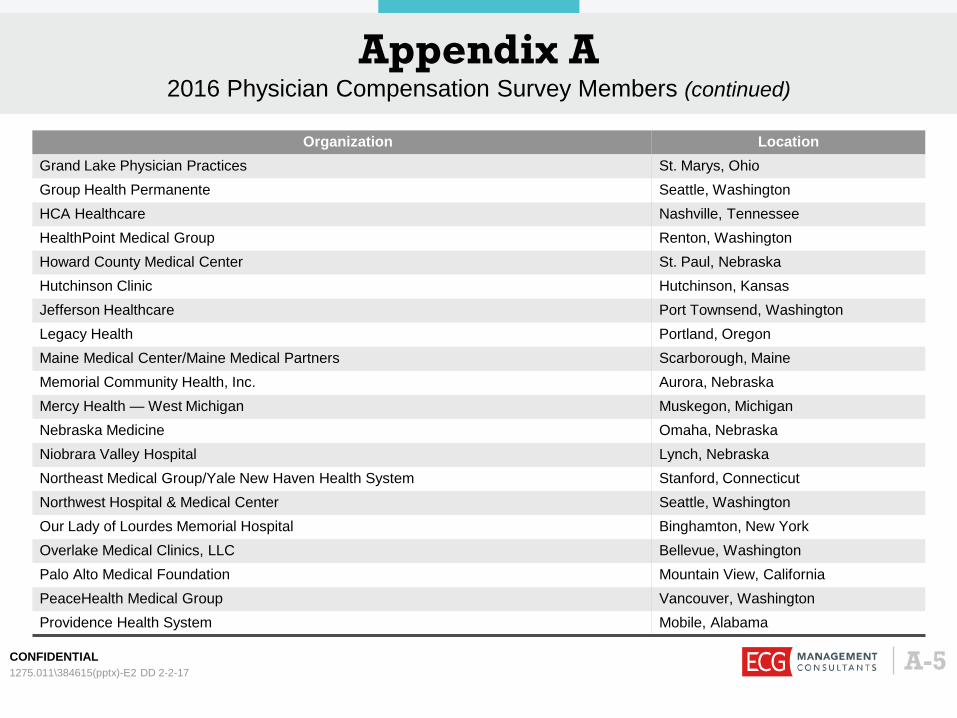
Appendix A 2016 Physician Compensation Survey Members (continued)
A-5 1275.011\384615(pptx)-E2 DD 2-2-17
Organization Location Grand Lake Physician Practices St. Marys, Ohio Group Health Permanente Seattle, Washington HCA Healthcare Nashville, Tennessee HealthPoint Medical Group Renton, Washington Howard County Medical Center St. Paul, Nebraska Hutchinson Clinic Hutchinson, Kansas Jefferson Healthcare Port Townsend, Washington Legacy Health Portland, Oregon Maine Medical Center/Maine Medical Partners Scarborough, Maine Memorial Community Health, Inc. Aurora, Nebraska Mercy Health — West Michigan Muskegon, Michigan Nebraska Medicine Omaha, Nebraska Niobrara Valley Hospital Lynch, Nebraska Northeast Medical Group/Yale New Haven Health System Stanford, Connecticut Northwest Hospital & Medical Center Seattle, Washington Our Lady of Lourdes Memorial Hospital Binghamton, New York Overlake Medical Clinics, LLC Bellevue, Washington Palo Alto Medical Foundation Mountain View, California PeaceHealth Medical Group Vancouver, Washington Providence Health System Mobile, Alabama
CONFIDENTIAL
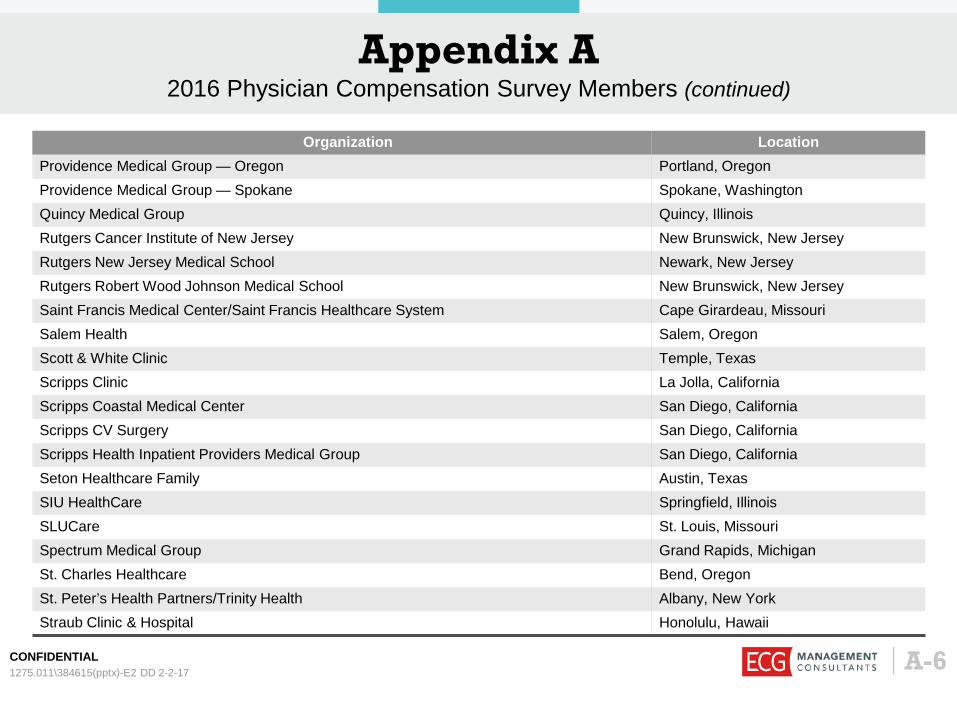
Appendix A 2016 Physician Compensation Survey Members (continued)
A-6 1275.011\384615(pptx)-E2 DD 2-2-17
Organization Location Providence Medical Group — Oregon Portland, Oregon Providence Medical Group — Spokane Spokane, Washington Quincy Medical Group Quincy, Illinois Rutgers Cancer Institute of New Jersey New Brunswick, New Jersey Rutgers New Jersey Medical School Newark, New Jersey Rutgers Robert Wood Johnson Medical School New Brunswick, New Jersey Saint Francis Medical Center/Saint Francis Healthcare System Cape Girardeau, Missouri Salem Health Salem, Oregon Scott & White Clinic Temple, Texas Scripps Clinic La Jolla, California Scripps Coastal Medical Center San Diego, California Scripps CV Surgery San Diego, California Scripps Health Inpatient Providers Medical Group San Diego, California Seton Healthcare Family Austin, Texas SIU HealthCare Springfield, Illinois SLUCare St. Louis, Missouri Spectrum Medical Group Grand Rapids, Michigan St. Charles Healthcare Bend, Oregon St. Peter’s Health Partners/Trinity Health Albany, New York Straub Clinic & Hospital Honolulu, Hawaii
CONFIDENTIAL
Appendix A 2016 Physician Compensation Survey Members (continued)
A-7 1275.011\384615(pptx)-E2 DD 2-2-17
Organization Location SUNY Upstate Medical University Syracuse, New York SwedishAmerican Medical Group Rockford, Illinois The Everett Clinic Everett, Washington The Iowa Clinic, P.C. West Des Moines, Iowa The Polyclinic Seattle, Washington The University of Toledo Toledo, Ohio The Vancouver Clinic, Inc. Vancouver, Washington UnitedHealth Group Minneapolis, Minnesota University of North Texas Health Science Center Fort Worth, Texas University of Rochester Medical Center Rochester, New York University of Vermont Medical Group Burlington, Vermont University of Wisconsin Medical Foundation Middleton, Wisconsin University Physicians, University of Missouri Health Care Columbia, Missouri UT Methodist Physicians Memphis, Tennessee UW Neighborhood Clinics Seattle, Washington Valley County Health System Ord, Nebraska Valley Medical Center Renton, Washington Warren Clinic Tulsa, Oklahoma Westchester Health Associates Katonah, New York Western Connecticut Medical Group, Inc. Danbury, Connecticut
CONFIDENTIAL
Appendix B 2016 Reported Specialties
37 1275.011\384615(pptx)-E2 DD 2-2-17
CONFIDENTIAL
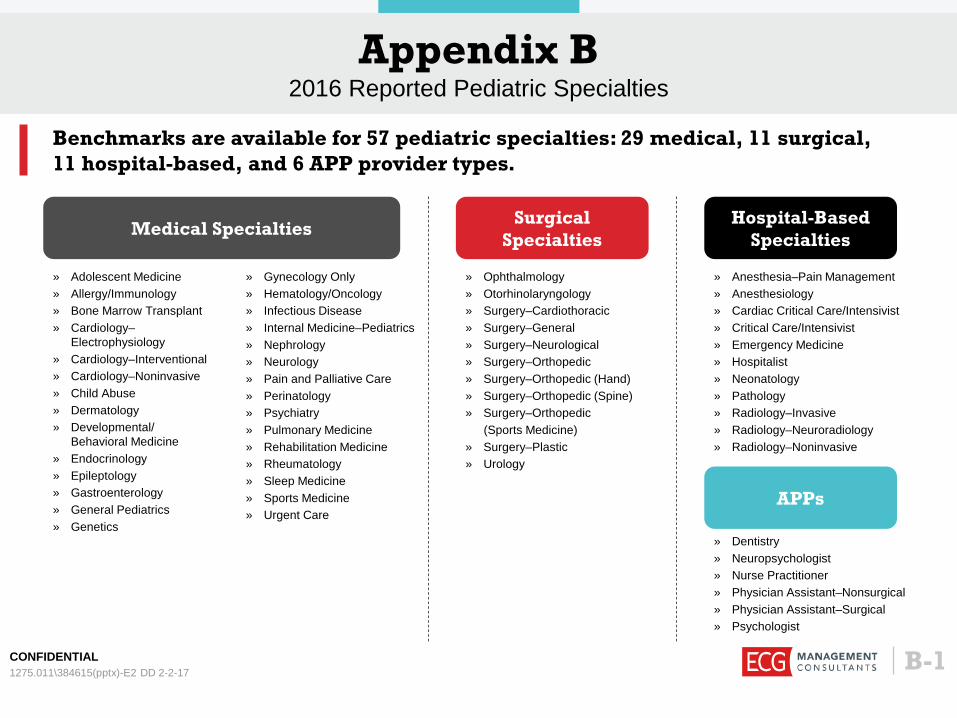
Appendix B 2016 Reported Pediatric Specialties
Medical Specialties Surgical Specialties
Hospital-Based Specialties
» Adolescent Medicine » Allergy/Immunology » Bone Marrow Transplant » Cardiology–
Electrophysiology » Cardiology–Interventional » Cardiology–Noninvasive » Child Abuse » Dermatology » Developmental/
Behavioral Medicine » Endocrinology » Epileptology » Gastroenterology » General Pediatrics » Genetics
» Ophthalmology » Otorhinolaryngology » Surgery–Cardiothoracic » Surgery–General » Surgery–Neurological » Surgery–Orthopedic » Surgery–Orthopedic (Hand) » Surgery–Orthopedic (Spine) » Surgery–Orthopedic
(Sports Medicine) » Surgery–Plastic » Urology
» Anesthesia–Pain Management » Anesthesiology » Cardiac Critical Care/Intensivist » Critical Care/Intensivist » Emergency Medicine » Hospitalist » Neonatology » Pathology » Radiology–Invasive » Radiology–Neuroradiology » Radiology–Noninvasive
APPs
» Dentistry » Neuropsychologist » Nurse Practitioner » Physician Assistant–Nonsurgical » Physician Assistant–Surgical » Psychologist
» Gynecology Only » Hematology/Oncology » Infectious Disease » Internal Medicine–Pediatrics » Nephrology » Neurology » Pain and Palliative Care » Perinatology » Psychiatry » Pulmonary Medicine » Rehabilitation Medicine » Rheumatology » Sleep Medicine » Sports Medicine » Urgent Care
B-1 1275.011\384615(pptx)-E2 DD 2-2-17
Benchmarks are available for 57 pediatric specialties: 29 medical, 11 surgical, 11 hospital-based, and 6 APP provider types.
CONFIDENTIAL
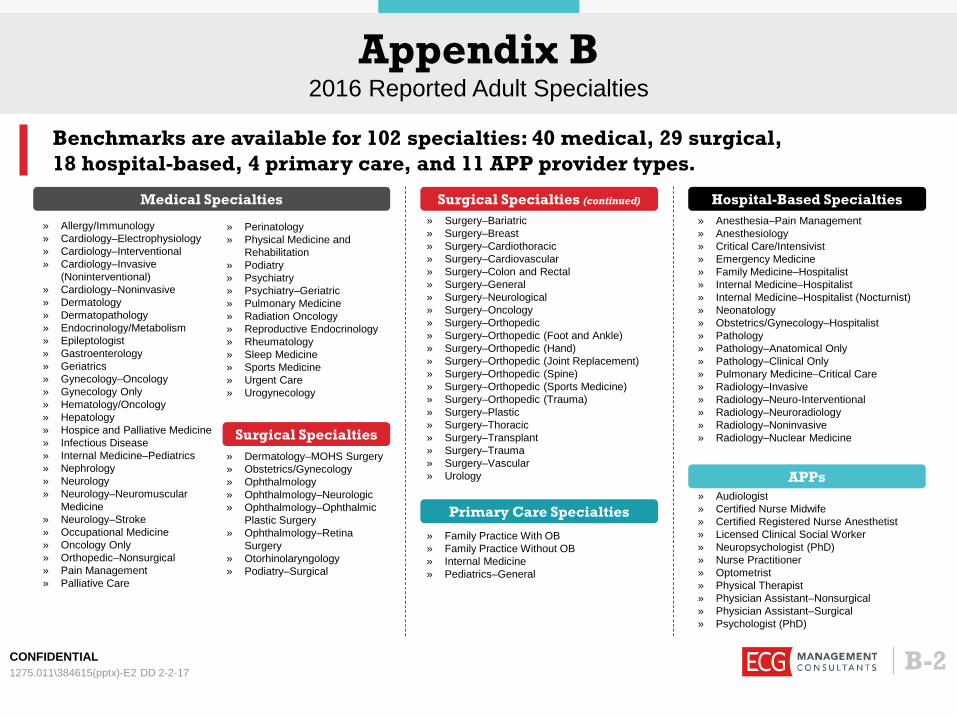
Appendix B 2016 Reported Adult Specialties
Medical Specialties
Surgical Specialties
Hospital-Based Specialties
» Allergy/Immunology » Cardiology–Electrophysiology » Cardiology–Interventional » Cardiology–Invasive
(Noninterventional) » Cardiology–Noninvasive » Dermatology » Dermatopathology » Endocrinology/Metabolism » Epileptologist » Gastroenterology » Geriatrics » Gynecology–Oncology » Gynecology Only » Hematology/Oncology » Hepatology » Hospice and Palliative Medicine » Infectious Disease » Internal Medicine–Pediatrics » Nephrology » Neurology » Neurology–Neuromuscular
Medicine » Neurology–Stroke » Occupational Medicine » Oncology Only » Orthopedic–Nonsurgical » Pain Management » Palliative Care
» Surgery–Bariatric » Surgery–Breast » Surgery–Cardiothoracic » Surgery–Cardiovascular » Surgery–Colon and Rectal » Surgery–General » Surgery–Neurological » Surgery–Oncology » Surgery–Orthopedic » Surgery–Orthopedic (Foot and Ankle) » Surgery–Orthopedic (Hand) » Surgery–Orthopedic (Joint Replacement) » Surgery–Orthopedic (Spine) » Surgery–Orthopedic (Sports Medicine) » Surgery–Orthopedic (Trauma) » Surgery–Plastic » Surgery–Thoracic » Surgery–Transplant » Surgery–Trauma » Surgery–Vascular » Urology
» Family Practice With OB » Family Practice Without OB » Internal Medicine » Pediatrics–General
» Anesthesia–Pain Management » Anesthesiology » Critical Care/Intensivist » Emergency Medicine » Family Medicine–Hospitalist » Internal Medicine–Hospitalist » Internal Medicine–Hospitalist (Nocturnist) » Neonatology » Obstetrics/Gynecology–Hospitalist » Pathology » Pathology–Anatomical Only » Pathology–Clinical Only » Pulmonary Medicine–Critical Care » Radiology–Invasive » Radiology–Neuro-Interventional » Radiology–Neuroradiology » Radiology–Noninvasive » Radiology–Nuclear Medicine
APPs » Audiologist » Certified Nurse Midwife » Certified Registered Nurse Anesthetist » Licensed Clinical Social Worker » Neuropsychologist (PhD) » Nurse Practitioner » Optometrist » Physical Therapist » Physician Assistant–Nonsurgical » Physician Assistant–Surgical » Psychologist (PhD)
» Perinatology » Physical Medicine and
Rehabilitation » Podiatry » Psychiatry » Psychiatry–Geriatric » Pulmonary Medicine » Radiation Oncology » Reproductive Endocrinology » Rheumatology » Sleep Medicine » Sports Medicine » Urgent Care » Urogynecology
» Dermatology–MOHS Surgery » Obstetrics/Gynecology » Ophthalmology » Ophthalmology–Neurologic » Ophthalmology–Ophthalmic
Plastic Surgery » Ophthalmology–Retina
Surgery » Otorhinolaryngology » Podiatry–Surgical
Primary Care Specialties
B-2
Surgical Specialties (continued)
1275.011\384615(pptx)-E2 DD 2-2-17
Benchmarks are available for 102 specialties: 40 medical, 29 surgical, 18 hospital-based, 4 primary care, and 11 APP provider types.
CONFIDENTIAL
Appendix C Sample Pediatric CPT Code Profiler Reports
40 1275.011\384615(pptx)-E2 DD 2-2-17
CONFIDENTIAL
Appendix C Sample Pediatric CPT Code Profiler Reports — Report Criteria
C-1
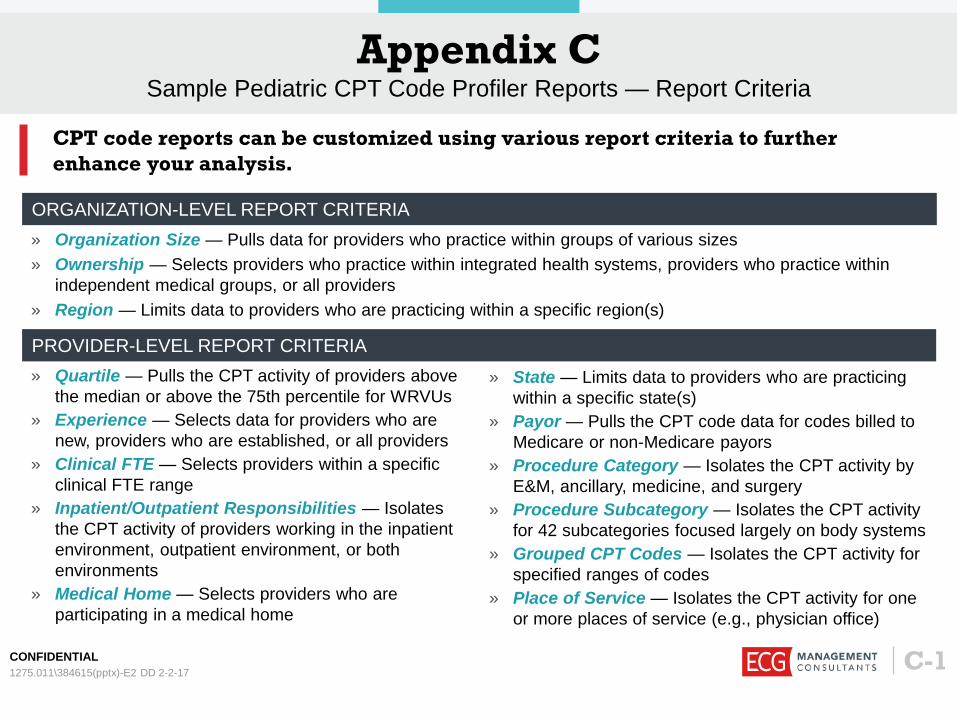
» Organization Size — Pulls data for providers who practice within groups of various sizes » Ownership — Selects providers who practice within integrated health systems, providers who practice within
independent medical groups, or all providers » Region — Limits data to providers who are practicing within a specific region(s)
» Quartile — Pulls the CPT activity of providers above the median or above the 75th percentile for WRVUs
» Experience — Selects data for providers who are new, providers who are established, or all providers
» Clinical FTE — Selects providers within a specific clinical FTE range
» Inpatient/Outpatient Responsibilities — Isolates the CPT activity of providers working in the inpatient environment, outpatient environment, or both environments
» Medical Home — Selects providers who are participating in a medical home
» State — Limits data to providers who are practicing within a specific state(s)
» Payor — Pulls the CPT code data for codes billed to Medicare or non-Medicare payors
» Procedure Category — Isolates the CPT activity by E&M, ancillary, medicine, and surgery
» Procedure Subcategory — Isolates the CPT activity for 42 subcategories focused largely on body systems
» Grouped CPT Codes — Isolates the CPT activity for specified ranges of codes
» Place of Service — Isolates the CPT activity for one or more places of service (e.g., physician office)
ORGANIZATION-LEVEL REPORT CRITERIA
PROVIDER-LEVEL REPORT CRITERIA
CPT code reports can be customized using various report criteria to further enhance your analysis.
1275.011\384615(pptx)-E2 DD 2-2-17
CONFIDENTIAL
Appendix C Sample Pediatric CPT Code Profiler Reports — Practice Profile Report
C-2
0500
1,0001,5002,0002,500
Ancillary E&M Medicine Surgery
Aver
age
Annu
al
Cou
nt o
f Pr
oced
ures
Per
Pr
ovid
er
Market My Org
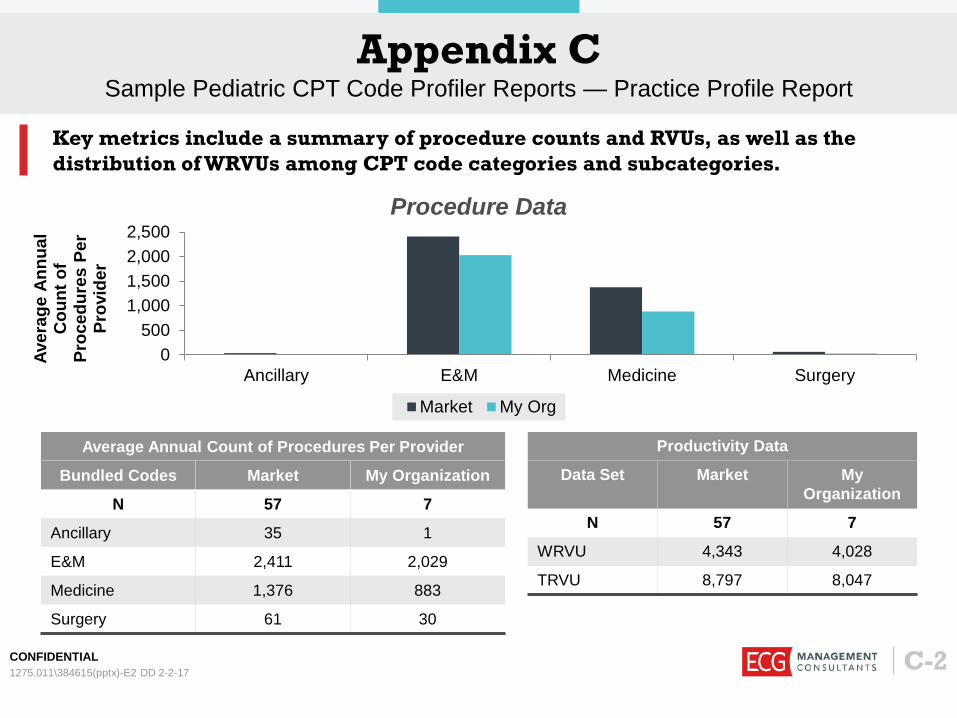
Average Annual Count of Procedures Per Provider
Bundled Codes Market My Organization
N 57 7
Ancillary 35 1
E&M 2,411 2,029
Medicine 1,376 883
Surgery 61 30
Productivity Data
Data Set Market My Organization
N 57 7
WRVU 4,343 4,028
TRVU 8,797 8,047
Procedure Data
Key metrics include a summary of procedure counts and RVUs, as well as the distribution of WRVUs among CPT code categories and subcategories.
1275.011\384615(pptx)-E2 DD 2-2-17
CONFIDENTIAL
Appendix C Sample Pediatric CPT Code Profiler Reports — Practice Profile Report (continued)
C-3
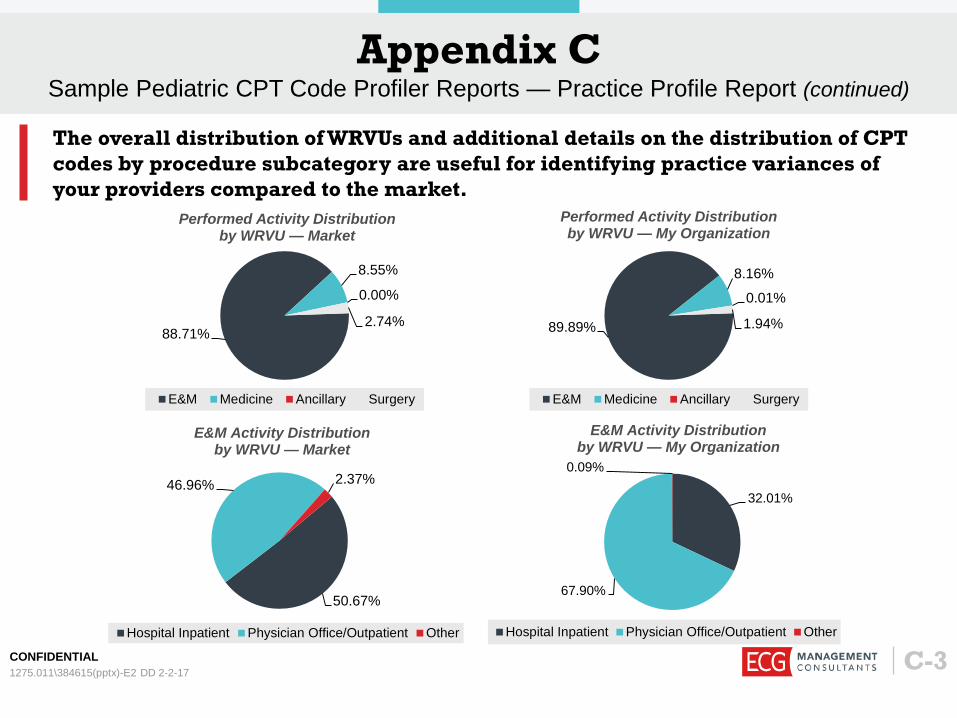
88.71%
8.55%
0.00%
2.74%
Performed Activity Distribution by WRVU — Market
E&M Medicine Ancillary Surgery
89.89%
8.16%
0.01%
1.94%
Performed Activity Distribution by WRVU — My Organization
E&M Medicine Ancillary Surgery
50.67%
46.96% 2.37%
E&M Activity Distribution by WRVU — Market
Hospital Inpatient Physician Office/Outpatient Other
32.01%
67.90%
0.09%
E&M Activity Distribution by WRVU — My Organization
Hospital Inpatient Physician Office/Outpatient Other
The overall distribution of WRVUs and additional details on the distribution of CPT codes by procedure subcategory are useful for identifying practice variances of your providers compared to the market.
1275.011\384615(pptx)-E2 DD 2-2-17
CONFIDENTIAL
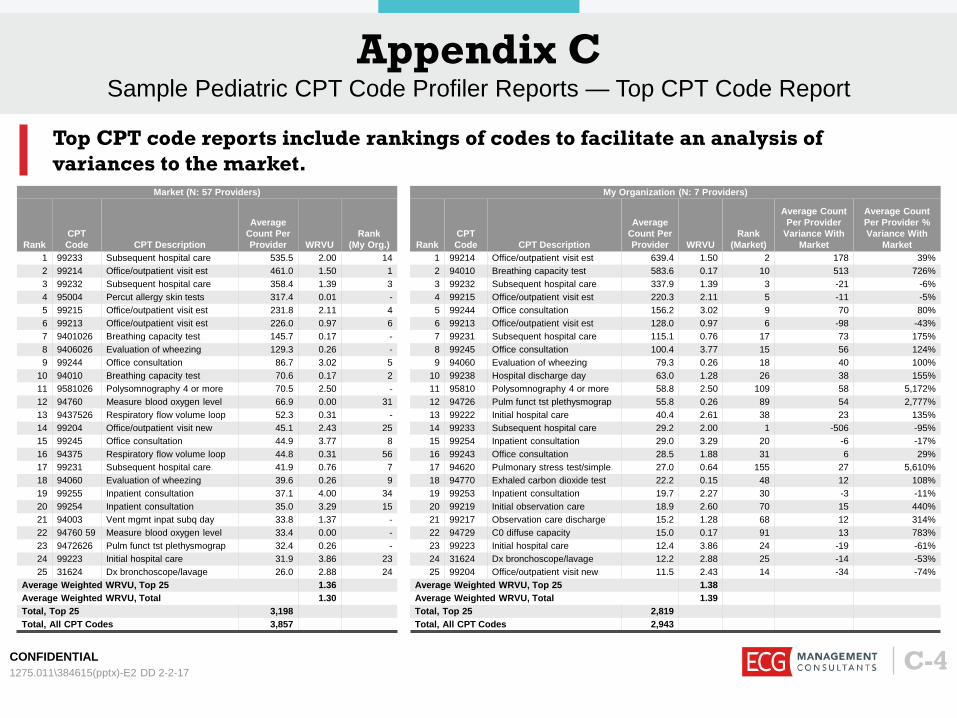
Appendix C Sample Pediatric CPT Code Profiler Reports — Top CPT Code Report
C-4
Market (N: 57 Providers) My Organization (N: 7 Providers)
Rank CPT Code CPT Description
Average Count Per Provider WRVU
Rank (My Org.) Rank
CPT Code CPT Description
Average Count Per Provider WRVU
Rank (Market)
Average Count Per Provider
Variance With Market
Average Count Per Provider % Variance With
Market 1 99233 Subsequent hospital care 535.5 2.00 14 1 99214 Office/outpatient visit est 639.4 1.50 2 178 39% 2 99214 Office/outpatient visit est 461.0 1.50 1 2 94010 Breathing capacity test 583.6 0.17 10 513 726% 3 99232 Subsequent hospital care 358.4 1.39 3 3 99232 Subsequent hospital care 337.9 1.39 3 -21 -6% 4 95004 Percut allergy skin tests 317.4 0.01 - 4 99215 Office/outpatient visit est 220.3 2.11 5 -11 -5% 5 99215 Office/outpatient visit est 231.8 2.11 4 5 99244 Office consultation 156.2 3.02 9 70 80% 6 99213 Office/outpatient visit est 226.0 0.97 6 6 99213 Office/outpatient visit est 128.0 0.97 6 -98 -43% 7 9401026 Breathing capacity test 145.7 0.17 - 7 99231 Subsequent hospital care 115.1 0.76 17 73 175% 8 9406026 Evaluation of wheezing 129.3 0.26 - 8 99245 Office consultation 100.4 3.77 15 56 124% 9 99244 Office consultation 86.7 3.02 5 9 94060 Evaluation of wheezing 79.3 0.26 18 40 100%
10 94010 Breathing capacity test 70.6 0.17 2 10 99238 Hospital discharge day 63.0 1.28 26 38 155% 11 9581026 Polysomnography 4 or more 70.5 2.50 - 11 95810 Polysomnography 4 or more 58.8 2.50 109 58 5,172% 12 94760 Measure blood oxygen level 66.9 0.00 31 12 94726 Pulm funct tst plethysmograp 55.8 0.26 89 54 2,777% 13 9437526 Respiratory flow volume loop 52.3 0.31 - 13 99222 Initial hospital care 40.4 2.61 38 23 135% 14 99204 Office/outpatient visit new 45.1 2.43 25 14 99233 Subsequent hospital care 29.2 2.00 1 -506 -95% 15 99245 Office consultation 44.9 3.77 8 15 99254 Inpatient consultation 29.0 3.29 20 -6 -17% 16 94375 Respiratory flow volume loop 44.8 0.31 56 16 99243 Office consultation 28.5 1.88 31 6 29% 17 99231 Subsequent hospital care 41.9 0.76 7 17 94620 Pulmonary stress test/simple 27.0 0.64 155 27 5,610% 18 94060 Evaluation of wheezing 39.6 0.26 9 18 94770 Exhaled carbon dioxide test 22.2 0.15 48 12 108% 19 99255 Inpatient consultation 37.1 4.00 34 19 99253 Inpatient consultation 19.7 2.27 30 -3 -11% 20 99254 Inpatient consultation 35.0 3.29 15 20 99219 Initial observation care 18.9 2.60 70 15 440% 21 94003 Vent mgmt inpat subq day 33.8 1.37 - 21 99217 Observation care discharge 15.2 1.28 68 12 314% 22 94760 59 Measure blood oxygen level 33.4 0.00 - 22 94729 C0 diffuse capacity 15.0 0.17 91 13 783% 23 9472626 Pulm funct tst plethysmograp 32.4 0.26 - 23 99223 Initial hospital care 12.4 3.86 24 -19 -61% 24 99223 Initial hospital care 31.9 3.86 23 24 31624 Dx bronchoscope/lavage 12.2 2.88 25 -14 -53% 25 31624 Dx bronchoscope/lavage 26.0 2.88 24 25 99204 Office/outpatient visit new 11.5 2.43 14 -34 -74%
Average Weighted WRVU, Top 25 1.36 Average Weighted WRVU, Top 25 1.38 Average Weighted WRVU, Total 1.30 Average Weighted WRVU, Total 1.39 Total, Top 25 3,198 Total, Top 25 2,819 Total, All CPT Codes 3,857 Total, All CPT Codes 2,943
Top CPT code reports include rankings of codes to facilitate an analysis of variances to the market.
1275.011\384615(pptx)-E2 DD 2-2-17
CONFIDENTIAL
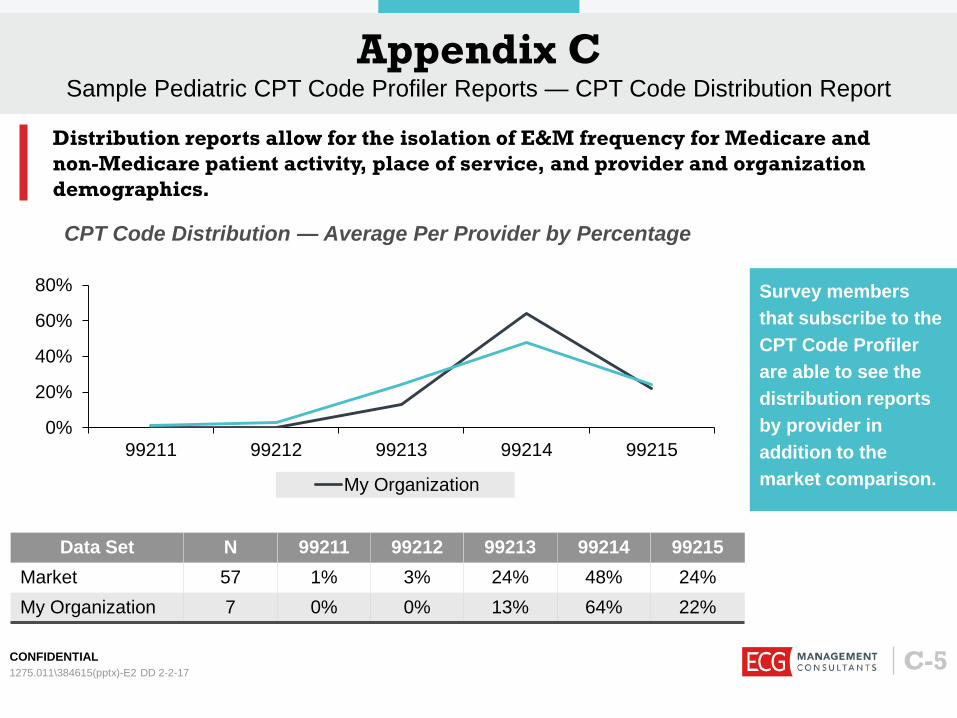
Appendix C Sample Pediatric CPT Code Profiler Reports — CPT Code Distribution Report
C-5
0%
20%
40%
60%
80%
99211 99212 99213 99214 99215
My Organization
Data Set N 99211 99212 99213 99214 99215 Market 57 1% 3% 24% 48% 24% My Organization 7 0% 0% 13% 64% 22%
CPT Code Distribution — Average Per Provider by Percentage
Distribution reports allow for the isolation of E&M frequency for Medicare and non-Medicare patient activity, place of service, and provider and organization demographics.
Survey members that subscribe to the CPT Code Profiler are able to see the distribution reports by provider in addition to the market comparison.
1275.011\384615(pptx)-E2 DD 2-2-17


![Medulloblastoma: [Print] - eMedicine Neurology · emedicine.medscape.com eMedicine Specialties > Neurology > Pediatric Neurology Medulloblastoma George I Jallo, MD, Associate Professor](https://img.pdfslide.net/doc/110x75/5d472c3c88c993527c8b60e5/medulloblastoma-print-emedicine-neurology-emedicinemedscapecom-emedicine.jpg)