Embed Size (px)
Citation preview
USE INFORMATION AND AIR MONITORING RECOMMENDATIONS FOR THE PESTICIDE ACTIVE
INGREDIENT DICOFOL
May 2008
By Shifang Fan
Environmental Scientist
STATE OF CALIFORNIA Environmental Protection Agency
Department of Pesticide Regulation Environmental Monitoring Branch
1001 I Street Sacramento, California, 95814
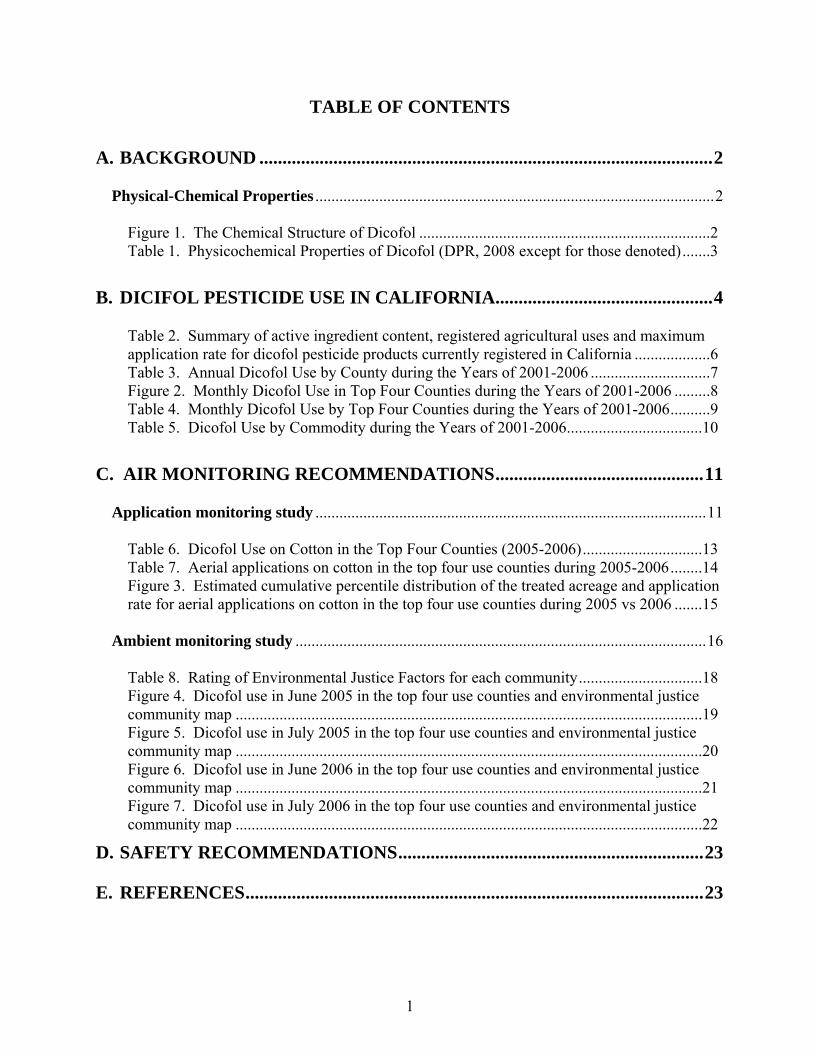
TABLE OF CONTENTS
A. BACKGROUND ..................................................................................................2
Physical-Chemical Properties ....................................................................................................2
Figure 1. The Chemical Structure of Dicofol .........................................................................2 Table 1. Physicochemical Properties of Dicofol (DPR, 2008 except for those denoted).......3
B. DICIFOL PESTICIDE USE IN CALIFORNIA...............................................4
Table 2. Summary of active ingredient content, registered agricultural uses and maximum application rate for dicofol pesticide products currently registered in California ...................6 Table 3. Annual Dicofol Use by County during the Years of 2001-2006 ..............................7 Figure 2. Monthly Dicofol Use in Top Four Counties during the Years of 2001-2006 .........8 Table 4. Monthly Dicofol Use by Top Four Counties during the Years of 2001-2006..........9 Table 5. Dicofol Use by Commodity during the Years of 2001-2006..................................10
C. AIR MONITORING RECOMMENDATIONS.............................................11
Application monitoring study ..................................................................................................11
Table 6. Dicofol Use on Cotton in the Top Four Counties (2005-2006)..............................13 Table 7. Aerial applications on cotton in the top four use counties during 2005-2006........14 Figure 3. Estimated cumulative percentile distribution of the treated acreage and application rate for aerial applications on cotton in the top four use counties during 2005 vs 2006 .......15
Ambient monitoring study .......................................................................................................16
Table 8. Rating of Environmental Justice Factors for each community...............................18 Figure 4. Dicofol use in June 2005 in the top four use counties and environmental justice community map .....................................................................................................................19 Figure 5. Dicofol use in July 2005 in the top four use counties and environmental justice community map .....................................................................................................................20 Figure 6. Dicofol use in June 2006 in the top four use counties and environmental justice community map .....................................................................................................................21 Figure 7. Dicofol use in July 2006 in the top four use counties and environmental justice community map .....................................................................................................................22
D. SAFETY RECOMMENDATIONS..................................................................23
E. REFERENCES...................................................................................................23
1
USE INFORMATION AND AIR MONITORING RECOMMENDATIONS FOR THE PESTICIDE ACTIVE INGREDIENT
DICOFOL
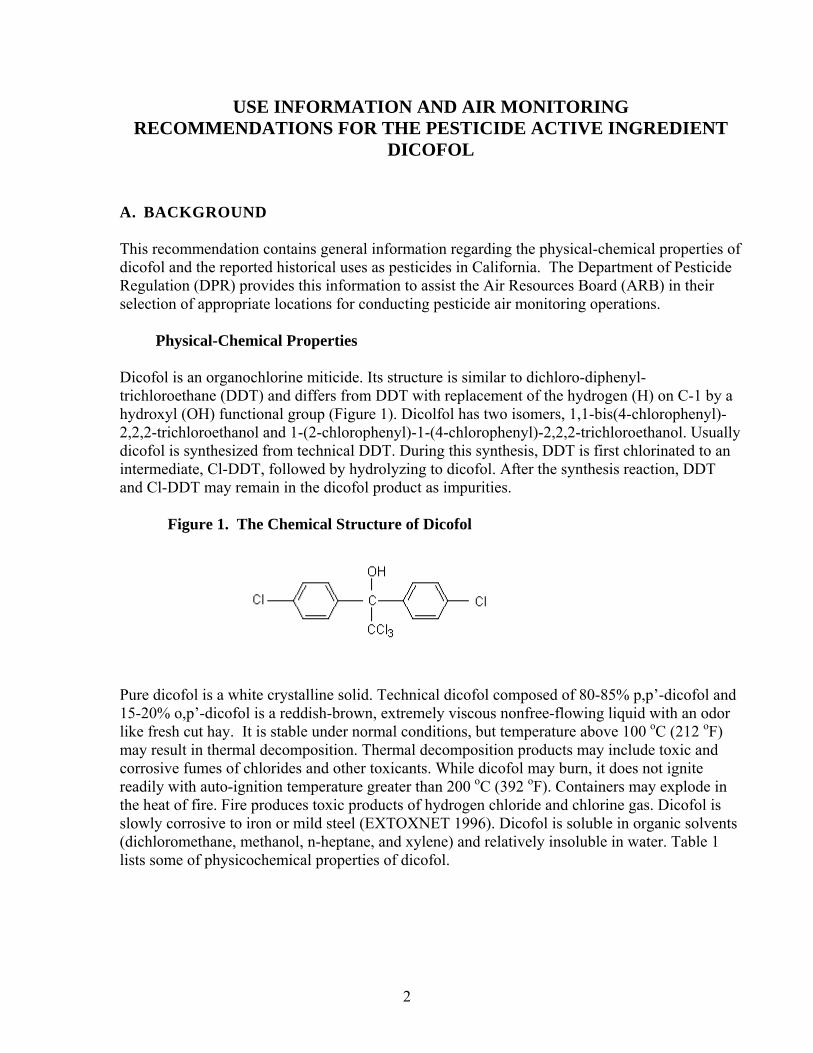
A. BACKGROUND This recommendation contains general information regarding the physical-chemical properties of dicofol and the reported historical uses as pesticides in California. The Department of Pesticide Regulation (DPR) provides this information to assist the Air Resources Board (ARB) in their selection of appropriate locations for conducting pesticide air monitoring operations. Physical-Chemical Properties Dicofol is an organochlorine miticide. Its structure is similar to dichloro-diphenyl-trichloroethane (DDT) and differs from DDT with replacement of the hydrogen (H) on C-1 by a hydroxyl (OH) functional group (Figure 1). Dicolfol has two isomers, 1,1-bis(4-chlorophenyl)-2,2,2-trichloroethanol and 1-(2-chlorophenyl)-1-(4-chlorophenyl)-2,2,2-trichloroethanol. Usually dicofol is synthesized from technical DDT. During this synthesis, DDT is first chlorinated to an intermediate, Cl-DDT, followed by hydrolyzing to dicofol. After the synthesis reaction, DDT and Cl-DDT may remain in the dicofol product as impurities. Figure 1. The Chemical Structure of Dicofol
Pure dicofol is a white crystalline solid. Technical dicofol composed of 80-85% p,p’-dicofol and 15-20% o,p’-dicofol is a reddish-brown, extremely viscous nonfree-flowing liquid with an odor like fresh cut hay. It is stable under normal conditions, but temperature above 100 oC (212 oF) may result in thermal decomposition. Thermal decomposition products may include toxic and corrosive fumes of chlorides and other toxicants. While dicofol may burn, it does not ignite readily with auto-ignition temperature greater than 200 oC (392 oF). Containers may explode in the heat of fire. Fire produces toxic products of hydrogen chloride and chlorine gas. Dicofol is slowly corrosive to iron or mild steel (EXTOXNET 1996). Dicofol is soluble in organic solvents (dichloromethane, methanol, n-heptane, and xylene) and relatively insoluble in water. Table 1 lists some of physicochemical properties of dicofol.
2
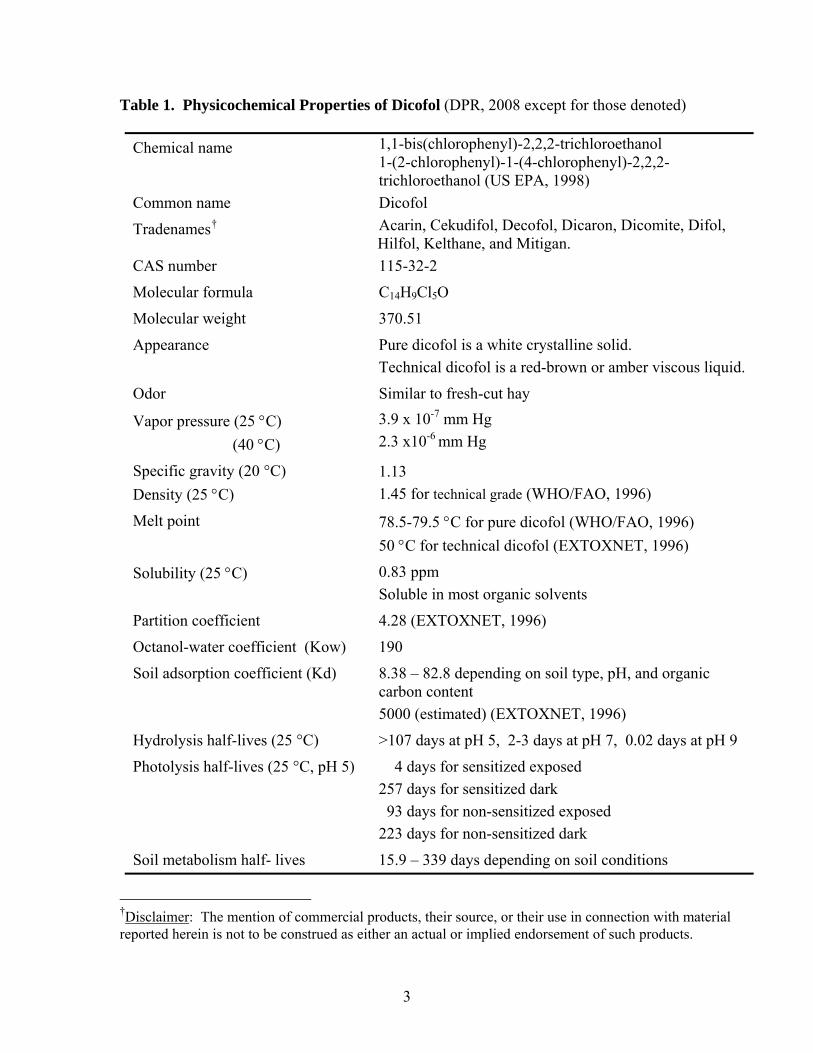
Table 1. Physicochemical Properties of Dicofol (DPR, 2008 except for those denoted)
Chemical name 1,1-bis(chlorophenyl)-2,2,2-trichloroethanol 1-(2-chlorophenyl)-1-(4-chlorophenyl)-2,2,2- trichloroethanol (US EPA, 1998)
Common name Dicofol
Tradenames† Acarin, Cekudifol, Decofol, Dicaron, Dicomite, Difol, Hilfol, Kelthane, and Mitigan.
CAS number 115-32-2
Molecular formula C14H9Cl5O
Molecular weight 370.51
Appearance Pure dicofol is a white crystalline solid. Technical dicofol is a red-brown or amber viscous liquid.
Odor Similar to fresh-cut hay
Vapor pressure (25 °C) (40 °C)
3.9 x 10⁻⁷ mm Hg 2.3 x10⁻⁶ mm Hg
Specific gravity (20 °C)
Density (25 °C)
1.13 1.45 for technical grade (WHO/FAO, 1996)
Melt point 78.5-79.5 °C for pure dicofol (WHO/FAO, 1996) 50 °C for technical dicofol (EXTOXNET, 1996)
Solubility (25 °C) 0.83 ppm Soluble in most organic solvents
Partition coefficient 4.28 (EXTOXNET, 1996)
Octanol-water coefficient (Kow) 190
Soil adsorption coefficient (Kd)
8.38 – 82.8 depending on soil type, pH, and organic carbon content 5000 (estimated) (EXTOXNET, 1996)
Hydrolysis half-lives (25 °C) >107 days at pH 5, 2-3 days at pH 7, 0.02 days at pH 9
Photolysis half-lives (25 °C, pH 5) 4 days for sensitized exposed 257 days for sensitized dark 93 days for non-sensitized exposed 223 days for non-sensitized dark
Soil metabolism half- lives 15.9 – 339 days depending on soil conditions
†Disclaimer: The mention of commercial products, their source, or their use in connection with material reported herein is not to be construed as either an actual or implied endorsement of such products.
3

Dicofol is a contact miticide used to control numerous species of crop-feeding mite pests such as the red spider mite. It is used on varieties of fruit, vegetable, ornamental and field crops. Dicofol is also used in combination with other pesticides such as the organophosphates methyl parathion and dimethoate. Dicofol application methods include ground application, such as dip treatment, high volume ground spray, and low volume ground spray; aerial application, such as dust spray, high volume spray (dilute), low volume spray (concentrate), general surface spray; and other methods, such as spot treatment, nursery stock, preharvest and postharvest treatments. Application equipment includes dip tank, groundboom, duster, low volume sprayer, power sprayer, sprayer, tank-type sprayer, air bluster, fixed wing aircraft, and helicopter. Dicofol is moderately persistent in soil with half-lives ranging 15.9 – 339 days depending on soil type, pH, redox potential, organic carbon content, moisture content, and microbial population. It is almost insoluble in water and adsorbs very strongly to soil particles. It is therefore nearly immobile in soils and unlikely to infiltrate to groundwater. When dicofol is released into open waters by chance, it is expected to adsorb to sediment. Dicofol is susceptible to chemical breakdown in moist soils and subject to degradation by UV light. It also degrades in water when exposed to UV light at pH levels above 7. In a number of studies, dicofol residues on treated plant tissues remained unchanged for up to 2 years (US EPA, 1998). Dicofol is known to be harmful to aquatic animals, and causes egg shell thinning in various species of birds. It is moderately toxic to mammals, and accumulates in body fat to a plateau level related to absorption. It is also cumulative in the environment due to its persistency (WHO, 1996). The US EPA has determined that dicofol may present serious concerns in occupational and residential settings. The toxicity endpoint of concern in these settings is hormonal toxicity. The US EPA has also determined that dicofol may present an ecological risk (US EPA, 1998). US EPA has classified dicofol as toxicity class II - moderately toxic, and toxicity class III - slightly toxic, depending on the formulation. Products containing dicofol bear the Signal Word DANGER or CAUTION, depending on the formulation. B. DICIFOL PESTICIDE USE IN CALIFORNIA Dicofol was introduced commercially in 1955. US EPA temporarily canceled dicofol use in 1986 because of DDT and related contaminants. It was reinstated when modern manufacturing was able to produce technical grade dicofol with less than 0.1% DDT impurity. Currently, there are five products containing dicofol as an active ingredient (a.i.) registered in California, one Dicofol 3 Dust, two emulsifiable liquid formulations of Kelthane MF and Dicofol 4E, and two water soluble powder formulations of Kelthane 50 WSP and Dicofol 50WSB. Their active ingredient contents, registered agricultural uses, and maximum application rates are summarized in Table 2. Dicofol is classified Group C chemical, a possible human carcinogen, and on the list of priority 200 active ingredients for Birth Defect Prevention Act. SB-950 evaluation concluded possible adverse effects identified in oncogenicity and reproduction studies (DPR, 2008).
4
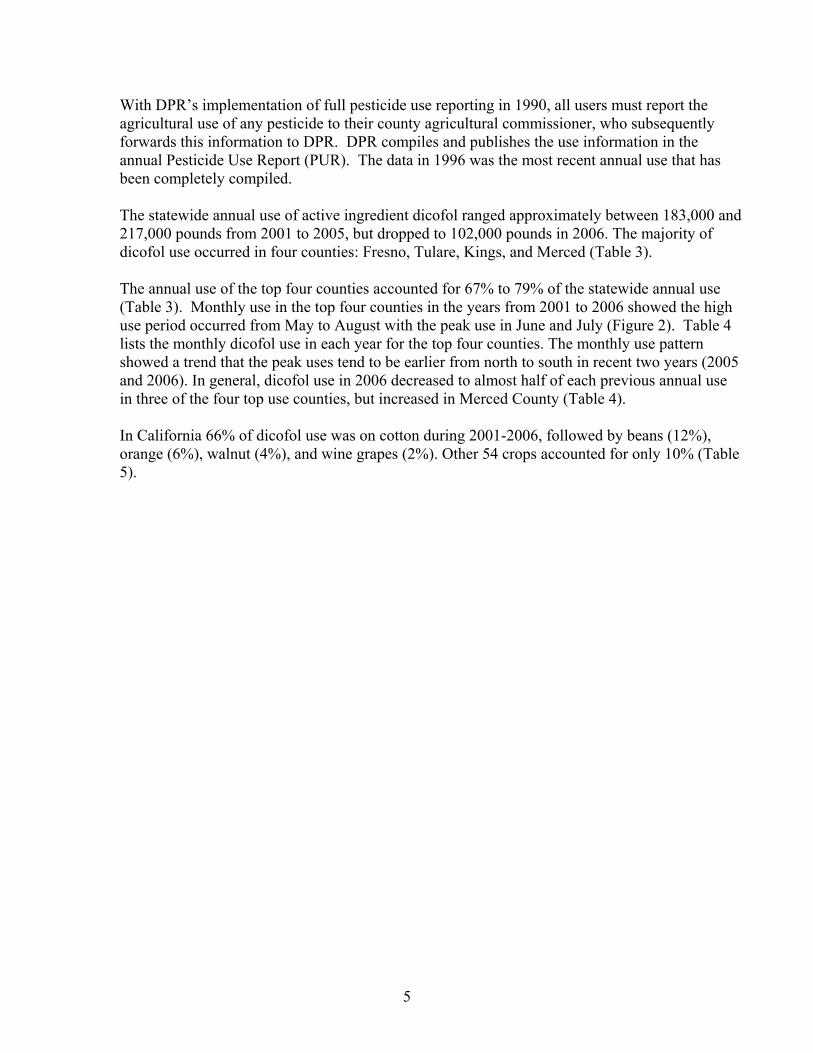
With DPR’s implementation of full pesticide use reporting in 1990, all users must report the agricultural use of any pesticide to their county agricultural commissioner, who subsequently forwards this information to DPR. DPR compiles and publishes the use information in the annual Pesticide Use Report (PUR). The data in 1996 was the most recent annual use that has been completely compiled. The statewide annual use of active ingredient dicofol ranged approximately between 183,000 and 217,000 pounds from 2001 to 2005, but dropped to 102,000 pounds in 2006. The majority of dicofol use occurred in four counties: Fresno, Tulare, Kings, and Merced (Table 3). The annual use of the top four counties accounted for 67% to 79% of the statewide annual use (Table 3). Monthly use in the top four counties in the years from 2001 to 2006 showed the high use period occurred from May to August with the peak use in June and July (Figure 2). Table 4 lists the monthly dicofol use in each year for the top four counties. The monthly use pattern showed a trend that the peak uses tend to be earlier from north to south in recent two years (2005 and 2006). In general, dicofol use in 2006 decreased to almost half of each previous annual use in three of the four top use counties, but increased in Merced County (Table 4). In California 66% of dicofol use was on cotton during 2001-2006, followed by beans (12%), orange (6%), walnut (4%), and wine grapes (2%). Other 54 crops accounted for only 10% (Table 5).
5
Table 2. Summary of active ingredient content, registered agricultural uses and maximum application rate for dicofol products currently registered in California
Product A. I. content (%) Use on crops Maximum application rate
(pounds of a.i./acre) Cucurbits 0.625
Grapes 0.25
Pomefruits 3 for trees >10 ft tall
Kelthane 50WSP and Dicofol 50WSB
50
Strawberries 2 for cyclamen mites only
Dicofol 50WSB 50 Stone fruits 1.5
Beans 1.5
Cotton 1.5
Hops 1.167
Mint 1.25
Kelthane MF and Dicofol 4E
42
Peppers, Tomatoes 0.75
Citrus 3 for trees >10 ft tall Kelthane MF 42
Pecans, Walnuts 2
Dicofol 4E 42 Cucurbits 0.625
Cucurbits 0.63 Dicofol 3 Dust 3
Grapes 1.2
6

Table 3. Annual Dicofol Use by County during the Years of 2001-2006 (Pounds of Active Ingredient) County/Year 2001 2002 2003 2004 2005 2006 Total
FRESNO 75265 51976 49215 68440 61051 27799 333744 TULARE 40341 35513 42239 43507 35060 10155 206815 KINGS 18674 25114 27709 31010 29124 7839 139470
MERCED 19746 17070 18552 27707 19666 22032 124773
STANISLAUS 14536 13948 11925 13822 7120 5330 66681
KERN 9345 10338 8726 5966 12774 5828 52977
SAN JOAQUIN 3379 4895 3527 5582 4839 5924 28146
MADERA 4369 3019 2037 2454 5358 4938 22173
BUTTE 4846 1278 4196 2255 3797 1102 17474
SUTTER 3071 4067 2500 1846 1580 2905 15969
MONTEREY 4504 1523 802 1824 3767 1825 14246
IMPERIAL 3103 2271 2371 2965 2138 472 13321
RIVERSIDE 1913 2080 3140 2694 484 1212 11524
YOLO 1511 2466 1771 403 431 341 6924
GLENN 1066 1273 980 618 1226 1170 6333
TEHAMA 1128 2356 2159 42 277 29 5991
SOLANO 1210 1294 958 368 663 184 4677
COLUSA 233 770 403 1775 756 479 4415
SANTA BARBARA 797 349 162 636 1311 571 3826
SANTA CLARA 7 26 179 395 840 543 1991
CONTRA COSTA 1282 33 301 334 10 1960
SAN DIEGO 385 290 496 288 235 86 1780
VENTURA 189 23 441 695 251 27 1625
SISKIYOU 8 494 874 149 1525
OTHER 21 COUNTIES 1908 1044 1312 718 170 551 5703
Statewide use 212809 183014 186112 216836 193791 101501 1094061
Top four counties use 154027 129672 137715 170663 144900 67825 804802 Percent of top four counties to statewide use 72% 71% 74% 79% 75% 67% 74%
7
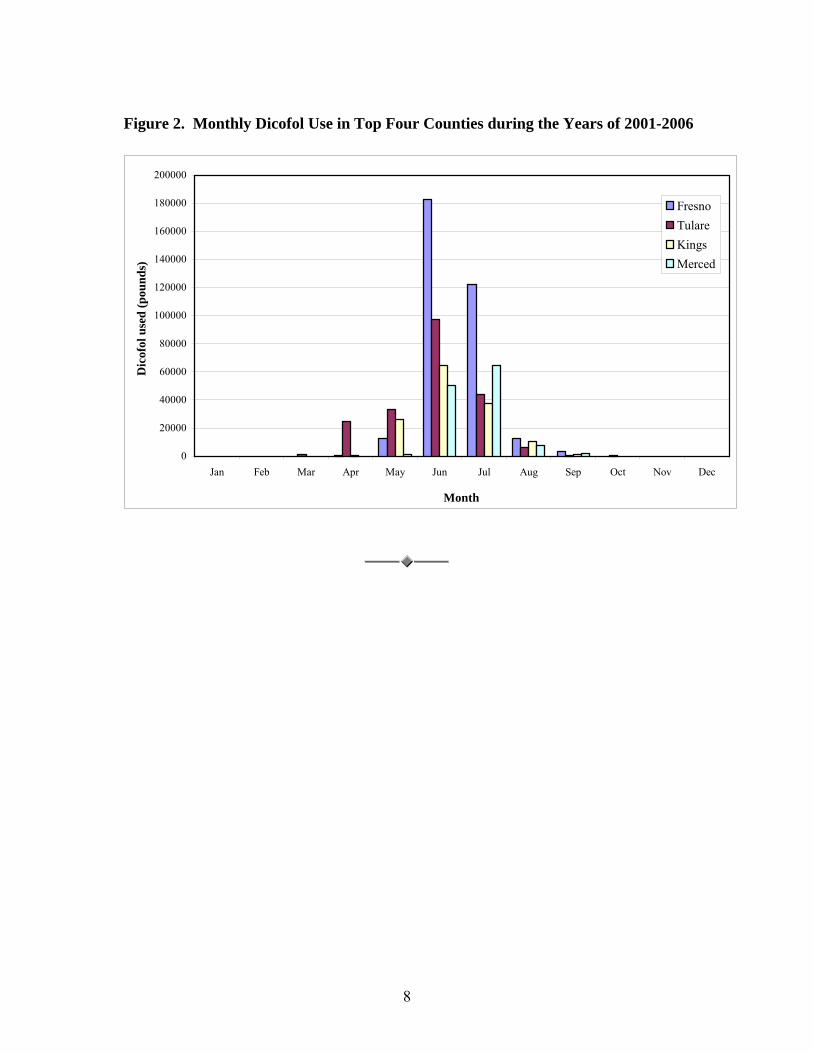
Figure 2. Monthly Dicofol Use in Top Four Counties during the Years of 2001-2006
0
20000
40000
60000
80000
100000
120000
140000
160000
180000
200000
Jan Feb Mar Apr May Jun Jul Aug Sep Oct Nov Dec
Month
Dic
ofol
use
d (p
ound
s)
FresnoTulareKingsMerced
8
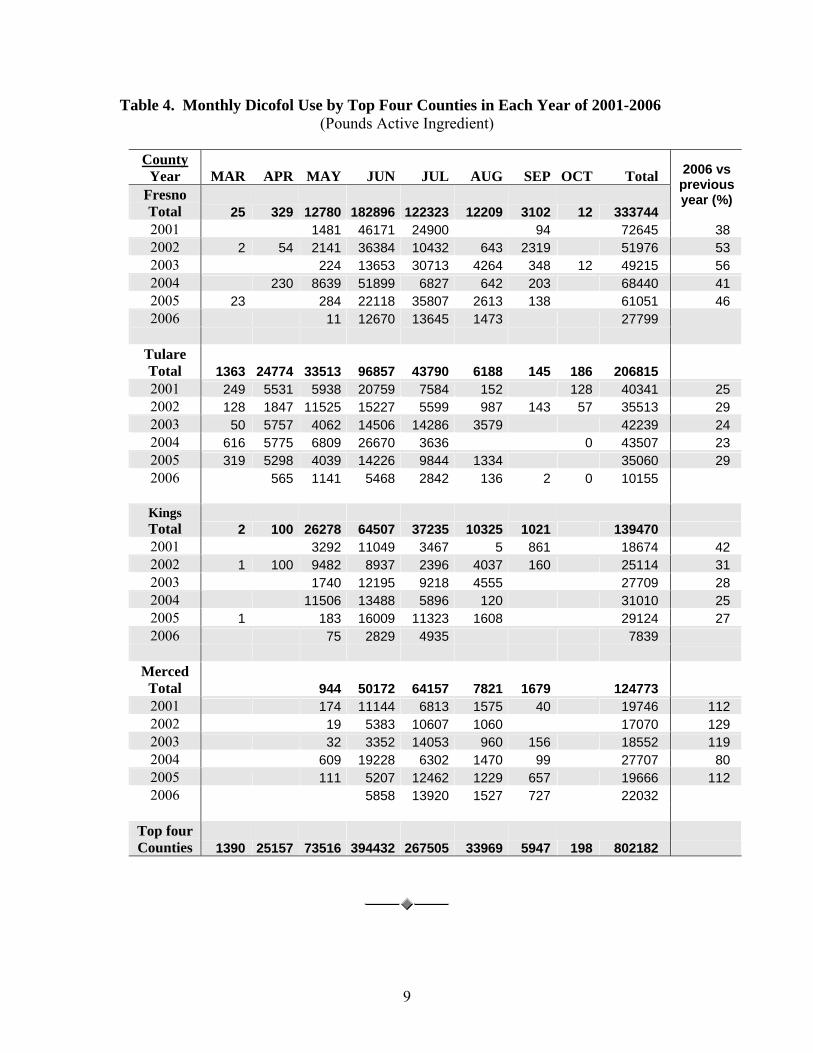
Table 4. Monthly Dicofol Use by Top Four Counties in Each Year of 2001-2006 (Pounds Active Ingredient)
County
Year MAR APR MAY JUN JUL AUG SEP OCT Total Fresno Total 25 329 12780 182896 122323 12209 3102 12 333744
2006 vs previous year (%)
2001 1481 46171 24900 94 72645 38 2002 2 54 2141 36384 10432 643 2319 51976 53 2003 224 13653 30713 4264 348 12 49215 56 2004 230 8639 51899 6827 642 203 68440 41 2005 23 284 22118 35807 2613 138 61051 46 2006 11 12670 13645 1473 27799
Tulare Total 1363 24774 33513 96857 43790 6188 145 186 206815 2001 249 5531 5938 20759 7584 152 128 40341 25 2002 128 1847 11525 15227 5599 987 143 57 35513 29 2003 50 5757 4062 14506 14286 3579 42239 24 2004 616 5775 6809 26670 3636 0 43507 23 2005 319 5298 4039 14226 9844 1334 35060 29 2006 565 1141 5468 2842 136 2 0 10155
Kings Total 2 100 26278 64507 37235 10325 1021 139470 2001 3292 11049 3467 5 861 18674 42 2002 1 100 9482 8937 2396 4037 160 25114 31 2003 1740 12195 9218 4555 27709 28 2004 11506 13488 5896 120 31010 25 2005 1 183 16009 11323 1608 29124 27 2006 75 2829 4935 7839
Merced Total 944 50172 64157 7821 1679 124773 2001 174 11144 6813 1575 40 19746 112 2002 19 5383 10607 1060 17070 129 2003 32 3352 14053 960 156 18552 119 2004 609 19228 6302 1470 99 27707 80 2005 111 5207 12462 1229 657 19666 112 2006 5858 13920 1527 727 22032
Top four Counties 1390 25157 73516 394432 267505 33969 5947 198 802182
9
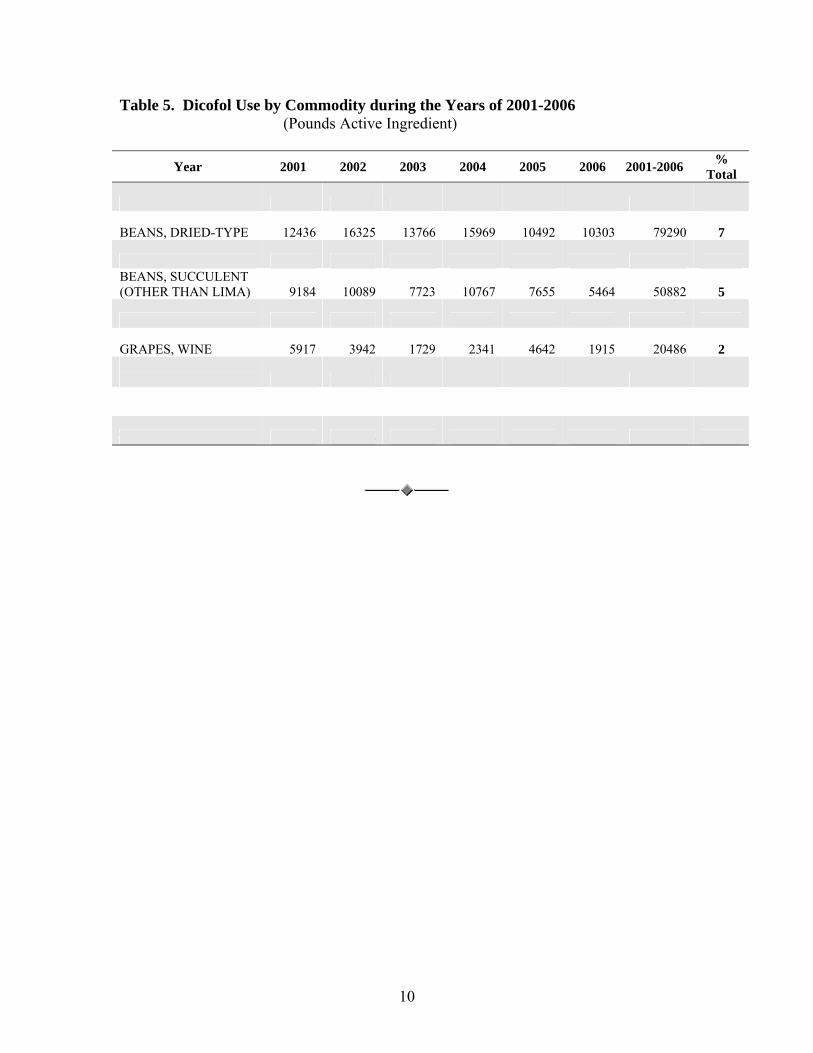
Table 5. Dicofol Use by Commodity during the Years of 2001-2006 (Pounds Active Ingredient)
Year 2001 2002 2003 2004 2005 2006 2001-2006 % Total
COTTON 131649 114854 121817 158954 130591 64457 722323 66
BEANS, DRIED-TYPE 12436 16325 13766 15969 10492 10303 79290 7
ORANGE 12487 8035 14155 10046 14820 1533 61076 6 BEANS, SUCCULENT (OTHER THAN LIMA) 9184 10089 7723 10767 7655 5464 50882 5
WALNUT 7387 6823 9099 5344 9088 6288 44029 4
GRAPES, WINE 5917 3942 1729 2341 4642 1915 20486 2 OTHER 54 COMMODITIES 33749 22945 17823 13415 16502 11541 115975 10
TOTAL 212809 183014 186112 216836 193791 101501 1094061 100
10
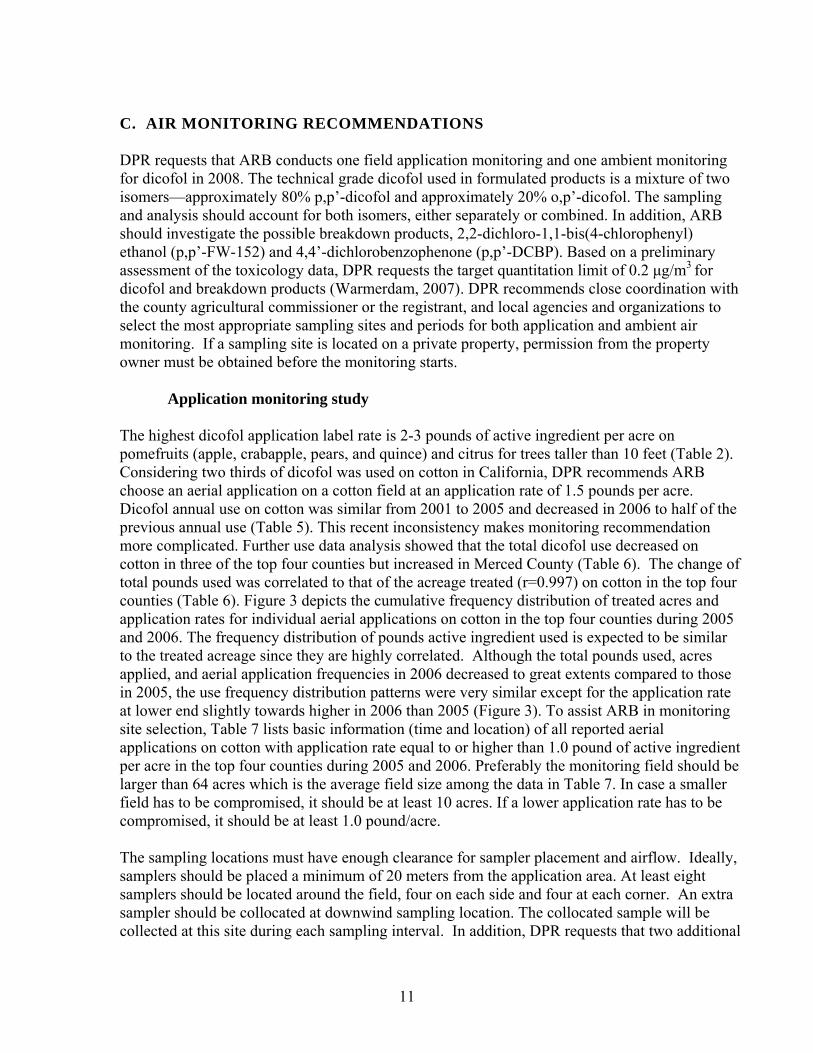
C. AIR MONITORING RECOMMENDATIONS DPR requests that ARB conducts one field application monitoring and one ambient monitoring for dicofol in 2008. The technical grade dicofol used in formulated products is a mixture of two isomers—approximately 80% p,p’-dicofol and approximately 20% o,p’-dicofol. The sampling and analysis should account for both isomers, either separately or combined. In addition, ARB should investigate the possible breakdown products, 2,2-dichloro-1,1-bis(4-chlorophenyl) ethanol (p,p’-FW-152) and 4,4’-dichlorobenzophenone (p,p’-DCBP). Based on a preliminary assessment of the toxicology data, DPR requests the target quantitation limit of 0.2 μg/m3 for dicofol and breakdown products (Warmerdam, 2007). DPR recommends close coordination with the county agricultural commissioner or the registrant, and local agencies and organizations to select the most appropriate sampling sites and periods for both application and ambient air monitoring. If a sampling site is located on a private property, permission from the property owner must be obtained before the monitoring starts. Application monitoring study The highest dicofol application label rate is 2-3 pounds of active ingredient per acre on pomefruits (apple, crabapple, pears, and quince) and citrus for trees taller than 10 feet (Table 2). Considering two thirds of dicofol was used on cotton in California, DPR recommends ARB choose an aerial application on a cotton field at an application rate of 1.5 pounds per acre. Dicofol annual use on cotton was similar from 2001 to 2005 and decreased in 2006 to half of the previous annual use (Table 5). This recent inconsistency makes monitoring recommendation more complicated. Further use data analysis showed that the total dicofol use decreased on cotton in three of the top four counties but increased in Merced County (Table 6). The change of total pounds used was correlated to that of the acreage treated (r=0.997) on cotton in the top four counties (Table 6). Figure 3 depicts the cumulative frequency distribution of treated acres and application rates for individual aerial applications on cotton in the top four counties during 2005 and 2006. The frequency distribution of pounds active ingredient used is expected to be similar to the treated acreage since they are highly correlated. Although the total pounds used, acres applied, and aerial application frequencies in 2006 decreased to great extents compared to those in 2005, the use frequency distribution patterns were very similar except for the application rate at lower end slightly towards higher in 2006 than 2005 (Figure 3). To assist ARB in monitoring site selection, Table 7 lists basic information (time and location) of all reported aerial applications on cotton with application rate equal to or higher than 1.0 pound of active ingredient per acre in the top four counties during 2005 and 2006. Preferably the monitoring field should be larger than 64 acres which is the average field size among the data in Table 7. In case a smaller field has to be compromised, it should be at least 10 acres. If a lower application rate has to be compromised, it should be at least 1.0 pound/acre. The sampling locations must have enough clearance for sampler placement and airflow. Ideally, samplers should be placed a minimum of 20 meters from the application area. At least eight samplers should be located around the field, four on each side and four at each corner. An extra sampler should be collocated at downwind sampling location. The collocated sample will be collected at this site during each sampling interval. In addition, DPR requests that two additional
11

samplers be set up adjacent to two of the primary samplers, preferably on opposite sides, and equipped with a sample tube and particulate filter to monitor for particulates. The two particulate samples will be collected during each sampling interval. Prior to application, at least two background samples should be collected for 18-24 hours duration. Air samples should be taken before, during, and after application and for three Daytime/Overnight sampling periods as in the following schedule.
Sample period begins Sample duration time Background (pre-application) Minimum 18 – 24 hours Application Start of application until 1 hour after end of application 1 hour after ending of application (post-application) 1 hour after end of application until 1 hour before sunset
1 hour before sunset Overnight* until 1 hour after sunrise
1 hour after sunrise Daytime until 1 hour before sunset 1 hour before sunset Overnight until 1 hour after sunrise 1 hour after sunrise Daytime until 1 hour before sunset 1 hour before sunset Overnight until 1 hour after sunrise
*All overnight samples must include the period from one hour before sunset to one hour after sunrise.
For quality assurance field spikes, trip spikes, and trip blanks should be prepared in the laboratory and handled as the same as the field samples. DPR requests the following information to be included in the monitoring report:
1) an accurate record of the application site, including topographic features 2) an accurate record of the positions of the monitoring equipment with respect to the
application site, including the exact direction and distance of the samplers from the edge of the application site
3) an accurate record of pesticide application, including quantity of pesticide applied, application starting and ending time, method, and application rate, etc.
4) an accurate drawing of the monitoring site showing the precise location of the meteorological equipment, trees, buildings, and other obstacles with respect to North (identified as either true or magnetic North)
5) if applicable, meteorological data collected at 1-minute intervals including wind speed and direction, humidity, air temperature, and comments regarding degree of cloud cover.
12
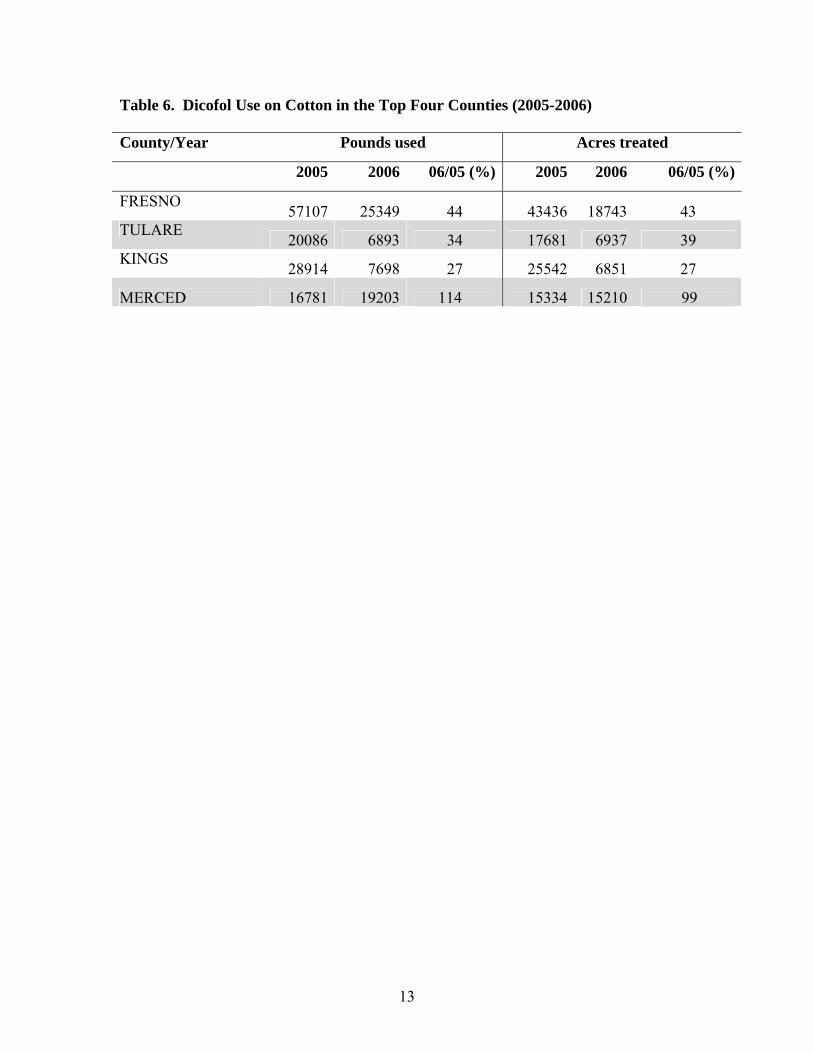
Table 6. Dicofol Use on Cotton in the Top Four Counties (2005-2006)
County/Year Pounds used Acres treated
2005 2006 06/05 (%) 2005 2006 06/05 (%)
FRESNO 57107 25349 44 43436 18743 43 TULARE 20086 6893 34 17681 6937 39 KINGS 28914 7698 27 25542 6851 27
MERCED 16781 19203 114 15334 15210 99
13
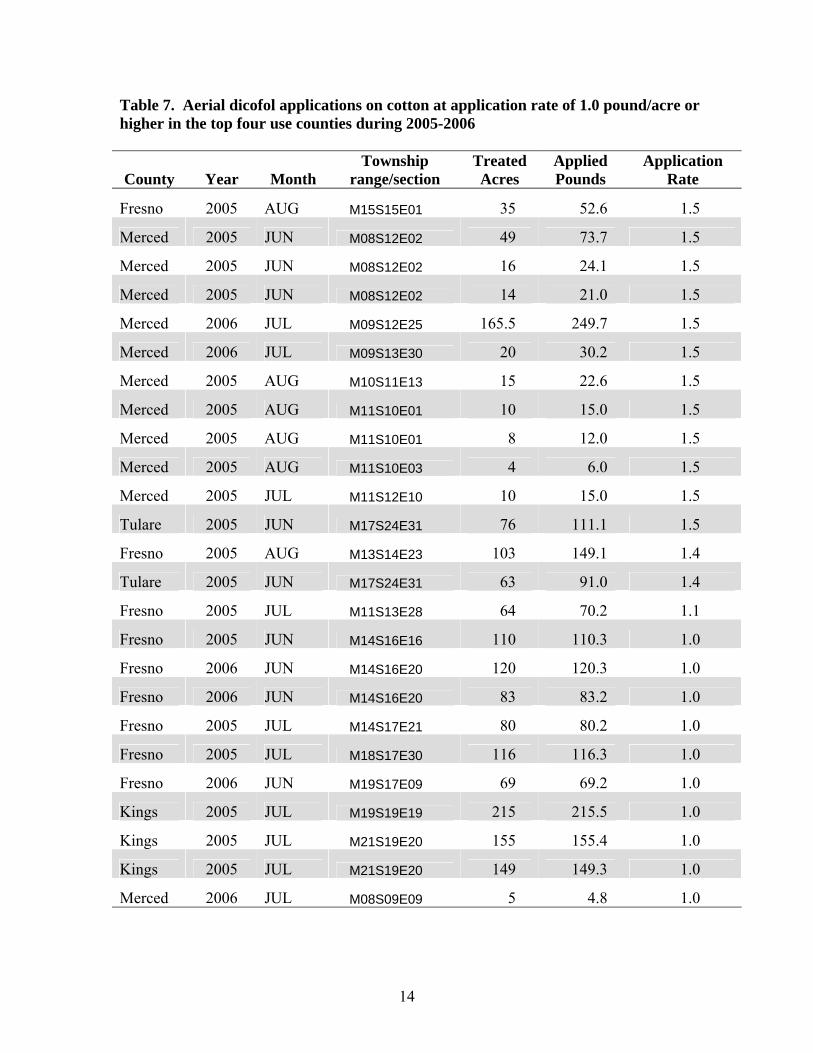
Table 7. Aerial dicofol applications on cotton at application rate of 1.0 pound/acre or higher in the top four use counties during 2005-2006
County Year Month Township
range/section Treated Acres
Applied Pounds
Application Rate
Fresno 2005 AUG M15S15E01 35 52.6 1.5
Merced 2005 JUN M08S12E02 49 73.7 1.5
Merced 2005 JUN M08S12E02 16 24.1 1.5
Merced 2005 JUN M08S12E02 14 21.0 1.5
Merced 2006 JUL M09S12E25 165.5 249.7 1.5
Merced 2006 JUL M09S13E30 20 30.2 1.5
Merced 2005 AUG M10S11E13 15 22.6 1.5
Merced 2005 AUG M11S10E01 10 15.0 1.5
Merced 2005 AUG M11S10E01 8 12.0 1.5
Merced 2005 AUG M11S10E03 4 6.0 1.5
Merced 2005 JUL M11S12E10 10 15.0 1.5
Tulare 2005 JUN M17S24E31 76 111.1 1.5
Fresno 2005 AUG M13S14E23 103 149.1 1.4
Tulare 2005 JUN M17S24E31 63 91.0 1.4
Fresno 2005 JUL M11S13E28 64 70.2 1.1
Fresno 2005 JUN M14S16E16 110 110.3 1.0
Fresno 2006 JUN M14S16E20 120 120.3 1.0
Fresno 2006 JUN M14S16E20 83 83.2 1.0
Fresno 2005 JUL M14S17E21 80 80.2 1.0
Fresno 2005 JUL M18S17E30 116 116.3 1.0
Fresno 2006 JUN M19S17E09 69 69.2 1.0
Kings 2005 JUL M19S19E19 215 215.5 1.0
Kings 2005 JUL M21S19E20 155 155.4 1.0
Kings 2005 JUL M21S19E20 149 149.3 1.0
Merced 2006 JUL M08S09E09 5 4.8 1.0
14
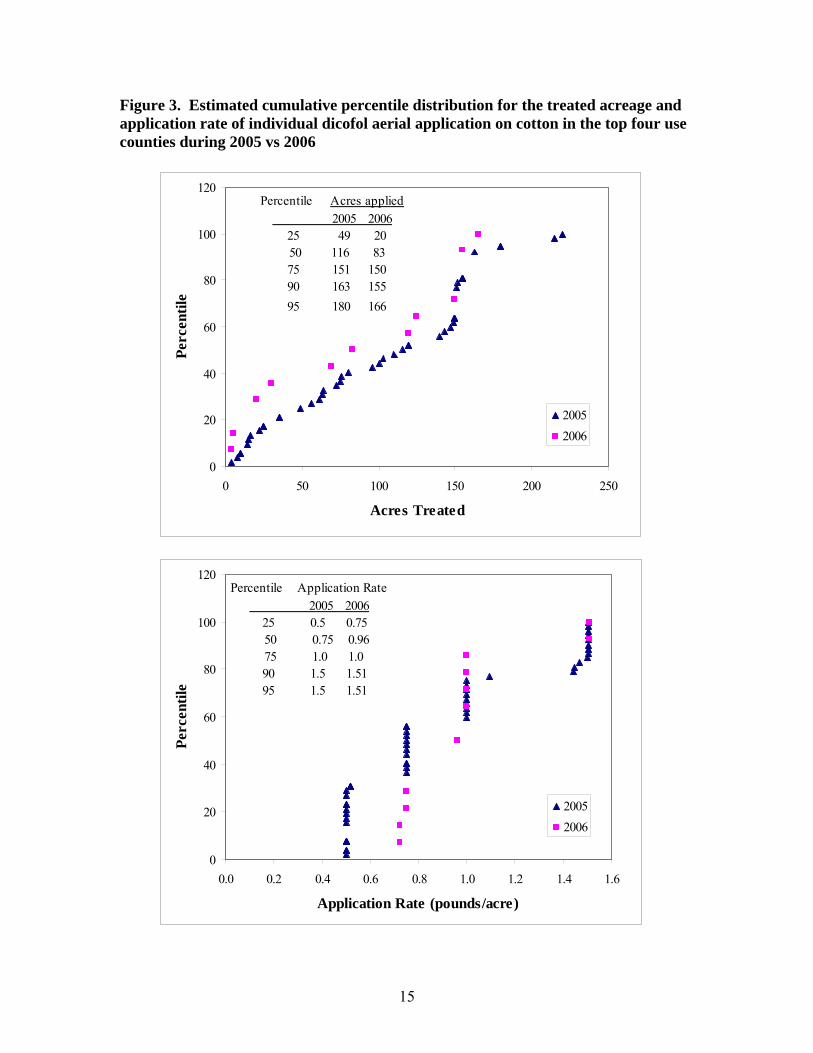
Figure 3. Estimated cumulative percentile distribution for the treated acreage and application rate of individual dicofol aerial application on cotton in the top four use counties
Percentile Acres applied 2005 2006 25 49 20 50 116 83 75 151 150 90 163 155 95 180 166
0
20
40
60
80
100
120
0 50 100 150 200 250
Acres Treated
Perc
entil
e
20052006
Percentile Application Rate 2005 2006 25 0.5 0.75 50 0.75 0.96 75 1.0 1.0
90 1.5 1.51 95 1.5 1.51
0
20
40
60
80
100
120
0.0 0.2 0.4 0.6 0.8 1.0 1.2 1.4 1.6
Application Rate (pounds/acre)
Perc
entil
e
20052006
during 2005 vs 2006
15
Ambient monitoring study As part of the Cal/EPA Environmental Justice Action Plan, DPR recommends ambient air monitoring of dicofol in rural communities to address the environmental risk factors that impact children’s health. Because dicofol is primarily used on agricultural fields, California rural communities may have higher concentrations of dicofol in ambient air compared to urban communities. The selection of communities is based on objective data, using criteria that can be quantified, validated, and verified, providing a more transparent and fair selection process. DPR selected 32 communities in five counties for evaluation based on their proximity to dicofol applications - Fresno, Tulare, Kings, Merced, and Madera. The communities are identified by name in the 2000 U.S. Census, and are also included in a spatial dataset distributed by the U.S. Census Bureau for use in a Geographic Information System (GIS). Each of the 32 communities was rated on the following two major categories and eight subcategories:
• Environmental justice factors o Population density of children under age 18 o Median family income o Hispanic population percentage o Non-white population percentage
• Pesticide use factors o Regional (within 5 miles outside community boundary) dicofol use density in 2005 o Regional (within 5 miles outside community boundary) dicofol use density in 2006 o Local (within 1 mile outside community boundary) dicofol use density in 2005 o Local (within 1 mile outside community boundary) dicofol use density in 2006
For the environmental justice factors, the subcategory ratings for Hispanic population and non-white population were based on percentage of total population in each community; but for children under age 18, it was based on density per square mile to minimize the effect of the community size in the ratings. These data plus total population and area of each community used in calculations are from the Census 2000 Demographic Profile Highlights (U.S. Census Bureau, 2000) and were delineated in the spatial dataset used in this study. For the pesticide use factors, regional and local uses were calculated as pounds of active ingredient of dicofol applied in 2005 and 2006 within 1 mile and 5 miles of each community boundary, respectively, using a buffering algorithm in GIS. In calculation of dicofol use density (pounds/square mile) for each community, the use amount within 1 mile or 5 miles was divided by the community area plus 1 mile or 5 miles ring areas around each community. This calculation assumed that the shape of the community is round and no dicofol was applied within the community. Communities were first rated in each subcategory into four groups according to their ascending ranks, except for the median family income which was ranked in descending order. In most cases, the first 8 communities with the highest ranks were rated four, the second 8 communities were rated three, and so forth. The communities were then placed into four groups according to their ascending ranks in each of the two major categories (environmental justice and pesticide use). The rank in each major category is determined by combining the ratings of the four subcategories. Finally, the two major category ratings were combined, ranked, and rated into
16
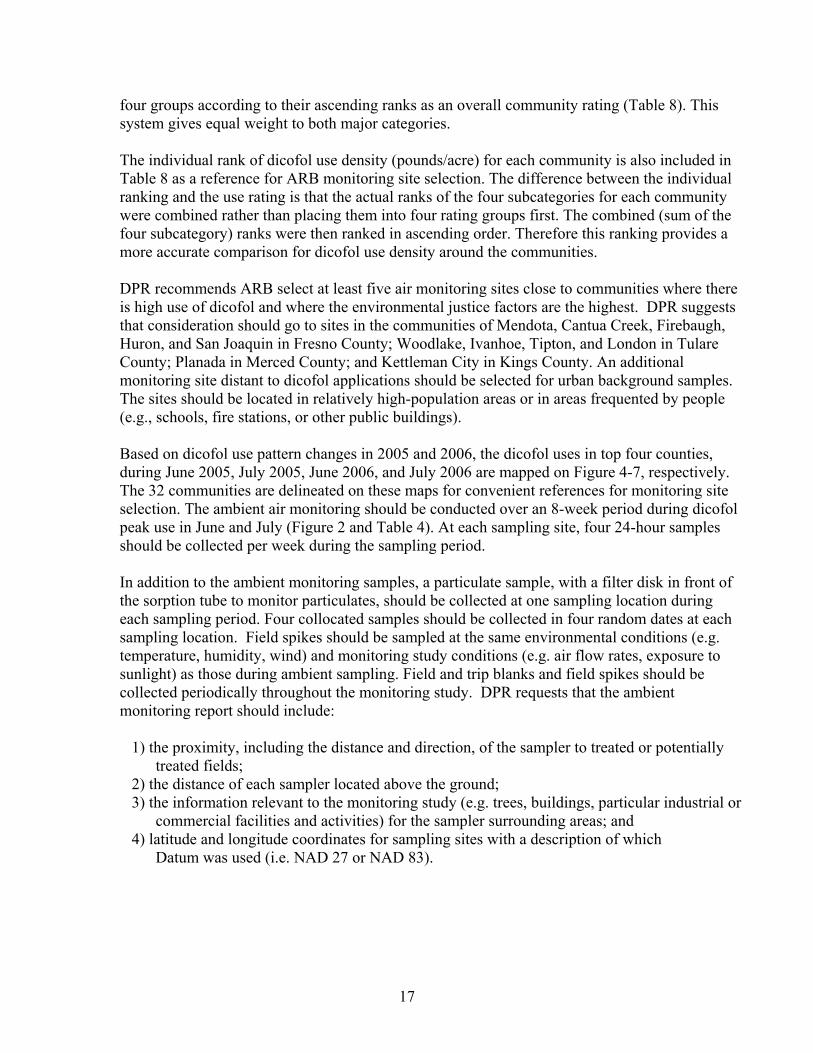
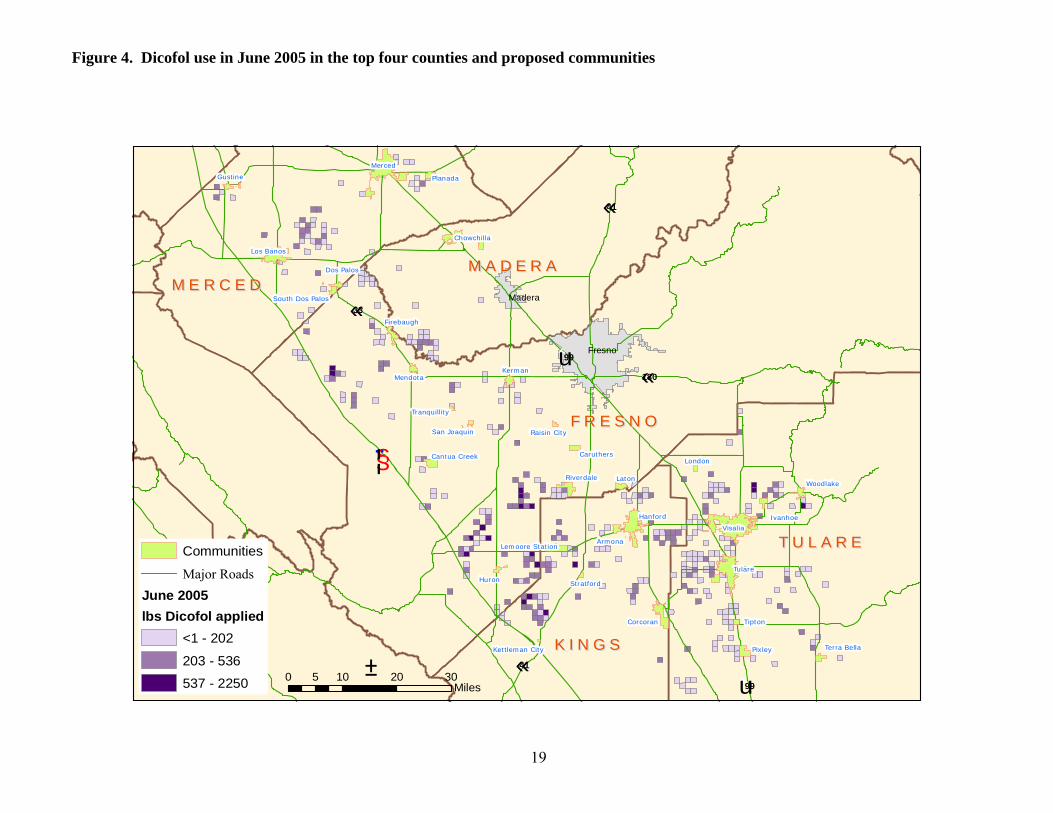
four groups according to their ascending ranks as an overall community rating (Table 8). This system gives equal weight to both major categories. The individual rank of dicofol use density (pounds/acre) for each community is also included in Table 8 as a reference for ARB monitoring site selection. The difference between the individual ranking and the use rating is that the actual ranks of the four subcategories for each community were combined rather than placing them into four rating groups first. The combined (sum of the four subcategory) ranks were then ranked in ascending order. Therefore this ranking provides a more accurate comparison for dicofol use density around the communities. DPR recommends ARB select at least five air monitoring sites close to communities where there is high use of dicofol and where the environmental justice factors are the highest. DPR suggests that consideration should go to sites in the communities of Mendota, Cantua Creek, Firebaugh, Huron, and San Joaquin in Fresno County; Woodlake, Ivanhoe, Tipton, and London in Tulare County; Planada in Merced County; and Kettleman City in Kings County. An additional monitoring site distant to dicofol applications should be selected for urban background samples. The sites should be located in relatively high-population areas or in areas frequented by people (e.g., schools, fire stations, or other public buildings). Based on dicofol use pattern changes in 2005 and 2006, the dicofol uses in top four counties, during June 2005, July 2005, June 2006, and July 2006 are mapped on Figure 4-7, respectively. The 32 communities are delineated on these maps for convenient references for monitoring site selection. The ambient air monitoring should be conducted over an 8-week period during dicofol peak use in June and July (Figure 2 and Table 4). At each sampling site, four 24-hour samples should be collected per week during the sampling period. In addition to the ambient monitoring samples, a particulate sample, with a filter disk in front of the sorption tube to monitor particulates, should be collected at one sampling location during each sampling period. Four collocated samples should be collected in four random dates at each sampling location. Field spikes should be sampled at the same environmental conditions (e.g. temperature, humidity, wind) and monitoring study conditions (e.g. air flow rates, exposure to sunlight) as those during ambient sampling. Field and trip blanks and field spikes should be collected periodically throughout the monitoring study. DPR requests that the ambient monitoring report should include:
1) the proximity, including the distance and direction, of the sampler to treated or potentially treated fields;
2) the distance of each sampler located above the ground; 3) the information relevant to the monitoring study (e.g. trees, buildings, particular industrial or
commercial facilities and activities) for the sampler surrounding areas; and 4) latitude and longitude coordinates for sampling sites with a description of which
Datum was used (i.e. NAD 27 or NAD 83).
17

Table 8. Rating for each community
Environmental Justice Dicofol Use Total Community County
Factors Rating Rank Rating Rating Mendota Fresno 4 31 4 4
Cantua Creek Fresno 3 27 4 4 Firebaugh Fresno 3 32 4 4 Woodlake Tulare 3 23 4 4 Planada Merced 4 17 3 4 Ivanhoe Tulare 3 16 3 3 Tipton Tulare 3 21 3 3 Huron Fresno 4 10 2 3
Kettleman City Kings 4 11 2 3 London Tulare 4 8 2 3
San Joaquin Fresno 4 9 2 3 Gustine Merced 1 28 4 2
Lemoore Station Kings 1 30 4 2 Tulare Tulare 1 29 4 2 Visalia Tulare 1 26 4 2
Corcoran Kings 2 23 3 2 Los Banos Merced 2 22 3 2 Riverdale Fresno 2 20 3 2
Pixley Tulare 3 14 2 2 South Dos Palos Merced 3 15 2 2
Terra Bella Tulare 3 13 2 2 Dos Palos Merced 1 25 3 1 Hanford Kings 1 18 3 1
Tranquillity Fresno 1 18 3 1 Armona Kings 1 12 2 1 Kerman Fresno 3 6 1 1 Stratford Kings 3 4 1 1
Laton Fresno 2 4 1 1 Merced Merced 2 7 1 1
Raisin City Fresno 2 2 1 1 Caruthers Fresno 1 3 1 1
Chowchilla Merced 1 1 1 1
18
19
Figure 4. Dicofol use in June 2005 in the top four counties and proposed communities
§̈¦5
tu101
tu99
Merced
Gustine Planada
F R E S N OF R E S N O
M A D E R AM A D E R AM E R C E DM E R C E D
K I N G SK I N G S
T U L A R ET U L A R E
tu99
¬«180
¬«33
¬«41
Fresno
Madera
¬«41
Chowchilla
Los Banos
Dos Palos
South Dos Palos
Firebaugh
KermanMendota
Cantua Creek
Pixley
Woodlake
Caruthers
Huron
Riverdale
Tulare
Visalia
Corcoran
Terra Bella
Tipton
Ivanhoe
Stratford
Raisin City
Kettleman City
Hanford
Laton
London
Lemoore Station
Tranquillity
San Joaquin
Armona
Communities
Major RoadsJune 2005lbs Dicofol applied
<1 - 202
203 - 536
537 - 2250 0 10 20 305Miles
±
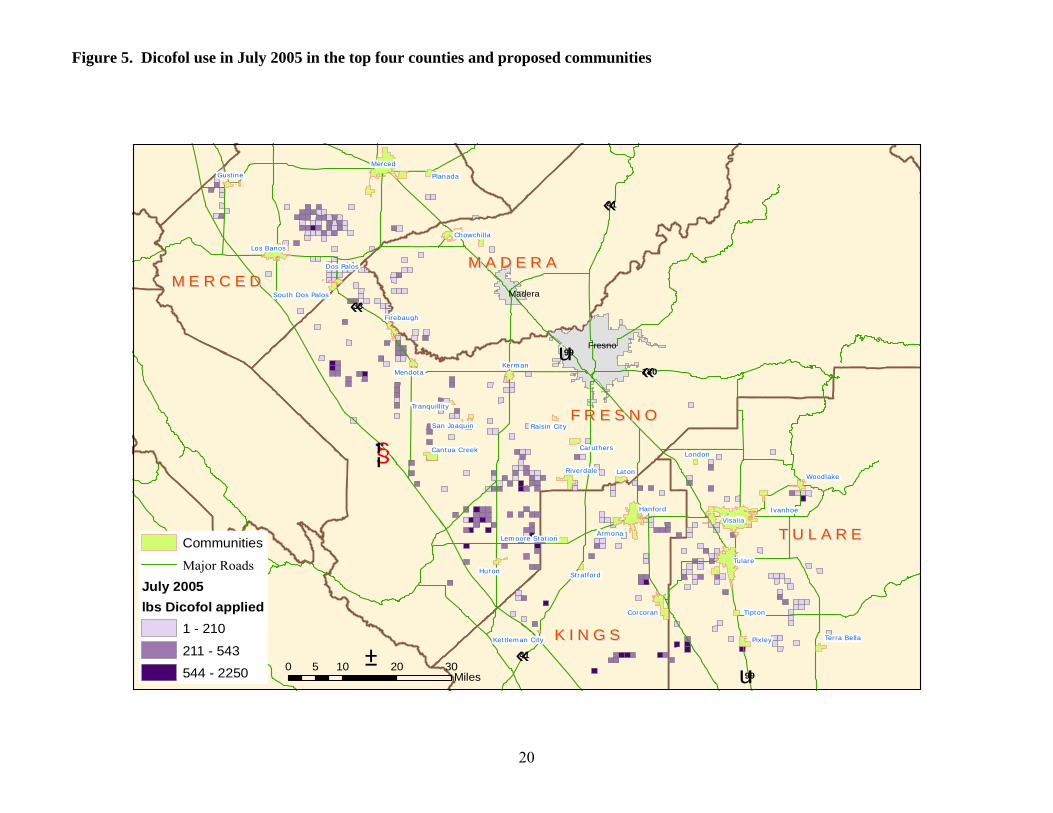
Figure 5. Dicofol use in July 2005 in the top four counties and proposed communities
20
§̈¦5
tu101
tu99
Merced
Gustine Planada
F R E S N OF R E S N O
M A D E R AM A D E R AM E R C E DM E R C E D
K I N G SK I N G S
T U L A R ET U L A R E
tu99
¬«180
¬«33
¬«41
Fresno
Madera
¬«41
Chowchilla
Los Banos
Dos Palos
South Dos Palos
Firebaugh
KermanMendota
Cantua Creek
Pixley
Woodlake
Caruthers
Huron
Riverdale
Tulare
Visalia
Corcoran
Terra Bella
Tipton
Ivanhoe
Stratford
Raisin City
Kettleman City
Hanford
Laton
London
Lemoore Station
Tranquillity
San Joaquin
Armona
Communities
Major RoadsJuly 2005lbs Dicofol applied
1 - 210
211 - 543
544 - 2250 0 10 20 305Miles
±
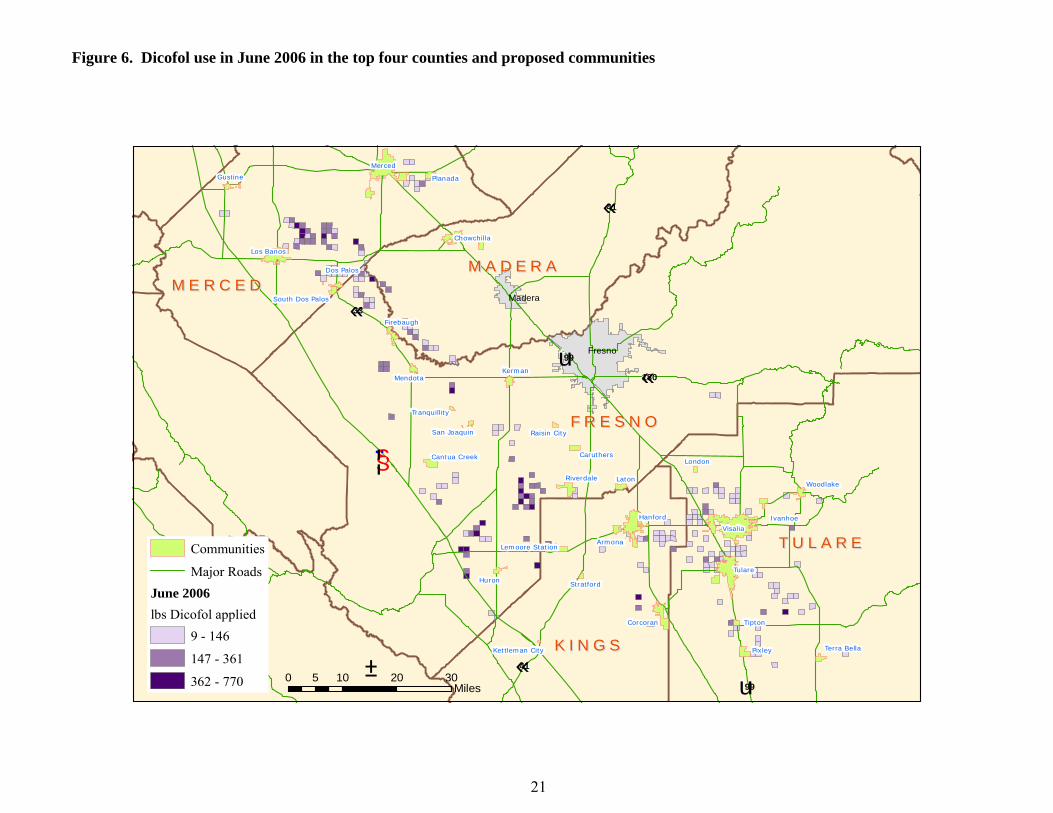
Figure 6. Dicofol use in June 2006 in the top four counties and proposed communities
§̈¦5
tu101
tu99
Merced
Gustine Planada
F R E S N OF R E S N O
M A D E R AM A D E R AM E R C E DM E R C E D
K I N G SK I N G S
T U L A R ET U L A R E
tu99
¬«180
¬«33
¬«41
Fresno
Madera
¬«41
Chowchilla
Los Banos
Dos Palos
South Dos Palos
Firebaugh
KermanMendota
Cantua Creek
Pixley
Woodlake
Caruthers
Huron
Riverdale
Tulare
Visalia
Corcoran
Terra Bella
Tipton
Ivanhoe
Stratford
Raisin City
Kettleman City
Hanford
Laton
London
Lemoore Station
Tranquillity
San Joaquin
ArmonaCommunities
Major RoadsJune 2006lbs Dicofol applied
9 - 146
147 - 361
362 - 770 0 10 20 305Miles
±
21
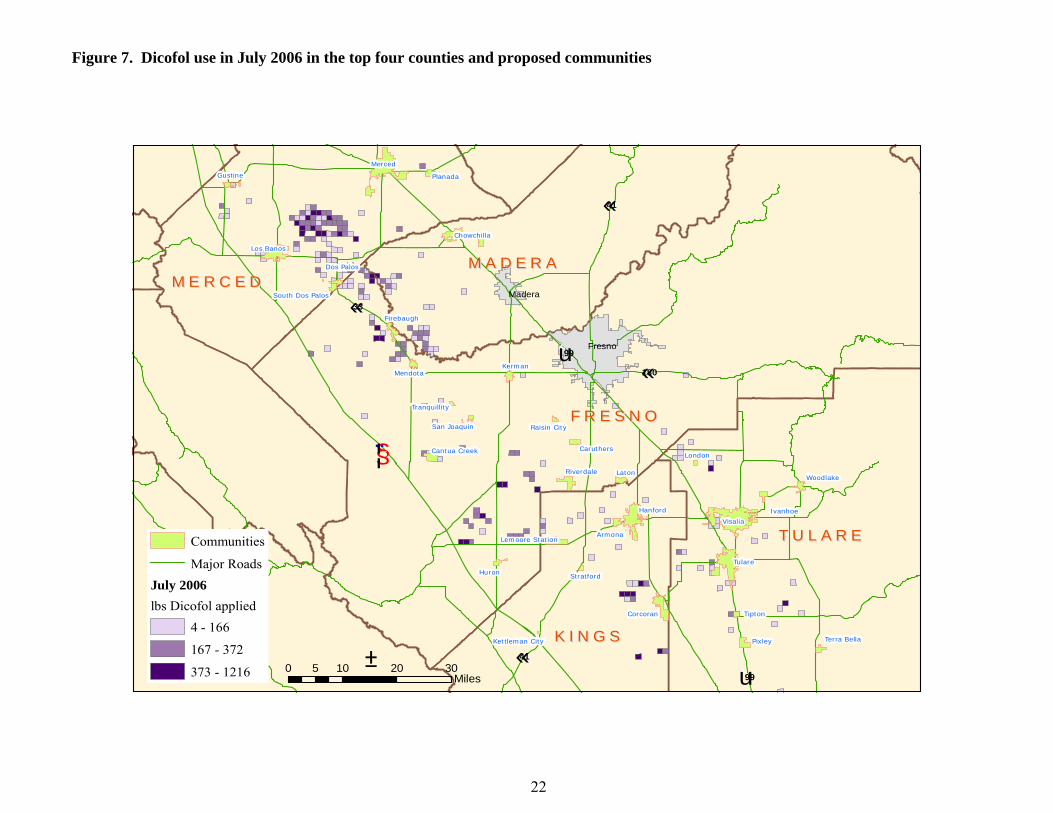
Figure 7. Dicofol use in July 2006 in the top four counties and proposed communities
§̈¦5
tu101
tu99
Merced
Gustine Planada
F R E S N OF R E S N O
M A D E R AM A D E R AM E R C E DM E R C E D
K I N G SK I N G S
T U L A R ET U L A R E
tu99
¬«180
¬«33
¬«41
Fresno
Madera
¬«41
Chowchilla
Los Banos
Dos Palos
South Dos Palos
Firebaugh
KermanMendota
Cantua Creek
Pixley
Woodlake
Caruthers
Huron
Riverdale
Tulare
Visalia
Corcoran
Terra Bella
Tipton
Ivanhoe
Stratford
Raisin City
Kettleman City
Hanford
Laton
London
Lemoore Station
Tranquillity
San Joaquin
ArmonaCommunities
Major RoadsJuly 2006lbs Dicofol applied
4 - 166
167 - 372
373 - 1216 0 10 20 305Miles
±
22
D. SAFETY RECOMMENDATIONS The following precautions are stated on the product labels and material safety data sheets. Most statements pertain to applicators. Therefore, these precautions are reference for monitoring staff. Product labels for the dicofol carry a Danger/Caution warning. Dicofol may burn on fire and containers may explode in the heat of fire to produce toxic products of hydrogen chloride and chlorine gas. Keep away from fire and sparks. It is poisonous by inhalation, skin contact, or swallowing. Do not breathe or contact dicofol. Inhalation or contact of dust or solvent formulations will irritate to eyes, nose, throat, lungs, and skin. Overexposure by any rout to chlorinated pesticides may cause nervousness and hyperactivity, headache, nausea, vomiting, unusual sensations and fatigue. Personal protection equipment includes coveralls over long-sleeved shirt and long pants, chemical resistant apron or other impervious clothing, goggles, gloves, footwear plus socks, headgear if overhead exposure, etc. E. REFERENCES DPR. 2008. Pesticide Chemistry Database. Department of Pesticide Regulation, Cal EPA.
Sacramento, California. EXTOXNET. 1996. Pesticide Information Profile, Dicofol. Extension Toxicology Network.
http://pmep.cce.cornell.edu/profiles/extoxnet/carbaryl-dicrotophos/dicofol-ext.html U.S. Census Bureau. 2000. Census 2000 Demographic Profile Highlights. American FactFinder.
http://factfinder.census.gov/home/saff/main.html?_lang=en US EPA. 1998. Reregistration Eligibility Decision (RED), Dicofol. EPA 738-R-98-018. Office of
Prevention, Pesticides and Toxic Substances, US Environmental Protection Agency. Washington, DC. http://www.epa.gov/oppsrrd1/REDs/0021red.pdf
Warmerdam, M.A. 2007. Proposed Toxic Air contaminant Monitoring for 2008. Department of
Pesticide Regulation, Cal EPA. Sacramento, California. http://www.cdpr.ca.gov/docs/emon/pubs/tac/recomm/reqst_08.pdf
WHO/FAO. 1996. Data Sheets on Pesticides, No. 81, Dicofol. World Health Organization and
Food and Agricultural Organization of the United Nations. IPCS INCHEM. http://www.inchem.org/documents/pds/pds/pest81_e.htm#1.3
23