Embed Size (px)
Citation preview

Use of Acoustic Emission in Gearbox Condition
Monitoring
RAM 7 WorkshopNovember 4th & 5th
Steven CarterRoush Industries

Condition Based Maintenance• Condition based maintenance(CBM) is the
practice of providing maintenance when needed.– Effective gearbox CBM is reliant on condition
indicators(CIs).– Current primary gear CIs are vibration,
temperature, and oil debris based.– Developing research is showing the benefits
of acoustic emission(AE) based CIs.
2

Outline
• Vibration based condition monitoring theory.
• Acoustic emission condition monitoring theory.• Current research on AEs applicability to gearbox
condition monitoring.• Theoretical comparison between AE and
vibration.
• Case study of data collected by Roush.
3
Vibration Based Gearbox Condition Monitoring
Collection of vibration data
Development of time synchronous averaged signal
Development of residual/difference
signal
Condition indicator calculation
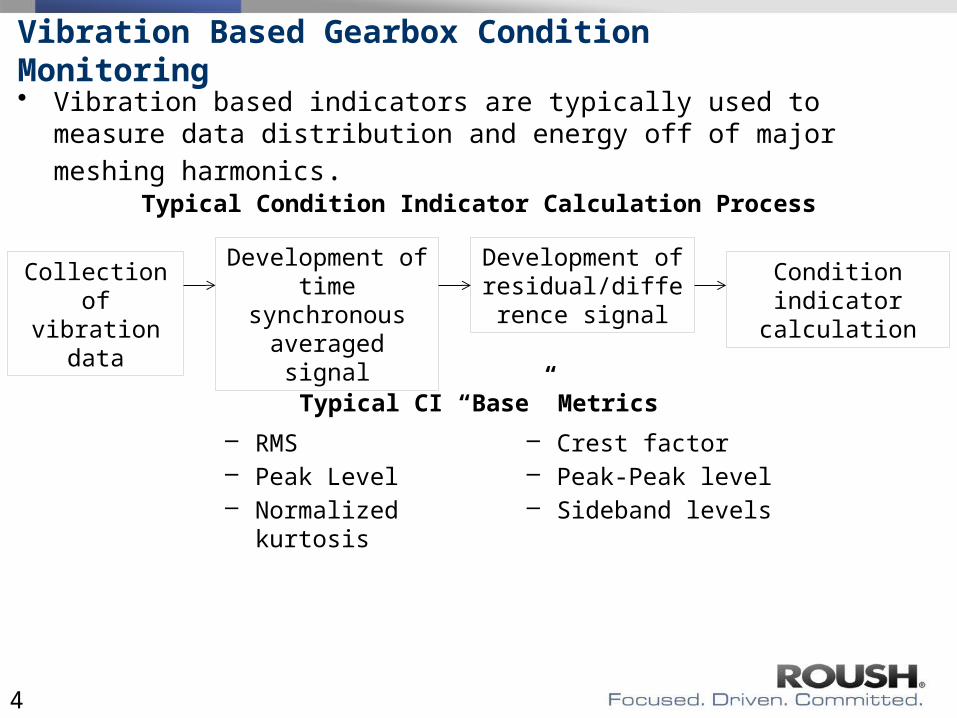
• Vibration based indicators are typically used to measure data distribution
and energy off of major meshing harmonics.
Typical Condition Indicator Calculation Process
– RMS– Peak Level– Normalized kurtosis
– Crest factor – Peak-Peak level– Sideband levels
Typical CI “Base” Metrics
4
Vibration Based Gearbox Condition Monitoring – Cont.
N
nn
n
dd
ddN
n
1
_ 2
_
N1
N1
2
1
4
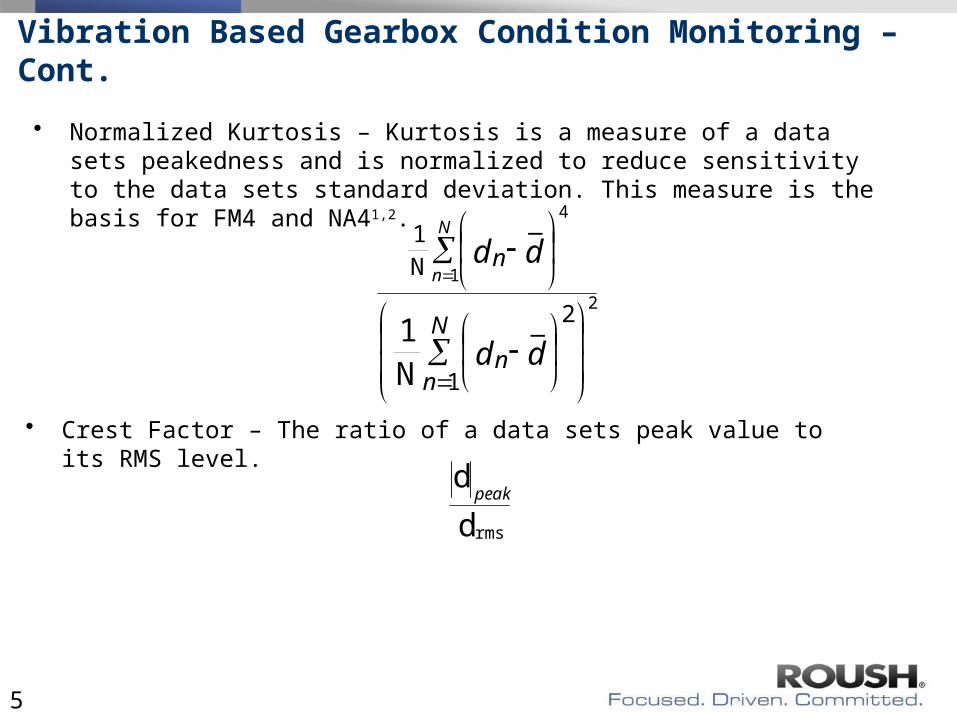
• Normalized Kurtosis – Kurtosis is a measure of a data sets peakedness and is normalized to reduce sensitivity to the data sets standard deviation. This measure is the basis for FM4 and NA41,2.
• Crest Factor – The ratio of a data sets peak value to its RMS level.
d
d
rms
peak
5

Vibration Based Gearbox Condition Monitoring – Cont.• FM0 – The ratio of a data sets peak-to-peak level to the sum of rms levels of
the main gear mesh harmonics1.
harmonicsmeshprimaryf i
peakpeak
n
iifd
d
• Sideband Levels – Several condition indicators exist which measure the amplitude of orders (typically first order sidebands) centered about the primary gear mesh frequency.
6

Acoustic Emission Theory - Background
• Acoustic emission is defined as transient elastic waves caused by the release of localized stress energy.
• Originally developed in the 1960s for static testing.• Very popular in non-destructive testing:
– Pipeline leak detection.– Structural health monitoring.
• Sensitive to crack formation in both metals and composites.
• Generally measured in the 100kHz to 1MHz frequency range.
• Relatively new to gearbox condition monitoring.
7
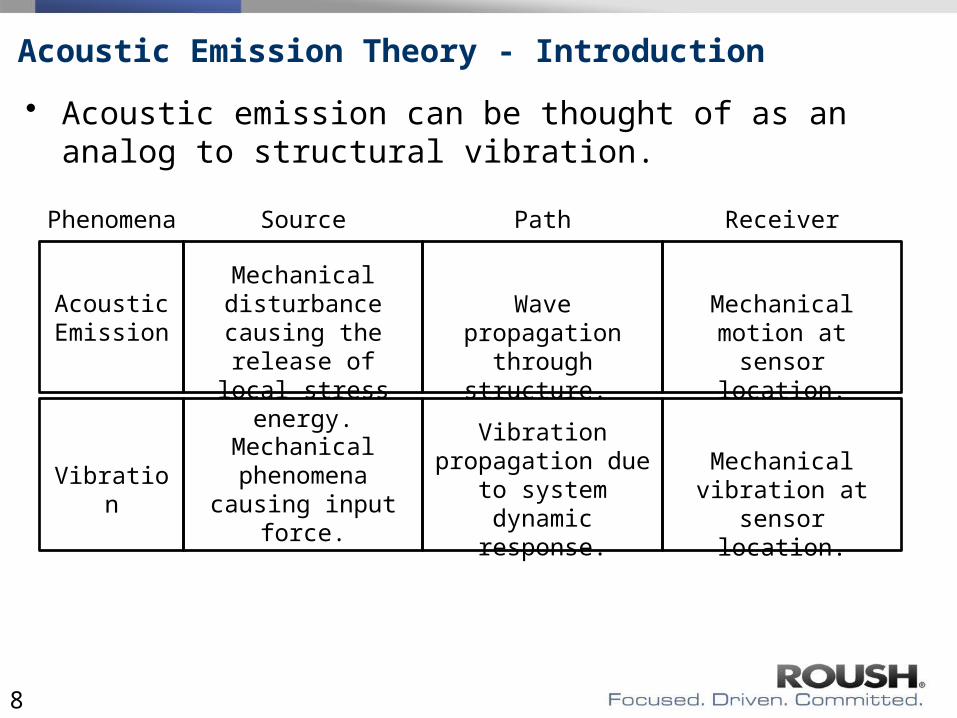
Acoustic Emission Theory - Introduction
• Acoustic emission can be thought of as an analog to structural vibration.
Mechanical disturbance causing the release of local
stress energy.
Wave propagation through structure.
Mechanical motion at sensor location.
Source Path Receiver
Mechanical phenomena causing
input force.
Vibration propagation due to
system dynamic response.
Mechanical vibration at sensor location.
Acoustic Emission
Vibration
Phenomena
8

Acoustic Emission Theory – Source
• AE events are caused are caused by the release of localized stress energy.
• Micro-cracks caused by fatigue, thermal loading, etc.• Crack initiation, crack propagation, plastic deformation,
impact, and friction.
Shifts in the materials micro-structure are common AE sources
9

Acoustic Emission Theory – Path
• AE waves are transmitted through the structure via Lamb and Rayleigh waves.
• Reduced sensitivity to mechanical resonance and outside noise due to frequency band and mode type.
Plate Motion for the Two Zero-order Lamb Wave Modes. Graphic, Wikipedia. Accessed October 19, 2014. http://en.wikipedia.org/wiki/Lamb_waves
Rayleigh wave motion process. Graphic. Accessed October 19, 2014. http://folk.uio.no/valeriem/spice/Frame/surfacew/index.html
Lamb Waves
Rayleigh Wave
Extensional Mode
Flexural Mode
10

Acoustic Emission Theory – Receiver
• AE energy is measured through piezo-electric transducers. • Transducers can have either a wideband or narrowband
frequency response.• Mounted in a similar manner to accelerometers.
– Silicone grease is typically used as a coupling agent.
• Sensors come in a variety of sizes and weights.
Kistler AE sensor used for testing at Roush
11
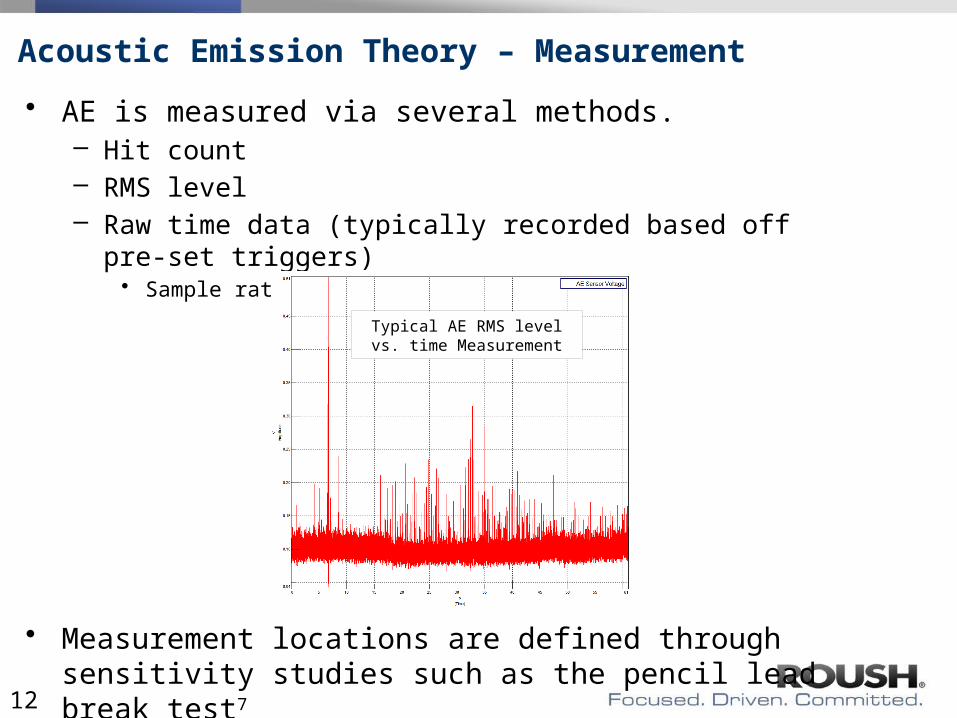
Acoustic Emission Theory – Measurement
• AE is measured via several methods.– Hit count– RMS level– Raw time data (typically recorded based off pre-set triggers)
• Sample rates vary up to 40MHz.
• Measurement locations are defined through sensitivity studies such as the pencil lead break test7
Typical AE RMS level vs. time Measurement
12

AE Based Gearbox Condition Monitoring – Previous Research• AE has been shown to identify faults faster then
vibration3, 5. – In one case it was noted that AE detected pitting at 8% pitted
area compared to vibration detecting pitting at 30% pitted area6.
• It has been shown that AE amplitude and energy increases with pitting5, 6.
• Torque appears to have a minimal effect on AE rms levels; however, gearbox speed does appear to have an effect5,6.
13

AE Based Gearbox Condition Monitoring – Previous Research• Heterodyne-based frequency reduction technique has
been successfully applied to sample AE at 100kHz3.
• Toutountzakis et al4 were able to measure the gear meshing AE transient response.– Unable to measure differences in AE data from seeded pitting.
• In particular, previous work by the Physical Acoustics Corporation (Mistras) has shown the success of acoustic emission when applied to a BV-107 helicopter8.
14

Acoustic Emission Vs. VibrationVibration
Measurement Source Phenomena:• Force variation/transmission error.
Pros/Cons:• Large body of research.• Ease of data acquisition.• Largely controlled by system
dynamics.• Dependent on total system vibration.• Complex signal processing.
Acoustic EmissionMeasurement SourcePhenomena:• Impulse from the release of
localized stress energy.
Pros/Cons:• Insensitivity to system dynamics and
total system vibration.• Potential to detect faults sooner.• Potentially high signal attenuation in
system.• Relatively small amount of research.• Actual source mechanism is not fully
understood3.• Potentially difficult data acquisition.• Potential simplicity of signal
processing.
15

Acoustic Emission Vs. Vibration
Vibration Acoustic Emission
Bottom Line: Vibration has historical prominence in gearbox condition monitoring but is fraught with difficulties.
Bottom Line: AE shows significant potential but much work is still required to fully understand its use in gearbox condition monitoring.
16

Brake
Drive Motor
Roush Test Stand
Gearbox Under Test
17

Roush Test Stand – Measurement Set-Up
Kistler AE Sensor
Sensor:Response:
Output:Measurement Method:
Kistler Model #8152B111Wideband – 200-500kHz filteredRMS – 0.12ms time constant60s RMS vs. time at 15-30min increments
Laser Tachometer for
Shaft Speed
18

Baseline Gearbox – AE Data
1.38HP, 7.2Nm Load Case (Estimated)
0.78HP, 4.1Nm Load Case (Estimated)
AE
Out
(V
olts
)
Typical AE Data AE Data Immediately Prior to Inspection
~16-20hrs of run time between these measurements.
Test-stand downtime
Consistent, high amplitude hits
19

This gear set started from a new condition and was ran intermittently for several months. Damage was found in a routine inspection after an uptick in AE activity was noticed.
High wear was seen on both the ring and pinion gear faces
Baseline Gearbox – Gear-Set – Post Run
20

Baseline Gearbox – Gear-Set – Post Run
21

0.1HP, 0.9Nm Load Case (Estimated)
0.78HP, 4.1Nm Load Case (Estimated)
Natural Wear Gearbox – AE Data
AE
Out
(V
olts
)
Test-stand downtime
Consistent, high amplitude
hits
22

This gear set started from a new condition and was ran for 5 days when significant wear was expected based on the AE data.
Wear was seen on both the ring and pinion gear faces
Natural Wear Gearbox – Gear-set – Post Run
23
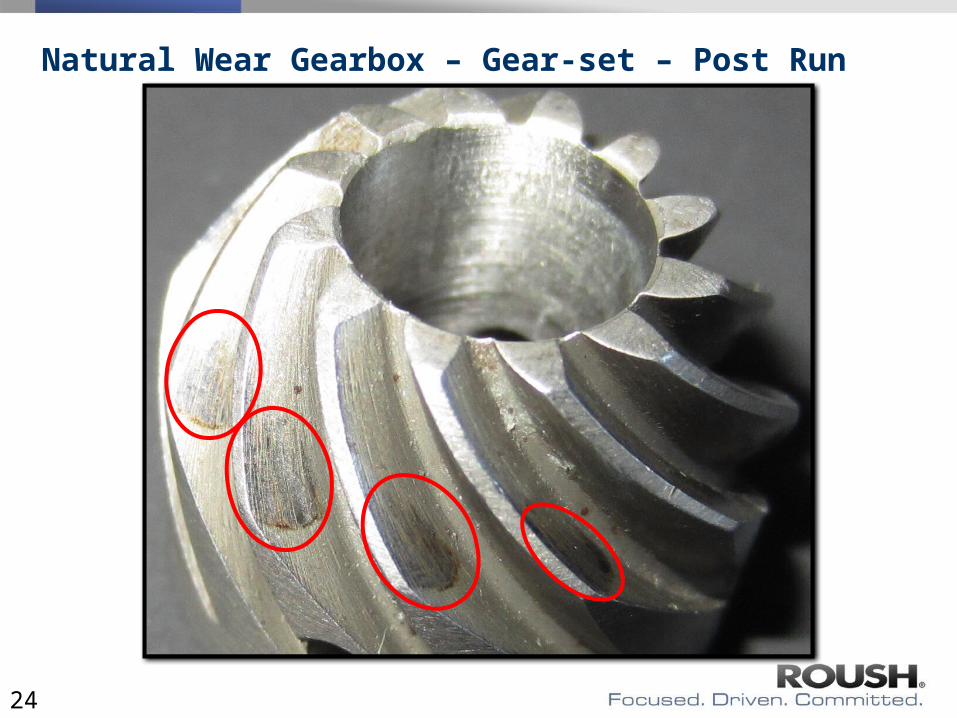
Natural Wear Gearbox – Gear-set – Post Run
24

Roush Testing - Findings
• While small compared to AE hits, the RMS level is sensitive to gearbox load.
• AE does not appear to be sensitive to seeded faults.• AE does appear to be sensitive to natural wear as
exhibited in the shown data.– Wear in gear sets.– Crack in bellows coupling.– Drive motor failure.
25

Questions?

References1. Zakrajsek James J. An Investigation of Gear Mesh Failure Prediction Techniques. NASA
Technical Memorandum 102340. 1989.
2. Antolick Lance J., Branning Jeremy S., Wade Daniel R., Dempsey Paula J. Evaluation of Gear Condition Indicator Performance on Rotorcraft Fleet. American Helicopter Society 66 th Annual Forum Conference Proceedings. 2010.
3. Yongzhi Qu, He David, Yoon Jae, Van Hecke Brandon, Bechhoefer Eric, Zhu Junda. Gearbox Tooth Cut Fault Diagnostics Using Acoustic Emission and Vibration Sensors – A Comparative Study. Sensors 14, no 1. 2014.
4. Tountountzakis Tim, Keong Tan Chee, Mba David. Application of Acoustic Emission to Seeded Gear Fault Detection, NDT&E International, Volume 38, Issue 1. 2005.
5. Tountountzakis Tim, Mba David. Observations of Acoustic Emission Activity During Gear Defect Diagnosis. NDT&E International, Volume 36, Issued 7. 2003.
6. Mba David. Prognostic Opportunities Offered by Acoustic Emission for Monitoring Bearings and Gearboxes. Twelfth International Congress on Sound and Vibration. 2005.
7. ASTM Standard E976, 2010. Standard Guide for Determining the Reproducibility of Acoustic Emission Sensor Response. ASTM International. West Conshohocken, PA. 2010. DOI: 10.1520/E0976-10. www.astm.org.
8. Application of Acoustic Emission to Health Monitoring of Helicopter Mechanical System. Physical Acoustics Corporation. www.pacndt.com.
27