Embed Size (px)
Citation preview
ICHEME SYMPOSIUM SERIES NO. 124
USE OF ACOUSTIC EMISSION IN INSPECTION INVESTIGATIONS WTTHTN TCT
S Heverdine ICI Engineering, PO Box 6, Billingham, Cleveland TS23 1LD
Use of Acoustic Emission Monitoring for inspection of pressure systems in ICI has increased rapidly over the past few years following improvements in equipment and software for data acquisition and analysis, together with understanding of its capabilities and limitations.
Two types of application are described in some detail and others listed.
Some views are given of the future applications of the technique in the process industry.
INTRODUCTION
Although it is still considered a 'new' NDT technique, acoustic emission monitoring has been around for about 20 years; some would say longer. However, it is only in the last few years that ICI has started to apply the technique to some of its more difficult inspection problems.
This paper briefly explains the principles of acoustic emission monitoring, some of its advantages over more conventional NDT techniques and some of its limitations; it finally describes some of the more recent applications.
WHAT IS ACOUSTIC EMISSION?
The technique depends on the principle that a growing defect in a structure creates a stress wave which propagates through the structure and can be detected using low frequency piezo-electric transducers, similar to conventional ultrasonic transducers. The stress waves are converted into electronic pulses which are then amplified, stored and analysed to provide information about the growing defect.
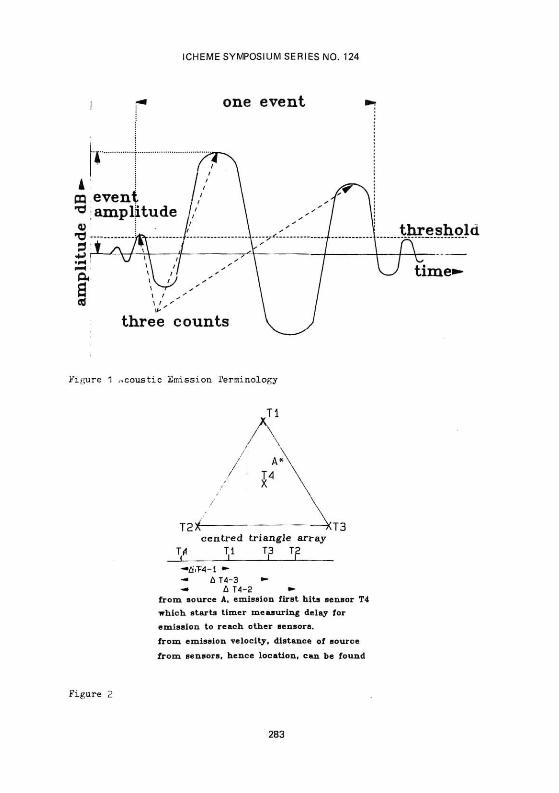
A typical stress wave signal is represented in Figure 1, together with various characteristics of the signal which are used in the analysis.
If growth of defects occurs during normal operation of, say, a pressure vessel then acoustic emission will also occur. However, detection of these emissions may be very difficult because they may be small in relation to the background noise level, eg from pumps/valves, fluid flow. Although improvements can be made by filtering the signals this is not always successful, and the time intervals over which monitoring must be carried out can be very long. For these reasons AE monitoring is normally carried out periodically during overpressurisation of the vessel, eg during hydrotest, when a series of transducers is attached to the external surface of the vessel to allow detection of signals emitted from any part of the vessel.

ICHEME SYMPOSIUM SERIES NO. 124
LOCATION OF ACOUSTIC EMISSION SOURCES
In the early days of the application of AE monitoring to process plant equipment, considerable emphasis was placed on location of emission sources, ie defects. This relied on detection of signals from a source by at least three transducers arranged in a triangular array, as shown in Figure 2. Measurement of the time intervals between detection of the signals by the respective transducers was used to locate the source of the emission by means of triangulation.
One limitation of this method of location is that immediately a transducer has detected a signal it becomes inactive for a period to allow detection of the signal by other transducers. It has since been established that 'locking out' of transducers in this way can result in over 901 of valid acoustic emission activity being rejected, and hence analysis being carried out on a very small proportion of the total available data.
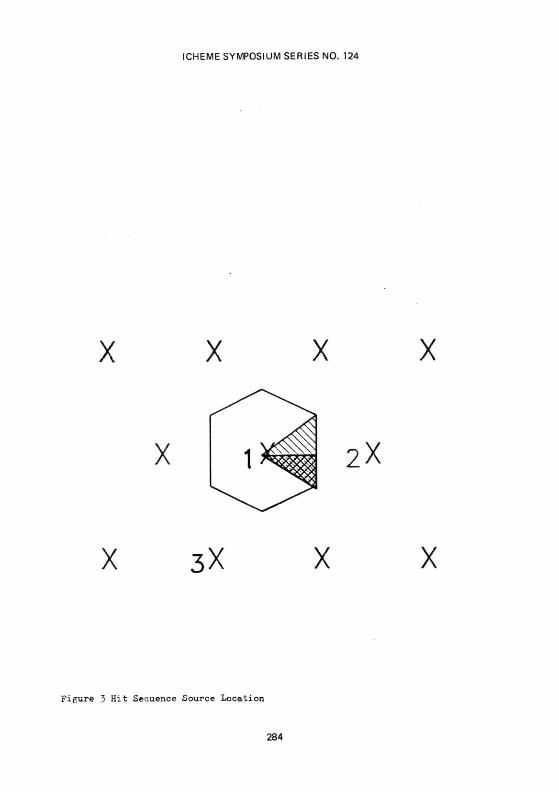
The preferred method of source location is based on hit sequence as shown in Figure 3. This method results in less precise source location but allows acquisition and analysis of all detectable signals, thus giving much more information about the overall level of acoustic emission and the sources giving rise to that activity.
The overall level of AE activity detected by any sensor is assessed according to empirically derived criteria and graded qualitatively from A to E. Table 1 lists the follow-up actions recommended based on these gradings.
Advantages and Disadvantages
Table 2 lists the main advantages and disadvantages of acoustic emission monitoring:
Advantages. Monitoring is carried out from the outside of the vessel and hence entry, cleaning and access are not required.
Unlike conventional NDT methods which are localised in their application, the whole of a vessel can be monitored simultaneously.
Only active defects are detected, ie provided that the monitoring conditions are related to actual operating conditions, then only those defects which will have significance for the ongoing integrity of the vessel will be detected.
Disadvantages. The size of defects cannot be quantified and hence conventional NDT methods, eg ultrasonics, must be used, but the AE data can be used to direct inspection to the relevant parts of the vessel.
Overpressurisation of the vessel is required and hence some disruption to normal operation is necessary, but this is much less than is normally required for conventional inspection.
APPLICATIONS
To date acoustic emission monitoring has been used by ICI to achieve two different, but related, objectives:
1. As a means to extend the interval between conventional internal vessel inspections while maintaining the required level of integrity.
278

ICHEME SYMPOSIUM SERIES NO. 124
2 As an additional degree of safety during 'difficult' pressure tests, eg hydrotests on thick-walled pressure vessels, pneumatic pressure tests.
Examples of these two types of application will now be described.
1 Acoustic Emission Monitoring of Absorption Columns during Hvdrotest
In the recent past the inspection interval for these vessels has been limited by the need to detect and remove stress corrosion cracking before it reaches a critical extent, resulting in a maximum operating interval of two years. Improvements in understanding of the SCC process combined with better process control has reduced the incidence and rate of SCC growth. This, combined with increased economic pressure to maintain plant operation for longer periods has led to a review of inspection intervals and possible means for extending these intervals. The potential of AE monitoring for establishing the absence, or if present, the severity and location, of SCC has recently been assessed.
It was initially hoped that AE monitoring could be carried out during a period of overpressurisation with the plant on line. However, for various operational reasons this proved to be impractical and so it was decided to carry out AE monitoring during hydrotest at the start of a planned shutdown. This was followed by entry of the vessel and full internal inspection with magnetic particle flaw detection of all accessible welds. The results from the conventional NDT were compared with those from the AE monitoring, a very good correlation being obtained in all areas of AE activity.
It was then decided that when the next column inspection (on a second identical column) became due, a hydrotest with AE monitoring would be carried out and if the level of AE activity were no higher than during the previous test then the plant would be returned to service for a further 12 months with no additional work on the column.
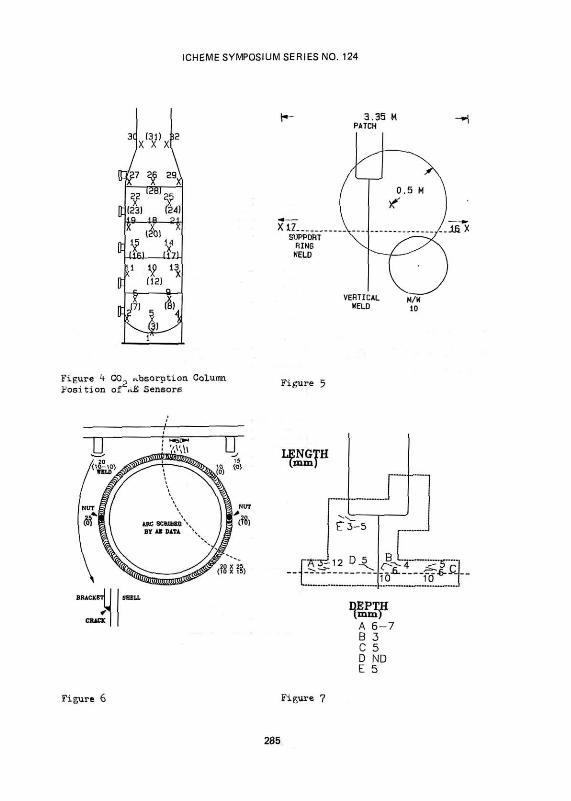
The layout of transducers for these tests is shown in Figure 4. The overall level of activity detected during the second hydrotest was substantially lower than that detected during the first, the main concentration of activity being in two areas, local to sensors 16, 17 and 26.
The activity local to sensors 16/17 was of sufficiently high amplitude to allow time interval simulation location to isolate the area of activity to within a radius of 0.5 m. The weld configuration in this area is shown in Figure 5. All welds in the area were examined, including internal attachment welds of the tnanway.
Magnetic particle flaw detection (MPFD) of these internal welds revealed a small number of defects, all of which were acceptable and were probably present at the previous internal inspection (see Figure 6).
External ultrasonic flaw detection of weld seams revealed a number of defects as indicated in Figure 7. However, these were on the external surface of the column and were shown to be associated with cleat attachment welds. Nevertheless, these defects were almost certainly the source of the AE activity.
279

ICHEME SYMPOSIUM SERIES NO. 124
Activity in the area of sensor 26 was initially believed to result from a small leaking flange, however, post-test data analysis indicated that not all the activity could be explained by the leak. The level of activity was lower than that around sensors 16/17, and so no further action was taken.
The column was returned to service for a further 12 months, after which it will again be subject to hydrotest with acoustic emission monitoring prior to full internal inspection.
2 Acoustic Emission Monitoring of Nitric Acid Columns During Pneumatic Pressure Test
Repairs and modifications were recently carried out on two thin-walled austenitic steel columns which then required pressure testing to re-validate them prior to returning to service. Since they are vertical columns which were originally hydroteated in the horizontal position, it was not possible to repeat the hydrotest and so a pneumatic pressure test was necessary.
As this was to become the largest pneumatic test carried out on an 1CI site there was considerable concern about the risks involved and all possible precautions were taken to ensure the integrity of the columns during the pressure test. These precautions included acoustic emission monitoring to give early warning of any significant defect growth which might occur during the pressure test.
The primary objective was to ensure a safe pneumatic pressure test, but an important secondary purpose of the AE monitoring was to detect and locate any areas of AE activity which could have resulted from sub-critical crack growth, requiring further investigation.
The primary objective was achieved in that a satisfactory pneumatic pressure test was completed on each column. However, there was a certain amount of AE activity which required further consideration.
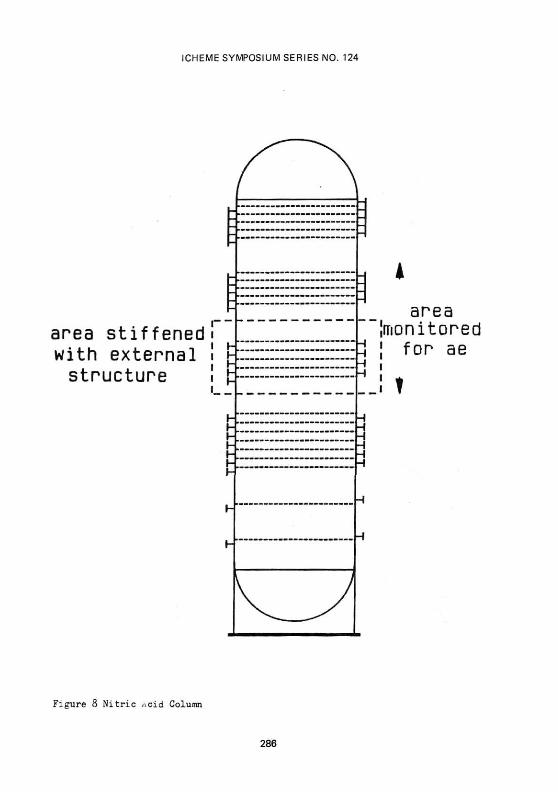
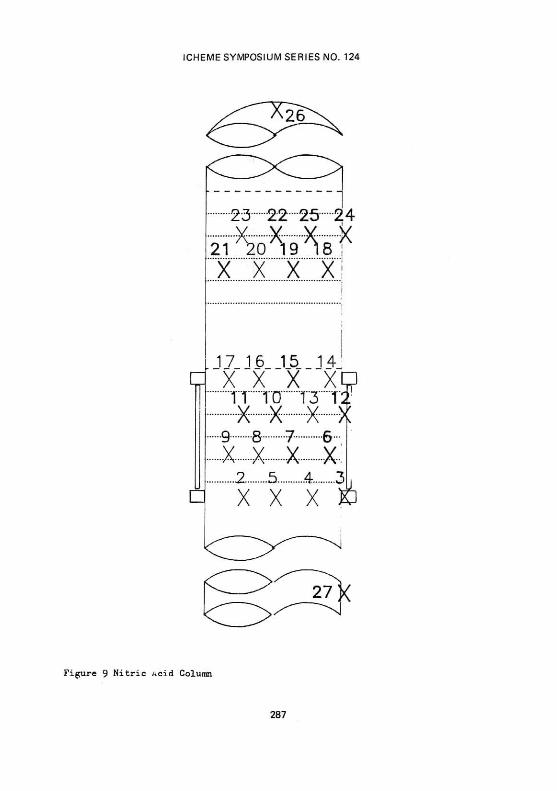
The main modifications to the columns and the layout of the AE sensors is shown in Figures 8 and 9. Each column was tested separately to minimise the amount of stored energy involved.
In the case of both columns, there was substantial relative movement of the column and its support structure during the pressure test, giving rise to a large amount of mechanical noise which it was difficult to filter from genuine AE activity. This was particularly so for one column which suffered high winds and rain during the test.
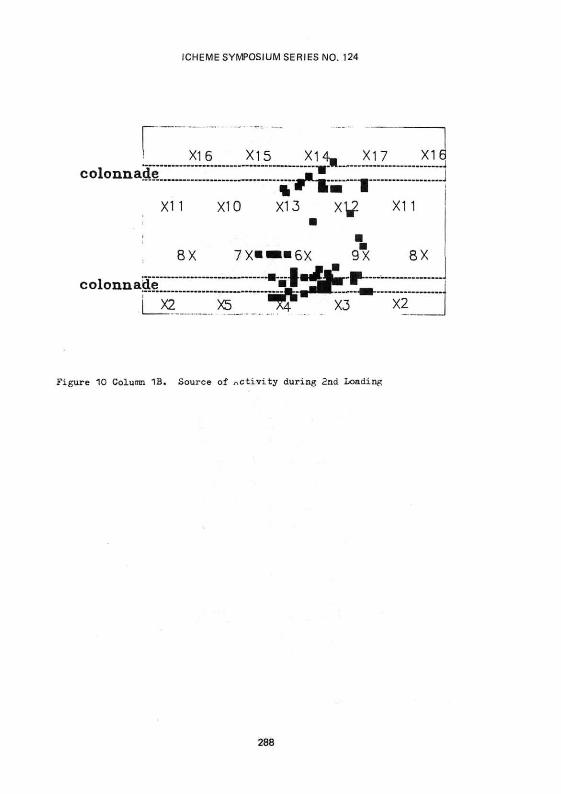
Continuing activity during final pressure hold was recorded for each column (see Figure 10), most of which was associated with external structural welds rather than the pressure shell itself, and hence did not give cause for concern. There were also small areas of limited activity which were considered only minor and will therefore be examined at the next scheduled plant overhaul.
280

ICHEME SYMPOSIUM SERIES NO. 124
CONCLUSIONS
These are a couple of the applications of acoustic emission monitoring in ICI, the list of which is growing rapidly and now also includes:
ammonia storage spheres HF storage vessel austenitic steel reaction vessels deaerators high pressure boiler drums thick-walled converters
With careful consideration of the objectives and hence the test conditions required, together with interpretation of the findings in terms of their implications for the ongoing integrity of the vessel, it is certain that many more 'successful' applications will be found within ICI for acoustic emission monitoring.
ICI is also keen to see wider use of the technique within the chemical and process industries as a means of monitoring plant condition and hence add to the ongoing safety and reliability of plant equipment.
To this end, we are actively promoting the setting up of a European AE Users' Group to share experiences in its use, possibly by means of a database of applications and to encourage the production of codes and standards covering its use in this area.
In addition, we are participating in a Working Party set up by the International Process Safety Group (IPSG) of the Institution of Chemical Engineers which is currently revising a booklet, 'Guidance Notes on the Use of Acoustic Emission Testing in Process Plants', first produced in 1985. The Working Party consists of representatives of various chemical manufacturers: Shell, Norsk Hydro, Monsanto, Rhone-Poulenc, ICI, together with British Steel and National Vulcan.
The Guidance Notes are based on experience from the representative organisations and other contributors, and further advice and assistance is to be sought from other member companies of the IPSG to ensure the guidance given is as widely relevant and authoritative as possible.
281
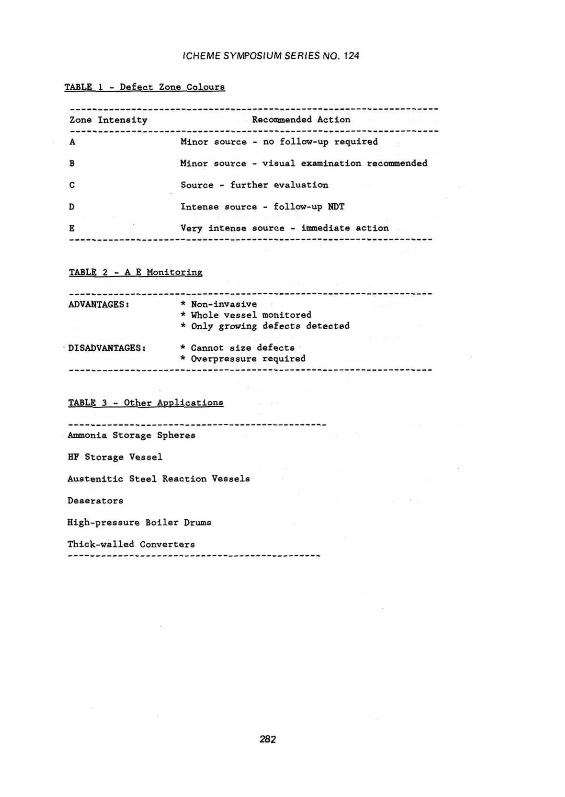
ICHEME SYMPOSIUM SERIES NO. 124
TABLE 1 - Defect Zone Colours
Zone Intensity Recommended Action
A Minor source - no follow-up required
B Minor source - visual examination recommended
C Source - further evaluation
D Intense source - follow-up NDT
E Very intense source - immediate action
TABLE 2 - A E Monitoring
ADVANTAGES: * Non-invasive * Whole vessel monitored * Only growing defects detected
DISADVANTAGES: * Cannot size defects * Overpressure required
TABLE 3 - Other Applications
Ammonia Storage Spheres
HF Storage Vessel
Austenitic Steel Reaction Vessels
Deaerators
High-pressure Boiler Drums
Thick-walled Converters
282
ICHEME SYMPOSIUM SERIES NO. 124
one event
Figure 1 acoustic Emission Terminology
Tl
c e n t r e d t r i ang le a r r ay
V V T,3 T?
- AT4-3 *-«• A T4-2 »-
from source A, emission first hits sensor T4 which starts timer measuring delay for emission to reach other sensors. from emission velocity, distance of source from sensors, hence location, can be found
threshold
Figure 2
283
ICHEME SYMPOSIUM SERIES NO. 124
X X X X
X 2X
X 3X X X
Figure 3 Hit Senuence Source Location
284
ICHEME SYMPOSIUM SERIES NO. 124
3C (31) .12 X X X
J (23) (24) 3 — I B — 2 4
u
? 29.
(&) 15 14
iiEj dfo fc1 V , ^
(12)
,17)
Figure h CO absorption Column Position of u£ Sensore
Figure 5
LENGTH (mm)
£"3-5
7T3 i l 2 D 5 _ . 10 10
CL-
DEPTH (mm) A 6 - 7 B 3 C 5 D ND E 5
Figure 6 Figure 7
285
ICHEME SYMPOSIUM SERIES NO. 124
area stiffened with external structure
-1
1 h 1 1-l P
h h
H \-f-H h h
H
— --
^ H H H
H H H H H H
H
4
area [monitored J for ae i
! I
Figure 8 N i t r i c ncid Column
286
ICHEME SYMPOSIUM SERIES NO. 124
L:
c
2 3 2 2 " " 2 5 24
"x x x x"!
L_1_7_J6__1_5_14_ "x"x"x"xg
T! X
9 x
2. X
TO X
•8 •X
5.. X
T3 X
4, X
r: X
6 X
Figure 9 Nitric Acid Column
287
ICHEME SYMPOSIUM SERIES NO. 124
X16 X15 X l ^ X17 X16 colonnade m*
1»*W 1 X11 X10 X13 x y X11
• •
8X 7X"™«6X 9X 8X colonnade
X2 X5 X3 X2
Figure 10 Column 1B. Source of activity during 2nd Loading
288


![SENTRO - Acoustic Emission Presentation [2016]](https://img.pdfslide.net/doc/110x75/5875c8511a28ab33128b6abf/sentro-acoustic-emission-presentation-2016.jpg)


