Embed Size (px)
Citation preview
Managing occupational alertness makes good business sense
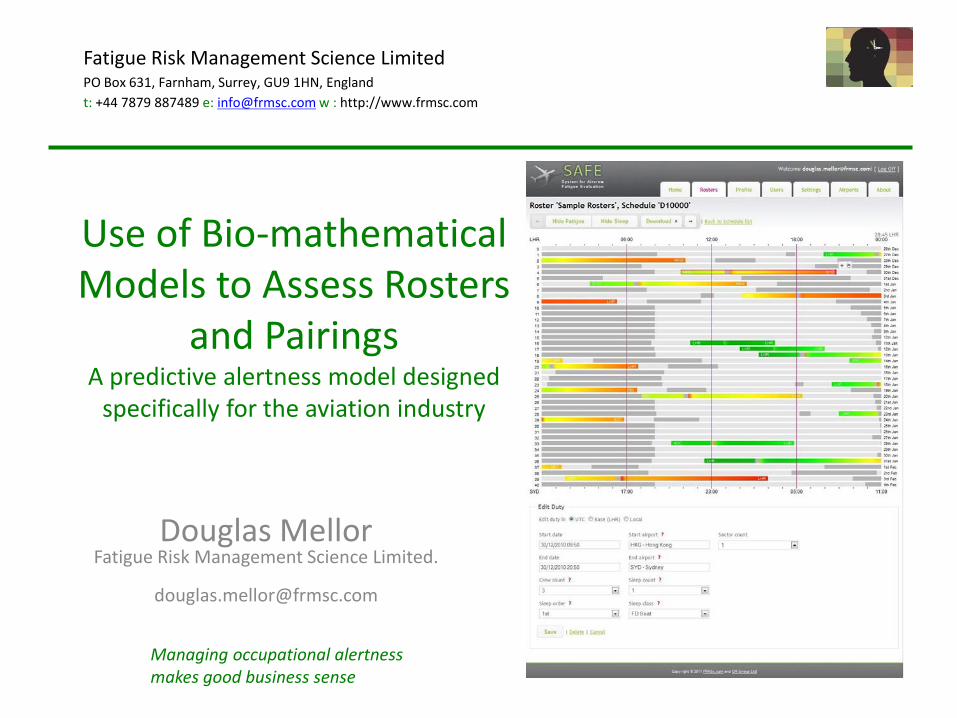
Use of Bio-mathematical Models to Assess Rosters
and Pairings A predictive alertness model designed
specifically for the aviation industry
Douglas Mellor Fatigue Risk Management Science Limited.
Fatigue Risk Management Science Limited PO Box 631, Farnham, Surrey, GU9 1HN, England t: +44 7879 887489 e: [email protected] w : http://www.frmsc.com
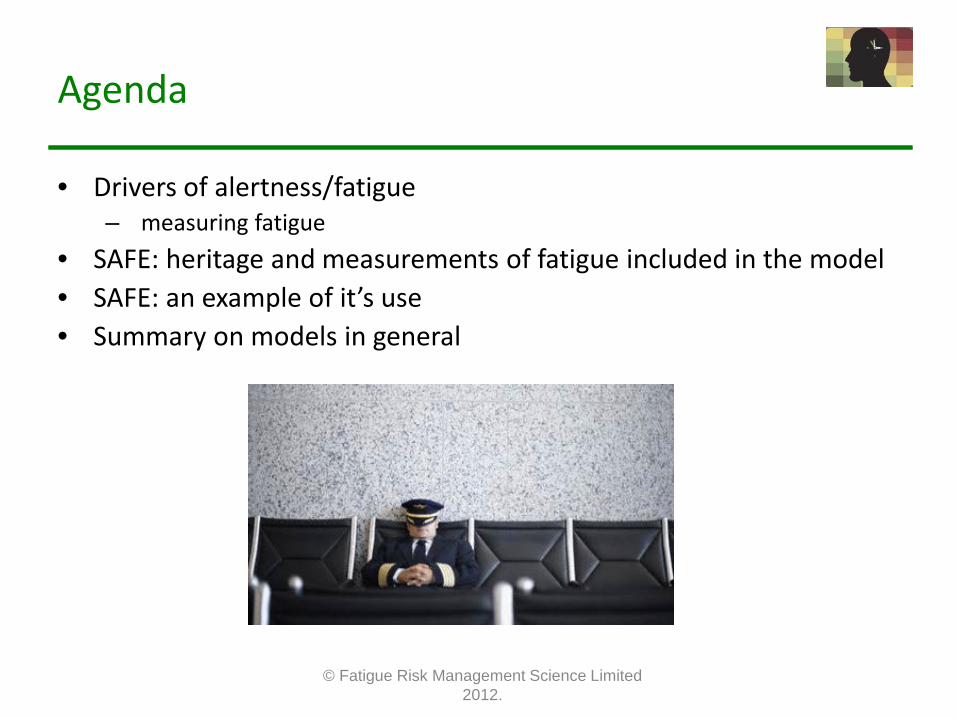
Agenda
• Drivers of alertness/fatigue – measuring fatigue
• SAFE: heritage and measurements of fatigue included in the model • SAFE: an example of it’s use • Summary on models in general
© Fatigue Risk Management Science Limited 2012.
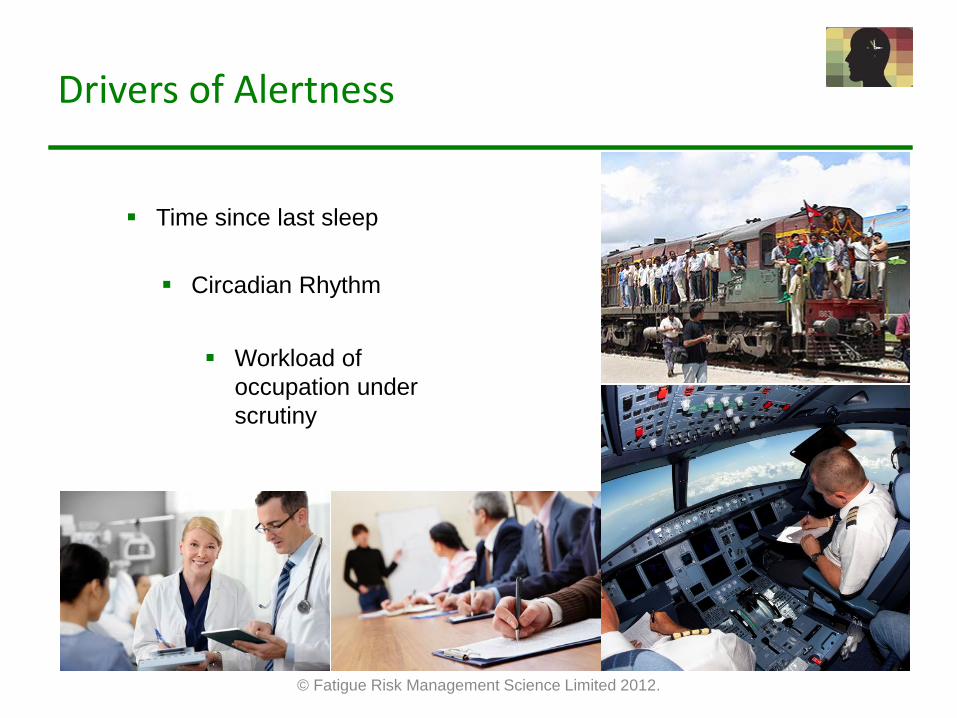
Drivers of Alertness
© Fatigue Risk Management Science Limited 2012.
Time since last sleep
Circadian Rhythm
Workload of occupation under scrutiny
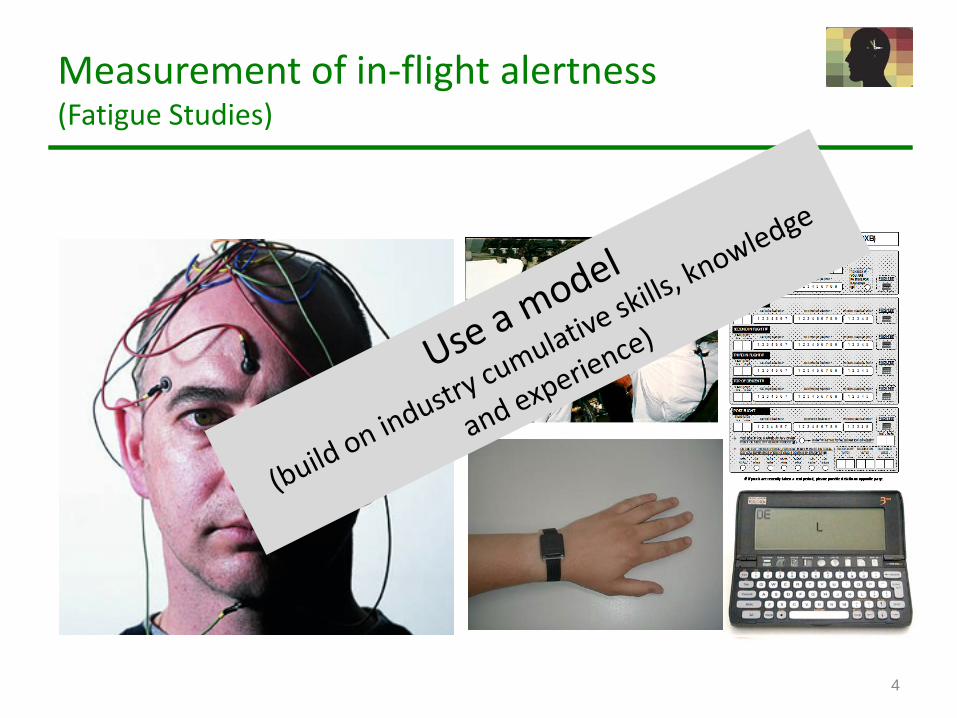
Measurement of in-flight alertness (Fatigue Studies)
4
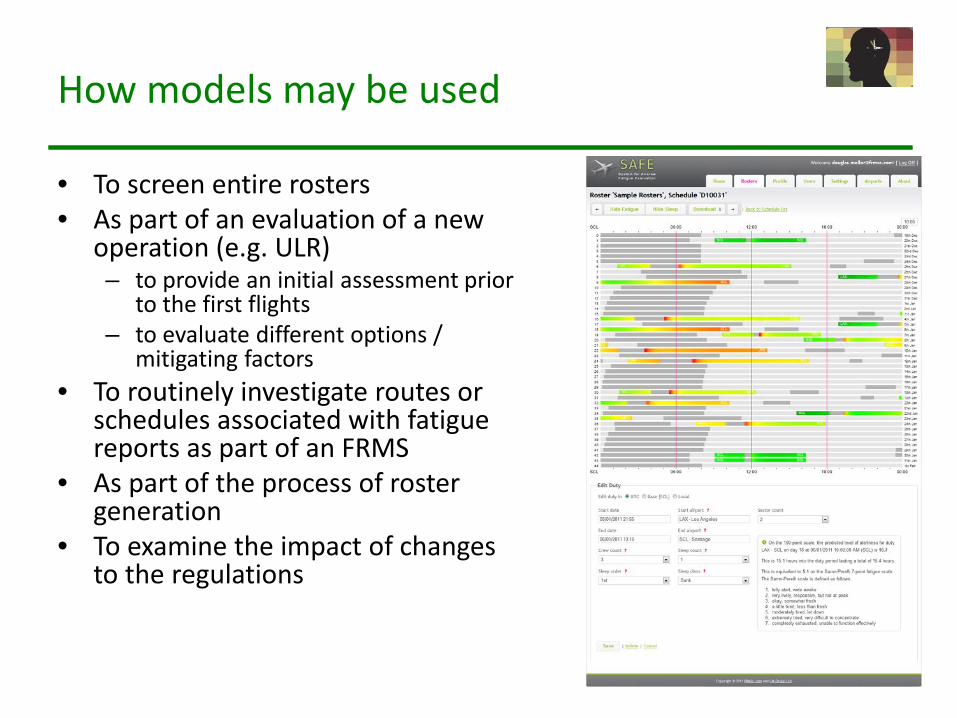
How models may be used
• To screen entire rosters • As part of an evaluation of a new
operation (e.g. ULR) – to provide an initial assessment prior
to the first flights – to evaluate different options /
mitigating factors • To routinely investigate routes or
schedules associated with fatigue reports as part of an FRMS
• As part of the process of roster generation
• To examine the impact of changes to the regulations
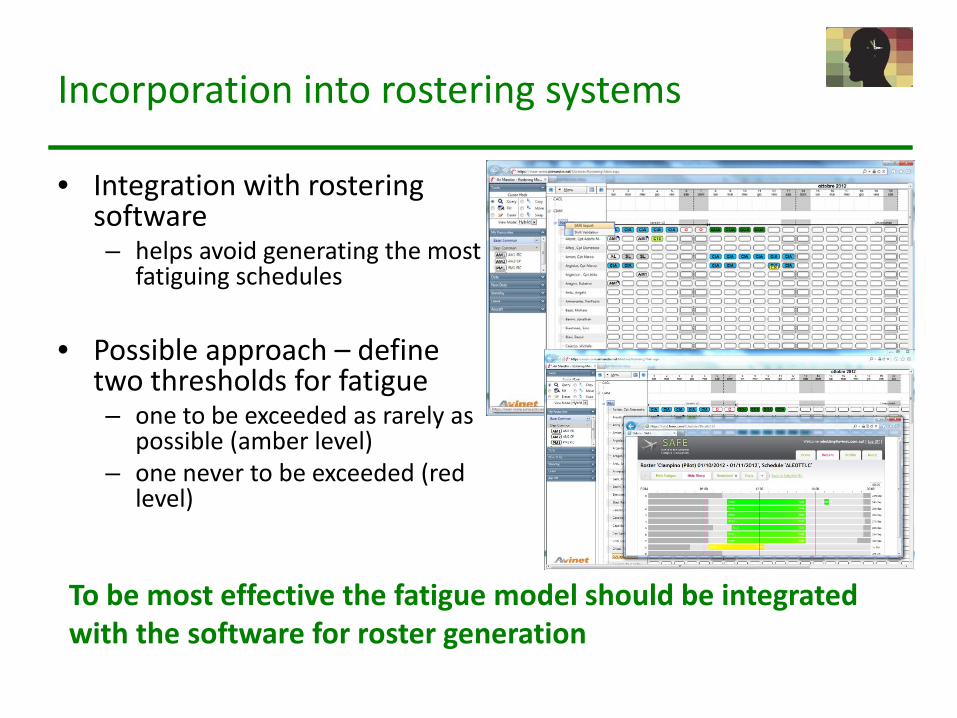
Incorporation into rostering systems
• Integration with rostering software – helps avoid generating the most
fatiguing schedules
• Possible approach – define two thresholds for fatigue – one to be exceeded as rarely as
possible (amber level) – one never to be exceeded (red
level)
To be most effective the fatigue model should be integrated with the software for roster generation
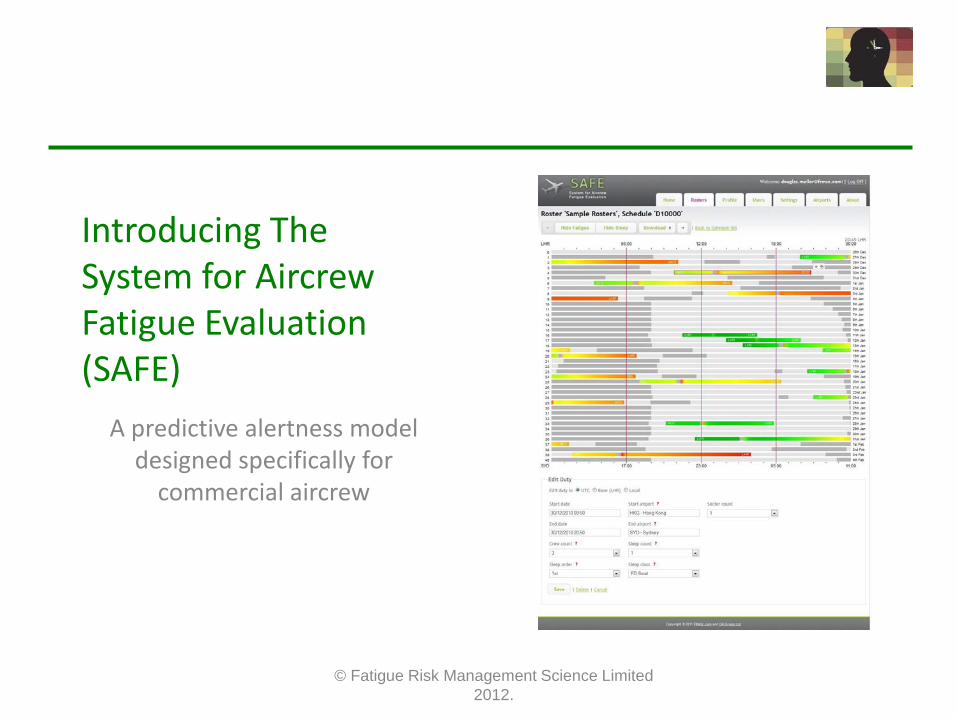
Introducing The System for Aircrew Fatigue Evaluation (SAFE)
A predictive alertness model designed specifically for
commercial aircrew
© Fatigue Risk Management Science Limited 2012.
8
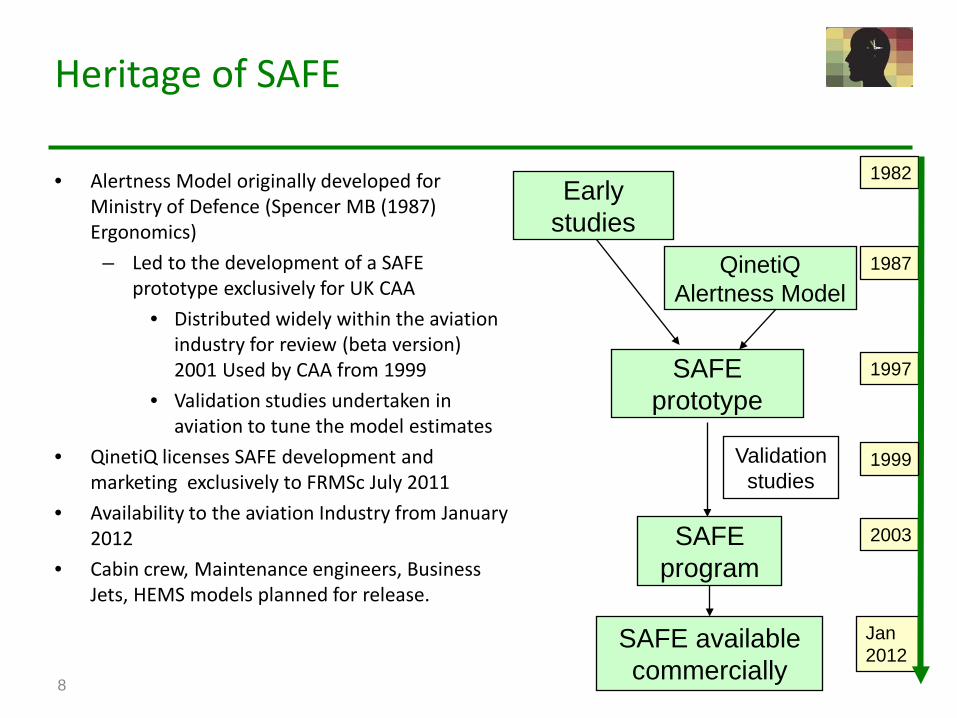
Heritage of SAFE
• Alertness Model originally developed for Ministry of Defence (Spencer MB (1987) Ergonomics)
– Led to the development of a SAFE prototype exclusively for UK CAA
• Distributed widely within the aviation industry for review (beta version) 2001 Used by CAA from 1999
• Validation studies undertaken in aviation to tune the model estimates
• QinetiQ licenses SAFE development and marketing exclusively to FRMSc July 2011
• Availability to the aviation Industry from January 2012
• Cabin crew, Maintenance engineers, Business Jets, HEMS models planned for release.
Early studies
SAFE prototype
SAFE program
Validation studies
QinetiQ Alertness Model
1982
2003
1987
1997
Jan 2012
SAFE available commercially
1999
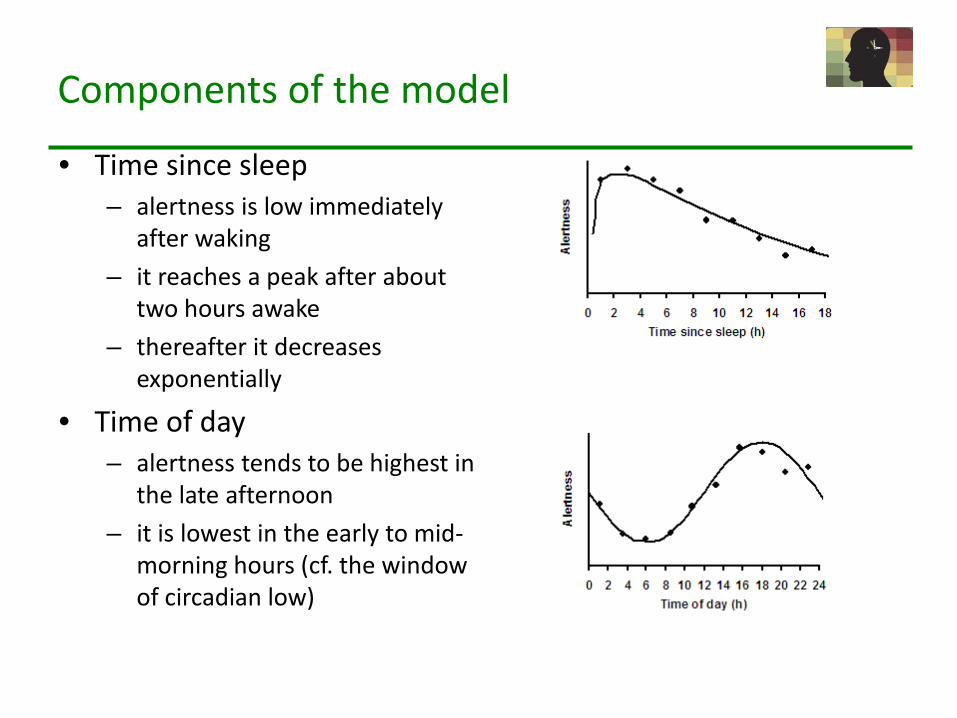
Components of the model
• Time since sleep – alertness is low immediately
after waking – it reaches a peak after about
two hours awake – thereafter it decreases
exponentially
• Time of day – alertness tends to be highest in
the late afternoon – it is lowest in the early to mid-
morning hours (cf. the window of circadian low)
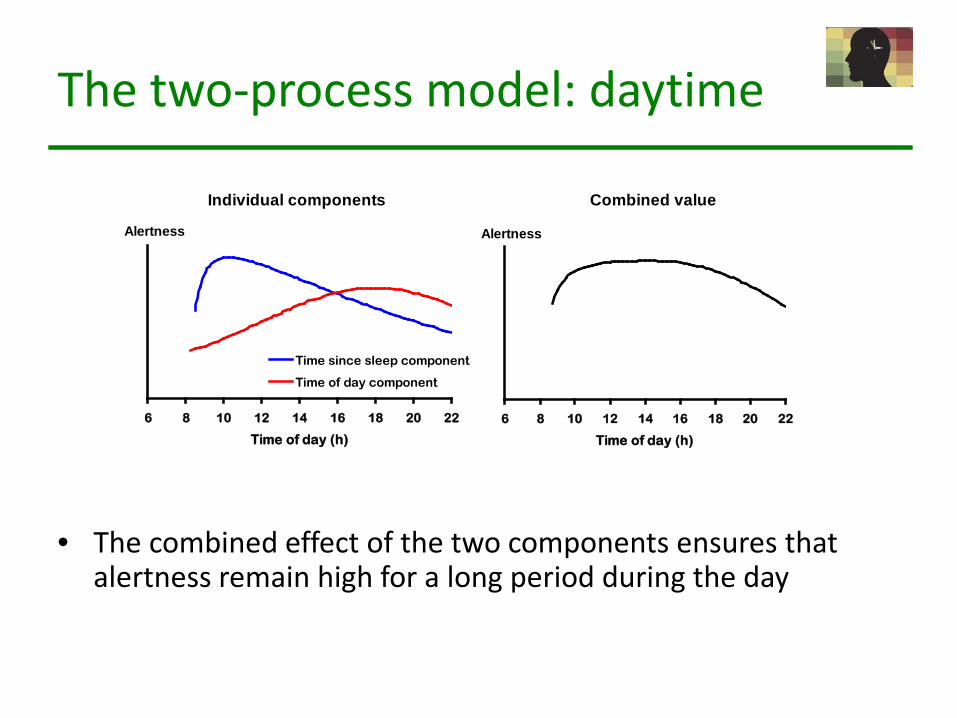
The two-process model: daytime
• The combined effect of the two components ensures that alertness remain high for a long period during the day
© frms int ltd.
Individual components
0
10
20
30
40
50
60
6 8 10 12 14 16 18 20 22
Time of day (h)
Alertness
Time since sleep component
Time of day component
Combined value
0
10
20
30
40
50
60
70
6 8 10 12 14 16 18 20 22
Time of day (h)
Alertness
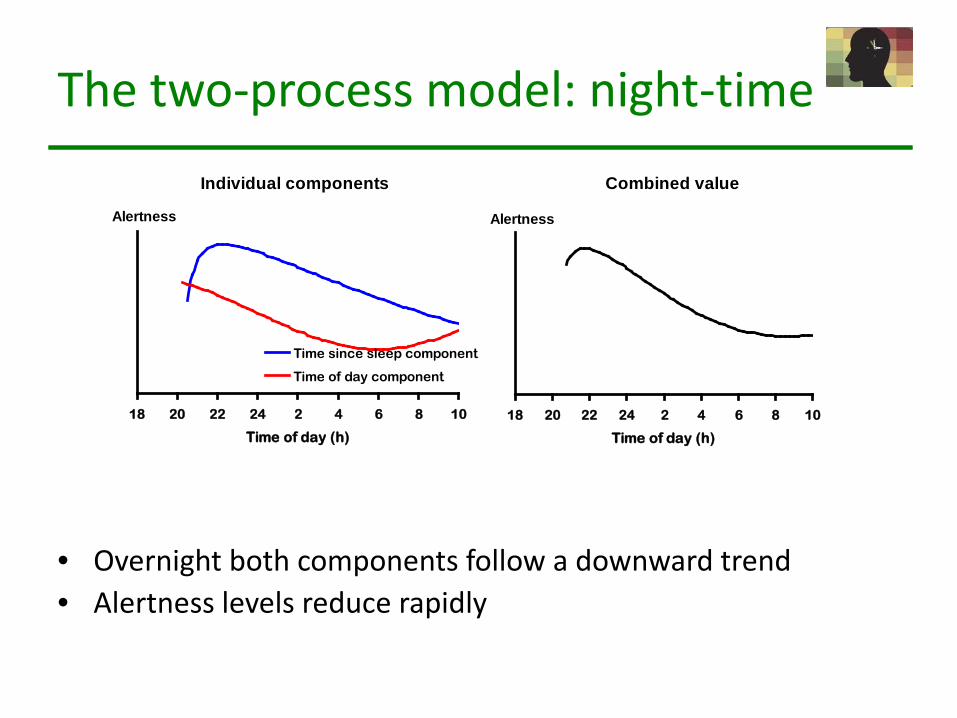
The two-process model: night-time
• Overnight both components follow a downward trend • Alertness levels reduce rapidly
Individual components
0
10
20
30
40
50
60
18 20 22 24 2 4 6 8 10
Time of day (h)
Alertness
Time since sleep component
Time of day component
Combined value
0
10
20
30
40
50
60
70
80
18 20 22 24 2 4 6 8 10
Time of day (h)
Alertness
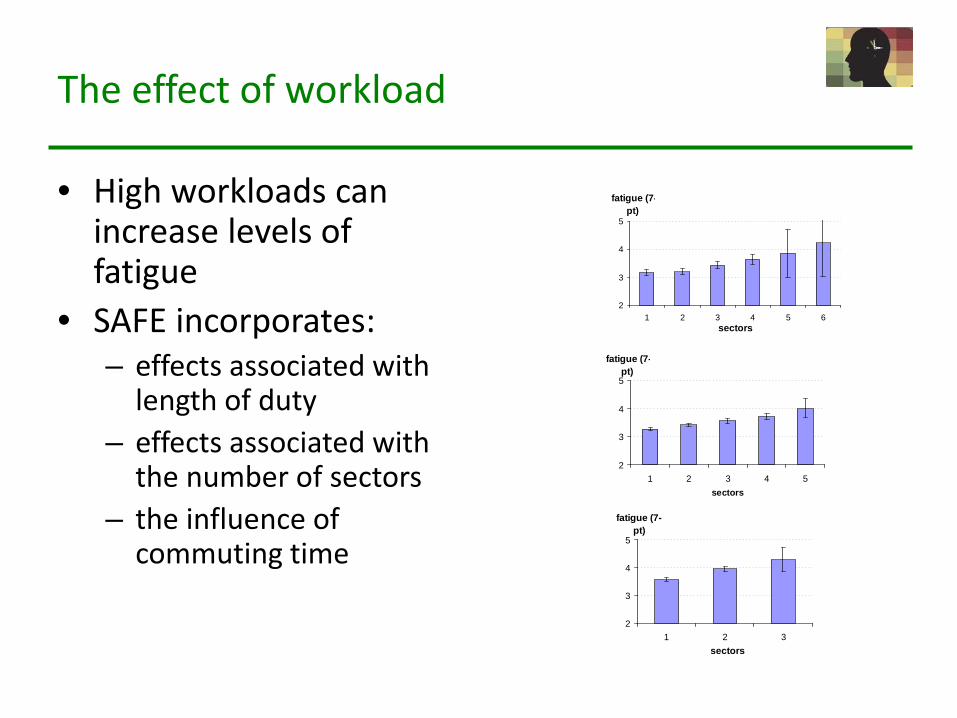
The effect of workload
• High workloads can increase levels of fatigue
• SAFE incorporates: – effects associated with
length of duty – effects associated with
the number of sectors – the influence of
commuting time
2
3
4
5
1 2 3 4 5 6sectors
fatigue (7-pt)
2
3
4
5
1 2 3 4 5sectors
fatigue (7-pt)
2
3
4
5
1 2 3sectors
fatigue (7-pt)
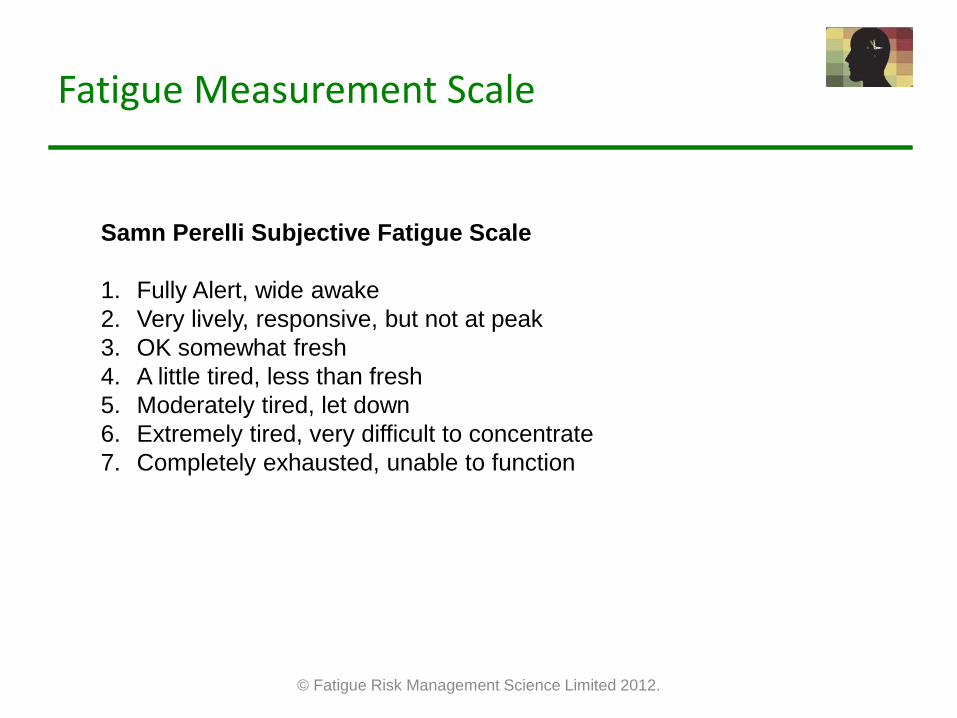
Fatigue Measurement Scale
© Fatigue Risk Management Science Limited 2012.
Samn Perelli Subjective Fatigue Scale
1. Fully Alert, wide awake 2. Very lively, responsive, but not at peak 3. OK somewhat fresh 4. A little tired, less than fresh 5. Moderately tired, let down 6. Extremely tired, very difficult to concentrate 7. Completely exhausted, unable to function
14
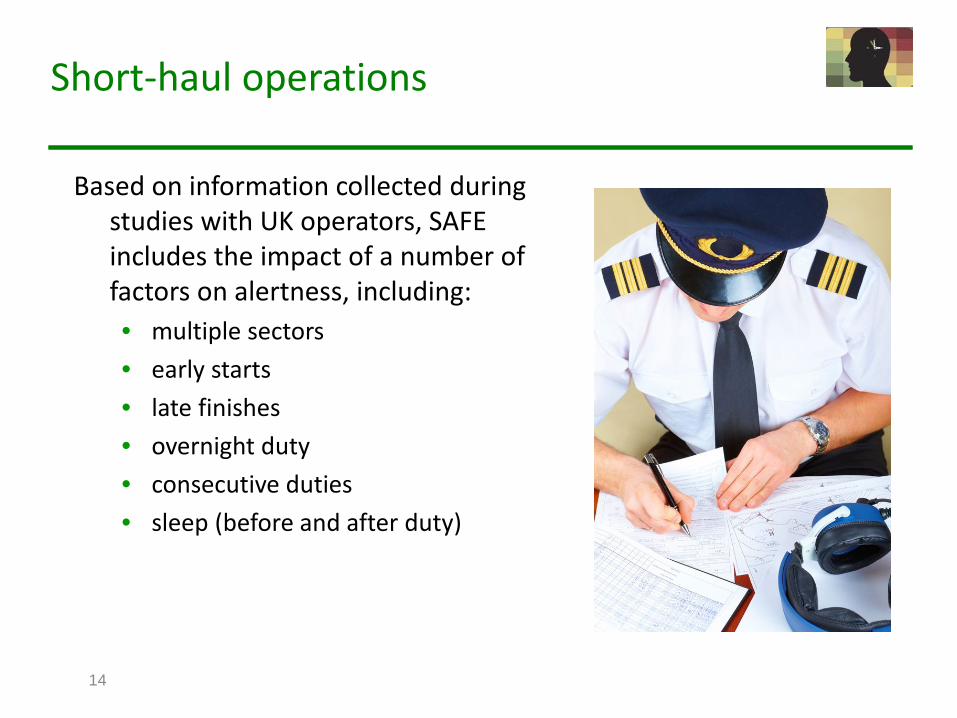
Short-haul operations
Based on information collected during studies with UK operators, SAFE includes the impact of a number of factors on alertness, including: • multiple sectors • early starts • late finishes • overnight duty • consecutive duties • sleep (before and after duty)
15
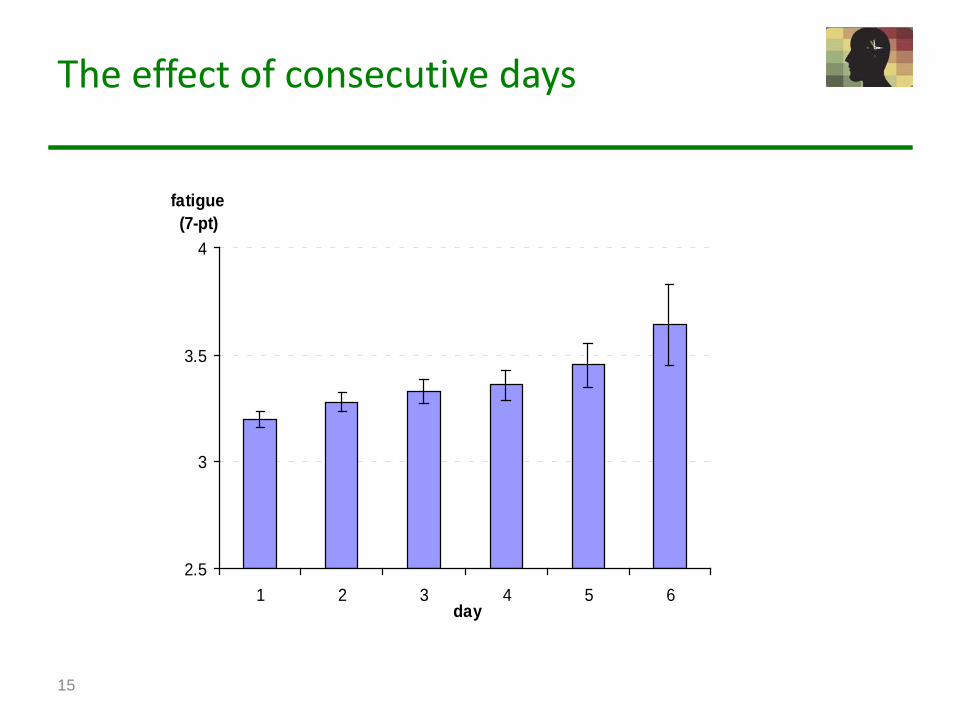
The effect of consecutive days
2.5
3
3.5
4
1 2 3 4 5 6day
fatigue(7-pt)
16
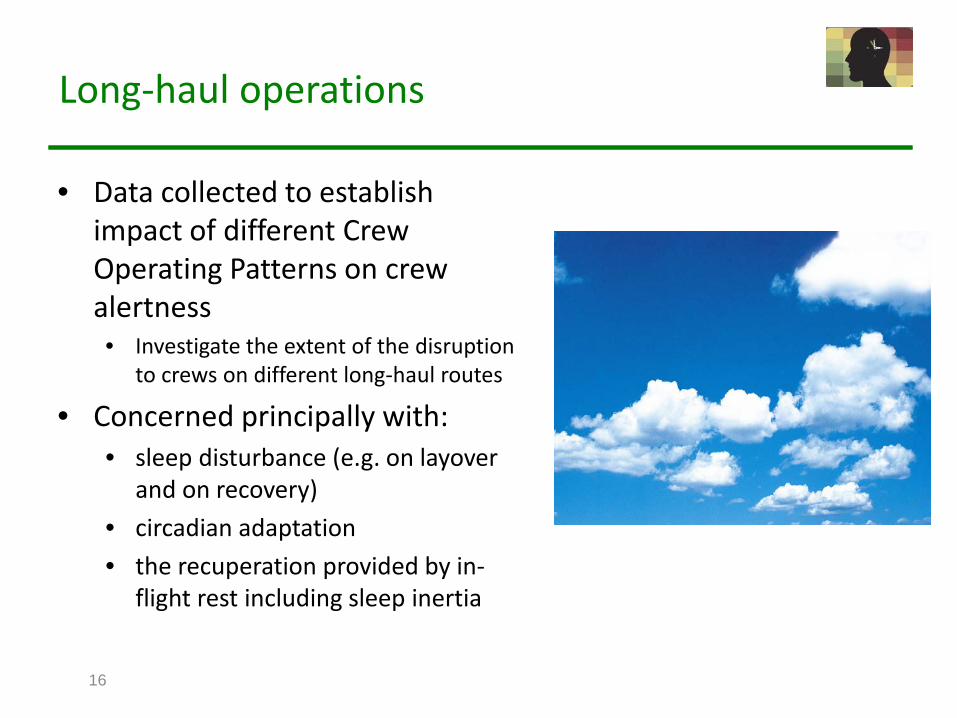
Long-haul operations
• Data collected to establish impact of different Crew Operating Patterns on crew alertness • Investigate the extent of the disruption
to crews on different long-haul routes
• Concerned principally with: • sleep disturbance (e.g. on layover
and on recovery) • circadian adaptation • the recuperation provided by in-
flight rest including sleep inertia
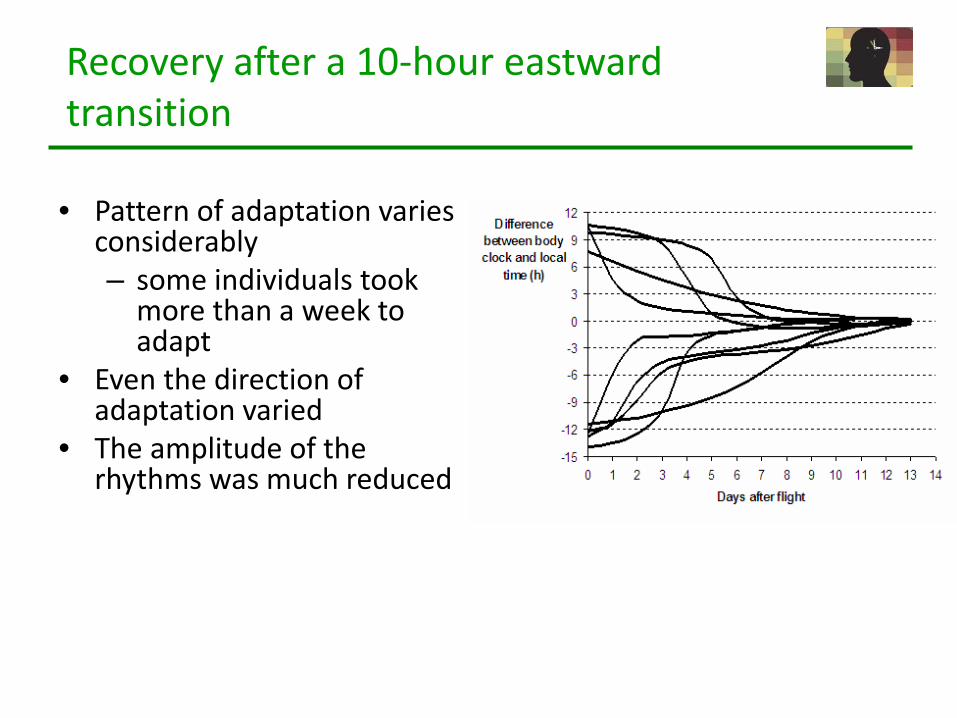
Recovery after a 10-hour eastward transition
• Pattern of adaptation varies considerably – some individuals took
more than a week to adapt
• Even the direction of adaptation varied
• The amplitude of the rhythms was much reduced
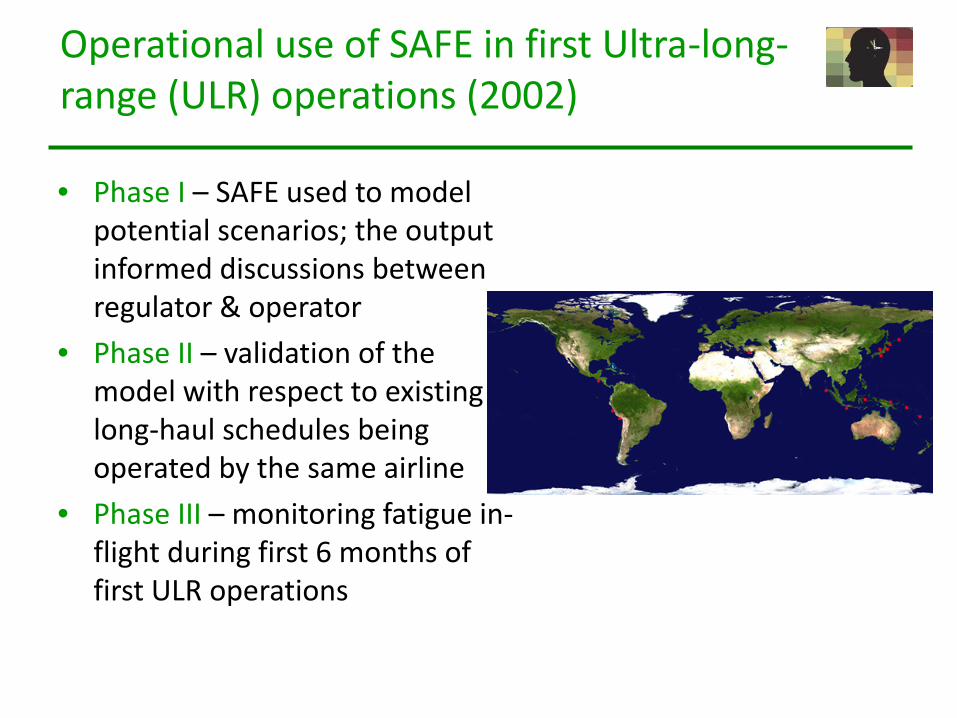
Operational use of SAFE in first Ultra-long- range (ULR) operations (2002)
• Phase I – SAFE used to model potential scenarios; the output informed discussions between regulator & operator
• Phase II – validation of the model with respect to existing long-haul schedules being operated by the same airline
• Phase III – monitoring fatigue in-flight during first 6 months of first ULR operations
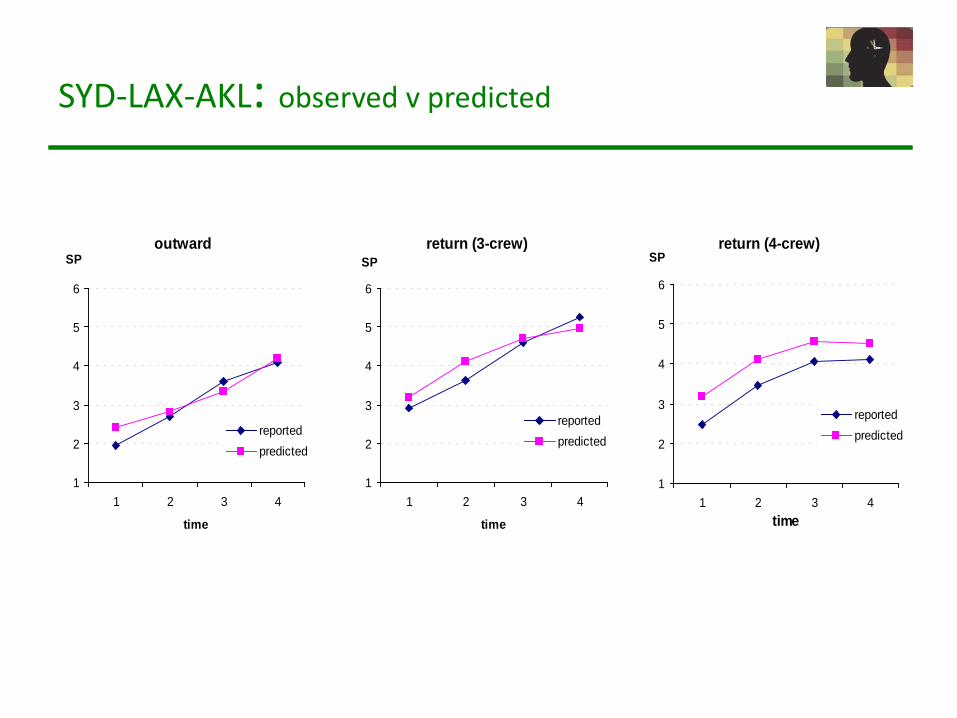
SYD-LAX-AKL: observed v predicted
outward
1
2
3
4
5
6
1 2 3 4
time
SP
reportedpredicted
return (3-crew)
1
2
3
4
5
6
1 2 3 4
time
SP
reportedpredicted
return (4-crew)
1
2
3
4
5
6
1 2 3 4time
SP
reportedpredicted
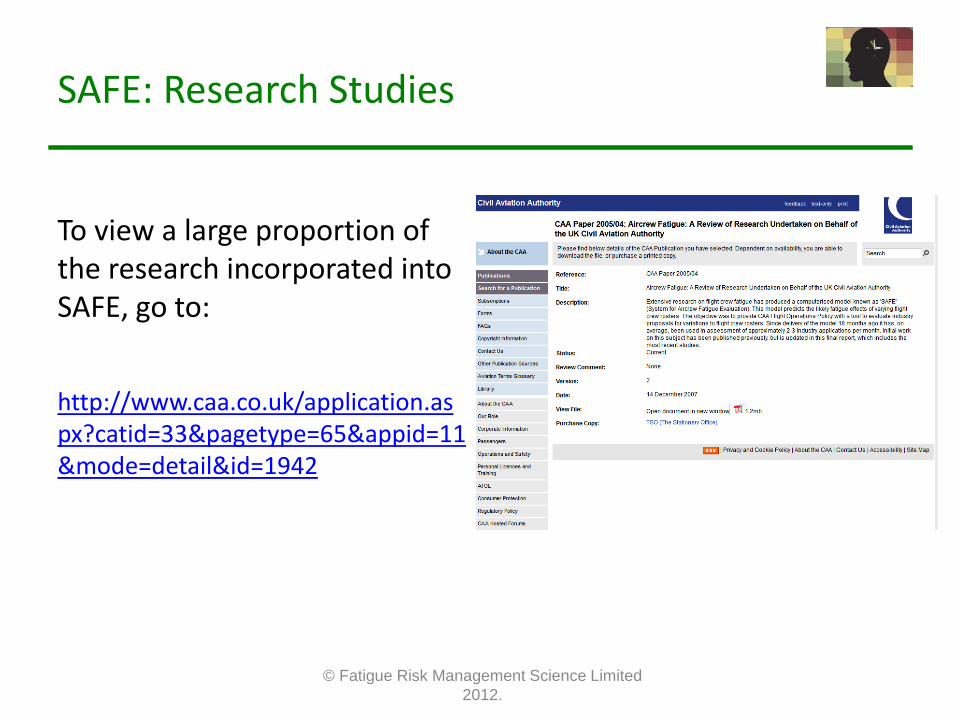
SAFE: Research Studies
To view a large proportion of the research incorporated into SAFE, go to:
http://www.caa.co.uk/application.aspx?catid=33&pagetype=65&appid=11&mode=detail&id=1942
© Fatigue Risk Management Science Limited 2012.
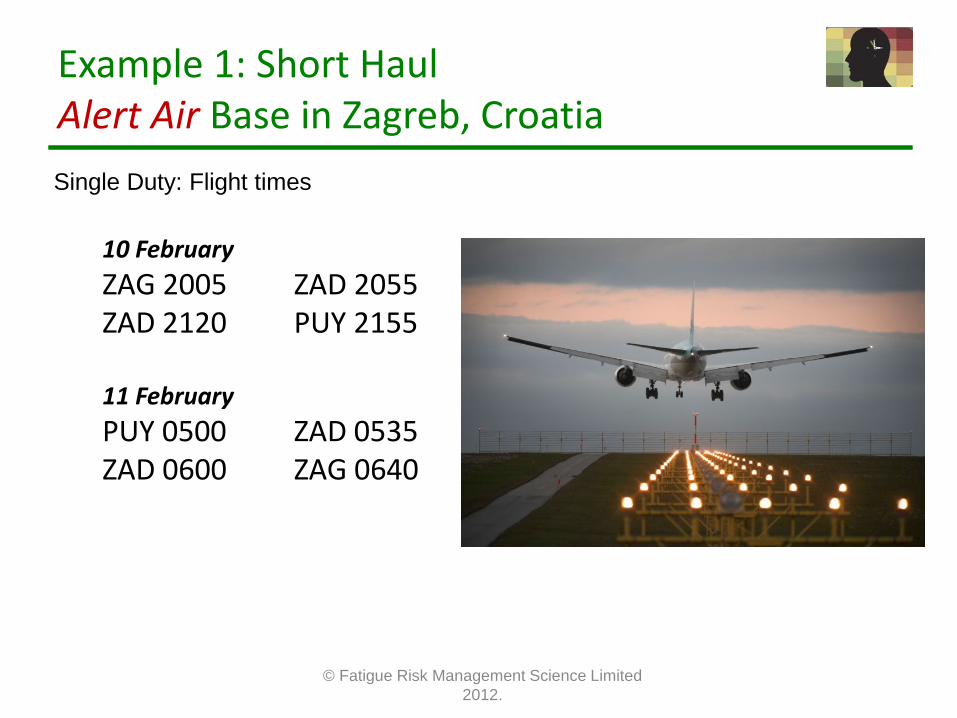
Example 1: Short Haul Alert Air Base in Zagreb, Croatia
© Fatigue Risk Management Science Limited 2012.
10 February ZAG 2005 ZAD 2055 ZAD 2120 PUY 2155 11 February PUY 0500 ZAD 0535 ZAD 0600 ZAG 0640
Single Duty: Flight times
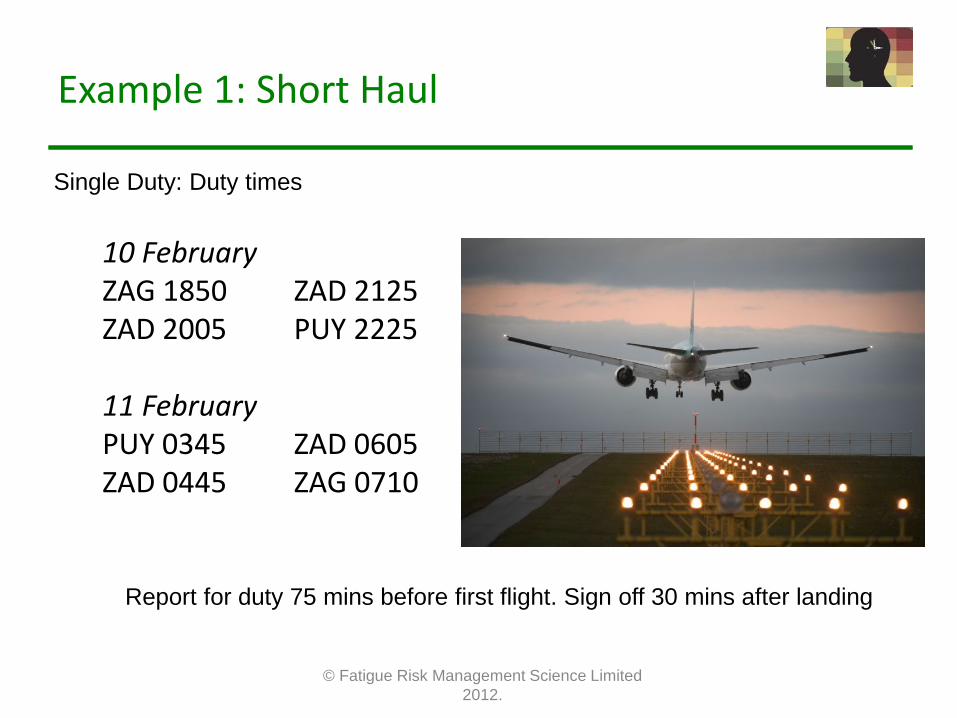
Example 1: Short Haul
© Fatigue Risk Management Science Limited 2012.
10 February ZAG 1850 ZAD 2125 ZAD 2005 PUY 2225 11 February PUY 0345 ZAD 0605 ZAD 0445 ZAG 0710
Single Duty: Duty times
Report for duty 75 mins before first flight. Sign off 30 mins after landing
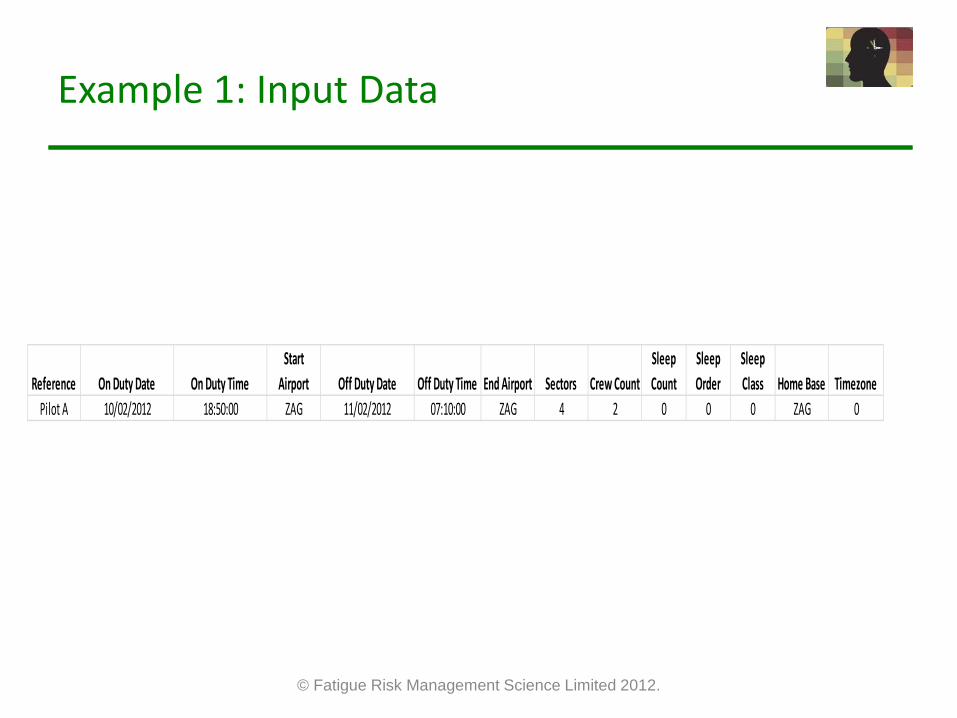
Example 1: Input Data
© Fatigue Risk Management Science Limited 2012.
Reference On Duty Date On Duty TimeStart
Airport Off Duty Date Off Duty Time End Airport Sectors Crew CountSleep Count
Sleep Order
Sleep Class Home Base Timezone
Pilot A 10/02/2012 18:50:00 ZAG 11/02/2012 07:10:00 ZAG 4 2 0 0 0 ZAG 0
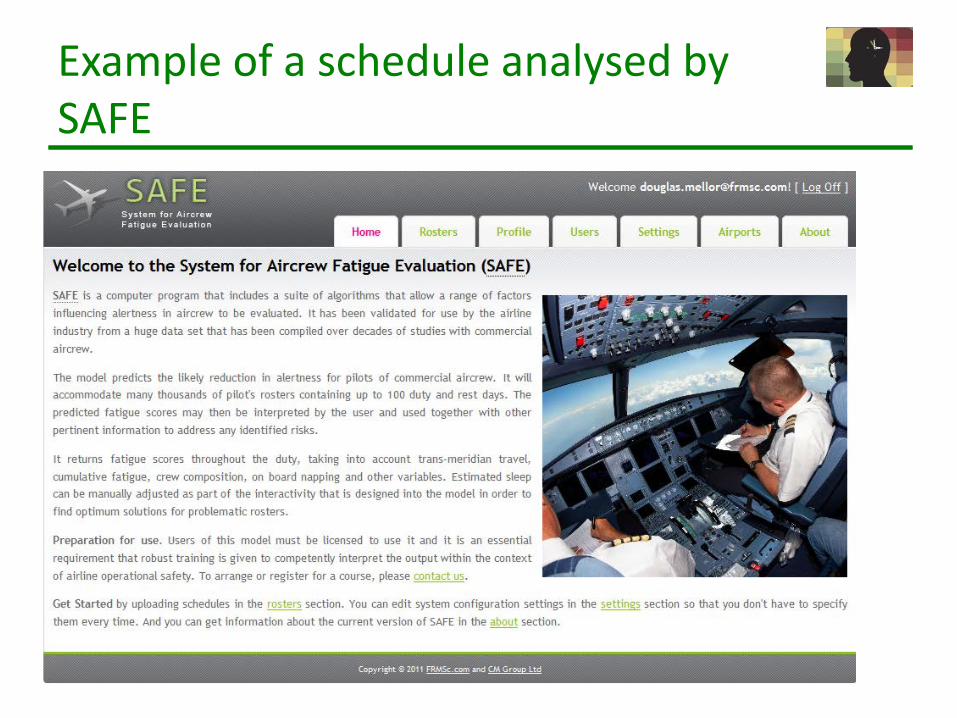
Example of a schedule analysed by SAFE
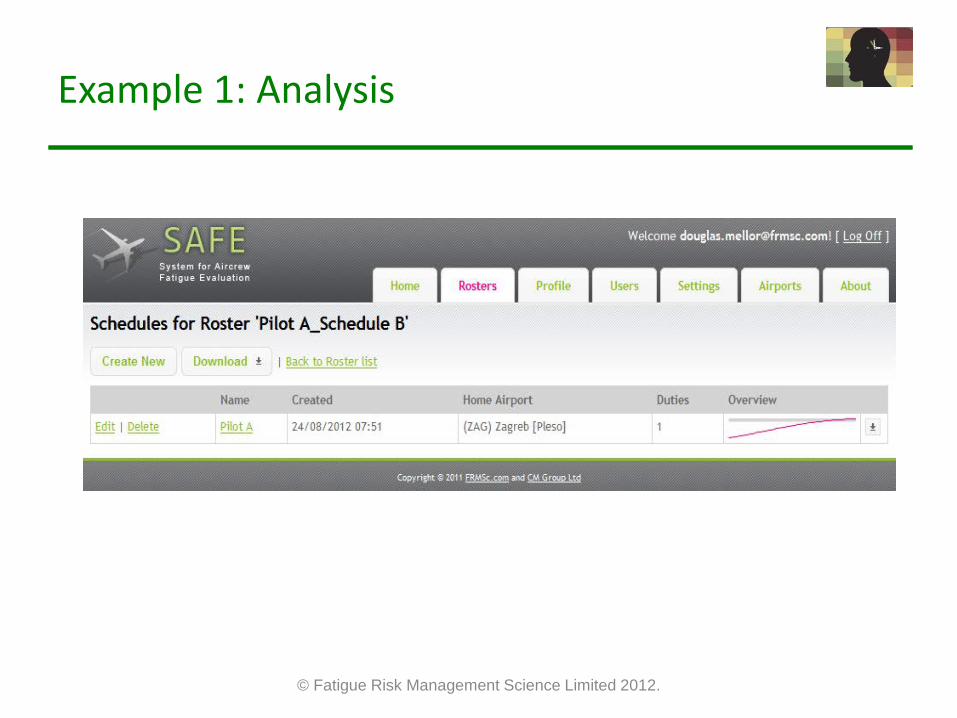
Example 1: Analysis
© Fatigue Risk Management Science Limited 2012.
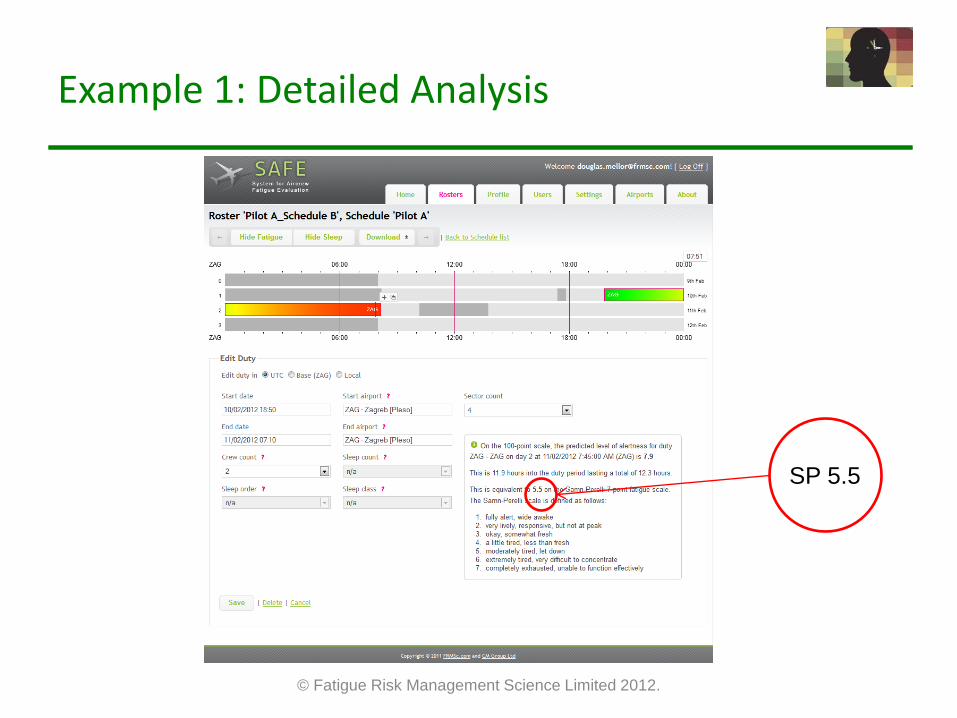
Example 1: Detailed Analysis
© Fatigue Risk Management Science Limited 2012.
SP 5.5
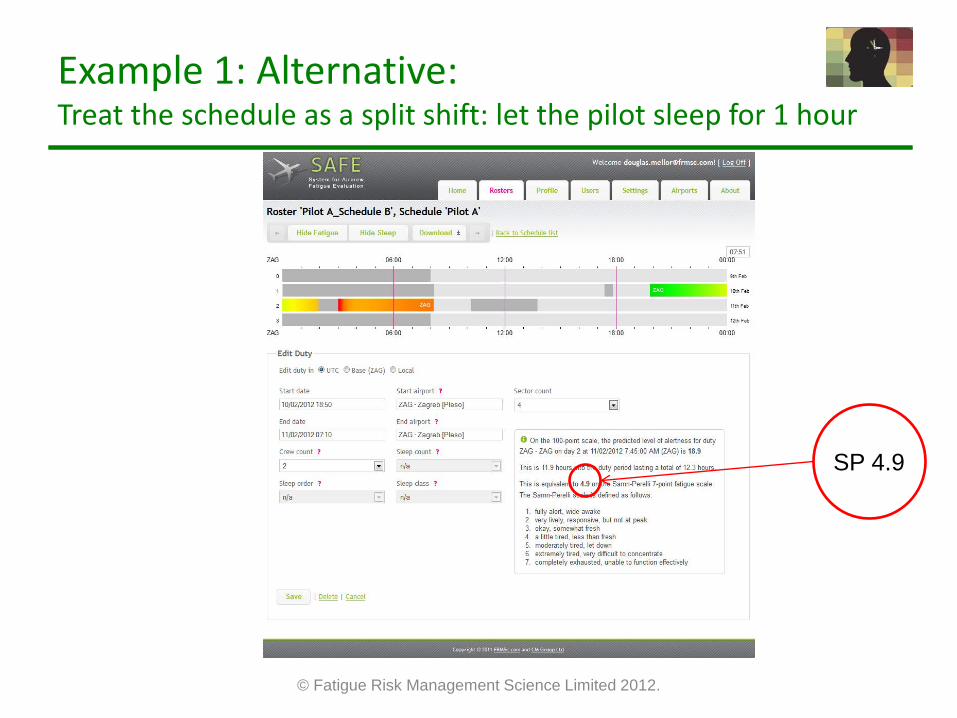
Example 1: Alternative: Treat the schedule as a split shift: let the pilot sleep for 1 hour
© Fatigue Risk Management Science Limited 2012.
SP 4.9
Example of a schedule analysed by SAFE
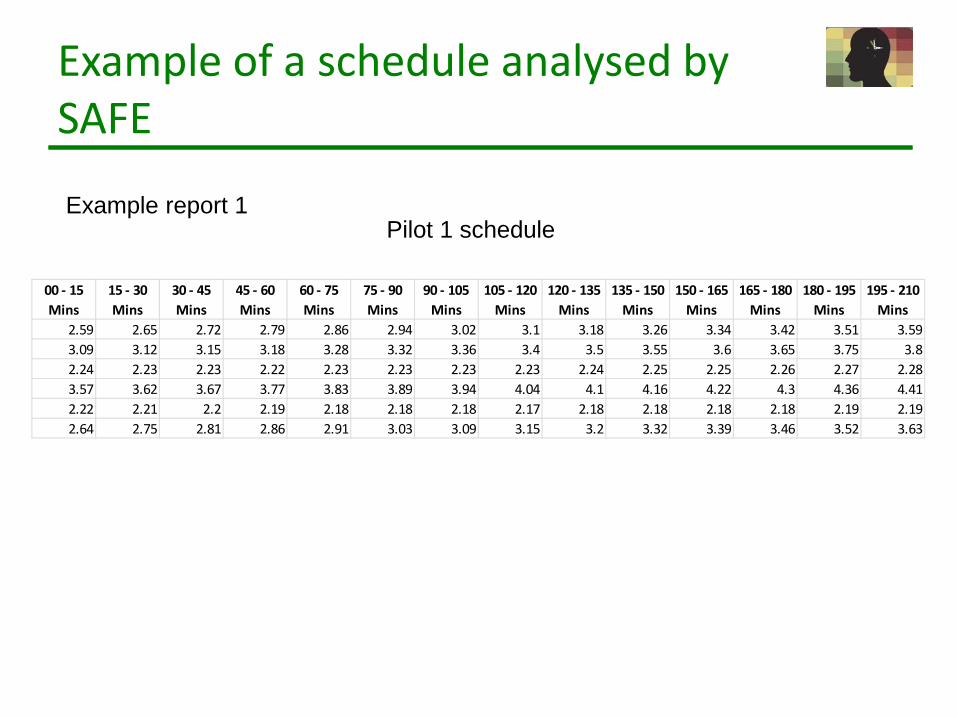
00 - 15 Mins
15 - 30 Mins
30 - 45 Mins
45 - 60 Mins
60 - 75 Mins
75 - 90 Mins
90 - 105 Mins
105 - 120 Mins
120 - 135 Mins
135 - 150 Mins
150 - 165 Mins
165 - 180 Mins
180 - 195 Mins
195 - 210 Mins
2.59 2.65 2.72 2.79 2.86 2.94 3.02 3.1 3.18 3.26 3.34 3.42 3.51 3.593.09 3.12 3.15 3.18 3.28 3.32 3.36 3.4 3.5 3.55 3.6 3.65 3.75 3.82.24 2.23 2.23 2.22 2.23 2.23 2.23 2.23 2.24 2.25 2.25 2.26 2.27 2.283.57 3.62 3.67 3.77 3.83 3.89 3.94 4.04 4.1 4.16 4.22 4.3 4.36 4.412.22 2.21 2.2 2.19 2.18 2.18 2.18 2.17 2.18 2.18 2.18 2.18 2.19 2.192.64 2.75 2.81 2.86 2.91 3.03 3.09 3.15 3.2 3.32 3.39 3.46 3.52 3.63
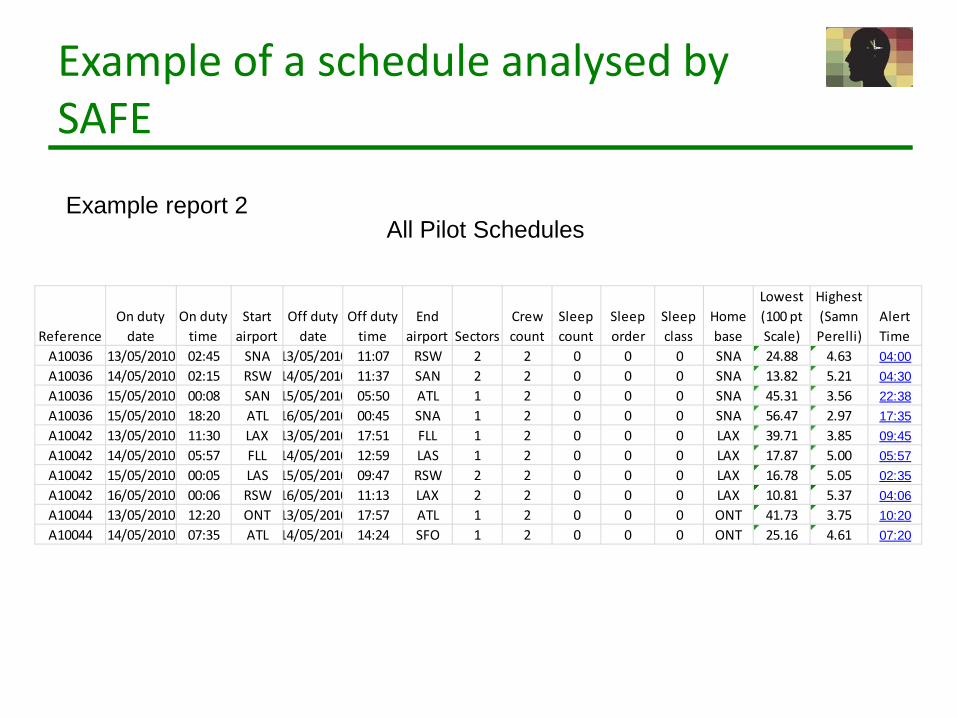
Pilot 1 schedule Example report 1
Example of a schedule analysed by SAFE
All Pilot Schedules
ReferenceOn duty
dateOn duty
timeStart
airportOff duty
dateOff duty
timeEnd
airport SectorsCrew count
Sleep count
Sleep order
Sleep class
Home base
Lowest (100 pt Scale)
Highest (Samn Perelli)
Alert Time
A10036 13/05/2010 02:45 SNA 13/05/2010 11:07 RSW 2 2 0 0 0 SNA 24.88 4.63 04:00A10036 14/05/2010 02:15 RSW 14/05/2010 11:37 SAN 2 2 0 0 0 SNA 13.82 5.21 04:30A10036 15/05/2010 00:08 SAN 15/05/2010 05:50 ATL 1 2 0 0 0 SNA 45.31 3.56 22:38A10036 15/05/2010 18:20 ATL 16/05/2010 00:45 SNA 1 2 0 0 0 SNA 56.47 2.97 17:35A10042 13/05/2010 11:30 LAX 13/05/2010 17:51 FLL 1 2 0 0 0 LAX 39.71 3.85 09:45A10042 14/05/2010 05:57 FLL 14/05/2010 12:59 LAS 1 2 0 0 0 LAX 17.87 5.00 05:57A10042 15/05/2010 00:05 LAS 15/05/2010 09:47 RSW 2 2 0 0 0 LAX 16.78 5.05 02:35A10042 16/05/2010 00:06 RSW 16/05/2010 11:13 LAX 2 2 0 0 0 LAX 10.81 5.37 04:06A10044 13/05/2010 12:20 ONT 13/05/2010 17:57 ATL 1 2 0 0 0 ONT 41.73 3.75 10:20A10044 14/05/2010 07:35 ATL 14/05/2010 14:24 SFO 1 2 0 0 0 ONT 25.16 4.61 07:20
Example report 2
Example of a schedule analysed by SAFE
All Pilot Schedules
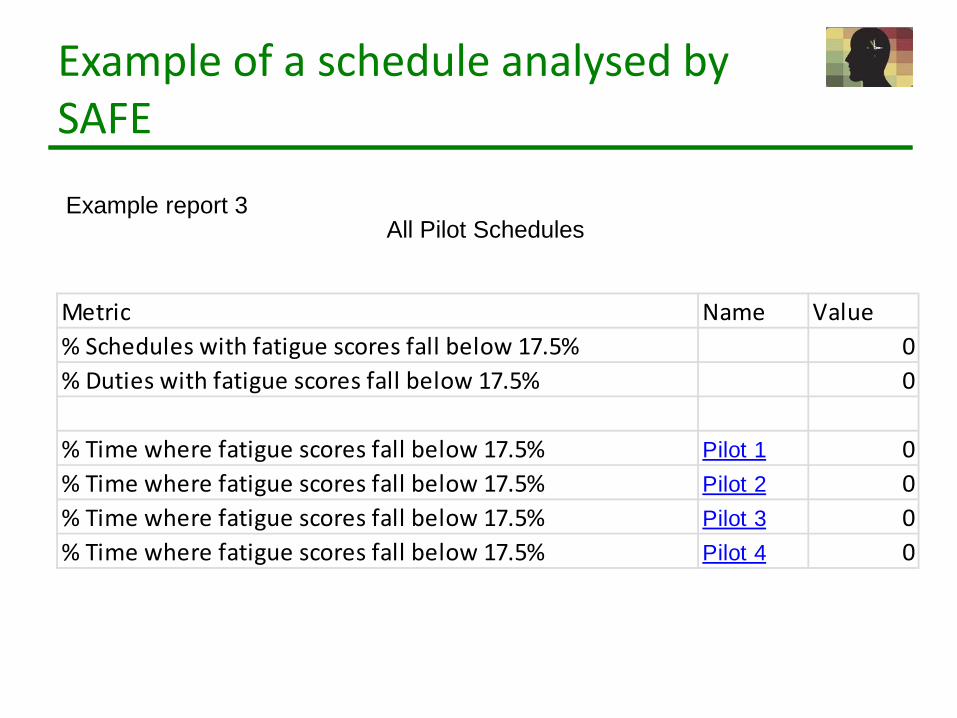
Metric Name Value% Schedules with fatigue scores fall below 17.5% 0% Duties with fatigue scores fall below 17.5% 0
% Time where fatigue scores fall below 17.5% Pilot 1 0% Time where fatigue scores fall below 17.5% Pilot 2 0% Time where fatigue scores fall below 17.5% Pilot 3 0% Time where fatigue scores fall below 17.5% Pilot 4 0
Example report 3
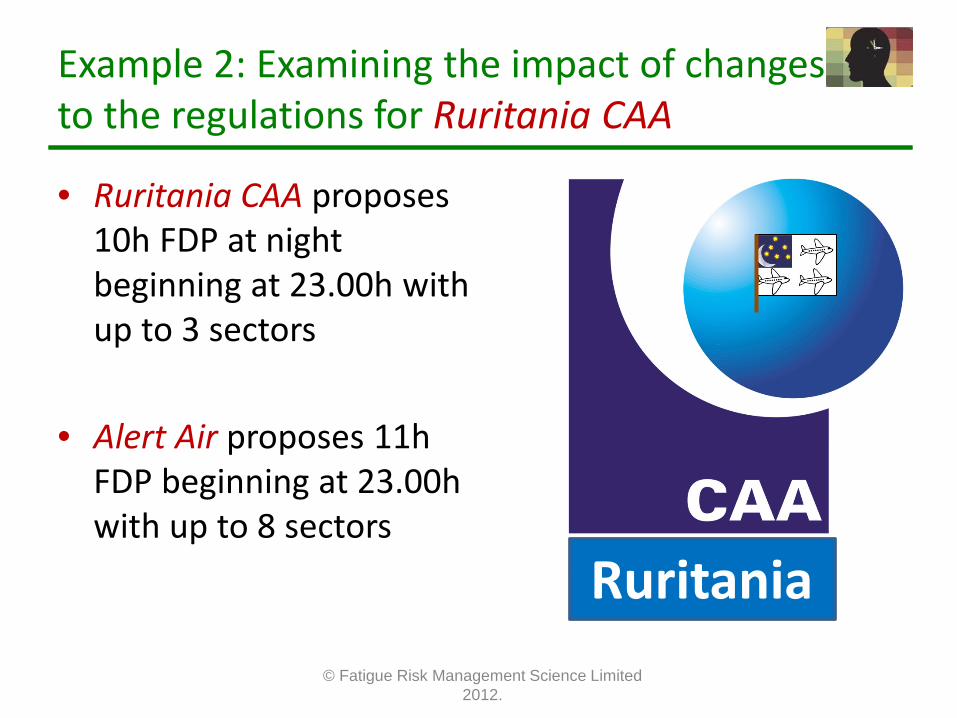
Example 2: Examining the impact of changes to the regulations for Ruritania CAA
• Ruritania CAA proposes 10h FDP at night beginning at 23.00h with up to 3 sectors
• Alert Air proposes 11h FDP beginning at 23.00h with up to 8 sectors
© Fatigue Risk Management Science Limited 2012.
Ruritania
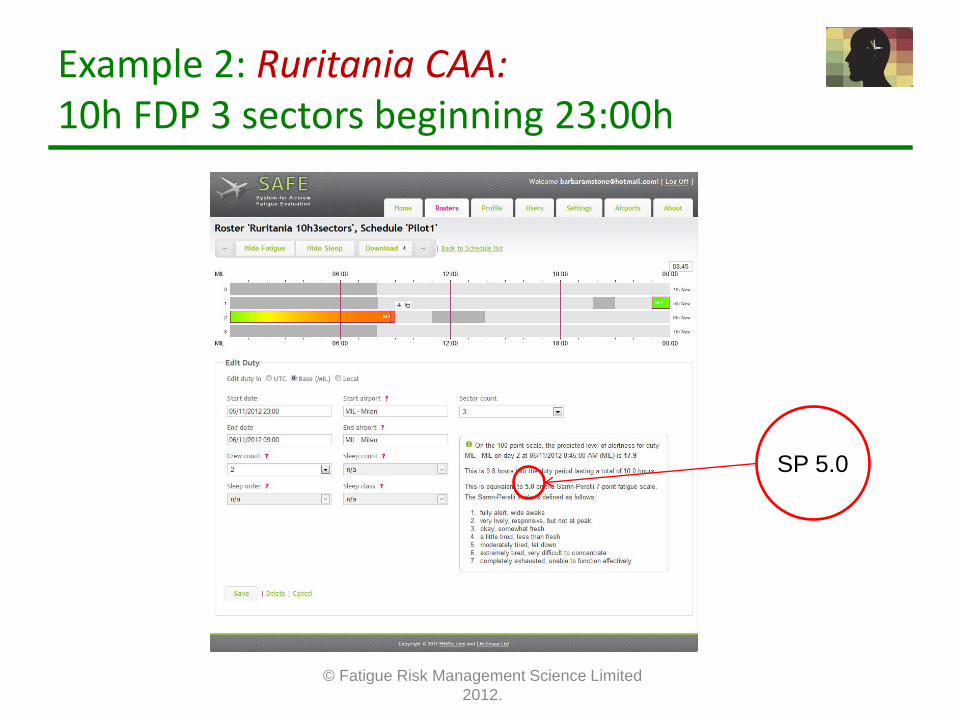
Example 2: Ruritania CAA: 10h FDP 3 sectors beginning 23:00h
© Fatigue Risk Management Science Limited 2012.
SP 5.0
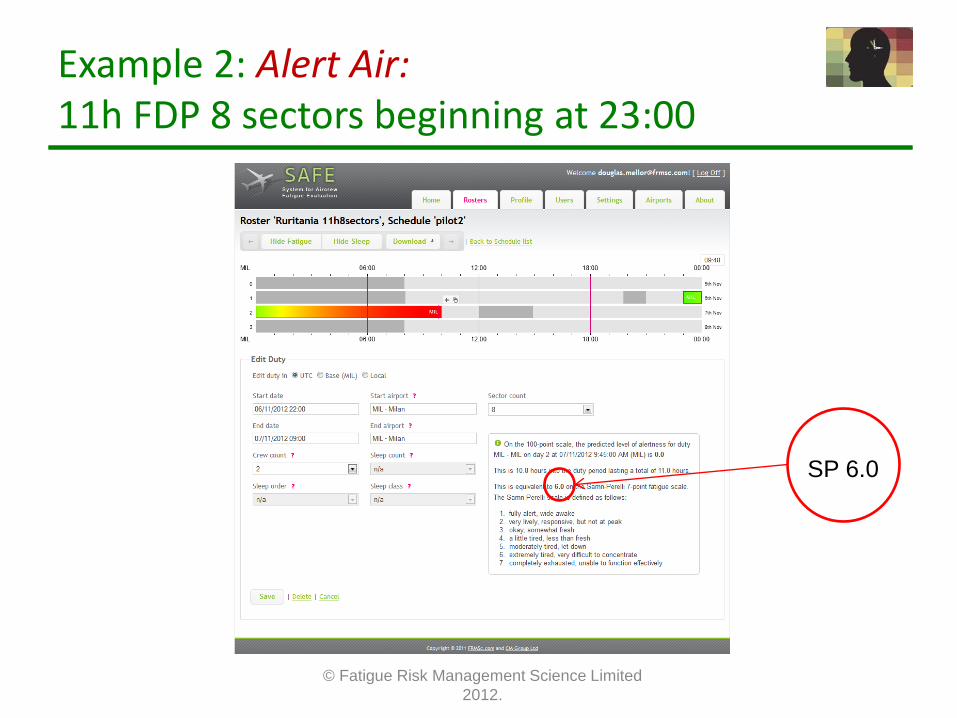
Example 2: Alert Air: 11h FDP 8 sectors beginning at 23:00
© Fatigue Risk Management Science Limited 2012.
SP 6.0
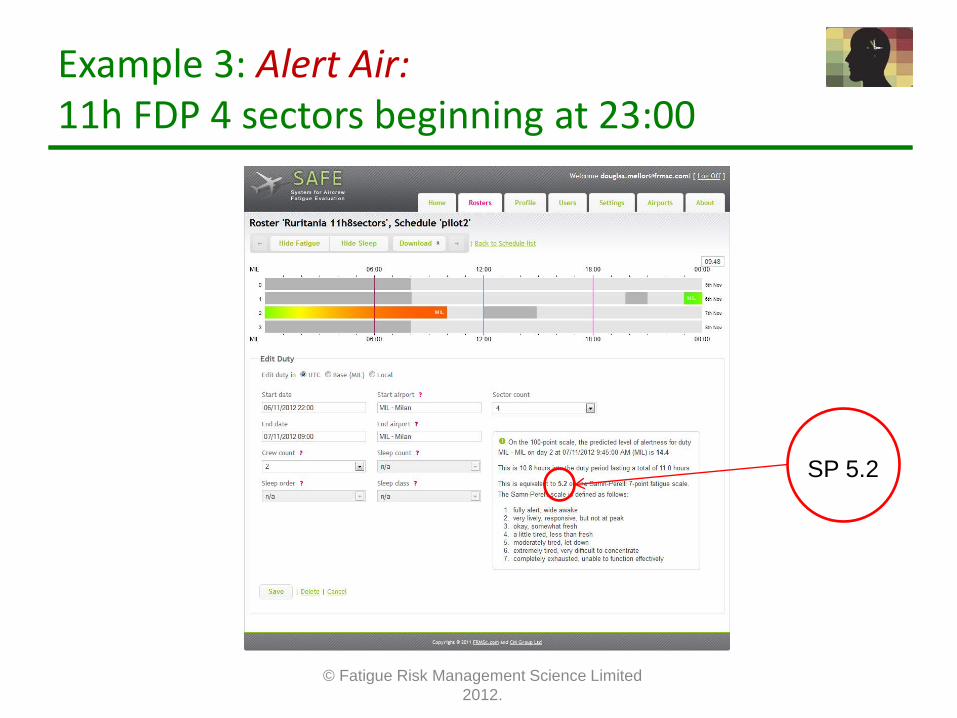
Example 3: Alert Air: 11h FDP 4 sectors beginning at 23:00
© Fatigue Risk Management Science Limited 2012.
SP 5.2
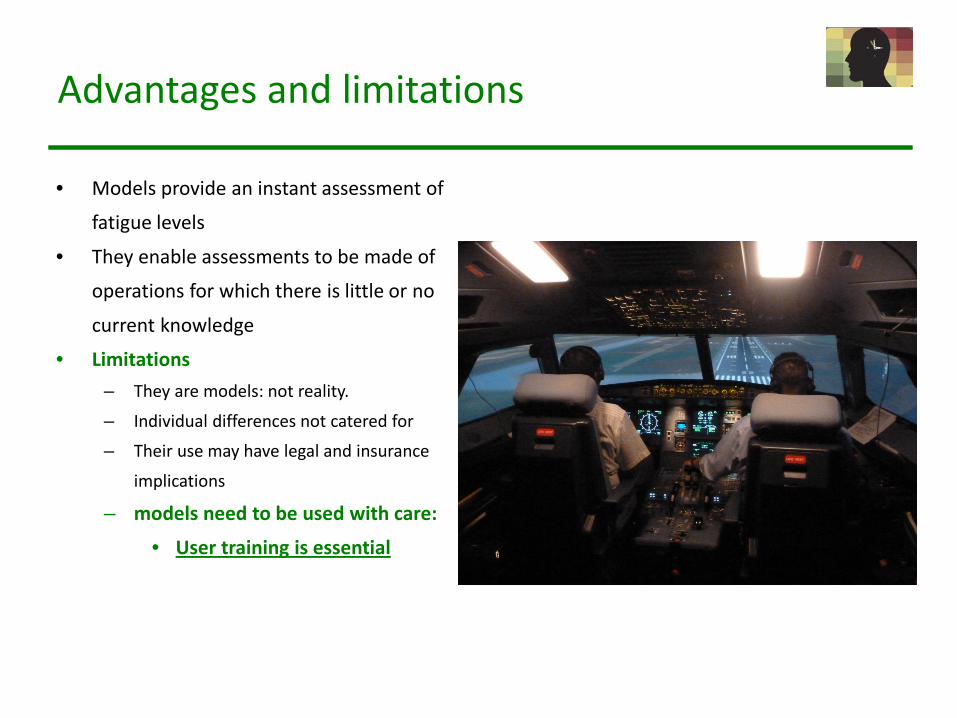
Advantages and limitations
• Models provide an instant assessment of
fatigue levels
• They enable assessments to be made of
operations for which there is little or no
current knowledge
• Limitations – They are models: not reality.
– Individual differences not catered for
– Their use may have legal and insurance
implications
– models need to be used with care:
• User training is essential
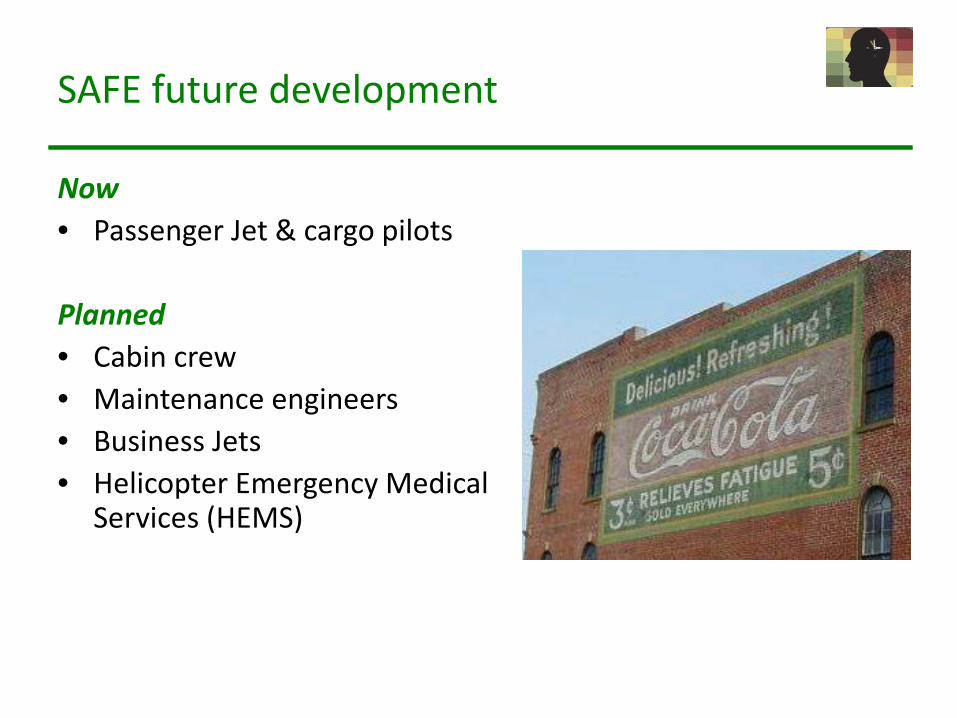
SAFE future development
Now • Passenger Jet & cargo pilots Planned • Cabin crew • Maintenance engineers • Business Jets • Helicopter Emergency Medical
Services (HEMS)
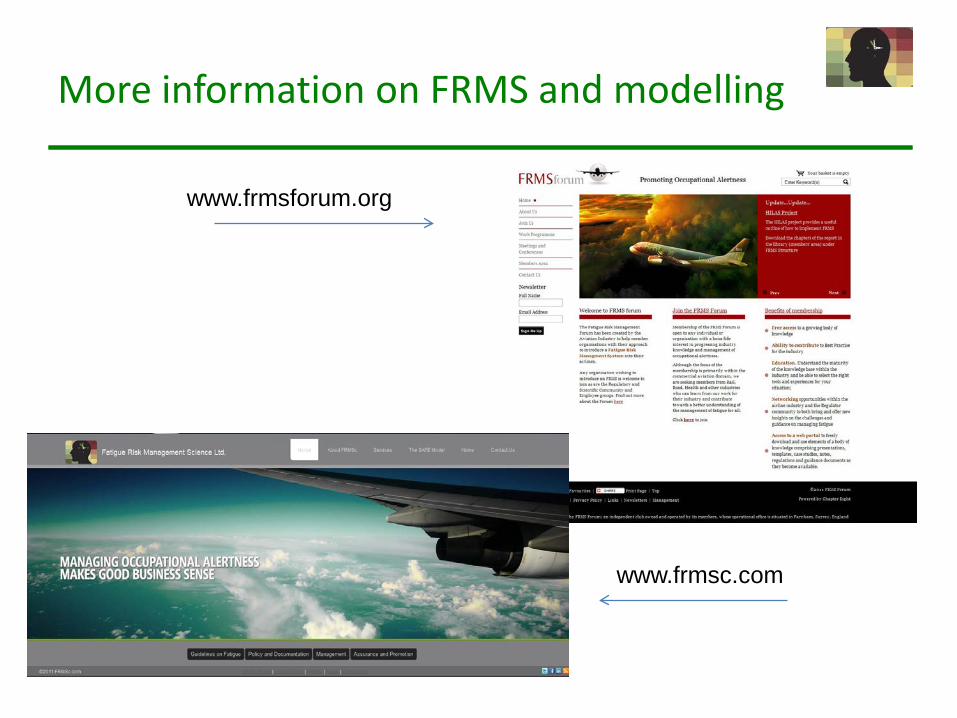
More information on FRMS and modelling
www.frmsc.com
www.frmsforum.org
Summary
• Models are useful to measure fatigue and quickly identify hazards BUT
• Models are only models – not reality – No one model is perfect: Individual differences work against that – Don’t rely on them exclusively to make your decision on risk tolerance – Use them to explore possible solutions – Use the right tool for the job:
• Is the model validated for the occupation under scrutiny? • Is it built from robust scientific, statistical and software processes? • Will the lawyers and insurance companies agree to your choice of
model when investigating an incident?
© Fatigue Risk Management Science Limited
2012.
Thank you for listening
© Fatigue Risk Management Science Limited 2012.
Douglas Mellor Fatigue Risk Management Systems Limited PO Box 631 Farnham Surrey GU10 4RL England +44 7879 887489 [email protected] www.frmsc.com