Embed Size (px)
Citation preview
University of Tennessee, Knoxville University of Tennessee, Knoxville
TRACE: Tennessee Research and Creative TRACE: Tennessee Research and Creative
Exchange Exchange
Masters Theses Graduate School
5-2006
Use of Busways in Urban Areas Use of Busways in Urban Areas
Michael Harris Gallant University of Tennessee - Knoxville
Follow this and additional works at: https://trace.tennessee.edu/utk_gradthes
Part of the Civil and Environmental Engineering Commons
Recommended Citation Recommended Citation Gallant, Michael Harris, "Use of Busways in Urban Areas. " Master's Thesis, University of Tennessee, 2006. https://trace.tennessee.edu/utk_gradthes/1558
This Thesis is brought to you for free and open access by the Graduate School at TRACE: Tennessee Research and Creative Exchange. It has been accepted for inclusion in Masters Theses by an authorized administrator of TRACE: Tennessee Research and Creative Exchange. For more information, please contact [email protected].
To the Graduate Council:
I am submitting herewith a thesis written by Michael Harris Gallant entitled "Use of Busways in
Urban Areas." I have examined the final electronic copy of this thesis for form and content and
recommend that it be accepted in partial fulfillment of the requirements for the degree of
Master of Science, with a major in Civil Engineering.
Arun Chatterjee, Major Professor
We have read this thesis and recommend its acceptance:
Frederick Wegmann, Thomas Urbanik
Accepted for the Council:
Carolyn R. Hodges
Vice Provost and Dean of the Graduate School
(Original signatures are on file with official student records.)
To the Graduate Council: I am submitting herewith a thesis written by Michael Harris Gallant entitled “Use Of Busways in Urban Areas.” I have examined the final electronic copy of this thesis for form and content and recommend that it be accepted in partial fulfillment of the requirements for the degree of Master of Science, with a major in Civil Engineering.
Arun Chatterjee
Major Professor We have read this thesis and recommend its acceptance: Frederick Wegmann Thomas Urbanik Accepted for the Council:
Anne Mayhew
Vice Chancellor and Dean of Graduate Studies
(Original signatures are on file with official student records.)
Use Of Busways in Urban
Areas
A Thesis Presented for the Master of Science Degree
The University of Tennessee, Knoxville
Michael Harris Gallant
May 2006
ii
DEDICATION
Dedicated to Dr Arun Chatterjee and Dr Frederick Wegmann for their encouragement,
patience, and support over the years while studying at the University of Tennessee
iii
ACKNOWLEDGEMENTS
I would like to thank Dr Arun Chatterjee and Dr Frederick Wegmann for providing me
assistance and guidance with my thesis. These two individuals have been incredibly
instrumental to my success as a graduate student at the University of Tennessee. I
particularly want to thank both for having an open-door policy for any questions I have
had regarding course material or any other matters. Dr Chatterjee and Dr Wegmann have
been very patient with me during my long journey as a graduate student and I appreciate
their unwavering support and faith in me. I also want to thank Richard Feder at the Port
Authority of Allegheny in Pittsburgh, PA for taking time out of his busy schedule to
discuss with me various issues regarding mass transit in Pittsburgh.
iv
ABSTRACT
This study reviews Busway technology, the highest form of Bus Rapid Transit, and its
applications to improve mobility within urban areas. The purpose of this study is to
identify the potential benefits of busways as an alternative to costly rail transit. Two case
studies were performed for busways in current operation in Miami, FL and Pittsburgh,
PA. This study will offer a comprehensive analysis of both busway systems and how
they have positively affected important transit corridors in the aforementioned
metropolitan areas. This study will also discuss the planning process, guidelines, and
design criteria for busway development.
v
TABLE OF CONTENTS
1 INTRODUCTION ..................................................................................................1
1.1 Background......................................................................................................1 1.2 Problems with Traditional Bus Service and Light Rail Transit..........................2 1.3 BRT - Bus Rapid Transit as an Alternative.......................................................3 1.4 Busways...........................................................................................................4
2 HISTORY OF BUSWAYS AND BUS RAPID TRANSIT .....................................8 2.1 Busway Concept is Not New............................................................................8 2.2 Busways around the World.............................................................................10 2.3 Recent Busways in USA ................................................................................10
3 AVAILABLE GUIDELINES FOR BUSWAY AND BRT APPLICATIONS IN URBAN AREAS...........................................................................................................12
3.1 Planning Considerations.................................................................................12 3.2 Warrants ........................................................................................................17 3.3 Design Guidelines ..........................................................................................21 3.4 Running Ways................................................................................................21 3.5 Busway and BRT Stations..............................................................................25
4 CASE STUDIES – PITTSBURGH, PA and MIAMI, FL ......................................30 4.1 PITTSBURGH, PA........................................................................................30
4.1.1 Port Authority of Allegheny County (PAT) ............................................30
4.1.2 South Busway.........................................................................................31
4.1.3 East Busway (aka Martin Luther King, Jr. Busway)................................33
4.1.4 West Busway..........................................................................................34
4.1.5 Future Outlook for Rapid Transit in Pittsburgh .......................................37
4.2 MIAMI, FL..........................................................................................................37 4.2.1 Miami-Dade Transit Authority (MDTA).................................................38
4.2.2 Birth of Rapid Transit in Miami..............................................................40
4.2.3 Introduction of the South Busway...........................................................41
4.2.4 South Busway - Phases I and II...............................................................42
4.2.5 South Busway - Travel Times, Frequencies and Routes ..........................43
4.2.6 Future Outlook for Rapid Transit in Miami.............................................46
5 SUGGESTED GUIDELINES FOR BUSWAY APPLICATIONS..........................49 6 CONCLUSIONS AND RECOMMENDATIONS..................................................52
6.1 Right-of-Way.................................................................................................52 6.2 Land Use........................................................................................................53 6.3 Safety.............................................................................................................54 6.4 Vehicles .........................................................................................................56 6.5 Fare Collection...............................................................................................57
REFEERENCES ...........................................................................................................59 APPENDIX………………………………………………………………………………61 VITA……………………………………………………………………………………..65
vi
LIST OF TABLES
Table Page
3.1 Ideal Conditions for Rapid Transit Development-Design Year……………….18
3.2 Summary of Warrants for Busway Development……………………………. 20
3.3 Running Way Classified by Extent of Control………………………………..22
3.4 Suggest Busway Design Criteria………………………………………………26
4.1 General Statistics of Busways in Pittsburgh, PA……………………………...36
4.2 Bus Frequency Table for Miami South Busway………………………………45
4.3 Subway Service Hours for Miami and Pittsburgh……………………………..47
4.4 Busway Characteristics: Pittsburgh-East Busway vs. Miami-South Busway…48
1
1 INTRODUCTION
1.1 Background
There are many challenges today facing urban planners and engineers when attempting to
address the increasingly complex transportation needs of metropolitan areas across the
United States. As the population of cities continues to grow at a rapid pace, the existing
transportation infrastructures of these cities become congested due to the increased
number of vehicles on urban roadways. Many of these roadways were widened earlier,
and these facilities again are reaching their expanded capacity. In many cases, it is
becoming cost prohibitive and impractical to further widen or double-deck existing
roadway facilities in urban areas resulting in the increasing of traffic congestion.
Historically, mass transit in the United States has played a moderate role in alleviating
traffic congestion although it provides an alternative to the use of private automobiles.
Mass transit has the ability to improve mobility within a metropolitan area by offering
bus, rail and ferry services, and it can reduce the number of autos on clogged roadways --
freeways and bridges/tunnels. Unfortunately, for many cities, transit ridership remains
low, and in some instances, has dropped over the years. As transit ridership continues to
erode, private auto usage continues to increase, further complicating current traffic
congestion problems in urban areas.
2
1.2 Problems with Traditional Bus Service and Light Rail Transit
Transit systems all across the United States have been exploring various ways to reverse
this downward trend in transit ridership over the last several decades. Conventional bus
systems offering traditional local/express services in mixed traffic have not been the
answer. Conventional bus services typically do not have their own dedicated right-of-way
(ROW), and so they are forced to intermix with regular traffic and are subject to the same
traffic conditions. In recent years, several transit systems have invested in very costly rail
systems, namely light rail transit (LRT), as an alternative to conventional bus systems.
Unfortunately, after implementation some of these LRT systems are experiencing much
lower ridership than originally projected. Examples of these cases include Baltimore
MTA, Buffalo Metro Rail, San Jose VTA (National Transit Database website, FTA 2002
http://www.ntdprogram.com/). Though there are a few success stories such as the San
Diego Trolley, Saint Louis Metrolink, and Portland MAX, the costs involved to develop
and operate a new LRT system often outweigh the benefits. Further, in some cases,
metropolitan areas are not seeing a significant decrease in traffic congestion in the
corridors where the LRT lines serve. This has fueled considerable public debate with
regard to the funding for future rail extensions or new rail startups since the general
public, in most instances, must pay for a portion of these rail services, resulting in
increased taxes. In fact, many cities have repeatedly rejected proposals for LRT (or other
rail technologies) because of the fear that their tax dollars would be wastefully used on a
new costly rail system that might not prove to be beneficial to the community as touted
by rail proponents.
3
Another problem with LRT is that in some cases it is not truly a form of rapid transit such
as heavy rail and commuter rail technologies. Consequently, LRT may not be viewed as
an attractive alternative to automobile users since many commuters might not see a
significant time saving using this particular mode. Most LRT systems in the U.S.A.
today do not operate in their own ROW in downtown areas but rather intermix with local
traffic. There are a few exceptions such as Saint Louis Metrolink, which operates in an
old abandoned freight railroad tunnel under downtown Saint Louis which may explain
why this particular LRT line is a phenomenal success, far exceeding original ridership
estimates since it’s inception in the mid-1990s.
1.3 BRT - Bus Rapid Transit as an Alternative
In recent years, the Federal Transit Administration (FTA) has been promoting an
alternative option to costly rail systems-- Bus Rapid Transit (BRT). BRT is defined by
FTA as a rapid mode of transportation that can combine the quality of rail transit and the
flexibility of buses. The Transit Cooperative Research Program, Project A-23 (TCRP-
A23) expands on this as follows: “BRT is a flexible, rubber-tired rapid transit mode that
combines stations, vehicles, services, running way, and ITS elements into an integrated
system with a strong positive image and identity. BRT applications are designed to be
appropriate to the market they serve and their physical surroundings and can be
incrementally implemented in a variety of environments. BRT is a permanently
integrated system of facilities, services, and amenities that collectively improve the
speed, reliability, and identity of bus transit. In many respects, BRT is rubber-tired light
4
rail transit (LRT), but with greater operating flexibility and potentially lower capital and
operating costs.” (Journal of Public Transportation, Volume. 5, No 2, page 2)
BRT is defined in a broad sense to include a variety of bus priority treatments that would
be an improvement over conventional bus transit such as contra-flow lanes on arterial
streets/freeways, reserved curb lanes, limited/skip-stop service, dedicated lanes on local
streets without a separated ROW, use of freeway HOV lanes, etc. There are numerous
examples of transit systems today using a variety of BRTs that are not busways with
exclusive ROW. Los Angeles LACMTA has “The Rapid” which is a limited stop bus
operation using curb lanes along one of the busiest thoroughfares in the country. Seattle
Metro uses an exclusive underground bus tunnel (with stations) in its downtown region.
WMATA buses in the Washington DC metro area and Houston MTA buses use peak-
direction HOV lanes shared with other HOVs on a dedicated ROW in the median of
freeways. LYNX in Orlando has “Lymmo” which is a downtown circulator that uses a
dedicated bus lane on local streets and offers traffic signal priority to buses in the CBD.
Similarly, Portland’s Tri-Met employs traffic signal priority but uses two parallel bus-
only streets in the downtown area. All of these are forms of bus rapid transit as defined
by the Federal Transit Administration though they may not be truly “rapid” in nature.
1.4 Busways
One form of BRT which several U.S. transit systems are developing is “busways”. A
busway may be defined as a roadway used only by bus vehicles. A busway may or may
5
not have exclusive R-O-W. A busway contains the same elements as defined for BRT
and more. It should be noted that busways are the highest type of BRT and not all BRTs
are busways. When considering developing a busway, planners should investigate all
mode choices available for the specific transit corridor being examined. When rail
transit is a potential option, there should be clear justification for proposing a busway (or
any other form of bus rapid transit) over rail. The potential benefits for busway must be
weighted against those benefits of rail transit. One of the great benefits of busway
development is the significantly less capital investment involved when compared to
development of a rail system (e.g., the lack of requirement for constructing a special
facility to accommodate and maintain railcars). A few metropolitan areas that plan on
using some form of rapid transit considered this benefit as one of the prevailing factors
for selecting bus over rail. But the advantages of busway development should be more
than just considering the cheaper costs. According to a recent Transportation
Cooperative Research Program (TCRP) Report, here are some of the principal advantages
for choosing the bus option.
- The ability to alter design standards as volumes increase over various segments of
a route in accordance with capacity needs (i.e., much greater “staging” or
incremental development capability);
- Relatively low capital costs for infrastructure (i.e., no need for track,
electrification, and other fixed plant);
- The potential for higher and more flexible types and frequencies of service over
different route segments (i.e., capacity need not be constant over the entire route);
6
- The flexibility to combine feeder (i.e., collector and distribution on local streets)
and line-haul services without the need for a physical transfer between vehicles;
- Opportunities to extend service into low-density areas without the need for
additional dedicated running ways;
- The capability of being used by a variety of vehicle sizes and types;
- Simpler procurement practices for both construction and vehicles;
- Shorter implantation periods;
- The ability to start construction on key sections first, such as segments that
provide congestion relief or are the easiest to build, and still provide integrated
service for an entire corridor;
- A variety of competitive vehicle suppliers and less need for conformity in vehicle
procurement;
- Less expensive vehicles, even when accounting for capacity and service life
differences (TCRP Report #90- BRT: Volume 2- Implementation Guidelines)
Conversely, there are some technical advantages of rail transit over bus transit. Here are
some of the advantages as described in the same TCRP report.
- Rail transit has the ability to run high-capacity trains in high-volume corridors;
- Potentially less labor-intensive operation, depending on passenger volumes;
- Greater potential capacity;
- Better levels of service at higher volumes;
- A more positive image on the part of developers and customers;
7
(TCRP Report #90- BRT: Volume 2- Implementation Guidelines)
Ultimately, transit planners who promote the bus option must clearly identify the
numerous benefits offered with busways to the community and all agencies concerned.
Though it may initially be a challenge to sell busway development as the best option for a
metropolitan area, educating the public that busways can not only be more cost efficient
but also be quickly constructed, environmentally friendly, and can promote urban land
use. Other potential benefits include reasonable operating and maintenance costs,
significant travel time savings as well as high capacities and performance.
This thesis will provide a comprehensive analysis of bus rapid transit focusing on
busways with regard to their planning concepts and applications as well as design
guidelines. Further, case studies of two busway services in current operation will be
performed and reported. The case studies will focus on fully operational busways located
in Miami and Pittsburgh.
8
2 HISTORY OF BUSWAYS AND BUS RAPID TRANSIT
2.1 Busway Concept is not New
One of the first true busways in this country went into full operation in 1977 in
Pittsburgh, PA. But this was not the first busway ever considered. In fact, the busway
concept goes back to 1937 when the city of Chicago explored ideas of converting rapid
rail transit lines to bus operation via superhighways. The plans were never fully
developed due to the lack of capital, but this encouraged other metropolitan areas and
transit companies to consider an alternative to the more costly rail option. (Journal of
Public Transportation, Vol. 5, No. 2, 2002)
In 1959, the city of Saint Louis considered a circuitous busway (in the clockwise
direction) around the downtown area offering better access to several large employment
centers in the CBD. Unfortunately, the St. Louis busway plan suffered the same fate as
the Chicago busway plan due to the lack of funding. Similarly, Milwaukee developed a
transitway plan in the late 1960s which included an east-west busway, but in 1970 this
plan was abandoned because of financial constraints. (Journal of Public Transportation,
Vol. 5, No. 2, 2002)
In 1969, the state of Virginia constructed the first segment of an exclusive busway called
the Shirley Busway which arguably, the first busway built in the United States to divert
9
express buses from congested lanes along Interstate 95 in the Washington, DC,
metropolitan area. In 1971, the state had completed all segments of this busway, which
ran between Springfield and Arlington, VA along 10 miles of the I-95 corridor. This
facility did not have any stations, but rather offered a direct link with bus-only
egress/entry ramps along its length. This busway uses the median of I-95. After a few
years of operation as a busway, the state of Virginia opted to allow other types of
passenger vehicles with three or more occupants to use the Shirley Busway. This was the
demise of an all-exclusive roadway for buses in northern Virginia in favor of High
Occupancy Vehicle (HOV) lanes. (Shirley Highway Busway/HOV System website,
http://www.roadstothefuture.com/Shirley_Busway.html)
Other cities have considered exclusive bus roadways in the past, but there was always a
stronger push for rail transit to alleviate problems along congested travel corridors.
Historically, bus transit has not been looked upon favorably by local politicians and the
general public, primarily because buses always have had an image problem. Buses have
been linked to contributing to the road congestion problems in urban areas hence not
offering a true transportation alternative to the automobile. Other negative issues
surrounding bus transit are the use of antiquated vehicles, poor on-time performance, not
enough express/limited stop service, air pollution, and noise. Because of some of these
issues, several cities in the 1980s and 1990s opted for the more expensive Light Rail
Transit (LRT) alternative. These cities include Baltimore, Buffalo, Dallas, Denver,
Hudson-Bergen County (NJ), Portland, Sacramento, St Louis, Salt Lake City, San Diego,
10
and San Jose. As of spring of 2004, Houston, Minneapolis, and Phoenix also broke
ground for brand new LRT operations.
2.2 Busways around the World
On the international landscape, busways are currently more popular in several other
countries than in the United States. As of 2004, there are many fully operational busway
systems in cities around the world such as Adeilade (Australia), Amsterdam (The
Netherlands), Bogota (Colombia), Brisbane (Australia), Curitiba (Brazil), Essen
(England), Jakarta (Indonesia), Leeds (England), Ottawa (Canada), Runcorn (England),
and Sao Paulo (Brazil). Bangkok (Thailand) is one of several international cities today
looking into busways as a less expensive alternative to rail transit.
2.3 Recent Busways in USA
Not all U.S. cities have discarded the busway or BRT concept. Today, there are three
metropolitan areas that are currently running busway-type operations. These are Los
Angeles, Miami and Pittsburgh. Los Angeles and Pittsburgh are unique in that they also
operate LRT systems. It is important to note that although Miami names it’s bus only
transitway the Miami South Busway, it is not 100% exclusive ROW. Hartford, CT, will
be the fourth U.S. city to have a busway which is currently under construction and
expected to be fully operational by January 2007. This brand new 9.4 mile busway in
Hartford will use an exclusive ROW-- an active and inactive railroad ROW-- from
11
downtown Hartford to the suburban community of New Britain in the southwest section
of the metropolitan area. Hartford is also performing busway feasibility studies for two
other heavily used transit corridors in the region since rail transit has proven to be cost-
prohibitive for that metro area (New Britain-Hartford Rapid Transit website,
http://www.ctrapidtransit.com). Lane Transit District in Eugene, Oregon is planning a
BRT network (to be named EmX- Emerald Express) in which segments of a few of these
new routes will have exclusive ROW (Lane Transit District website, http://www.ltd.org)
12
3 AVAILABLE GUIDELINES FOR BUSWAY AND BRT APPLICATIONS
IN URBAN AREAS
This chapter deals with the planning and design of busways and bus rapid transit
including planning concepts, warrants and guidelines for design as suggested by the
Transportation Cooperative Research Program and Federal Transit Administration. The
reference used is the Transportation Cooperative Research Program, Report #90-BRT:
Volume 2- Implementation Guidelines. The discussion is organized in three groups --
planning, warrants, and design. The primary goal, when investigating the applications of
a busway, should be to increase peak-period person-capacity as well as provide a fast and
efficient form of transit. A busway should penetrate high-density residential areas, serve
the Central Business District, and provide convenient distribution to major downtown
activities. Also, a busway should be of economic design, offering lower per-mile capital
cost when compared to rail transit which is critical because bus transit usually has higher
operating costs than rail. The following sections address these and other issues related to
busway development.
3.1 Planning Considerations
This presents guidelines for the basic planning process, when and where bus rapid transit
and more specifically busways, should be considered and identifies some planning
principles and objectives. When planning for a busway, it should be included in the
overall master transportation plan for a metropolitan area. Before a busway can be
developed, an extensive transportation planning process must be undertaken considering
13
all of possible alternatives of modes (e.g., LRT, busway, etc.) to meet the mobility needs
for a specific corridor. Planning for busway development requires analysis of the
potential level of demand, benefits, cost, and impacts.
Public input plays a key role when it comes to transportation planning. One of the key
issues which may adversely impact the early stage of the planning process of busway
development is an overall negative perception of bus transit by the public as well as some
transit planners. Historically, bus service has been perceived as being of lower quality
than rail service. Another issue regarding public perception of bus transit is that buses
are viewed as being less environmentally friendly than rail. A busway could also be
perceived as not having the same degree of permanence as that of rail since a busway
facility does not need rails or any other form of fixed guideway. These and other issues
must be adequately addressed when pitching the busway concept to the general public,
city planners, and professionals within the transit industry.
It is important to seek local, regional and state cooperation in the planning, development
and implementation of a busway. Other major disciplines to be represented in the
planning process include traffic engineering, urban planning, safety, and security. There
should be an open dialogue between all concerned agencies during the entire planning
process.
One of the key issues when considering busway development is finding the most suitable
corridor for the transitway in conjunction with available rights-of-way. For example, the
14
rights-of-way of an abandoned railroad may be easy to procure but the location of this
ROW may not have the potential of capturing the transit market it is intended to serve.
The railroad ROW may be located in a corridor which does not facilitate easy access for
transit users, e.g. very little or no available space for a parking facility next to busway
station. The same could be said for the development of a busway in a freeway median.
The location of a busway in the middle of a freeway may not be easily accessible to many
potential transit riders since it may not allow for convenient and safe pedestrian access.
The busway should be located in the vicinity of an existing major transit corridor where it
could potentially attract the most ridership. It should also offer convenience and safety
for pedestrian access.
There must be a realistic assessment of the travel demand, benefits, costs, and impact.
The transportation needs must be clearly identified for the transit corridor being
considered for improvement. The objective is to quantitatively analyze a transit corridor
to determine if it meets the criteria for potential busway development. The following
factors should be considered:
1. intensity and growth prospects and patterns of the urbanized area
2. existing and potential future demand for public transportation
3. expansion of the urbanized area
4. street width continuity, capacity, and congestion
5. opportunities for off-street running ways
15
6. locations of major employment centers and residential developments in relation to
potential BRT routes
7. community attitudes -- community willingness to support public transportation
can foster transit-oriented development
8. community resources
(TCRP Report #90- BRT: Volume 2- Implementation Guidelines)
After these factors have been adequately addressed, there must then be a determination of
what type of treatment, if any, best meets the needs of the transit corridor. In order to
perform this, several key questions must be asked. How many buses and bus passengers
are currently using the transit corridor during daily and peak periods? What are the
projected future transit needs, and are the numbers significant enough to warrant the
building of a busway? What are the general traffic flows in this corridor? What are
current auto and bus travel speeds? Where are the major points of road congestion? If a
busway is developed, will there be a significant travel time savings and reduction in
person delay? Also to be addressed are issues concerning roads and rights-of-way that
could be used, ways to accommodate buses through the CBD, and needed changes in the
use of road space and traffic controls, if applicable.
It is also imperative to consider how busway development reflects regional planning
objectives as well as how it relates to and promotes future growth and contributes to
redevelopment. It must also be easy to use and provide a strong sense of permanence and
identity in order for it to be a viable transportation alternative.
16
When preparing to present plans for development of a buway, the following factors
should be clearly identified:
- Vehicle requirements;
- Horizontal and vertical alignments;
- Geometric design features of the facility such as cross-sections, points of
entry/egress, and CBD distribution;
- Station locations and typical designs that show platforms, shelters and structures,
passenger amenities, pedestrian access, bus transfer arrangements and parking;
- Fare collection approach, equipment, and facilities;
- Traffic controls and ITS applications;
- Bus operating plans including routing, service span, types and frequencies;
- Provisions for maintenance and enforcement;
- A staging plan;
- Refined cost estimates;
- Opportunities for transit-oriented development near stations
(TCRP Report #90- BRT: Volume 2- Implementation Guidelines)
The busway plan should be developed as an integrated system that has the same
characteristics of rail transit- emphasis on major markets, improve speed and reliability
and influence transit-oriented development.
17
3.2 Warrants
According to suggested FTA and TCRP guidelines, rapid transit of any type work best in
urban areas that have the following characteristics (1) high employment and population
density, (2) an intensively developed downtown area with limited street capacity and high
all-day parking costs, (3) a long-term reliance on public transport, (4) highway capacity
limitations on approaches to the city center and (5) major physical barriers that limit road
access to the central business district and channels bus flows. The guidelines go on to
suggest that three conditions should be met in order for bus rapid transit to be considered
(1) the proposed location is a large city with a strong CBD, an urbanized area or an
activity center with dense patterns that facilitate transit use; (2) there are current total
passenger flows that might support high service frequencies that are characteristic of
rapid transit, and (3) there is sufficient presence of buses where bus lanes or busways are
being considered. (TCRP Report #90- BRT: Volume 2- Implementation Guidelines)
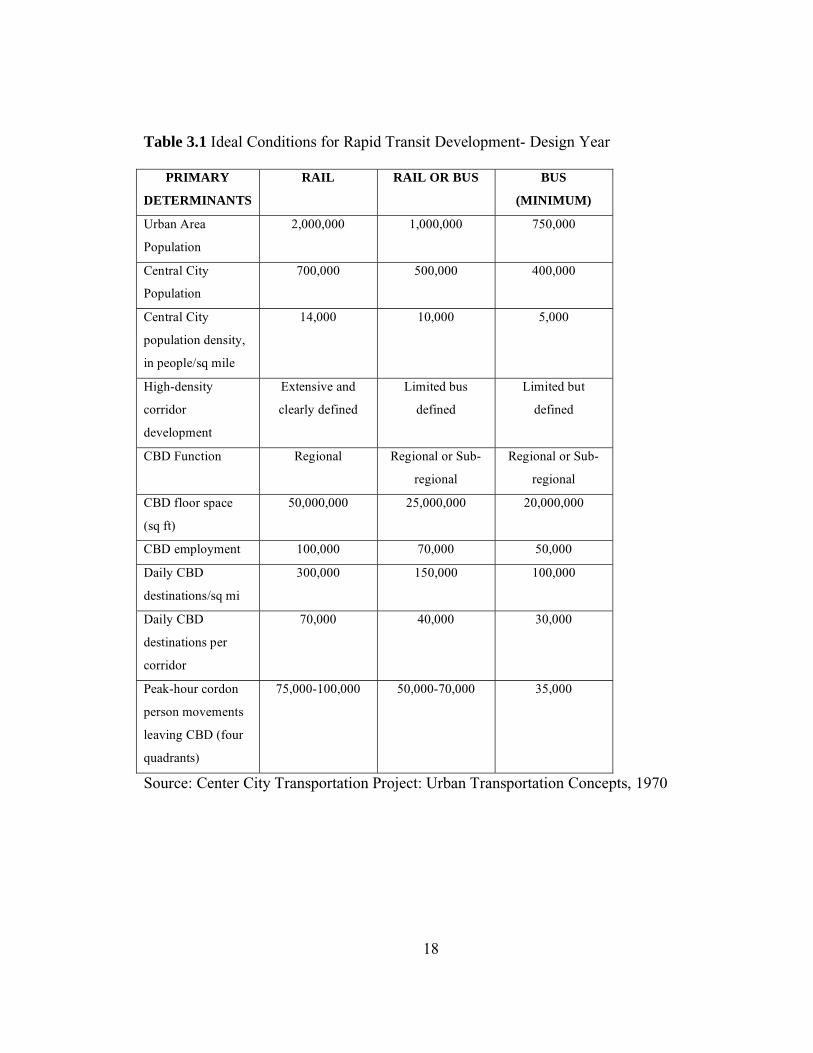
Previous case studies performed by the FTA had shown that the need for any form of
rapid transit is generally dependent upon the size of the urban area, the concentration of
population and activities in key transit corridors and the strength of the CBD. Those case
studies, based on cities in Canada and the United States, have shown that most bus rapid
transit systems are found in cities that have more than 750,000 people and downtown
employment exceeds 75,000 people. See Table 3.1 for more details regarding ideal
conditions for the consideration of rapid transit. The possible exceptions to this would be
18
Table 3.1 Ideal Conditions for Rapid Transit Development- Design Year
PRIMARY
DETERMINANTS
RAIL RAIL OR BUS BUS
(MINIMUM)
Urban Area
Population
2,000,000 1,000,000 750,000
Central City
Population
700,000 500,000 400,000
Central City
population density,
in people/sq mile
14,000 10,000 5,000
High-density
corridor
development
Extensive and
clearly defined
Limited bus
defined
Limited but
defined
CBD Function Regional Regional or Sub-
regional
Regional or Sub-
regional
CBD floor space
(sq ft)
50,000,000 25,000,000 20,000,000
CBD employment 100,000 70,000 50,000
Daily CBD
destinations/sq mi
300,000 150,000 100,000
Daily CBD
destinations per
corridor
70,000 40,000 30,000
Peak-hour cordon
person movements
leaving CBD (four
quadrants)
75,000-100,000 50,000-70,000 35,000
Source: Center City Transportation Project: Urban Transportation Concepts, 1970
19
smaller cities which have unique factors that may be favorable to BRT, to include
busways. Some of those factors may be major physical or topographical limitations as
well as large employment centers or other special activity centers like major medical
facilities and universities. The availability of inexpensive rights-of-ways and rapid urban
growth may be other factors which may warrant the development of bus rapid transit. See
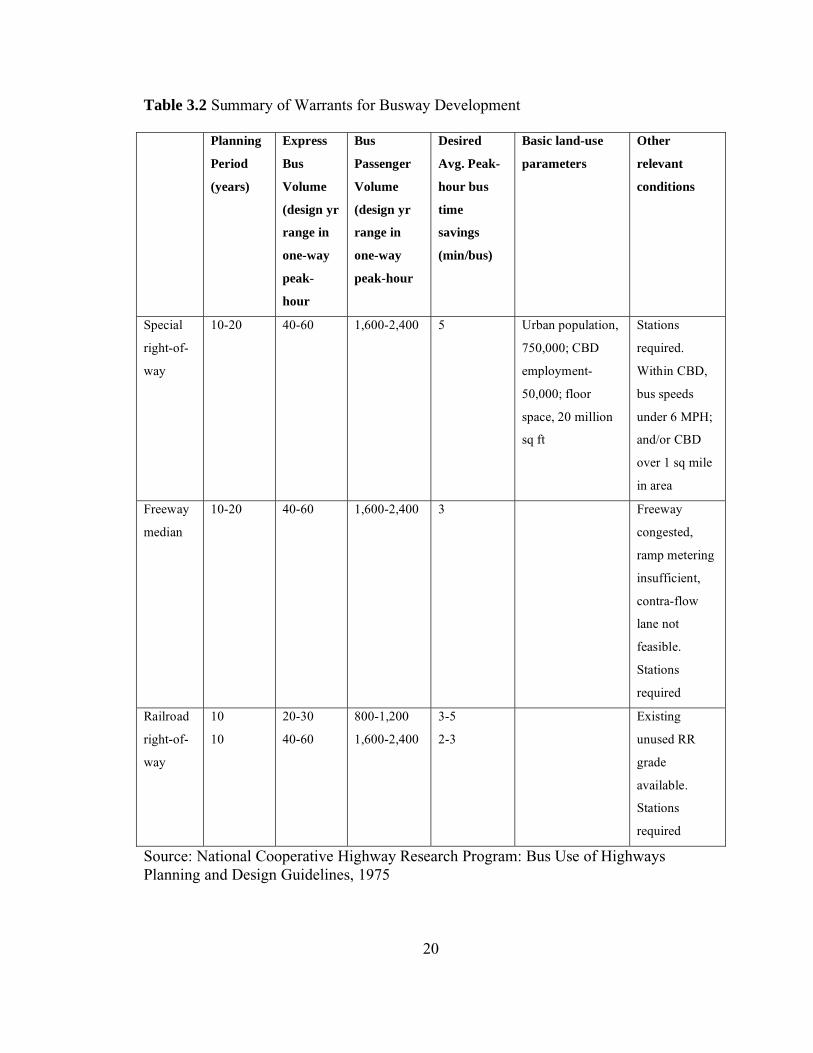
Table 3.2 for details regarding the summary of warrants for busway development for
three different alignments; special right-of-way, freeway median, and railroad right-of-
way.
In order for a busway or any other form of BRT to be attractive, one of the key factors for
its success is the frequency and span of service. It is recommended that bus service
frequencies on a busway should be 8 to 10 minutes during peak hours and 12 to 15
minutes during off-peak hours. The span of service should be at least 16 hours a day.
According to the study, these frequencies should translate into daily ridership of at least
5,000 riders. When bus rapid transit operates on local streets with non-BRT bus routes,
the combined daily ridership should be approximately 10,000. Converging routes that
have overlapping service should operate at 2 to 4 minute headways during peak periods
and every 5 to 6 minutes during off-peak.
20
Table 3.2 Summary of Warrants for Busway Development
Planning
Period
(years)
Express
Bus
Volume
(design yr
range in
one-way
peak-
hour
Bus
Passenger
Volume
(design yr
range in
one-way
peak-hour
Desired
Avg. Peak-
hour bus
time
savings
(min/bus)
Basic land-use
parameters
Other
relevant
conditions
Special
right-of-
way
10-20 40-60 1,600-2,400 5 Urban population,
750,000; CBD
employment-
50,000; floor
space, 20 million
sq ft
Stations
required.
Within CBD,
bus speeds
under 6 MPH;
and/or CBD
over 1 sq mile
in area
Freeway
median
10-20 40-60 1,600-2,400 3 Freeway
congested,
ramp metering
insufficient,
contra-flow
lane not
feasible.
Stations
required
Railroad
right-of-
way
10
10
20-30
40-60
800-1,200
1,600-2,400
3-5
2-3
Existing
unused RR
grade
available.
Stations
required
Source: National Cooperative Highway Research Program: Bus Use of Highways Planning and Design Guidelines, 1975
21
3.3 Design Guidelines
There are two important components of busway or BRT design, running ways and
busway stations/facilities. The running ways for a busway having exclusive right-of-way
should allow for rapid and reliable movement of buses and provide a clear sense of
presence and permanence. Ideally, the access controlled roadway should offer an
operating environment where buses do not have interference from other vehicular traffic
as well as provide superior transit service when compared to traditional bus operations
that operate on local streets intermixing with other traffic. Busway stations should be
convenient, comfortable, safe, and accessible to passengers with disabilities. These
facilities should have a strong sense of identity to the community in which it serves as
well as a sense of permanence.
3.4 Running Ways
There are three basic service components regarding running ways – CBD distribution,
line haul and neighborhood collection. The CBD distribution should allow buses to
penetrate local streets in close proximity to major employment centers within the
downtown area. Line haul routing should provide fast access leaving the CBD to
outlying commercial and residential communities with minimum or no interference from
other traffic. Neighborhood collection should allow for easy access to transit within
suburban communities. The objective is to offer transit users a one-seat ride from origin
22
to destination on a full access controlled roadway without the need for physically
transferring to other transit vehicles. For the purposes of this thesis, running way
classification of Class I-Uninterrupted Flow-Full Control of Access will be discussed and
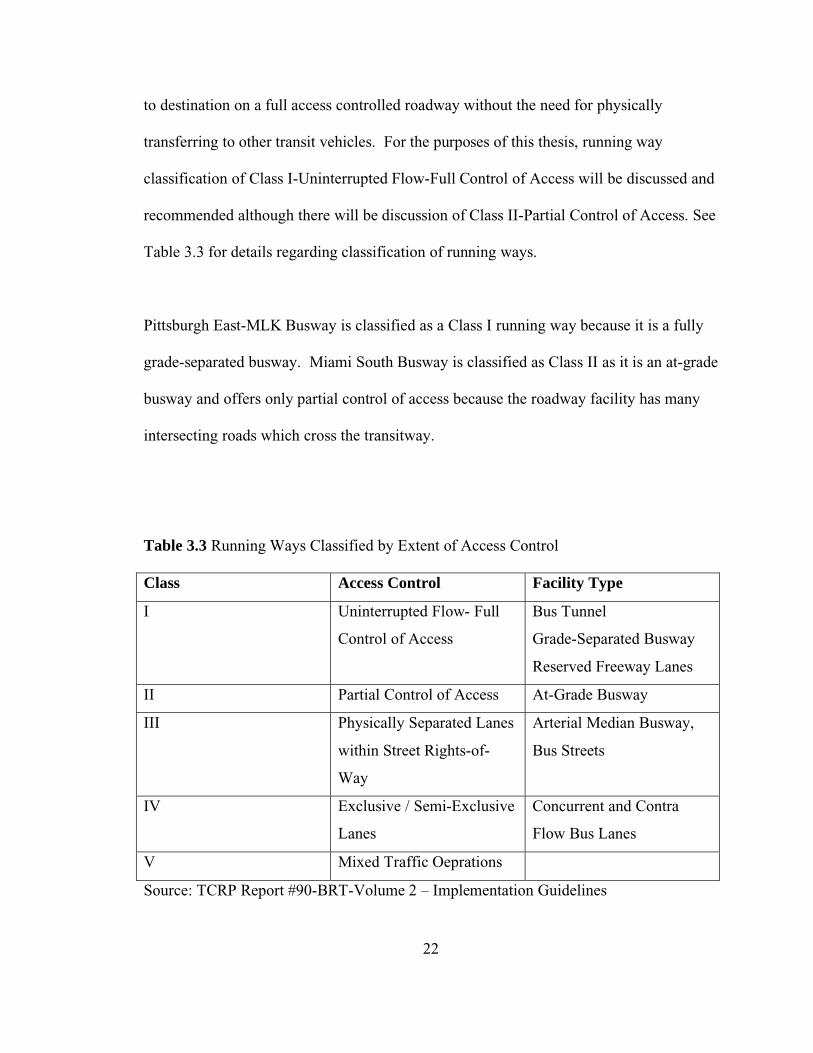
recommended although there will be discussion of Class II-Partial Control of Access. See
Table 3.3 for details regarding classification of running ways.
Pittsburgh East-MLK Busway is classified as a Class I running way because it is a fully
grade-separated busway. Miami South Busway is classified as Class II as it is an at-grade
busway and offers only partial control of access because the roadway facility has many
intersecting roads which cross the transitway.
Table 3.3 Running Ways Classified by Extent of Access Control
Class Access Control Facility Type
I Uninterrupted Flow- Full
Control of Access
Bus Tunnel
Grade-Separated Busway
Reserved Freeway Lanes
II Partial Control of Access At-Grade Busway
III Physically Separated Lanes
within Street Rights-of-
Way
Arterial Median Busway,
Bus Streets
IV Exclusive / Semi-Exclusive
Lanes
Concurrent and Contra
Flow Bus Lanes
V Mixed Traffic Oeprations
Source: TCRP Report #90-BRT-Volume 2 – Implementation Guidelines
23
According to TCRP based upon FTA suggested guidelines, here are the guidelines which
should influence location and design of running ways with regard to busways or BRT:
- Running ways should serve major travel markets and they should penetrate these
markets whenever possible
- Running ways generally should be radial, connecting the city center with outlying
residential and commercial areas
- BRT is best achieved by providing exclusive grade separated rights-of-way to
serve major markets
- Effective downtown passenger distribution factilities are essential in providing
direct BRT service to downtown trip origins and destinations
- BRT running ways should follow streets that are relatively free flowing whenever
possible
- Special running ways (busways, bus lanes, and queue bypasses) should be
provided
- Preferential treatment for buses may be provided around specific bottlenecks or
along an entire route
- Running ways should maximize the person flow along a roadway with minimum
net total person-delay over time
- An exclusive bus lane should carry significantly more people than an adjoining
general traffic lane used during the the peak travel periods
24
- Buses should be able to enter and leave running ways safely and conveniently
- Running ways should provide a strong sense of identify for BRT
- Adequate signing, marking and traffic signal controls are essential
- Bus lanes and queue bypasses may be provided along both one-way and two-way
streets
- Running way designs should be consistent with established national, state and
local standards
- Running way designs may allow possible future conversion to rail transit without
disrupting BRT operations
- Running ways can be shared by BRT and LRT when they are designed to
accommodate both transit types in terms of cross section, curves, grades and
vertical clearance
(TCRP Report #90- BRT-Volume 2, Implementation Guidelines)
When considering the type of running way for busway design, costs may be a major
factor in the decision making process. In fact, it was costs that forced the hands of Miami
MDTA to decide that the South Busway would be an at-grade semi-access controlled
busway versus a fully grade-separated busway. According to the FTA, the costs involved
for a fully grade-separated busway facility are as follows:
Cost (not including ROW)
- Aerial Transitway - $12-30 million per lane mile
- Below-grade Transitway - $60-105 million per lane mile
25
- Additional Lanes: $2.5-3 million per lane mile (within existing roadway profile);
$6.5-10.12 million per additional lane mile
The costs for an at-grade busway are approximately $6.5-10.2 million per lane mile. This
figure does not include the cost of acquiring right-of-way. (Project No. FTA-VA-26-
7222-2004.1, Characteristics of Bus Rapid Transit for Decision-Making, August 2004)
The following table offered by the Transportation Research Board-Natioinal Research
Council provides some general guidelines for running way design for fully-grade
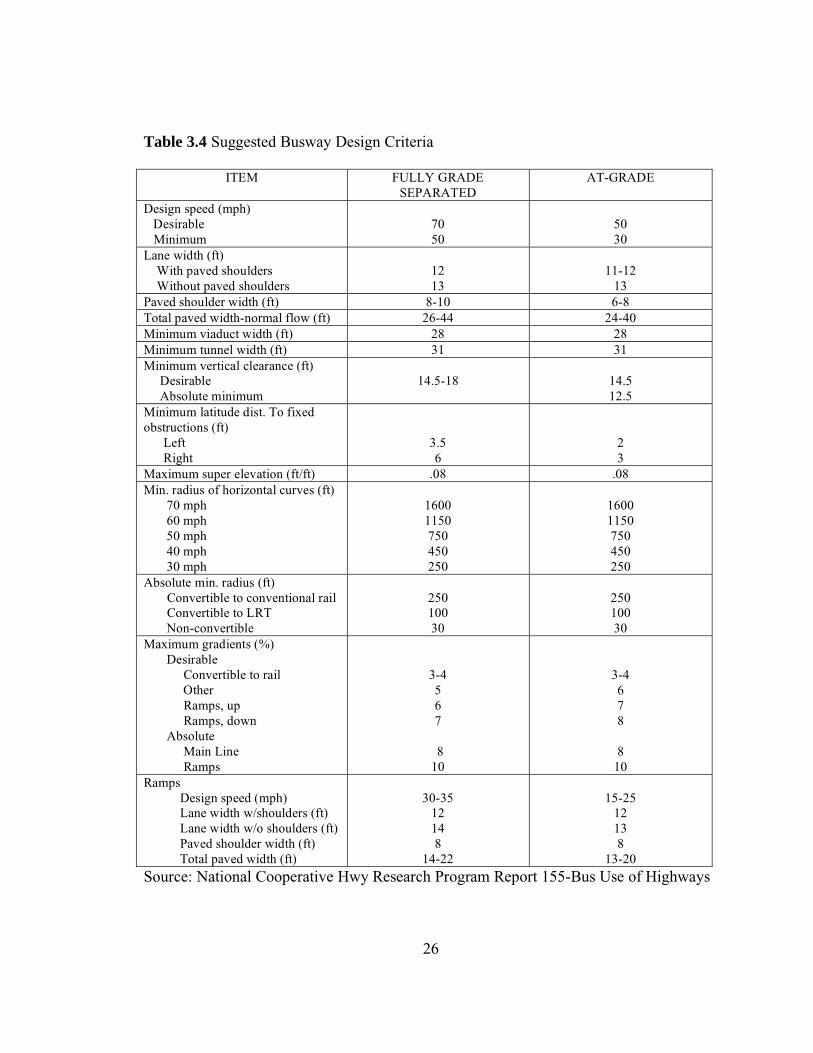
separated busway and at-grade busways with intersections. See Table 3.4 “Suggested
Busway Design Criteria” for more details regarding specific design criteria.
3.5 Busway and BRT Stations
Busway and BRT station design is an important feature of any BRT system. The stations
must have a unique identity that differs from stops used by conventional bus operations.
The station design must integrate with the local character of the corridor served and be
easily recognizable to transit users. The station design must demonstrate unique
characteristics that identify with speed and reliability. This is very important because the
premise is to offer a superior product which differentiates itself from traditional bus
services. Ideally, busways and BRT are developed to not only accommodate existing
transit users in a corridor but also attract new customers.
26
Table 3.4 Suggested Busway Design Criteria
ITEM FULLY GRADE SEPARATED
AT-GRADE
Design speed (mph) Desirable Minimum
70 50
50 30
Lane width (ft) With paved shoulders Without paved shoulders
12 13
11-12
13 Paved shoulder width (ft) 8-10 6-8 Total paved width-normal flow (ft) 26-44 24-40 Minimum viaduct width (ft) 28 28 Minimum tunnel width (ft) 31 31 Minimum vertical clearance (ft) Desirable Absolute minimum
14.5-18
14.5 12.5
Minimum latitude dist. To fixed obstructions (ft) Left Right
3.5 6
2 3
Maximum super elevation (ft/ft) .08 .08 Min. radius of horizontal curves (ft) 70 mph 60 mph 50 mph 40 mph 30 mph
1600 1150 750 450 250
1600 1150 750 450 250
Absolute min. radius (ft) Convertible to conventional rail Convertible to LRT Non-convertible
250 100 30
250 100 30
Maximum gradients (%) Desirable Convertible to rail Other Ramps, up Ramps, down Absolute Main Line Ramps
3-4 5 6 7
8 10
3-4 6 7 8 8
10 Ramps Design speed (mph) Lane width w/shoulders (ft) Lane width w/o shoulders (ft) Paved shoulder width (ft) Total paved width (ft)
30-35
12 14 8
14-22
15-25
12 13 8
13-20
Source: National Cooperative Hwy Research Program Report 155-Bus Use of Highways
27
Busway or BRT stations may be simple or sophisticated in design. The more features a
station offers, the greater the potential to attract new riders. Some BRT systems have
basic transit stops which may offer nothing more than a bus shelter. This is common
with those systems which run simple limited-stop services. Enhanced stops may include
a more elaborate bus shelter with lighting and offer basic amenities like benches, pay
phones and trash cans. Two examples of BRT systems with enhanced stops would be
LACMTA “The Rapid” in Los Angeles, CA and PAT South Busway in Pittsburgh, PA.
A designated station may have platforms for level boarding and deboarding as well as a
full range of amenities for passengers such as printed transit information and perhaps
retail services. PAT East-MLK Busway in Pittsburgh, PA has designated stations along
its transitway. A transit center or intermodal terminal is a more elaborate facility with
numerous types of enhanced services such as a customer service desk. Such larger
facilities could accommodate numerous bus routes, rail transit and intercity bus and rail.
The costs for BRT stops will vary according to number of features and amenities offered.
The most basic stop with only a shelter may cost from $15,000 to $20,000 per shelter.
The most advanced transit center may run upwards of $5 million $20 million for the
facility. (Project No. FTA-VA-26-7222-2004.1, Characteristics of Bus Rapid Transit for
Decision-Making, August 2004)
Busway stations should be adequately spaced apart in order to achieve high operating
speeds as well as minimize travel times. This is one of the primary advantages of BRT
28
over traditional bus services and this should be exploited whenever possible. Depending
upon arrival mode of transit users will depend on busway station distances. For those
stations which are closer to the urban center, and where pedestrian access is more
prevalent, it is suggested that station spacing should be between .25 and .33 miles apart.
If the primary arrival mode is by transferring from another bus, .5 to 1.0 miles is
recommended. For transit users who drive an automobile to a park and ride lot near a
busway station, 2.0 miles is suggested.
The following is a detail of busway station features which will vary according the needs
of the transit corridor and costs. Sources used are TCRP Report #90- BRT-Volume 2,
Implementation Guidelines and Project No. FTA-VA-26-7222-2004.1, Characteristics of
Bus Rapid Transit for Decision-Making.
Platform height is determined by height of the curb at the leading edge of the platform.
There are three basic platform height options: standard curb, raised curb and level
platform. Standard curbs have a vertical height of approximately 6 inches, raised curbs
have 9-10 inches and level platforms with 14 inches. Level platforms are most ideal as
they offer ease of boarding and alighting standard high floor transit vehicles. For busway
systems using low floor buses, a standard curb would be sufficient.
Platform length with a single berth typically has 60 feet in length when conventional 40
foot buses are used. Busway station platforms can be 300 feet or longer if there is a need

29
to accommodate multiple articulated buses. Penn Station on the East-MLK Busway in
Pittsburgh, PA has a busway platform length over 300 feet.
A busway station should be designed to offer passing capability for express buses or
when there is a frequent level of service in which buses may form long queues at stations
during peak periods. Buses can pass stations by either having a passing lane or a lane
which offers bus pull-outs.
Station access is another important factor which determines pedestrian accessibility
and/or linkages to a nearby park and ride facility. Pedestrians should be able to access
busway stations by sidewalks and pedestrian bridges, whenever possible. There should
be a pathway by pedestrian bridge or another type of path for easy access to area park and
ride facilities. It is important that the busway station has a safe design so to not
encourage pedestrians from crossing the active transitway.
A busway station should also provide a secure environment by offering adequate lighting
as well as easily identifiable emergency phones. Stations should be illuminated well in
order to avoid any dark areas on station platforms. Closed-circuit television monitoring
and/or police surveillance on foot patrol may be ideal if not too cost-prohibitive.
30
4 CASE STUDIES – PITTSBURGH, PA and MIAMI, FL
4.1 PITTSBURGH, PA
Pittsburgh, Pennsylvania is the first city in the United States to have a fully operational
busway network. With a population of 1,400,000 in the metropolitan area, Pittsburgh
currently has three busways operating along 19 miles of dedicated roadway, serving a
few of the heaviest transit corridors in the region. The transit authority has plans to
expand the busway network by providing busways along other important transit corridors
which are currently served by only traditional local/express bus service.
4.1.1 Port Authority of Allegheny County (PAT)
The Port Authority of Allegheny County (PAT) is the primary agency operating mass
transit service for the metro Pittsburgh area, which includes most of Allegheny County as
well as portions of neighboring Armstrong, Beaver, Washington and Westmoreland
Counties. With a service area of over 730 square miles, PAT operates 1000 buses
(standard, articulated, and over-the-road motor coaches), 83 light rail vehicles, 2 incline
cars and over 450 paratransit vehicles. PAT operates the Monongahela Incline, a private
organization operates the 2 cars running on the Duquesne Incline. Systemwide average
weekday ridership (for all modes) is 230,000. Weekend ridership is 108,000 for
Saturdays and 63,000 for Sundays. Annual ridership for 2003 was approximately 68
31
million. (Port Authority of Allegheny County General Statistics website,
http://www.portauthority.org)
Before the creation of the Port Authority of Allegheny County, there was a variety of
transit services operated by numerous private bus and rail companies. In the spring of
1964, PAT took over most of these bus and rail operations to promote a more cohesive
transportation network in the metropolitan Pittsburgh area. In the mid-1970s, PAT began
exploring ways to improve the service for commuters traveling between the central
business district and the suburbs in the southern region of the metropolitan area. In 1977,
PAT opened its very first access controlled bus roadway, called the South Busway.
Before the development of Pittsburgh’s first busway, traditional bus service operated
primarily on local surface streets and thereby was subjected to the same traffic conditions
as other vehicles. To ease the gridlock problems between suburbs to the south and the
central business district, the South Busway seemed to be an attractive alternative. The
South Busway was followed by the East Busway and then the West Busway.
4.1.2 South Busway
The first phase of the busway network included a dedicated bus roadway with connection
to a railroad tunnel through Mount Washington. The railroad tunnel, which was used by
the old streetcar network, was modified to accommodate rubber-tired vehicles as well as
maintain the trackage for joint use with rail transit. Both buses and light rail operate in
tandem through the Mount Washington tunnel as well as along the busway for the first
32
few stations. No local vehicular traffic is authorized to use of tunnel, except for
emergency vehicles. This makes the South Busway unique because the other two
busways in the network do not have rail operations along any portion of the roadways.
PAT transit buses exit the central business district using the Smithfield Street Bridge over
the Monongahela River to Station Square LRT station, then proceeding through Mount
Washington Tunnel and continuing to the South Busway onto suburban destinations.
Sixteen PAT bus routes use the South Busway to serve residential areas such as Baldwin
Township, Bethel Park, Brentwood, Knoxville, and Mount Oliver. Not all buses
traveling via Mt Washington Tunnel use the South Busway. A private suburban operator,
Mid-Mon Valley Transit Authority (MMVTA), also utilizes the Mount Washington
tunnel and South Busway to reach the more outlying suburbs of Donora, Charleroi, and
Spears in Washington County.
The South Busway has a total of 11 stations operating along 4.3 miles of roadway.
Many of these stations are basic stops for boarding/alighting without having typical
busway station features found in the rest of the network. All South Busway stations have
side platforms. The busway has one lane per direction with several stations
accommodating both bus and rail vehicles. Bus lane width is 12 feet wide. The South
Busway is not exclusive ROW on all portions of the transitway. There are segments of
the busway which have intersecting streets which cross the busway facility.
33
There are a total of 552 weekday bus trips with an approximate ridership of 11,000. The
construction cost of the South Busway was $27 million for 4.3 miles of length. (Port
Authority of Allegheny County website, http://www.portauthority.org)
4.1.3 East Busway (aka Martin Luther King, Jr. Busway)
The next busway built in Pittsburgh after the South Busway was the East Busway (now
renamed Martin Luther King, Jr. East Busway), which opened in early 1983. This
busway was constructed along the abandoned Pennsylvania Railroad right of way serving
the busiest transit corridor in metropolitan Pittsburgh. Two tracks were removed for
busway construction. A total of 36 bus routes use this busway, reaching the most densely
populated areas of Pittsburgh where transit dependent ridership is greatest.
The original premise for the East Busway was to construct it so that later it could possibly
be converted to light rail transit operations, contingent upon demand. Since ridership
levels have far exceeded original estimates, plans are still in place for eventual
conversion to light rail when funds become available.
Because of supportive local policies regarding land use in the eastern region of the city,
the East Busway has proven to be a big success. After the opening of the East Busway,
there has been a lot of new development near and around busway stations. Numerous
shopping centers have sprung up as well as new commercial office buildings and
apartment complexes. The busway allows easy continuous access to these newly
34
developed centers without requiring transit users to transfer between different bus routes.
As a result of all of this new development, the East Busway has been able to enjoy
significant ridership gains over the years because this busway is not only used for
commuter trips but also other types of transit trips.
The East Busway facility begins at Penn Station in the western section of downtown
Pittsburgh and operates to the east through many of the large commercial and residential
areas of East Liberty, Homewood, Wilkinsburg and Swissvale. The East Busway has a
total of nine stations and operates along 9.1 miles of access controlled roadway for buses
exclusively. 6.8 miles opened in 1983, another 2.3 miles opened in summer 2003. All
East Busway stations have side platforms. The busway has one 12 foot lane per direction
with a center passing lane at stations for limited-stop/express bus routes. The construction
cost of the busway (without extension) was $115 million (with extension, an added $68
million for the 9.1 miles of length). There are a total of 973 bus trips with an average
weekday ridership of nearly 30,000. Several of the busway stations have commuter park
and ride lots adjacent to stations. (Port Authority of Allegheny County website,
http://www.portauthority.org)
4.1.4 West Busway
The most recent busway built in Pittsburgh is the West Busway, which opened, in late
2000. This busway primarily serves the less densely populated suburban communities of
western Pittsburgh. One of the greatest features of this busway is having the new faster
35
link between downtown Pittsburgh and Pittsburgh International Airport. A bus trip to the
airport from downtown now takes only 40-minutes, causing stiff competition with taxi
services which offer similar trip times. Before the opening of the West Busway, there was
sporadic transit service from the airport to the central business district. Today, PAT bus
route “28X-Airport Flyer” offers frequent (and rapid) service between the airport and
downtown Pittsburgh with continuing local service to business, hospital, and university
districts in Oakland. In fact, it is route 28X, which made the West Busway a success,
having the highest ridership of any other route along this busway. Also serving the West
Busway are routes “100-West Busway-All Stops” and “33X-West Busway Downtown-
All Stops”. Route 100 runs weekdays only whereas route 33X runs weekday peak
periods and weekends. PAT bus route 28X travels most of the West Busway and then
connects with I-279 Parkway West Expressway which leads to airport. Bus routes 100
and 33X operate along the entire length of the the busway between Carnegie and
Sheraden Stations.
The Port Authority of Allegheny County anticipates that the new West Busway will
experience significant ridership gains in the future because the busway alignment runs
through several areas of metropolitan Pittsburgh which are slated for new development as
a result of local policies in support of mixed land use for commercial development. In
fact, it was part of the planning process for the West Busway to be located in a corridor
which could promote future growth. The busway stations were strategically placed at
locations along the transitway where there is the greatest potential of future commercial
and residential development (Interview- Richard Feder, AICP, PAT, Mar. 2003)
36
The West Busway begins near West Carson Street along the Ohio River, opposite
downtown Pittsburgh, travels through the Berry Street Tunnel and terminates near the
community of Carnegie. Part of the busway uses existing (and abandoned) Conrail
railroad rights of way. The busway has a total of six stations along 5 miles of exclusive
roadway for buses and there is one lane per direction of travel. The construction cost of
this facility was $258 million for the 5 miles of length. There are a total of 391 bus trips
per weekday with an average ridership level of just over 9,500. The West Busway also
hosts commuter park and ride lots adjacent to most of its busway stations (Port Authority
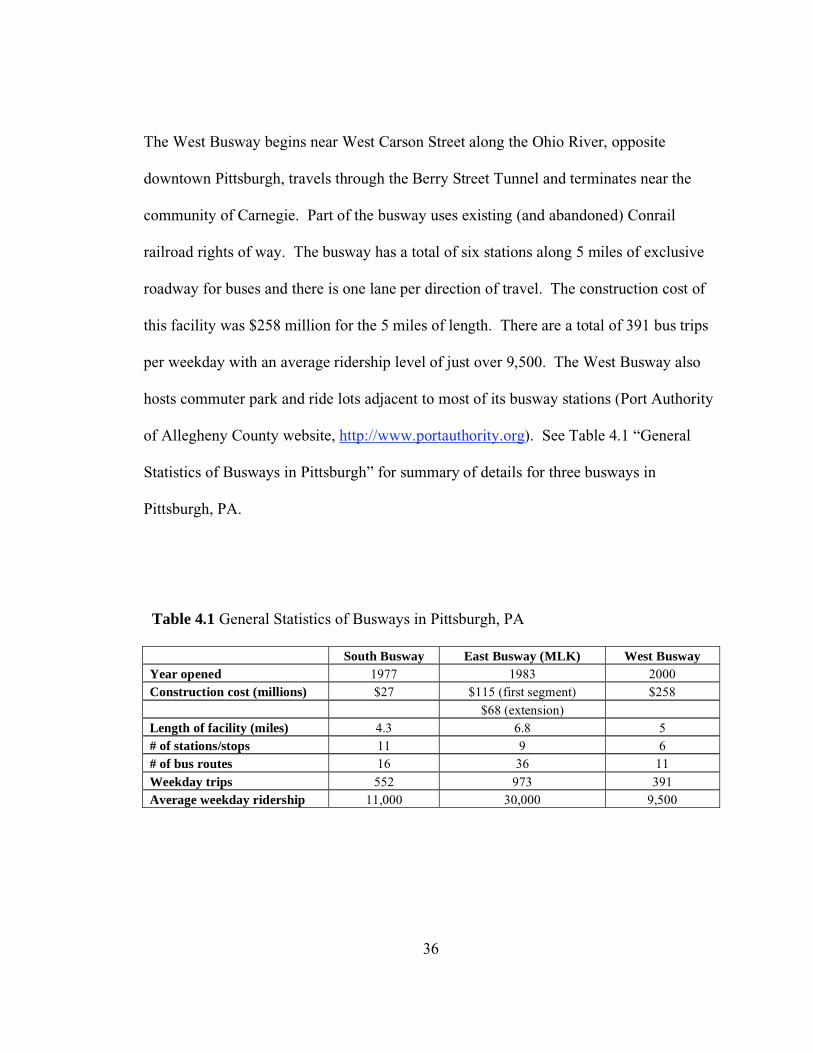
of Allegheny County website, http://www.portauthority.org). See Table 4.1 “General
Statistics of Busways in Pittsburgh” for summary of details for three busways in
Pittsburgh, PA.
Table 4.1 General Statistics of Busways in Pittsburgh, PA
South Busway East Busway (MLK) West Busway
Year opened 1977 1983 2000 Construction cost (millions) $27 $115 (first segment) $258 $68 (extension) Length of facility (miles) 4.3 6.8 5 # of stations/stops 11 9 6 # of bus routes 16 36 11 Weekday trips 552 973 391 Average weekday ridership 11,000 30,000 9,500
37
4.1.5 Future Outlook for Rapid Transit in Pittsburgh
As mentioned previously, PAT is evaluating other potential transit corridors to build
more busway type facilities to improve the mobility of buses from the CBD to outlying
communities and suburbs. However, recent problems with cuts in funding at the state
level has forced PAT to consider reducing existing levels of transit service. There are no
new plans for expanding the busway network with the exception of those plans that
already have dedicated funding. In the meantime, PAT is still performing various
transportation studies, exploring a variety of transportation options for the metropolitan
area. Some of these studies include other forms of rapid transit. In the Airport
Multimodal Corridor Major Investment Study, there is serious consideration for LRT
(versus bus transit) to better serve the communities to the west of Pittsburgh. The North
Shore Connection study focuses on the continuation of LRT services via subway tunnels
under the Allegheny River for improved access to this growing region which hosts large
sporting facilities as well as numerous redeveloped areas.
4.2 MIAMI, FL
Like many large metropolitan areas in the United States, Miami, FL has been exploring
various ways of improving the movement of people throughout the metro area. Miami,
FL is the 16th largest metropolitan area in the U.S. with a population of just under two
million inhabitants. The Miami metro area has historically been plagued with severe
38
traffic problems due to the continued surge in population growth. Major roadways as
well as the numerous causeways crossing the Intracoastal Waterway to Miami Beach
operate at capacity. Local downtown Miami streets also have become heavily congested
due to a dramatic increase of businesses and commercial development. There are not
enough existing freeways to adequately serve all of these regions of Dade County and it
is nearly impossible to build more roadways because of the limitation of available space.
Transportation planners in South Florida have examined many ways of easing the daily
traffic congestion problem in metropolitan Miami and have realized that the best option
for improving mobility is to invest more in mass transit.
4.2.1 Miami-Dade Transit Authority (MDTA)
The Miami-Dade Transit Authority (MDTA) is the primary operator of public transit
services in the Miami area, which includes all of Dade County as well as the beach
communities to the east and the southernmost portion of Broward County to the north.
The MDTA has a service area of over 350 square miles. The transit system operates 830
buses (standard, articulated, and minibuses), 136 heavy rail vehicles (Metrorail), 29 fully-
automated people-mover vehicles (Metromover), and nearly 200 paratransit vehicles.
Systemwide average daily weekday ridership for all modes is approximately 350,000.
Average weekend ridership is 200,000 for Saturdays and 155,000 for Sundays. Total
annual riderhsip (which includes total boardings for paratransit ambulatory and non-
ambulatory services) for FY 2003 was approximately 87 million. It is important to note
that the total annual transit ridership in Miami has been steadily increasing over the last
39
decade. (MDTA Facts at a Glance; MDTA System Performance Summary; National
Transit Database)
The MDTA currently operates transit services 24 hours a day, seven days a week. The
transit system operates fixed route services on 92 local/express/limited-stop bus routes,
one rapid rail line (Metrorail) and three downtown circulator (Metromover) routes which
operate on an elevated guideway. There are eleven local bus routes, three dedicated
“night owl” bus routes and paratransit services that operate 24 hours a day.
After the removal of the last streetcar lines in the fall of 1940, the only transit service
available for several decades was traditional bus. Under the old MTA, the route structure
was not set up to offer much limited-stop or express service and so buses were slow,
overcrowded and inefficient. More people opted to use their private vehicles as an
alternative to undependable bus transit. Consequently, ridership levels plummeted to all-
time lows during this period (Motor Coach Age-Miami, Nov 1971). After the formation
of the MDTA, the transit authority explored various ways to attract people back to mass
transit. The only way to do this was to offer a product that is far superior to transit
services that were offered in the past. Commuters needed to have an attractive alternative
that was more than traditional bus service.
40
4.2.2 Birth of Rapid Transit in Miami
In 1984, the MDTA opened it’s very first rapid rail line called Metrorail. Two years later,
the MDTA made another improvement by opening Metromover, the downtown circulator
built to improve mobility within the CBD. The Metromover was also designed to offer a
free connection for Metrorail passengers who need access to parts of the downtown area
in which Metrorail does not serve. Metromover is a “people mover” system with vehicles
of 60 passenger capacity and it operates in an automated manner. Metrorail operates
along an elevated 22.4-mile heavy rail line from the northern section of Dade County
(Hialeah), through downtown Miami and onto the south county region of Dadeland. Like
many other transit systems despite high hopes of adding or extending existing rail
service, the MDTA was financially unable to build more rail lines. The problem with this
situation is that the South Dade County area has been developing in leaps and bounds and
current Metrorail service is not able to adequately serve these growing communities
because its current southern terminus does not extend to this region. The MDTA
originally had the idea of extending the existing rail line beyond the Dadeland-South
station along US Route 1. However, due to financial constraints, it was unable to find
adequate funding for future construction. As a consequence, the MDTA had to become
more industrious in finding alternative ways of providing a less costly but efficient rapid
transit service to connect Metrorail to these densely populated communities. Historically,
only local bus lines served this region via congested local streets. These local buses are
subjected to the same traffic conditions as all other vehicles on the road hence, and thus
there is no real time saving advantage for commuters. The MDTA wanted to find a way
41
to offer bus service from these south Dade County communities to the closest Metrorail
station by bypassing congested roadways. The MDTA’s answer to this complex problem
was the development of a bus-only controlled access roadway called the South Busway.
4.2.3 Introduction of the South Busway
The South Busway is a semi-access controlled at-grade roadway which operates along the
old Florida East Coast (FEC) railroad right-of-way. The Florida Department of
Transportation and Federal Transit Administration deemed it cost prohibitive to develop
an elevated roadway for buses in this corridor. Because of the existing unique roadway
configuration in this corridor, it was impossible to construct the busway to avoid cross
roads intersecting at-grade with the transitway. The busway is located directly parallel to
a major national highway, Hwy US 1 (Dixie Highway) to the east. Most sections of the
South Busway are only 100 feet from Dixie Highway, the most heavily traveled corridor
in Dade County. Because of the close proximity to this busy thoroughfare, there are
many intersecting roads that cross the alignment. There are no overpasses to avoid
conflict with the transitway so traffic signals are located at each of these intersecting
roads. Currently, traffic signal pre-emption (using loop detectors) is disabled for safety
reasons due to numerous crashes between buses and cars which resulted in three deaths
thus far. Traffic signal operation on the busway is coordinated with traffic signals on
Hwy US 1. When Hwy US 1 has a “green” light, all westbound turning traffic has a
“red” turn signal. During this phase, any bus on the busway will come to a complete stop
as it approaches the intersecting road. If the light is “green” for Hwy US 1, then the light
42
for the bus at the intersection on the busway will turn from “red” to “green”. The bus
would then proceed slowly (15 mph) through the intersection. If there is a “red” light on
Hwy US 1, all busway traffic must come to a complete stop and wait until the light for
the highway cycles back to “green”. Because transit buses operating along the
transitway have to stop at not only busway stations/stops but all traffic signals as well if
the light is red, this impedes the performance of the busway since transit vehicles are
frequently stopping at locations other than stations. Bus travel times have now increased
by 8-10 minutes as a result of the frequent stopping at traffic lights along the transitway.
The South Busway is not truly rapid in nature though, it is an improvement over
traditional local bus service. However, the MDTA is currently investigating the issue and
may have a remedy soon by reintroducing traffic signal pre-emption to improve bus
travel times along the South Busway (Interview- Joe Peres, MDTA, Feb 2006).
4.2.4 South Busway - Phases I and II
The MDTA opened the first 8.2 mile segment (Phase I) of the South Busway in early
1997. This initial segment is from the Metrorail Dadeland-South terminus to SW 200
Street in Cutler Ridge. Next, Phase II includes two segments, a 5-mile segment
extending to SW 264 Street in Naranja and a 6.5-mile segment to it’s terminus at SW 344
Street in Florida City. The 5-mile long first segment of Phase II became operational in
2004. The second segment of Phase II should be completed in late 2005. Thus far, there
are a total of 22 stations along 13.2 miles of busway. Upon completion of the entire
43
South Busway, there will be a total of 30 stations along the transitway with a total length
of 19.8 miles.
The cost for the first 8.2 miles of the busway was $21 million plus $17 million for the
purchase of the Florida East Coast Railroad right-of-way (for the entire length of the
transitway). It is estimated that the total cost for the entire 19.8 mile long busway from
Dadeland to Florida City will be approximately $43 million. The busway alignment is
100 feet wide with two 12-foot lanes – one for each direction. At each busway station,
there are passing lanes to allow for express busses to pass during peak periods. Every
station could support a maximum of three standard length buses per direction. Busway
stations do not contain ITS elements or enclosed waiting areas but many have open
shelters, benches, posted maps/route frequency tables and public phones. As of this
writing, many busway stations have been severely damaged by the affects of Hurricane
Wilma. The hurricane had torn the plastic coverings off shelter canopies as well as swept
away posted bus route frequency tables and maps. The transit agency plans to refurbish
the affected busway stations sometime in the near future.
4.2.5 South Busway - Travel Times, Frequencies and Routes
Current bus travel times from the Dadeland-South Metrorail station to SW 200
Street/Cutler Ridge busway station is 25 minutes. Travel times from Dadeland-South to
SW 264 Street station is approximately 40 minutes. The total travel time to the final
busway station at Florida City is expected to be just less than 60 minutes (significantly
44
less than local bus service which could take up to 2.5 hours with transfers). The MDTA
has plans to improve these bus travel times by reducing dwell times at busway stations
and reintroducing traffic signal pre-emption at intersections.
The South Busway is a roadway exclusively for buses with the exception of emergency
vehicles. The busway could also be used as an evacuation route in the event of a natural
disaster or other emergency. Nine MDTA bus routes currently have service on at least
some portion the South Busway but only the Busway Local (#31), Busway Flyer (#34)
and Busway Max (#38) operate on most of the facility. Refer to figures in Appendix for
specific details on routing. “Busway Max” is the only route that operates 24-hours a day
on the South Busway. Service frequencies of routes operating on the busway vary by
time of day and day of week. On average, bus frequencies during weekday peak periods
are 3-10 minutes. Headways for overnight owl service are 60 minutes. For more details
regarding frequency of service along the South Busway, refer to Table 4.2 “Bus
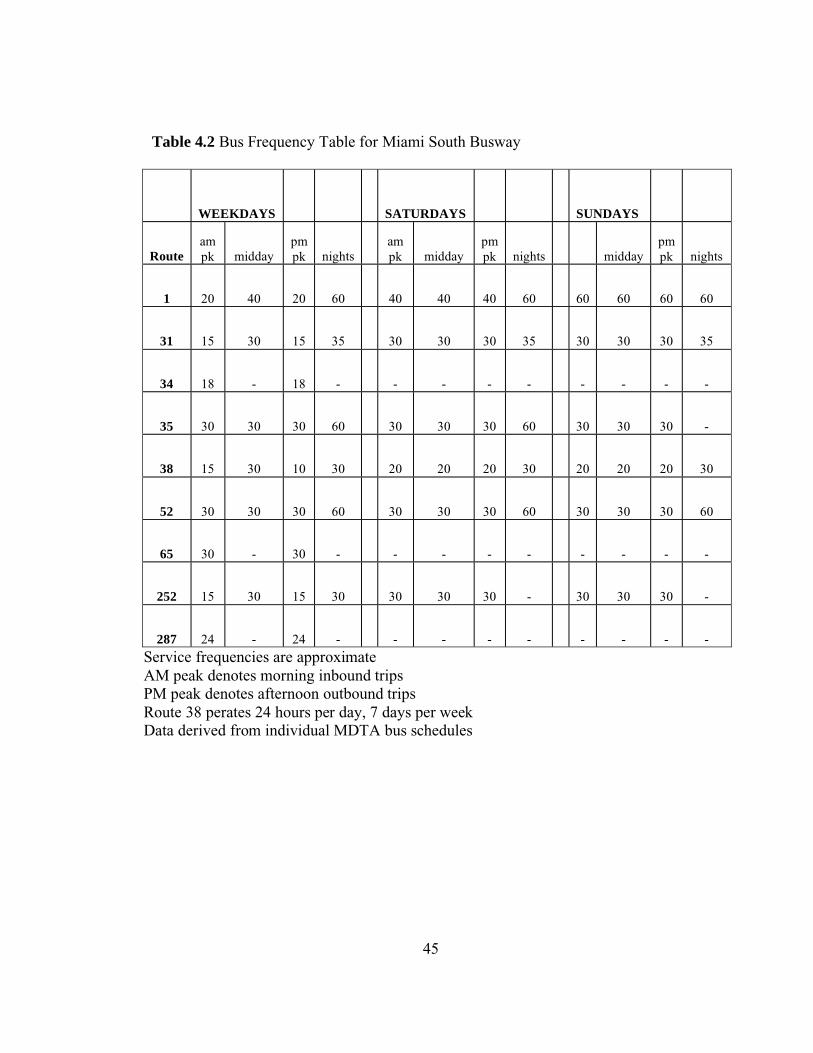
Frequency Table for Miami South Busway.”
For all routes combined, there are approximately 12,500 boardings each weekday and
13,600 for both Saturday and Sunday, totaling to just over 75,000 riders per week, far
exceeding projected ridership estimates. Ridership along the South Busway continues to
grow each month as it gains in popularity amongst South Dade County commuters.
45
Table 4.2 Bus Frequency Table for Miami South Busway
WEEKDAYS SATURDAYS SUNDAYS
Route
am pk midday
pm pk nights
am pk midday
pm pk nights midday
pm pk nights
1 20 40 20 60 40 40 40 60 60 60 60 60
31 15 30 15 35 30 30 30 35 30 30 30 35
34 18 - 18 - - - - - - - - -
35 30 30 30 60 30 30 30 60 30 30 30 -
38 15 30 10 30 20 20 20 30 20 20 20 30
52 30 30 30 60 30 30 30 60 30 30 30 60
65 30 - 30 - - - - - - - - -
252 15 30 15 30 30 30 30 - 30 30 30 -
287 24 - 24 - - - - - - - - -
Service frequencies are approximate AM peak denotes morning inbound trips PM peak denotes afternoon outbound trips Route 38 perates 24 hours per day, 7 days per week Data derived from individual MDTA bus schedules
46
4.2.6 Future Outlook for Rapid Transit in Miami
It should be pointed out that in addition to the South Busway, there are many other
exciting prospects for Miami’s future in terms of mass transit improvements, which
include plans for the development of additional Metrorail lines as well as re-introducing
electric streetcars in the downtown area. Several transit corridors are currently being
evaluated for best mode choice (bus, heavy rail, light rail, and/or streetcar) that will meet
the needs for the region. The most important corridor needing immediate attention is
Flagler Street, which has the most heavily used bus route in the entire MDTA system.
Typical monthly ridership on bus routes 11 (local) and 51 (“Max” limited stop) is over
500,000 yet only traditional bus service is available in this corridor today.
A more complex situation arises with improving access from downtown Miami to Miami
Beach. A large waterway --the Atlantic Intracoastal -- separates the two cities and
presents an interesting challenge for transportation planners who would want to improve
existing transit services to this region. The MDTA has been considering light rail as an
option to be constructed in the median of the McArthur Causeway, but there are
numerous opponents who do not want the disruption of vehicular traffic on the cities’
most heavily used causeway. Some form of bus rapid transit (for example, limited-stop
service) may be a better alternative for Miami Beach as it is much easier and faster to
design and implement.
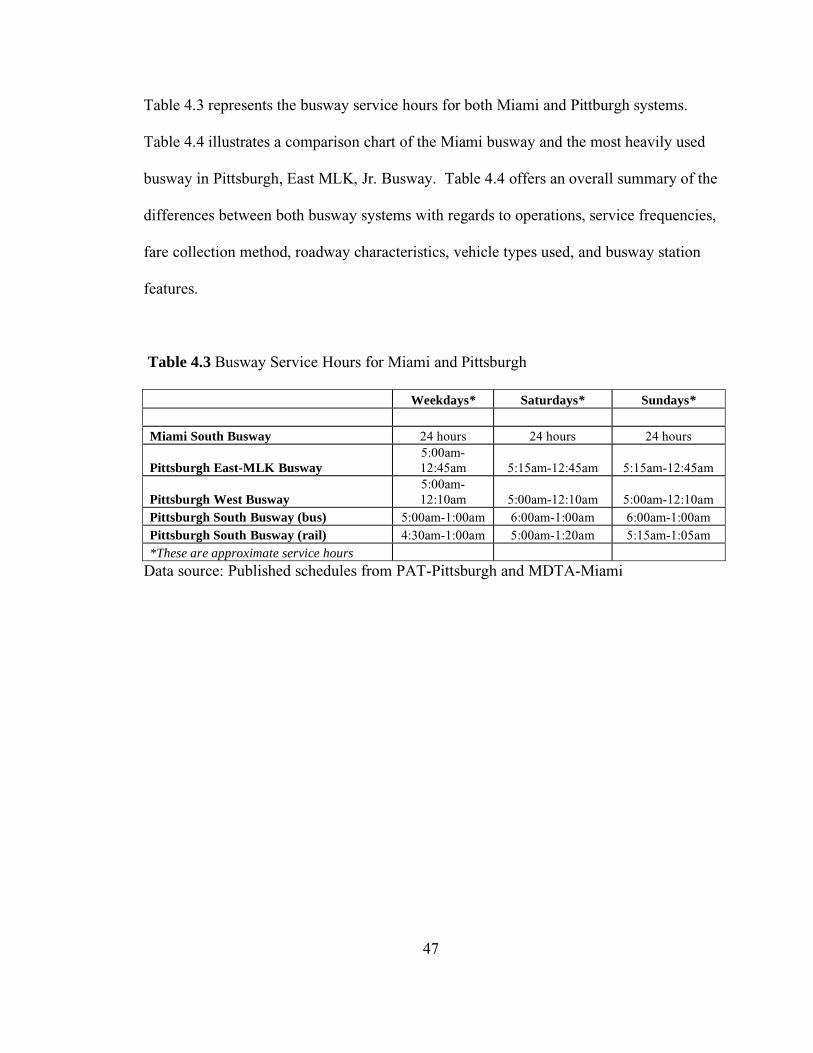
47
Table 4.3 represents the busway service hours for both Miami and Pittburgh systems.
Table 4.4 illustrates a comparison chart of the Miami busway and the most heavily used
busway in Pittsburgh, East MLK, Jr. Busway. Table 4.4 offers an overall summary of the
differences between both busway systems with regards to operations, service frequencies,
fare collection method, roadway characteristics, vehicle types used, and busway station
features.
Table 4.3 Busway Service Hours for Miami and Pittsburgh
Weekdays* Saturdays* Sundays*
Miami South Busway 24 hours 24 hours 24 hours
Pittsburgh East-MLK Busway
5:00am-12:45am 5:15am-12:45am 5:15am-12:45am
Pittsburgh West Busway
5:00am-12:10am 5:00am-12:10am 5:00am-12:10am
Pittsburgh South Busway (bus) 5:00am-1:00am 6:00am-1:00am 6:00am-1:00am Pittsburgh South Busway (rail) 4:30am-1:00am 5:00am-1:20am 5:15am-1:05am *These are approximate service hours
Data source: Published schedules from PAT-Pittsburgh and MDTA-Miami
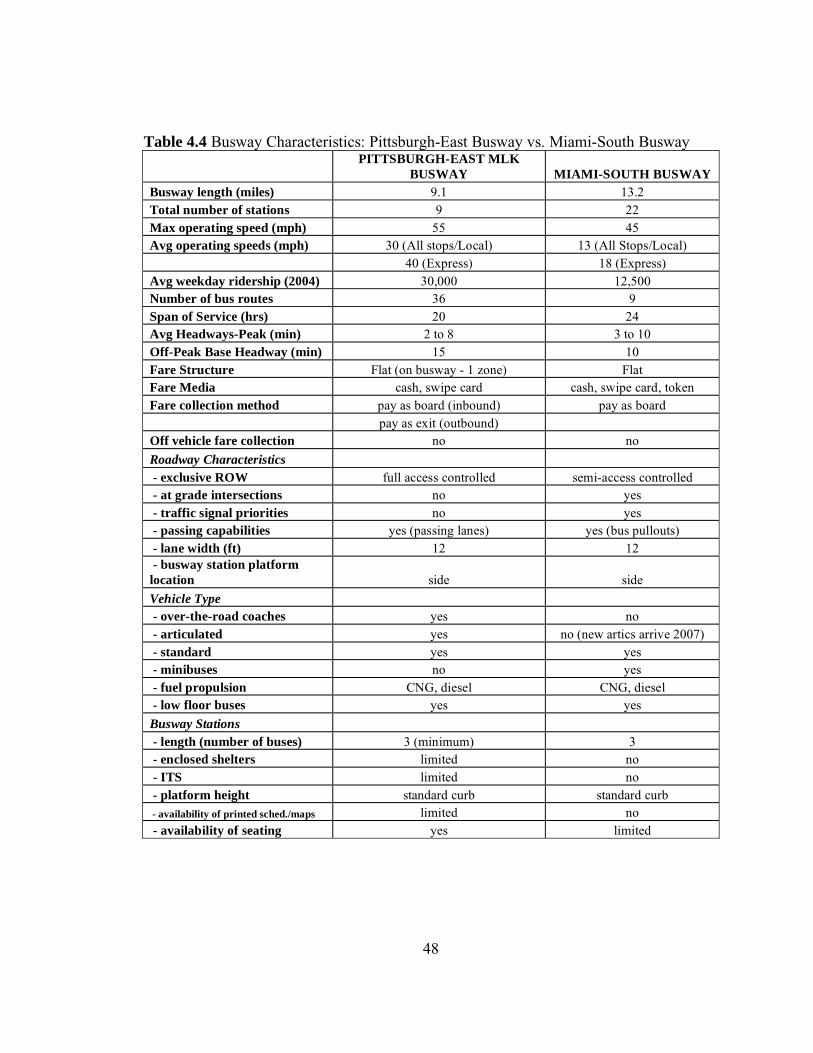
48
Table 4.4 Busway Characteristics: Pittsburgh-East Busway vs. Miami-South Busway
PITTSBURGH-EAST MLK
BUSWAY MIAMI-SOUTH BUSWAY
Busway length (miles) 9.1 13.2 Total number of stations 9 22 Max operating speed (mph) 55 45 Avg operating speeds (mph) 30 (All stops/Local) 13 (All Stops/Local) 40 (Express) 18 (Express) Avg weekday ridership (2004) 30,000 12,500 Number of bus routes 36 9 Span of Service (hrs) 20 24 Avg Headways-Peak (min) 2 to 8 3 to 10 Off-Peak Base Headway (min) 15 10 Fare Structure Flat (on busway - 1 zone) Flat Fare Media cash, swipe card cash, swipe card, token Fare collection method pay as board (inbound) pay as board pay as exit (outbound) Off vehicle fare collection no no
Roadway Characteristics - exclusive ROW full access controlled semi-access controlled - at grade intersections no yes - traffic signal priorities no yes - passing capabilities yes (passing lanes) yes (bus pullouts) - lane width (ft) 12 12 - busway station platform
location side side
Vehicle Type - over-the-road coaches yes no - articulated yes no (new artics arrive 2007) - standard yes yes - minibuses no yes - fuel propulsion CNG, diesel CNG, diesel - low floor buses yes yes
Busway Stations - length (number of buses) 3 (minimum) 3 - enclosed shelters limited no - ITS limited no - platform height standard curb standard curb - availability of printed sched./maps limited no - availability of seating yes limited
49
5 SUGGESTED GUIDELINES FOR BUSWAY APPLICATIONS
After reviewing the established guidelines for busway and BRT applications according to
the Federal Transit Administration, Transportation Cooperative Research Program, and
National Cooperative Highway Research Program, I am in agreement with much of the
criteria for determining whether a busway or BRT development is warranted. I also agree
with suggested design guidelines. I have analyzed the official data and concur with a
significant portion of the findings. I have also performed case studies of two busway
systems in operation today including site visits to both transitway facilities and find that
the two systems are in concert with much of the official guidelines offered by the FTA.
One possible problem which I detect from evaluating the established data, is that these
guidelines are quite dated and perhaps not entirely applicable today as they were twenty
to thirty years ago. In particular, I question the data used to determine minimum criteria
for rapid transit development according to Table 3.1, Ideal Conditions for Rapid Transit
Development- Design Year from the report, Center City Transportation Project: Urban
Transportation Concepts, 1970. It is suggested that the minimum requirements for
consideration of rapid transit for urban areas is a population of 2 million (for rail), 1
million (for rail or bus) and 750,000 (for bus). I am not in total agreement with these
threshold values for the following reason- when this data were established in the early
1970’s, car ownership in the USA was not as significant as it was 30+ years ago and
transit usage was substantially higher. Although transit usage has been steadily
increasing during the past decade, car ownership has also increased, dramatically. As a
50
consequence of having so many new car owners, there are many more car-oriented trips
today and a lot less trips on public transportation. This has lead to significant traffic
congestion in cities all across the country. In spite of the known dangers of air pollution
contributed by automobiles in many of our medium to large metropolitan areas, car usage
continues to rise. As a result, many urban roadways are at or near capacity and there are
very few options left for increasing this capacity. In consideration of these factors, I
propose that some of the minimum requirements for rapid transit development be relaxed.
If transit planners of medium-sized urban areas (with a population under 750,000) are to
use the established data provided by the government, some planners may believe that
their metro area does not meet minimum requirements for potential rapid transit
development. This may prove detrimental to an urban area that is looking for alternative
transportation options like rapid transit to help alleviate major traffic congestion
problems. I propose that the urban area population criteria for bus rapid transit be
reduced from 750,000 to 500,000. There are numerous urban areas around the country
with a population of under 750,000 that could benefit from some form of rapid transit to
help reduce major traffic congestion.
There is another minimum requirement on Table 3.1 that deserves being reviewed. The
minimum threshold for consideration of rapid transit depends on CBD employment of
100,000 (for rail), 70,000 (for rail or bus) and 50,000 (for bus). The term “CBD
employment” and associated numbers are too restrictive and may not reflect the true
employment landscape for a particular urban area. There may be concentrated
employment centers located in suburban locations, far from the downtown area. Not all
51
commuter trips today are CBD-oriented as many businesses in recent years have
relocated away from the traditional urban core. This has had a substantial affect on
transit ridership in many communities as a significant number of commuter trips are in
effect reverse-commute trips. Although the CBD is typically the magnet for much of the
employment in many urban areas it is not the only location. The “CBD employment”
criteria many no longer be a meaningful gauge to measure ideal conditions for rapid
transit development. This term may need to be more inclusive of all substantial
employment centers in an urban area. Consider this, several transit agencies around the
USA have already begun to realize the decentralization of employment in the downtown
area and have responded by creating transportation centers or transit hubs in non-CBD
locations (e.g. Houston Metro and Dallas DART in Texas). Some transit agencies have
even gone so far to adjust their transit timetables to reflect that peak-hour direction may
actually be both directions on particular transit routes (e.g. Chicago METRA suburban
railroad timetables).
52
6 CONCLUSIONS AND RECOMMENDATIONS
Upon completion of my research for this thesis, I am convinced that busways and BRTs
can be viable forms of rapid transit in the same manner as rail transit is. A BRT can offer
the same attributes as those of rail transit but at potentially lower capital and operating
costs. This is a plausible alternative for any metropolitan area that wants to improve
passenger mobility but may not be able to afford the price tag for an expensive rail
system. A BRT can be of high performance and quality as well as offer a sense of
permanence which may aid in attracting new riders to mass transit. If designed properly
and having considerably improved operating speeds and reliability, a BRT could
potentially rival traditional LRT services. A busway with exclusive R-O-W can offer
similar quality of service as that of a subway/heavy rail because of its 100% exclusive
ROW, as evidenced with the East-MLK Busway in Pittsburgh, PA. Several aspects of
operating BRT are examined with reference to the two case studies.
6.1 Right-of-Way
When comparing the two BRT systems studied for this thesis, I would consider
Pittsburgh’s busways superior to the busway in Miami for several reasons. Both busways
are built on old railroad right-of-ways but the design and operation of each are very
different. One of the greatest differences between the two is that Pittsburgh’s East-MLK
Busway, probably the closest to a “true” busway in USA, has an exclusive right-of-way
53
for the entire roadway length whereas the Miami’s South Busway has at-grade
intersections and is subjected to significant cross-traffic at many of these intersections.
There are no traffic intersections or traffic signals along the East-MLK Busway in
Pittsburgh, and busway stations are spaced from to 2 miles apart so buses are capable
of reaching high operating speeds. This is not the case for the South Busway in Miami
because buses operating along the route are frequently influenced by traffic signals at the
intersections. It should be pointed out that the MDTA installed traffic signal priority
systems for buses at many intersections but discontinued the practice because of frequent
crashes between buses and cars at these intersections (see next paragraph below). The
frequent stops at traffic lights impede bus operating speed which increases bus travel
times and thus adversely affects the quality of service. As a consequence, the MDTA will
need to resort to potentially costly options for a remedy for this problem. As of this
writing, the problem has not been resolved though it is understood that the management
and planners are aware of the issue and are currently exploring a few options.
6.2 Land Use
After the arrival of the East-MLK, Jr. Busway in Pittsburgh, PA in 1983, the transit
corridor in the eastern section of Pittsburgh has undergone resurgence. The East Busway
has affected land use patterns in this region because of its convenient connections to
concentrations of employment centers, shopping areas, and numerous residential
complexes. As a result of the convenience of the East Busway and supportive land use
policies that promote mixed use development, this transit corridor has enjoyed lots of

54
new activity around busway stations. The East Busway has also experienced significant
gains in ridership. The East Busway is a good example of how public transportation can
promote future land use patterns. Conversely, the South Busway in Miami, FL is located
in a transit corridor where there is not much development today although it does offer
continuous connection between some activity centers like a nearby shopping mall and
some commercial development. The MDTA chose this alignment because it was easy
and inexpensive to acquire an old abandoned railroad right-of-way. However this
alignment is located in a region where there are not many attractions and future
development around some busway stations may be hampered because of poor access.
6.3 Safety
Another issue with having an at-grade busway facility with intersecting roads is the
problem with safety. The South Busway in Miami has been plagued with many accidents
involving buses and cars at several intersections along the transitway. There is adequate
signage and traffic signals in place identifying the busway but automobile drivers
frequently elect to ignore such warnings and enter the intersections without care. This
has resulted in numerous collisions between buses and cars causing many serious injuries
and even death. It may be noted that the same phenomenon currently affects the brand
new LACMTA Orange Line Busway in the San Fernando Valley in Los Angeles, CA.
The immediate remedy offered by the MDTA (and LACMTA in Los Angeles) was to
enforce a new policy for bus operators to reduce speeds when crossing intersections. But
this is only a temporary solution and does not truly address the issue of bus-car conflicts.
55
Unfortunately, it appears that the MDTA did not anticipate this potential problem during
the planning stages of the South Busway. One possible solution, which I would suggest,
is to redefine the busway facility and consider it like a railroad by installing railroad
crossing gates at each of the busway crossings. This could have a positive impact by
potentially reducing the number of crashes at these crossings. The one downside to this
would be the high costs of installing railroad crossing gates. The upside could be that
liability costs would be reduced for the MDTA and safety at busway crossings could be
restored.
PAT busways in Pittsburgh are not immune to safety concerns either as there is the
continual problem of alighting passengers who cross the travel lanes of the busway to
reach busway station platforms on the other side. This is a potentially serious problem
identified at certain stations along the very active East-MLK Busway. Though, there
does not seem to be a large number of incidents reported involving pedestrians and buses
on Pittsburgh busways, I have personally witnessed this potentially dangerous situation of
passengers weaving and dodging between moving buses to reach the opposite platform. I
have reported this to the administration at PAT headquarters. A possible remedy for this
situation is to have pedestrian bridges available at both ends of the busway platforms, or
have one pedestrian bridge located at the center connecting platforms on each side. Also,
a continuous dividing barrier (such as a jersey barrier) should be constructed in the center
of the roadway, separating bus direction of travel. However, if a barrier is built, an
additional bypass lane would be needed for each direction.
56
6.4 Vehicles
It is important that a transit agency assigns appropriately sized vehicles for use on
busways, particularly during off-peak hours when there is less frequent service and a
reduction in the number of routes serving the busway. Though there may be significantly
less ridership during off-peak times, it is still important to use appropriate vehicles to
accommodate potentially high passenger loads. PAT in Pittsburgh appears to have a
good handle on this as they assign articulated buses throughout the week on the EBA
(East Busway All-Stop) major route serving East-MLK Busway. Conversely, the MDTA
in Miami does not assign right type of vehicles, and I have identified a problem which
could be easily remedied. I would suggest that the Miami MDTA discontinue the
practice of using minibuses on the very popular Route “31-Busway Local” during off-
peak periods. Minibuses, by design, have very limited seating and standing room and
hence should not be used on a major bus route in a large city. There have been numerous
times when minibuses used on Route 31 have been filled with heavy loads because bus
headways during late evening hours are 30 minutes. If the base headway during late
hours is to remain 30 minutes along the busway then it would be best to use, at minimum,
standard 40-foot transit coaches. If the use of smaller buses is the preferred vehicle
choice, then service frequencies must be adjusted, that is increased, to better serve the bus
riding public. When using minibuses, it is be strongly recommended to increase
frequencies from 30 minutes to perhaps 15 or 20 minutes though, this would increase
labor costs for the transit agency as more bus drivers would be needed to operate the
additional number of vehicles. Increasing the number of minibuses perhaps is unfeasible
57
as the MDTA, like most other transit agencies around the country, are wrangling with
ways to reduce labor costs rather than increase them. As an example, the CTA (Chicago
Transit Authority) recently faced budget concerns and implemented a reduced service
plan. The CTA re-examined their rapid rail system. As a cost-cutting measure, the CTA
had decided to increase the number of cars per train while at the same time reducing the
number of trains in operation. Though not immediately popular with transit users in
Chicago, this small fix had helped the CTA reduce some of their labor costs. It also
helped in increasing capacity on transit vehicles by dispersing passengers onto longer
trains. Similarly, I believe the MDTA could benefit from the CTA example by using
larger buses keeping the same frequencies, while addressing the capacity needs of
passengers who use Route 31 on the increasingly popular South Busway.
6.5 Fare Collection
An important feature of busways should be the simplicity and expediency of fare
collection so passengers can board and alight quickly hence reducing dwell times of
buses at busway stations. PAT in Pittsburgh has had a long standing policy of requiring
passengers to pay as you board transit vehicles when traveling inbound but pay as you
exit as you travel outbound. The boarding process when leaving the CBD is very quick
as articulated buses using the busway have all three doors available for boarding. But the
alighting process is delayed when reaching stops outside of downtown because all
passengers are required to exit through the front door (back doors remain locked until the
bus reaches the route terminus). This dramatically increases delay as a large group of
58
alighting riders wait in the aisle as each passenger pays their fare at the farebox before
disembarking. The inbound-travel fare collection process in Pittsburgh is like that of
Miami and most other U.S. transit systems, pay as you board. I propose that both the
MDTA and PAT take a look at the fare payment procedures of other transit agencies like
LACMTA (LRT and Red Line Subway) in Los Angeles, CA and Tri-Met (LRT) in
Portland, OR. These two systems use an “honor system” for their rapid transit lines in
which riders use pre-paid passes/tickets instead of paying fares on transit vehicles hence,
speeding up the boarding and de-boarding process. Fare inspectors who would randomly
board vehicles to verify that passengers have their proof of payment can monitor fare
enforcement.

59
REFEERENCES
60
REFERENCES
LITERATURE REVIEW
JOURNAL OF PUBLIC TRANSPORTATION, Center for Urban Transportation Research, Volume 5, No. 2, 2002 BUS USE OF HIGHWAYS, PLANNING AND DESIGN GUIDELINES, National Cooperative Highway Research Program Report-155, Transportation Research Board, 1975 TRANSPORATION COOPERATIVE RESEARCH PROGRAM, Report #90- BRT: Volume 2- Implementation Guidelines, Federal Transit Administration, 2003 PROJECT NO. FTA-VA-26-7222-2004.1, CHARACTERISTICS OF BUS RAPID TRANSIT FOR DECISION-MAKING, Federal Transit Administration, 2004 MOTOR COACH AGE-MIAMI, Motor Bus Society, Nov. 1971 NATIONAL TRANSIT DATABASE, 2000 website, http://www.ntdprogram.com/ Federal Transit Administration SHIRLEY HIGHWAY/HOV SYSTEM website, http://www.roadstothefuture.com/Shirley_Busway.html NEW BRITAIN-HARTFORD RAPID TRANSIT website, http://www.ctrapidtransit.com PORT AUTHORITY OF ALLEGHENY COUNTY, PAT website, http://www.portauthority.org MIAMI-DATE TRANSIT AUTHORITY, MDTA website http://www.miamidade.gov/transit/ PERSONAL INTERVIEWS
JOSE PERES, MDTA Road Supervisor, Metro-Dade Transit Authority, Miami, FL (Interviewed: Oct 2005, Feb 2006) RICHARD FEDER, AICP, Port Authority of Allegheny County, Pittsburgh, PA (Interviewed: Mar 2003)

61
APPENDIX
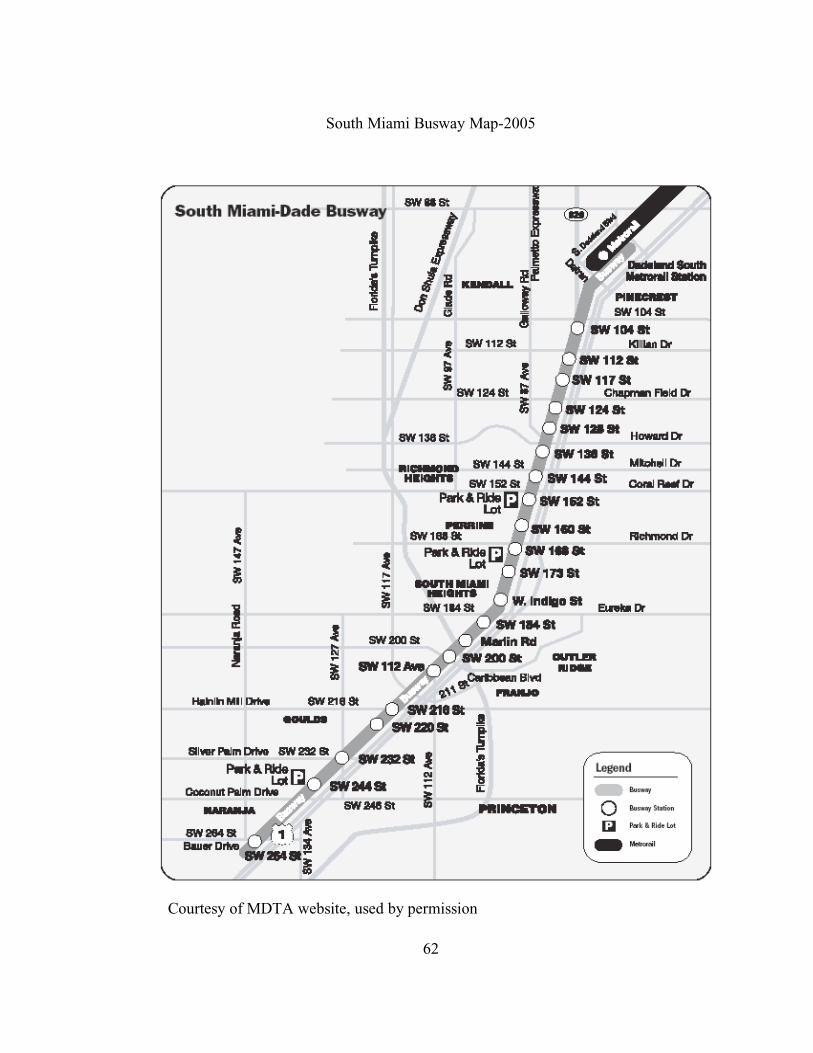
62
South Miami Busway Map-2005
Courtesy of MDTA website, used by permission
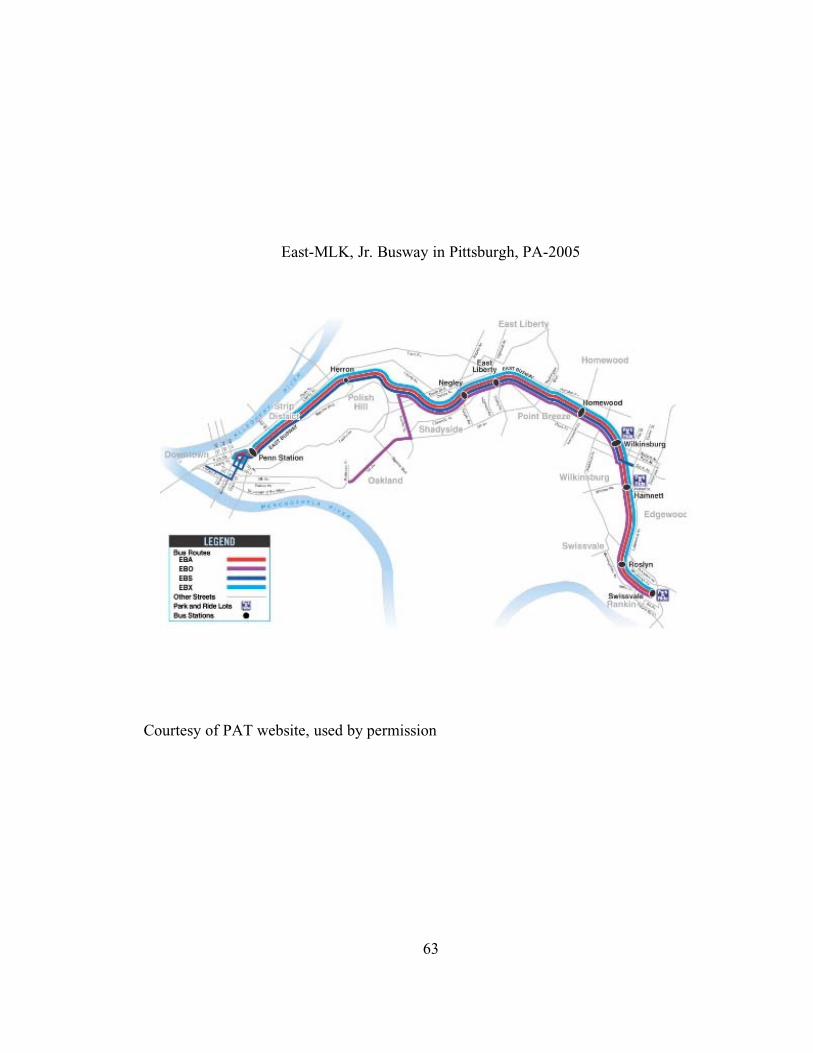
63
East-MLK, Jr. Busway in Pittsburgh, PA-2005
Courtesy of PAT website, used by permission
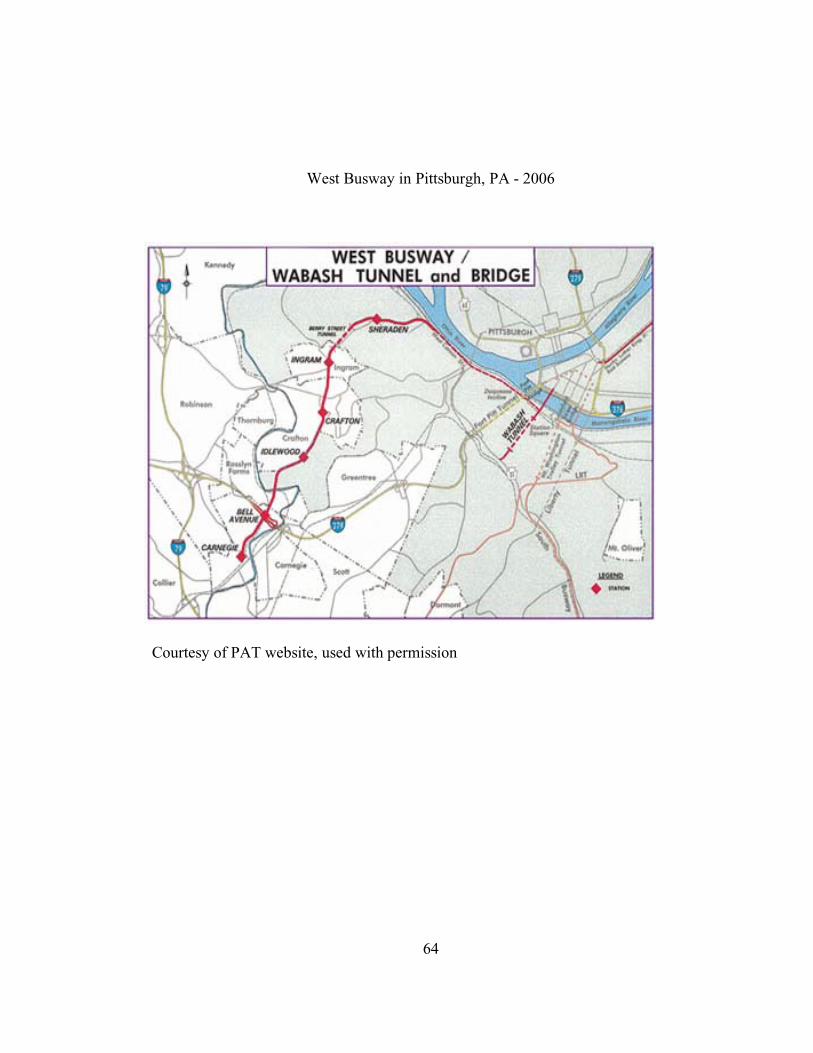
64
West Busway in Pittsburgh, PA - 2006
Courtesy of PAT website, used with permission
65
VITA
Michael Harris Gallant was born in New York City, NY and was raised in Southern
California, New York City metro area, and Miami Beach, FL. He attended high school at
Central High School in Valley Stream, NY and graduated from Springfield Gardens High
School in New York. He attended college at Cerro Coso Community College while in
the Air Force at Edwards AFB in California, Antelope Valley College in Lancaster, CA
and the University of Tennessee in Knoxville, TN. He graduated with a Bachelors of
Science in Mechanical engineering at the University of Tennessee in May of 1997 and a
Masters of Science in Civil Engineering with an emphasis in transportation engineering
in May of 2006. He has served in the United States Air Force for five years and attended
college thereafter. He currently works for the Office of Information Technology at the
University of Tennessee and is pursuing an engineering position in the public
transportation industry with later aspirations to work for the federal government handling
national transportation issues and public policy.