Embed Size (px)
Citation preview
TRANSPORTATION RESEARCH RECORD 1345 19
Use of Cement Kiln Dust, Fly Ash, and Recycling Technique in Low-Volume Road Rehabilitation
CHIANG LIN AND XISHUN ZHANG
A research project on the evaluation of methods of rural road rehabilitation has been conducted at the Southern Illinois University at · dwardsville with the cooperation of the lllinoi Departmenr of Tran portation since late 19 7. The use of cement kiln du t fly ash and a recycling technique to rebuild the roadway ba e is one of the methods under investigation. A eries of laboratory studies was conducted to develop the mix design for field demonstration. A 1/J-mi test road was constructed to evaluate the adequacy of the mix design and Lhe practicality of the co~stru~tion procedures. The performance of the test road to date 1s satisfactory. No damage has been detected. It i concl.uded that cement kiln dust and fly ash could be used succe fully for roadway base stabilization, and it is feasible co recycle the exi ting chip seal surface in the field.
Low-volume roads (L VR) for many years have contributed significantly to the growth of this country. At present, there are an estimated 3 million mi (1,2) of public LVR in the United States. In Illinois, a significant portion of L VR is controlled by local officials. Because of financial constraints, the majority of these L VR have been inadequately maintained. Most local governments rely on simple but ineffective resurfacing methods for maintenance. These methods only provide a temporary riding surface without solving the underlying problem, which is the improper design of the roadbed support system. It is necessary to have a rehabilitation method that can provide structural stability to L VR with low cost and simple construction procedures.
The main objective of this research is to investigate the feasibility of using two low-cost materials-cement kiln dust (CKD) and fly ash (FA)-and a recycling technique to rehabilitate the base of L VR. CKD and FA are by-products collected from bag houses in cement manufacturing plants and coal-fired power plants, respectively. These materials have been successfully used as pozzolanic stabilizers in the construction of highway bases and subbases (3,4) . The reclaimed material in the recycling process is the deteriorated chip seal surface material. An extensive laboratory study followed by a field test section study was conducted between 1987 and 1989 to determine the relative applicability and resultant beneficial effects of the proposed method. The conventional chip
C. Lin, Department of Civil Engineering, Southern Illinois University at Edwardsville, Edwardsville, Ill. 62026. X. Zhang, Department of Civil Engineering, University of New Hampshire, Durham, N.H. 03824.
seal resurfacing method was also included in the study for comparison. The important data and information collected from the study are presented in this paper.
MATERIALS CHARACTERIZATION
Reclaimed Surface Material
A VJ-mi section of a deteriorated chip seal road in Pin Oak Township, Illinois, was chosen as the field test site for this project. A portion of this section was scarified initiaHy to provide the reclaimed surface material (RSM) for laboratory study. The collected RSM was a mixture of soil rock chips, and hardened oil/chip lumps. On the basi of the results of soil classification tests, the RSM is classified as A-1-a in the AASHTO system.
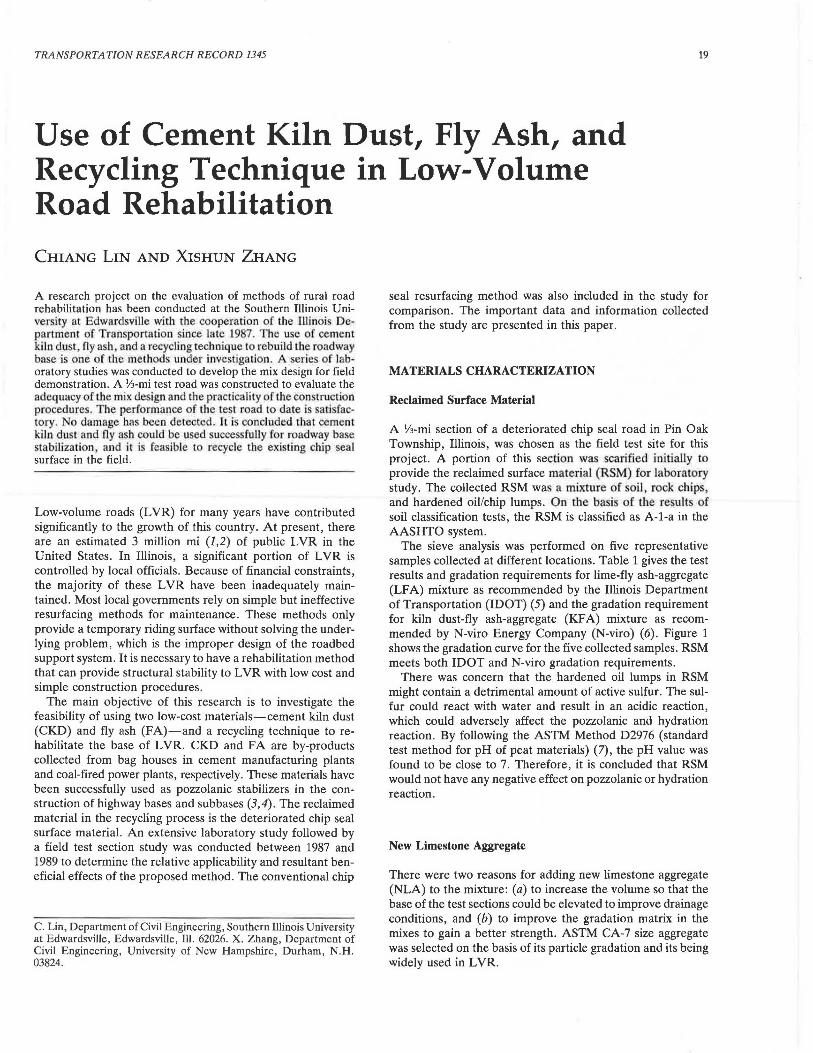
The sieve analysis was performed on five representative samples collected at different locations. Table 1 gives the test results and gradation requirements for lime-fly ash-aggregate (LFA) mixture as recommended by the Illinois Department of Transportation (IDOT) (5) and the gradation requirement for kiln dust-fly ash-aggregate (KFA) mixture as recommended by N-viro Energy Company (N-viro) (6). Figure 1 shows the gradation curve for the five collected samples. RSM meets both IDOT and N-viro gradation requirements.
There was concern that the hardened oil lumps in RSM might contain a detrimental amount of active sulfur. The sulfur could react with water and result in an acidic reaction, which could adversely affect the pozzolanic and hydration reaction. By following the ASTM Method D2976 (standard test method for pH of peat materials) (7), the pH value was found to be close to 7. Therefore, it is concluded that RSM would not have any negative effect on pozzolanic or hydration reaction.
New Limestone Aggregate
There were two reasons for adding new limestone aggregate (NLA) to the mixture: (a) to increase the volume so that the base of the test sections could be elevated to improve drainage conditions, and (b) to improve the gradation matrix in the mixes to gain a better strength. ASTM CA-7 size aggregate was selected on the basis of its particle gradation and its being widely used in L VR.
.·
20
TABLE 1 GRADATION OF RSM AND REQUIREMENTS
% Passing
Sieve Siu: RSM IDOT N-VIRO
H/2" 100 100 100
1· 92-100 90-100 90-100
1/2" 76-97 60-100 60-100
No.4 42-SJ 40-70 40-75
No.8 29-39 --. 30-60
No.40 14-22 0-25 0-30
No.200 9-16 0 -10 (gtavel) 0-12
0 -15 (crushed stone)
* Unavailable Data.
CKD
The CKD used in this project was collected from the Dundee Cement Company in Clarksville, Missouri. The specific gravity of the CKD per ASTM Cl88 is 2.49. Table 2 presents the physical and chemical testing data of this CKD and the quality requirements specified by IDOT and N-viro. The CKD meets all the requirements.
FA
The FA used in the project was purchased from the American Fly Ash Company in Chicago and is classified as ASTM Class F, which is noncementitious. Table 3 presents the physical and chemical testing results as well as the ASTM C618 specifications for Class F and Class C. The FA meets the ASTM C618 standard.
Portland Cement
The intent of adding a small amount (less than 5 percent of total weight) of portland cement was to provide an early ce-
DJ
90
80
70
E ro (!)
50
~ 411
.lO
20
ti
0
i;f2 tl-1
TRANSPORTATION RESEARCH RECORD 1345
TABLE 2 CKD PROPERTIES AND REQUIREMENTS
Gradation Composition* CKD IDOTJN-Viro
% Passing Requirement
#4 100\16 CaO 39.9 total reactive
#30 100\16 MgO 2.2 alkalies%
#100 92.7% Na,O 0.2 %Ca0+%Mg0-l.2(%LOI) 12.7% Min•I0\16
K,O S.I total reactive
so, 5.8 alkalis
Insoluble 12. l %K10+%Na,O 5.3% Max•6%
Rapid Sugar 5.6 amount of sol 5.8% Max• l0%
LOI 24.6
By Weight
mentitious effect to mixes that would increase the early strength. This was essential to expedite the construction process. Type I, general purpose cement, was used.
LABORATORY EVALUATION
The laboratory tests were conducted between 1987 and 1988 to determine the final mix design for the CKD/F A/cement/ NLA/RSM mixture. The process was divided into two stages: preliminary and final selections. Two main ASTM testing method were used thrO'l.1ghout the evaluation. The moisturedensity test was conducted according to ASTM D 1557 Method C with the exception that the compaction effort of three layers and 25 blows per layer was used. This compaction effort complies with IDOT specification for lime-fly ash-aggregate mixes . Standard Proctor molds with a 4-in. diameter and a 4.6-in. height were used. The optimum moisture content (OMC) found in these tests were used to prepare pecimens for strength tests. The reason for using OMC i that stabilized mixes at OMC would probably yield the highest strength. The unconfined compression test was conducted according to ASTM C593. The specimens, made by following the same procedure as used in the moisture-density test, were sealed in plastic
wD ti,
GRAIN SIZE
FIGURE 1 RSM grain size distribution.
Lin and Zhang
TABLE 3 FLY ASH PROPERTIES AND REQUIREMENTS
Analysis Requin:mcnts for ASlM C618 Class F & C
Pozwlantic Activity with Portland Cemen~ Strength at 28 Days, \II\ of Control 90 75 min.
Water Requi~en~ \II\ of Control 96 105max.
Autoclave &pension, \II\ 0.5 0.8 max.
No. 325 Sieve RMidue, \II\ 17.3 34 max.
Variation, Percentage Points from Ave111go 1.7 5 max.
Specific Gravity 2.S
Variation from Average, \II\ 0.8 5 max.
Si0,/Al10,!Fe,O,, \II\ 53.4/18.0/15.5
Total, \II\ 86.9 so min.
so,, \II\ 1.4 5.0max.
Moist~. Wi 0.3 3.0 max.
Lam on Ignition, \II\ 0.7 6.0mu.
Cao, \II\ 4.0
Mg0,\11\ 0.8
Na,O, \II\ t.3
K,O, \II\ 2.4
Available Albli os Na,O, \II\ 1.3 1.5 max.
bags and containers to prevent moisture loss under the various curing conditions.
Preliminary Selection
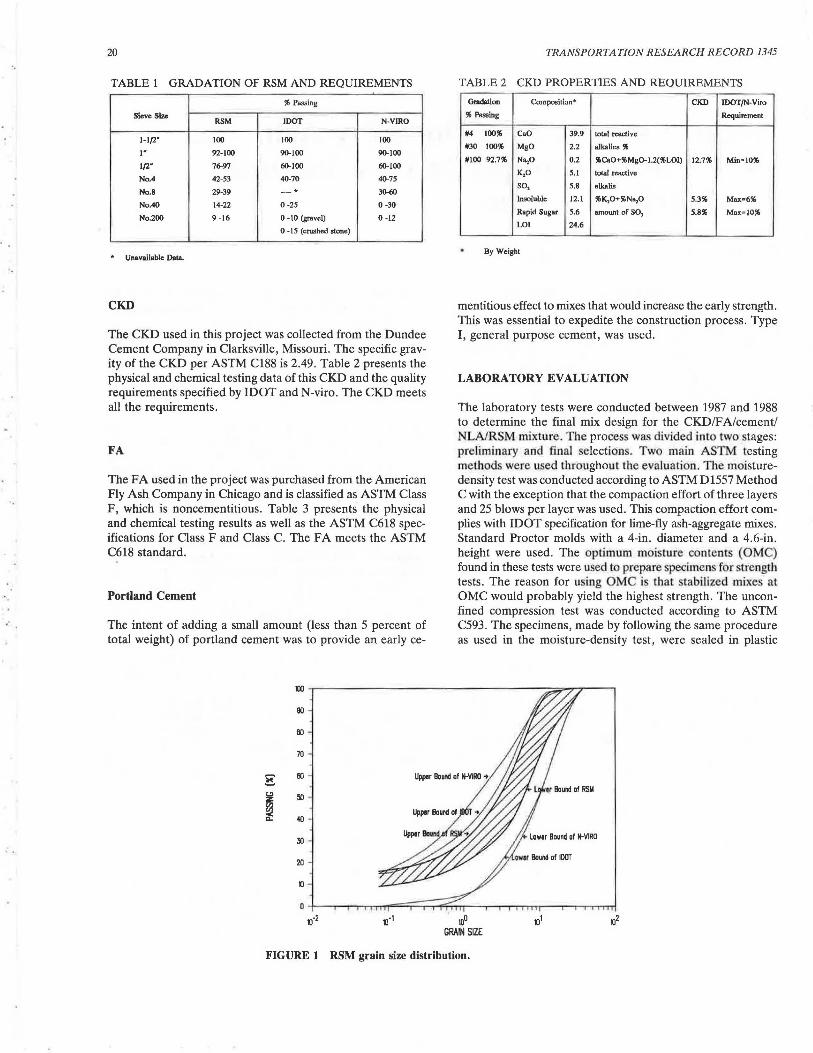
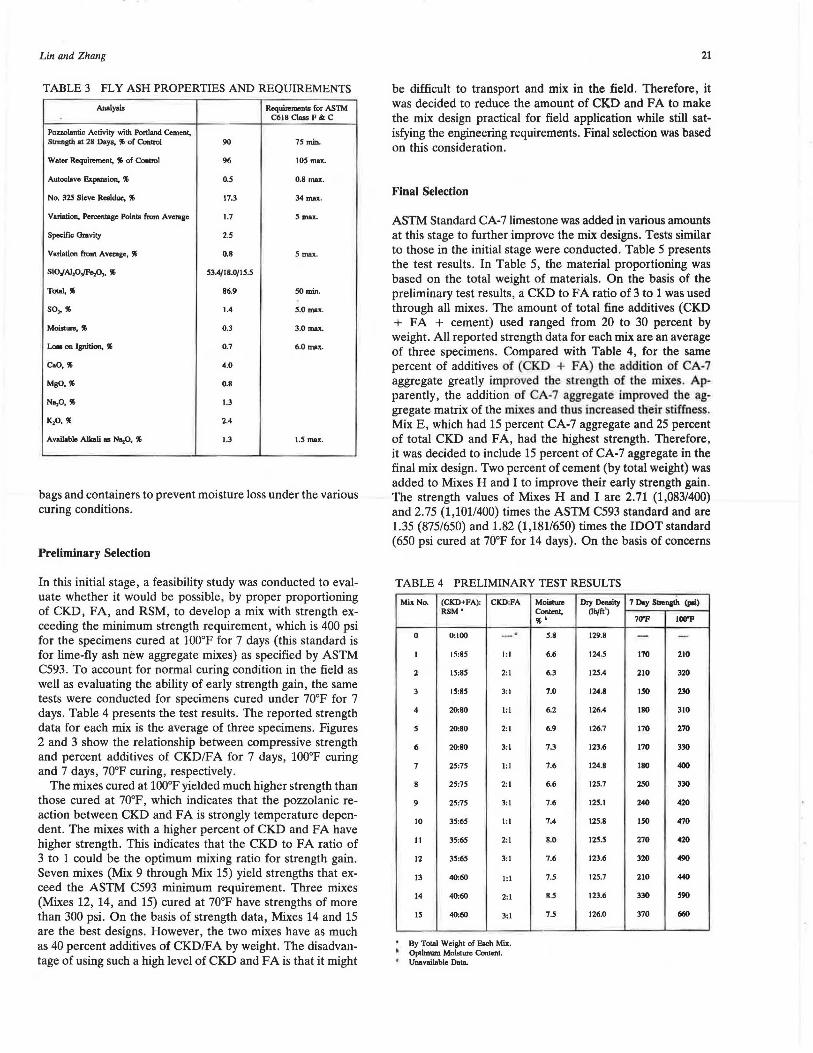
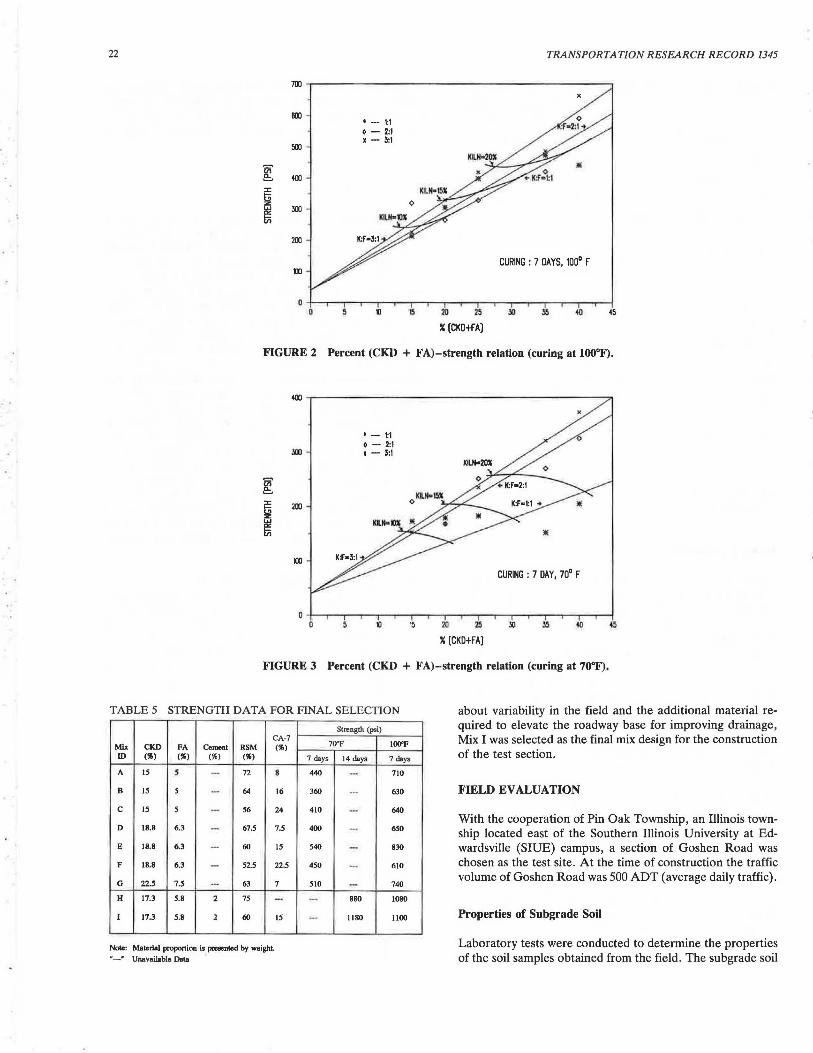
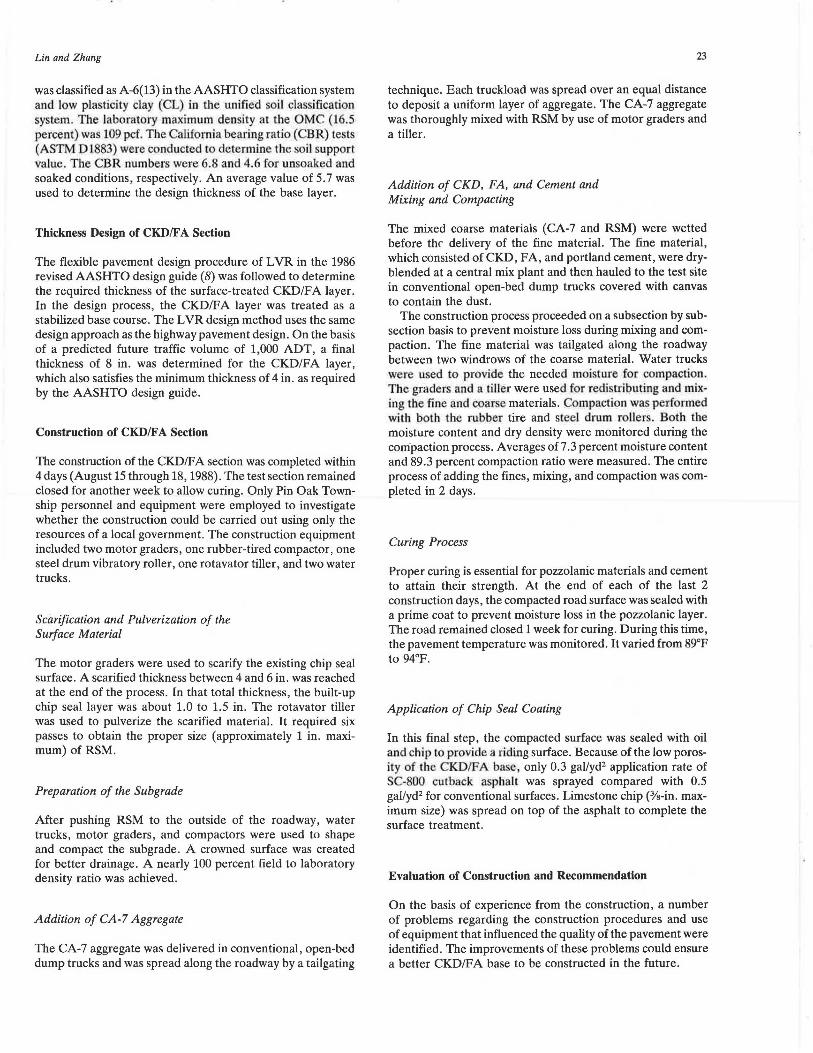
In this initial stage, a feasibility study was conducted to evaluate whether it would be possible, by proper proportioning of CKD, FA, and RSM, to develop a mix with strength exceeding the minimum strength requirement, which is 400 psi for the specimens cured at 100°F for 7 days (this standard is for lime-fly ash new aggregate mixes) as specified by ASTM C593. To account for normal curing condition in the field as well as evaluating the ability of early strength gain, the same tests were conducted for specimens cured under 70°F for 7 days. Table 4 presents the test results. The reported strength data for each mix is the average of three specimens. Figures 2 and 3 show the relationship between compressive strength and percent additives of CKDIFA for 7 days , 100°F curing and 7 days, 70°F curing, respectively.
The mixes cured at 100°F yielded much higher strength than those cured at 70°F, which indicates that the pozzolanic reaction between CKD and FA is strongly temperature dependent. The mixes with a higher percent of CKD and FA have higher strength. This indicates that the CKD to FA ratio of 3 to 1 could be the optimum mixing ratio for strength gain. Seven mixes (Mix 9 through Mix 15) yield strengths that exceed the ASTM C593 minimum requirement. Three mixes (Mixes 12, 14, and 15) cured at 70°F have strengths of more than 300 psi. On the basis of strength data, Mixes 14 and 15 are the best designs. However, the two mixes have as much as 40 percent additives of CKD/F A by weight. The disadvantage of using such a high level of CKD and FA is that it might
21
be difficult to transport and mix in the field. Therefore , it was decided to reduce the amount of CKD and FA to make the mix design practical for field application while still satisfying the engineering requirements. Final selection was based on this consideration.
Final Selection
ASTM Standard CA-7 limestone was added in various amounts at this stage to further improve the mix designs. Tests similar to those in the initial stage were conducted. Table 5 presents the test results . In Table 5, the material proportioning was based on the total weight of materials. On the basis of the preliminary test results, a CKD to FA ratio of 3 to 1 was used through all mixes. The amount of total fine additives (CKD + FA + cement) used ranged from 20 to 30 percent by weight. All reported strength data for each mix are an average of three specimens. Compared with Table 4, for the same percent of additives of (CKD + FA) the addition of CA-7 aggregate greatly improved the strength of the mixes. Apparently, the addition of CA-7 aggregate improved the aggregate matrix of the mixes and thus increased their stiffness. Mix E, which had 15 percent CA-7 aggregate and 25 percent of total CKD and FA, had the highest strength. Therefore, it was decided to include 15 percent of CA-7 aggregate in the final mix design. Two percent of cement (by total weight) was added to Mixes H and I to improve their early strength gain. The strength values of Mixes H and I are 2.71 (1,083/400) and 2.75 (1,101/400) times the ASTM C593 standard and are 1.35 (875/650) and 1.82 (l,181/650) times the IDOT standard (650 psi cured at 70°F for 14 days). On the basis of concerns
TABLE 4 PRELIMINARY TEST RESULTS
MiA No. (CKD+FA): CKD:FA Moisture Dry Density 7 Day Slnnath (poi) RSM' Conten~ Ob/ft'J
\II\' 7!1F IOO'F
0 0:100 - 5.8 129.8 - -I 15:85 1:1 6.6 124.S 170 210
2 15:8S 2:1 6.3 125.4 210 320
3 IS:85 3:1 7.0 124.8 ISO 230
4 20:80 1:1 6.2 126.4 180 310
s 20:80 2:1 6.9 126.7 170 270
6 20:80 3:1 7.3 123.6 170 330
7 25:75 1:1 7.6 124.8 180 400
8 25:75 2 :1 6.6 125.7 250 330
9 2S:75 3:1 7.6 125.1 240 420
10 35:65 1:1 7.4 125.8 ISO 470
II 35:65 2:1 8.0 125.5 270 420
12 35:65 3:1 7.6 123.6 320 490
13 40:60 1:1 7.5 125.7 210 440
14 40:60 2:1 8.5 123.6 330 590
IS 40:60 3:1 1.S 126.0 370 660
By Total Weight of Bach Mix. • Optimum Moisture Content.
Unavailable Data.
22 TRANSPORTATION RESEARCH RECORD 1345
20 .lO 45
% (CKO+fA)
FIGURE 2 Percent (CKD + FA)-strength relation (curing at 100°F) .
• ·- t1 o ••• 2:1
JOO I ··· 3:1
= "' e:. ::c 200 ~ z: ...... "' Iii •
Dl
CURING : 7 DAY, 70° f
0 IJ 15 25 .lO .., % (CKD+FA)
FIGURE 3 Percent (CKD + FA)-strength relation (curing at 70°F).
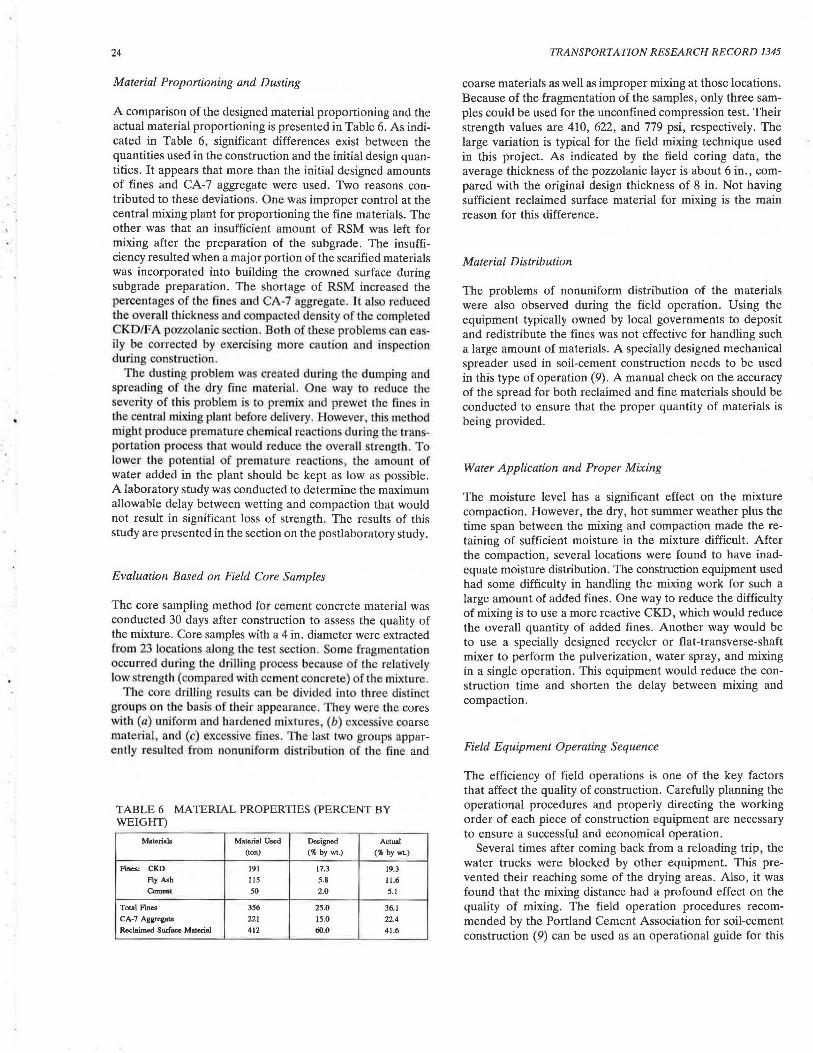
TABLE 5 STRENGTH DATA FOR FINAL SELECTION about variability in the field and the additional material required to elevate the roadway base for improving drainage , Mix I was selected as the final mix design for the construction of the test section.
CA-7 Mix CKD FA Cement RSM (%) ID (%) (%) (%) (%)
A IS s - 72 8
B 15 s - 64 16
c 15 s - S6 24
D 18.8 6.3 - 67.S 7.S
H 18.8 6.3 - 60 IS
p 18.8 6.3 - 52.S 22,S
G 22.S 7.5 ·- 63 7
H 17.3 S.8 2 75 --I 17.3 S.8 2 60 IS
Note: Material proportion is presented by weight
• - · Unavailllble Data
Stn:ngth (psi)
70"F
7 days 14 days
440 -· 360 ·-410 ·-400 -· S40 -450 -SIO -- 880
- 1180
IOO'P
7 days
710
630
640
6SO
830
610
740
1080
1100
FIELD EVALUATION
With the cooperation of Pin Oak Township, an Illinois township located east of the Southern Illinois University at Edwardsville (SIUE) campus, a section of Goshen Road was chosen as the test site . At the time of construction the traffic volume of Goshen Road was 500 ADT (average daily traffic).
Properties of Subgrade Soil
Laboratory tests were conducted to determine the properties of the soil samples obtained from the field. The subgrade soil
Lin and Zhang
was classified as A-6(13) in the AASHTO classification system and low plasticity clay (CL) in the unified ·oil classification system. The laboratory maximum density at the OMC (16.5 percent) wa 109 pcf. The California bearing ratio (CBR) tests (ASTM 01883) were conducted to determine the soil support value. The CBR numbers were 6.8 and 4.6 for uosoaked and soaked conditions, respectively. An average value of 5. 7 was used to determine the design thickness of the base layer.
Thickness Design of CKD/F A Section
The flexible pavement design procedure of L VR in the 1986 revised AASHTO design guide (8) was followed to determine the required thickness of the surface-treated CKD/FA layer. In the design process, the CKD/F A layer was treated as a stabilized base course. The L VR design method uses the same design approach as the highway pavement design. On the basis of a predicted future traffic volume of 1,000 ADT, a final thickness of 8 in. was determined for the CKD/FA layer, which also satisfies the minimum thickness of 4 in. as required by the AASHTO design guide.
Construction of CKD/F A Section
The construction of the CKD/F A section was completed within 4days (August 15through18, 1988). The test section remained closed for another week to allow curing. Only Pin Oak Township personnel and equipment were employed to investigate whether the construction could be carried out using only the resources of a local government. The construction equipment included two motor graders, one rubber-tired compactor, one steel drum vibratory roller, one rotavator tiller, and two water trucks.
Scarification and Pulverization of the Surface Material
The motor graders were used to scarify the existing chip seal surface. A scarified thickness between 4 and 6 in. was reached at the end of the process. In that total thickness, the built-up chip seal layer was about 1.0 to 1.5 in. The rotavator tiller was used to pulverize the scarified material. It required six passes to obtain the proper size (approximately 1 in. maximum) of RSM.
Preparation of the Subgrade
After pushing RSM to the outside of the roadway, water trucks, motor graders, and compactors were used to shape and compact the subgrade. A crowned surface was created for better drainage. A nearly 100 percent field to laboratory density ratio was achieved.
Addition of CA-7 Aggregate
The CA-7 aggregate was delivered in conventional, open-bed dump trucks and was spread along the roadway by a tailgating
23
technique. Each truckload was spread over an equal distance to deposit a uniform layer of aggregate. The CA-7 aggregate was thoroughly mixed with RSM by use of motor graders and a tiller.
Addition of CKD, FA, and Cement and Mixing and Compacting
The mixed coarse materials (CA-7 and RSM) were wetted before thr delivery of the fine material. The fine material, which consisted ofCKD, FA, and portland cement, were dryblended at a central mix plant and then hauled to the test site in conventional open-bed dump trucks covered with canvas to contain the dust.
The construction process proceeded on a subsection by subsection basis to prevent moisture loss during mixing and compaction. The fine material was tailgated along the roadway between two windrows of the coarse material. Water trucks were used to provide the needed moisture for compaction. The graders and a tiller were used for redistributing and mixing the fine and coar e materials. Compaction wa performed with both the rubber tire and steel drum rollers. Both the moisture content and dry density were monitored during the compaction process. Averages of 7 .3 percent moisture content and 89.3 percent compaction ratio were measured. The entire process of adding the fines, mixing, and compaction was completed in 2 days.
Curing Process
Proper curing is essential for pozzolanic materials and cement to attain their strength. At the end of each of the last 2 construction days, the compacted road surface was sealed with a prime coat to prevent moisture loss in the pozzolanic layer. The road remained closed 1 week for curing. During this time, the pavement temperature was monitored. It varied from 89°F to 94°F.
Application of Chip Seal Coating
In this final step, the compacted surface was sealed with oil and chip to provide a riding surface. Because of the low porosity of the CKD/FA base, only 0.3 gal/yd2 application rate of SC-800 cutback asphalt was sprayed compared with 0.5 gal/yd2 for conventional surfaces. Limestone chip (3/s-in. maximum size) was spread on top of the asphalt to complete the surface treatment.
Evaluation of Construction and Recommendation
On the basis of experience from the construction, a number of problems regarding the construction procedures and use of equipment that influenced the quality of the pavement were identified. The improvements of these problems could ensure a better CKD/F A base to be constructed in the future.
24
Material Proportioning and Dusting
A comparison of the designed material proportioning and the actual material proportioning is presented in Table 6. As indicated in Table 6, significant differences exist between the quantities used in the construction and the initial design quantities. It appears that more than the initial designed amounts of fines and CA-7 aggregate were used. Two reasons contributed to these deviations. One was improper control at the central mixing plant for proportioning the fine materials. The other was that an insufficient amount of RSM was left for mixing after the preparation of the subgrade. The insufficiency resulted when a major portion of the scarified materials was incorporated into building the crowned surface during subgrade preparation. The shortage of RSM increased the percentages o:f the fines and CA-7 aggregate. It also reduced the overall thickness and compacted den ity of the completed CKD/ A pozzolanic section. Both of these problems can ea -ily be corrected by exercising more caution and inspection during construcLion .
The dusting problem was created during the dumping and spreading of the dry fine material. One way to reduce the severity of thi problem is to premix and prewet the fines in the central mixing plant before delivery. However, this method might produce premature chemical reaction during the tran -portation proce that would reduce the overall trength . To lower lhe potential of premature reactions the amount of water added in the plant should be kept as low as possible. A laboratory study was conducted to determine the maximum allowable delay between wetting and compaction that would not result in significant loss of strength. The results of this study are presented in the section on the postlaboratory study.
Evaluation Based on Field Core Samples
The core sampling method for cement concrete material was conducted 30 days after construction to assess the quality of the mixture. Core samples with a 4 in. diameter were extracted from 23 locations along the te t ection. Some fragmentation occurred during the drilling process because of the relatively low strength (compared with cement concrete) of the mixture.
The core drilling resulL~ can be divided into three distinct groups on lbe basis ()f their appearance. They were the cores with (a) uniform and hardened mixnires (b) excessive coarse material , and (c) excessive fines. The last two groups apparently resulted from nonuniform distribution of the fine and
TABLE 6 MATERIAL PROPERTIES (PERCENT BY WEIGHT)
Materials Material Used Designed Actual (ton) ('JI, by wt.) ('JI, by wt.)
Fm es: CKD 191 17.3 19.3
Fly Ash 115 5.8 11.6
Cement 50 2.0 5.1
Total Fines 356 25.0 36.1
CA-7 Aggregate 221 15.0 22.4
Re<:laimed Swface Ma1erial 412 60.0 41.6
TRANSPORTATION RESEARCH RECORD 1345
coarse materials as well as improper mixing at those locations. Because of the fragmentation of the samples, only three samples could be used for the unconfined compression test. Their strength values are 410, 622, and 779 psi, respectively. The large variation is typical for the field mixing technique used in this project. As indicated by the field coring data, the average thickness of the pozzolanic layer is about 6 in., compared with the original design thickness of 8 in. Not having sufficient reclaimed surface material for mixing is the main reason for this difference.
Material Distribution
The problems of nonuniform distribution of the materials were also observed during the field operation. Using the equipment typically owned by local governments to deposit and redistribute the fines was not effective for handling such a large amount of materials. A specially designed mechanical spreader used in soil-cement construction needs to be used in this type of operation (9) . A manual check on the accuracy of the spread for both reclaimed and fine materials should be conducted to ensure that the proper quantity of materials is being provided.
Water Application and Proper Mixing
The moisture level has a significant effect on the mixture compaction. However, the dry, hot summer weather plus the time span between the mixing and compaction made the retaining of sufficient moisture in the mixture difficult. After the compaction, several locations were found to have inadequate moisture distribution. The construction equipment used had some difficulty in handling the mixing work for such a large amount of added fines. One way to reduce the difficulty of mixing is to use a more reactive CKD, which would reduce the overall quantity of added fines. Another way would be to use a specially designed recycler or flat-transverse-shaft mixer to perform the pulverization, water spray, and mixing in a single operation. This equipment would reduce the construction time and shorten the delay between mixing and compaction.
Field Equipment Operating Sequence
The efficiency of field operations is one of the key factors that affect the quality of construction. Carefully planning the operational procedures and properly directing the working order of each piece of construction equipment are necessary to ensure a successful and economical operation.
Several times after coming back from a reloading trip, the water trucks were blocked by other equipment. This prevented their reaching some of the drying areas. Also, it was found that the mixing distance had a profound effect on the quality of mixing. The field operation procedures recommended by the Portland Cement Association for soil-cement construction (9) can be used as an operational guide for this
Lin and Zhang
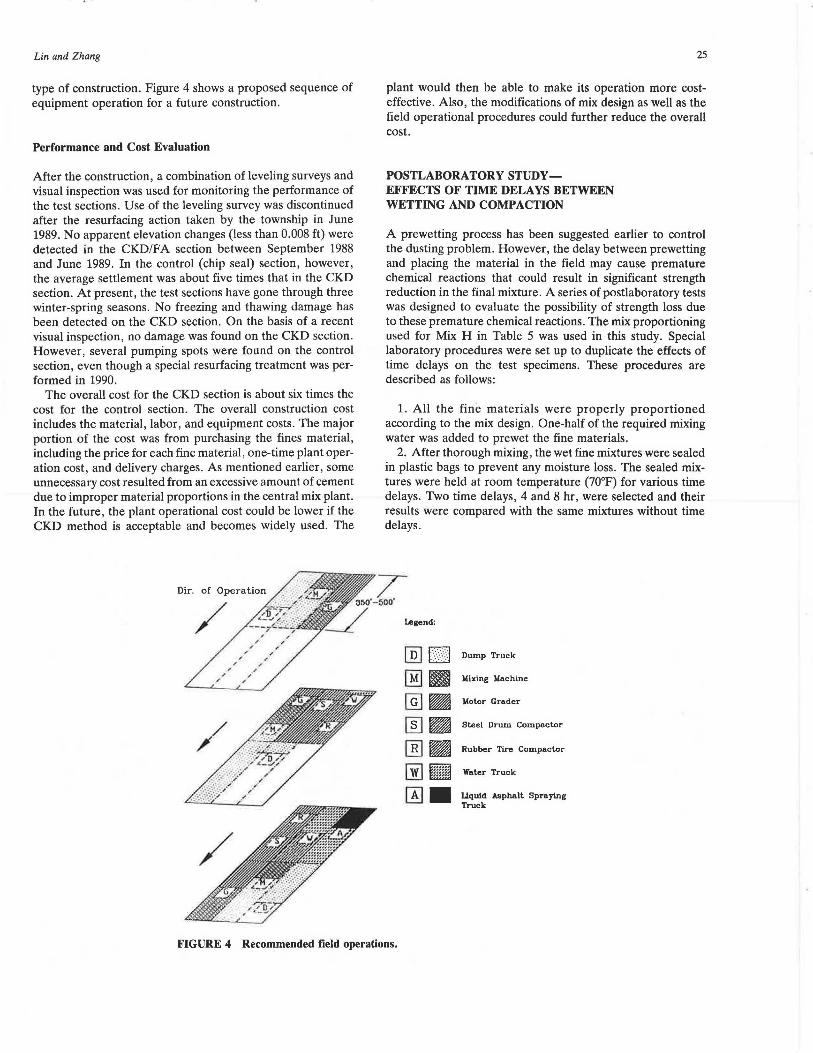
type of construction. Figure 4 shows a proposed sequence of equipment operation for a future construction.
Performance and Cost Evaluation
After the construction, a combination of leveling surveys and visual inspection was used for monitoring the performance of the test sections. Use of the leveling survey was discontinued after the resurfacing action taken by the township in June 1989. No apparent elevation changes (less than 0.008 ft) were detected in the CKD/FA section between September 1988 and June 1989. In the control (chip seal) section, however, the average settlement was about five times that in the CKD section. At present, the test sections have gone through three winter-spring seasons. No freezing and thawing damage has been detected on the CKD section. On the basis of a recent visual inspection, no damage was found on the CKD section. However, several pumping spots were found on the control section, even though a special resurfacing treatment was performed in 1990.
The overall cost for the CKD section is about six times the cost for the control section. The overall construction cost includes the material, labor, and equipment costs. The major portion of the cost was from purchasing the fines material, including the price for each fine material, one-time plant operation cost, and delivery charges. As mentioned earlier, some unnecessary cost resulted from an excessive amount of cement due to improper material proportions in the central mix plant. In the future, the plant operational cost could be lower if the CKD method is acceptable and becomes widely used. The
25
plant would then be able to make its operation more costeffective. Also, the modifications of mix design as well as the field operational procedures could further reduce the overall cost.
POSTLABORATORY STUDYEFFECTS OF TIME DELAYS BETWEEN WETTING AND COMPACTION
A prewetting process has been suggested earlier to control the dusting problem. However, the delay between prewetting and placing the material in the field may cause premature chemical reactions that could result in significant strength reduction in the final mixture. A series of postlaboratory tests was designed to evaluate the possibility of strength loss due to these premature chemical reactions. The mix proportioning used for Mix H in Table 5 was used in this study. Special laboratory procedures were set up to duplicate the effects of time delays on the test specimens. These procedures are described as follows:
1. All the fine materials were properly proportioned according to the mix design. One-half of the required mixing water was added to prewet the fine materials.
2. After thorough mixing, the wet fine mixtures were sealed in plastic bags to prevent any moisture loss. The sealed mixtures were held at room temperature (70°F) for various time delays. Two time delays, 4 and 8 hr, were selected and their results were compared with the same mixtures without time delays.
Legend:
[fil l:\\\:J Dump Truck
rnJ ~ Mil<ing Machine
@] • Motor Grader
Isl ~-"-~ ~ Steel Drum Compactor
ffi] • Rubber Tire Compactor
[!] tiilm~ water Truck
[!] • Liquid Asphalt Spraying Truck
FIGURE 4 Recommended field operations.
26 TRANSPORTATION RESEARCH RECORD 1345
750.00
600.00
550.00-1-~~~~~~~~~~..---.---.~..--~--.~..--.---i
0.00 1.00 2.00 lOO 4.00 S.00 7.00 e.oo
DELAY TIME fHourl
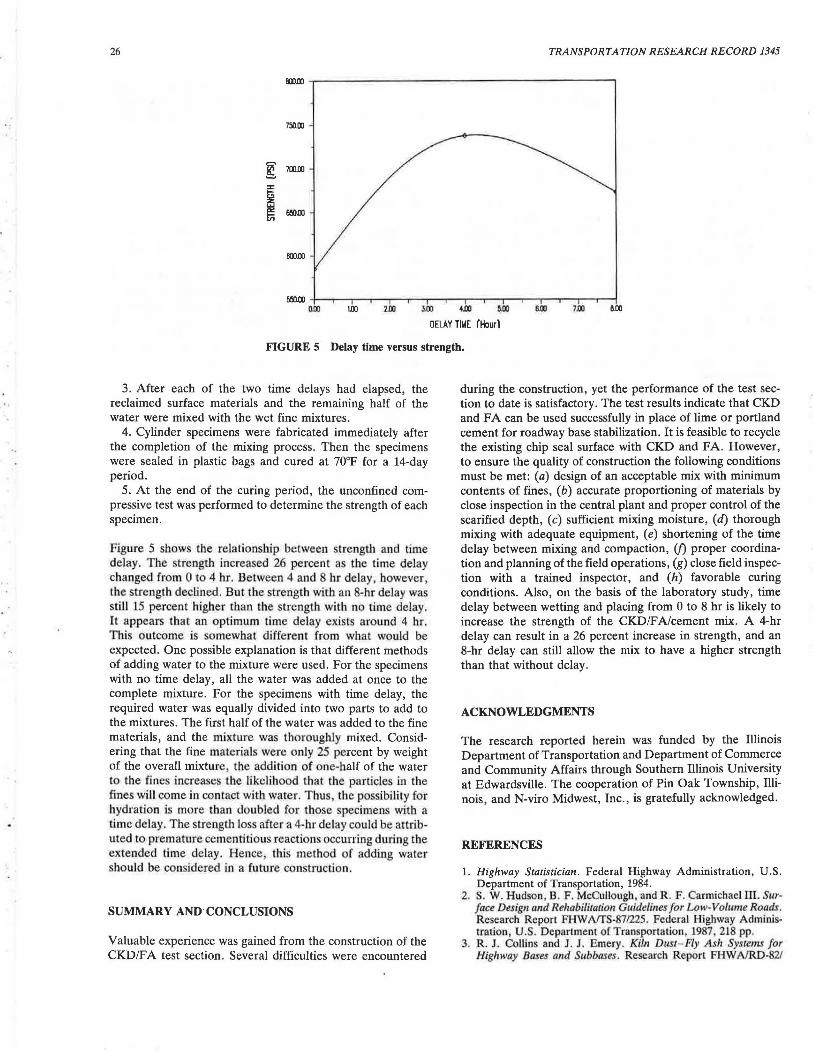
FIGURE 5 Delay time versus strength.
3. After each of the two time delays had elapsed, the reclaimed surface materials and the remaining half of the water were mixed with the wet fine mixtures.
4. Cylinder specimens were fabricated immediately after the completion of the mixing process. Then the specimens were sealed in plastic bags and cured at 70°F for a 14-day period.
5. At the end of the curing period, the unconfined compressive test was performed to determine the strength of each specimen.
Figure 5 shows the relationship between strength and time delay . The strength increased 26 percent as the time delay changed from 0 to 4 hr. Between 4 and 8 hr delay however , the strength declined. But the strength with an 8-hr delay was still 15 percent higher than the strength with no time delay . It appears that an optimum time delay exist around 4 hr. This outcome is somewhat different from what would be expected. One possible explanation is that different methods of adding water to the mixture were used. For the specimens with no time delay, all the water was added at once to the complete mixture. For the specimens with time delay, the required water was equally divided into two parts to add to the mixtures. The first half of the water was added to the fine materials, and the mixture was thoroughly mixed. Considering that the fine materials were only 25 percent by weight of the overall mixture, the addition of one-half of the water to the fines increases the likeliJ1ood that the particle in the fines wiJI come in contact with water. Thu , the p·ossibility for hydration is more than doubled for tho e specimens with a time delay. The strength loss after a 4-hr delay could be attributed to premature cementitious reactions occurring during the extended time delay. Hence, this method of adding water hould be considered in a future construction.
SUMMARY AND·CONCLUSIONS
Valuable experience was gained from the construction of the CKD/FA test section. Several difficulties were encountered
during the construction, yet the performance of the test section to date is satisfactory. The test results indicate that CKD and FA can be used successfully in place of lime or portland cement for roadway base stabilization. It is feasible to recycle the existing chip seal surface with CKD and FA. However, to ensure the quality of construction the following conditions must be met: (a) design of an acceptable mix with minimum contents of fines, (b) accurate proportioning of materials by close inspection in the central plant and proper control of the scarified depth, (c) sufficient mixing moisture, (d) thorough mixing with adequate equipment, (e) shortening of the time delay between mixing and compaction, (f) proper coordination and planning of the field operations, (g) close field inspection with a trained inspector, and (h) favorable curing conditions. Also, on the basis of the laboratory study, time delay between wetting and placing from 0 to 8 hr is likely to increase the strength of the CKD/FNcement mix. A 4-hr delay can result in a 26 percent increase in strength, and an 8-hr delay can still allow the mix to have a higher strength than that without delay.
ACKNOWLEDGMENTS
The research reported herein was funded by the Illinois Department of Transportation and Department of Commerce and Community Affairs through Southern Illinois University at Edwardsville. The cooperation of Pin Oak Township, Illinois, and N-viro Midwest, Inc., is gratefully acknowledged.
REFERENCES
1. Highway Statistician. Federal Highway Administration, U.S. Department of Transportation, 1984.
2. S. W. Hudson B. F. McCullough , and R. F. Carmichael ill. Sur· face Design and Rehabilitatio11 Guidelines for Low-Volume Roads. Research Report FHWArrS-871225. Federal Highway Admioistralioo, U.S. Department of Transportation 1987 218 pp.
3. R . J. Collins and J. J. Emery. Kiln Dust- Fly Ash Systems for Highway Bases and Subbases . Research Report FHWA/RD-82/

Lin a11d Zhang
167. Federal Highway Administration, U.S. Department of Trans· portation, 1983, 122 pp.
4. C. T . MIIJer, D. G. Bensch, and D. C. Colony. Pozzolanic Concrete Base Courses Using CKD and Ay Ash. Presented at 59th Annual Meeting of Transportation Research Board. Wasltington, D.C .. 1980.
5. Standard Specifications for Road and Bridge Construction. Section 218. 111.inois Department of Transportation , 1983.
6. Construction Specification fqr Pozzolanic Bases and Subbases. N-Viro Energy System, Ltd., 1984.
7. ASTM Standards, Section 4, Volume 04.08. Soil and Rock; Build· ing Stones; Geote.xtilcs. American Society for Testing and Materials, 1988.
27
8. AASHTO Guide for the Design of Pavement Structures 1986. American As$ociation of State Highway and Transportation Officials, Washington, D.C., 1986.
9. Soil-Cemem Construction Handbook. Portland Cement Association, 1979.
Publication of this paper sponsored by Commiuee on Soil and Rock Properties.