Embed Size (px)
Citation preview
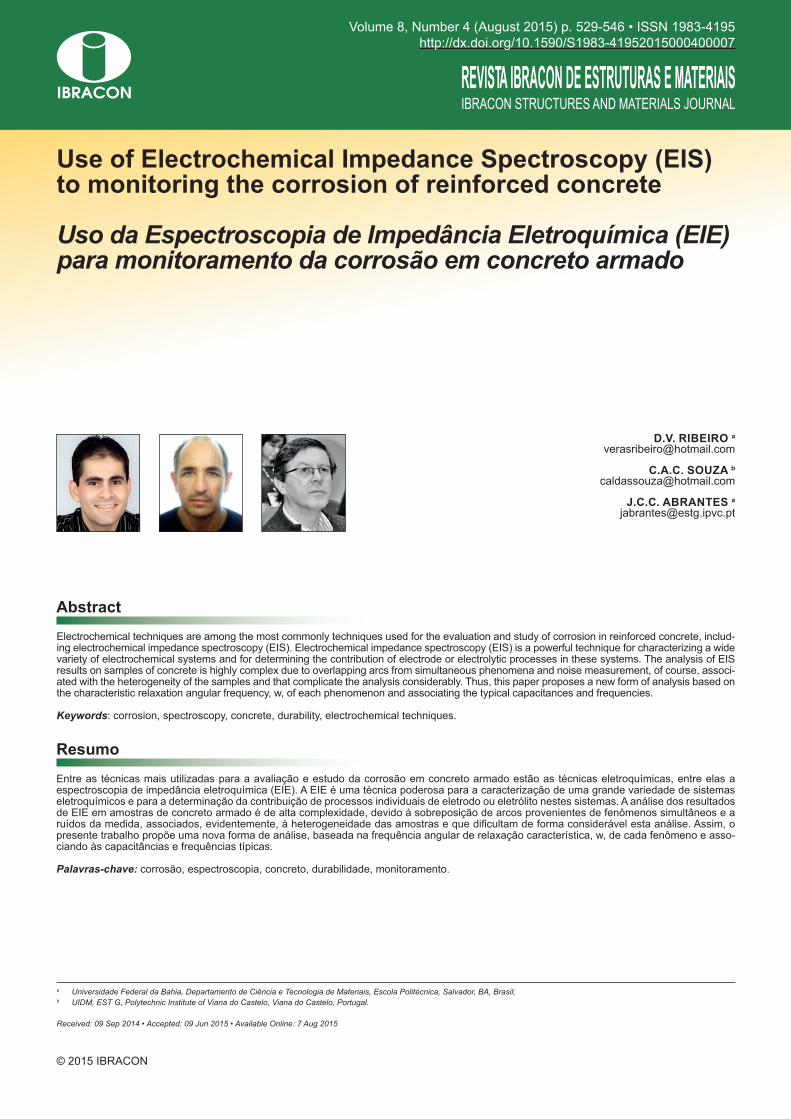
© 2015 IBRACON
Use of Electrochemical Impedance Spectroscopy (EIS) to monitoring the corrosion of reinforced concrete
Uso da Espectroscopia de Impedância Eletroquímica (EIE) para monitoramento da corrosão em concreto armado
a Universidade Federal da Bahia, Departamento de Ciência e Tecnologia de Materiais, Escola Politécnica, Salvador, BA, Brasil;b UIDM, EST G, Polytechnic Institute of Viana do Castelo, Viana do Castelo, Portugal.
Received: 09 Sep 2014 • Accepted: 09 Jun 2015 • Available Online: 7 Aug 2015
Abstract
Resumo
Electrochemical techniques are among the most commonly techniques used for the evaluation and study of corrosion in reinforced concrete, includ-ing electrochemical impedance spectroscopy (EIS). Electrochemical impedance spectroscopy (EIS) is a powerful technique for characterizing a wide variety of electrochemical systems and for determining the contribution of electrode or electrolytic processes in these systems. The analysis of EIS results on samples of concrete is highly complex due to overlapping arcs from simultaneous phenomena and noise measurement, of course, associ-ated with the heterogeneity of the samples and that complicate the analysis considerably. Thus, this paper proposes a new form of analysis based on the characteristic relaxation angular frequency, w, of each phenomenon and associating the typical capacitances and frequencies.
Keywords: corrosion, spectroscopy, concrete, durability, electrochemical techniques.
Entre as técnicas mais utilizadas para a avaliação e estudo da corrosão em concreto armado estão as técnicas eletroquímicas, entre elas a espectroscopia de impedância eletroquímica (EIE). A EIE é uma técnica poderosa para a caracterização de uma grande variedade de sistemas eletroquímicos e para a determinação da contribuição de processos individuais de eletrodo ou eletrólito nestes sistemas. A análise dos resultados de EIE em amostras de concreto armado é de alta complexidade, devido à sobreposição de arcos provenientes de fenômenos simultâneos e a ruídos da medida, associados, evidentemente, à heterogeneidade das amostras e que dificultam de forma considerável esta análise. Assim, o presente trabalho propõe uma nova forma de análise, baseada na frequência angular de relaxação característica, w, de cada fenômeno e asso-ciando às capacitâncias e frequências típicas.
Palavras-chave: corrosão, espectroscopia, concreto, durabilidade, monitoramento.
D.V. RIBEIRO a
C.A.C. SOUZA b
J.C.C. ABRANTES a
Volume 8, Number 4 (August 2015) p. 529-546 • ISSN 1983-4195http://dx.doi.org/10.1590/S1983-41952015000400007
530 IBRACON Structures and Materials Journal • 2015 • vol. 8 • nº 4
Use of Electrochemical Impedance Spectroscopy (EIS) to monitoring the corrosion of reinforced concrete
1. Introduction
The term “corrosion of reinforced concrete” refers not only to the reinforcement corrosion problems, but also to conditions of greater or lesser rebar protection by concrete itself.The protection of the steel by concrete is done in two ways: by a physical barrier, by the covering layer and due to chemical action that results from typical pH of concrete to allow the development of a passivation film on the rebar. Despite this dual protection, there are several factors or conditions that lead to the development of the corrosion process in the concrete, such as reduced coating thickness, low resistance of the concrete coating to penetration of CO2, water and salts, poor compaction or vibration of concrete, presence of contaminants salts or gases such as SO2 or CO2, pres-ence of sulfate-reducing bacteria, reduced amount of cement or elevated water/cement ratio.The corrosion process in reinforced concrete is a “camouflaged” phenomenon, that is, the first signs of corrosion only appear long after the process began and spread, and therefore , their early identification is very difficult.Several techniques can be employed for evaluation and study of corrosion in reinforced concrete, and among the most used are the electrochemical techniques. These techniques, besides analyze corrosion as a electrochemical phenomenon and therefore present greater reliability, have the advantage of being fast and not igniting serious damage to the structure at the time of application; in addi-tion it can be used both in the laboratory and in the field.Electrochemical impedance spectroscopy (EIS) is a powerful tech-nique for characterizing a wide variety of electrochemical systems and for determining the contribution of electrode or electrolytic pro-cesses in these systems. It can be used to investigate the dynamics of linked or mobile charges on the volume of interface regions or any liquid or solid material, and assumes that a more or less elaborate circuit can represent the behavior of the steel within the concrete.According to MONTENOR [1], the impedance of an electrical cir-cuit is the measure of its opposition to an electrical signal (potential
or current). It is a combination of passive elements of an electrical circuit: resistance, capacitance and inductance. The EIS technique works in the frequency domain and is based on the concept that an interface can be seen as a combination of passive electrical circuit elements, i.e., resistance, capacitance and inductance. When an alternating current is applied to these elements, the resulting cur-rent is obtained using Ohm’s law. However, due to the concrete heterogeneity, the analysis results of EIS become very difficult be-cause there is a large overlap of arches from simultaneous phe-nomena and the measurement noise. This study aims to present an alternative of analysis to this powerful technique.
2. The Electrochemical Impedance Spectroscopy (EIS)
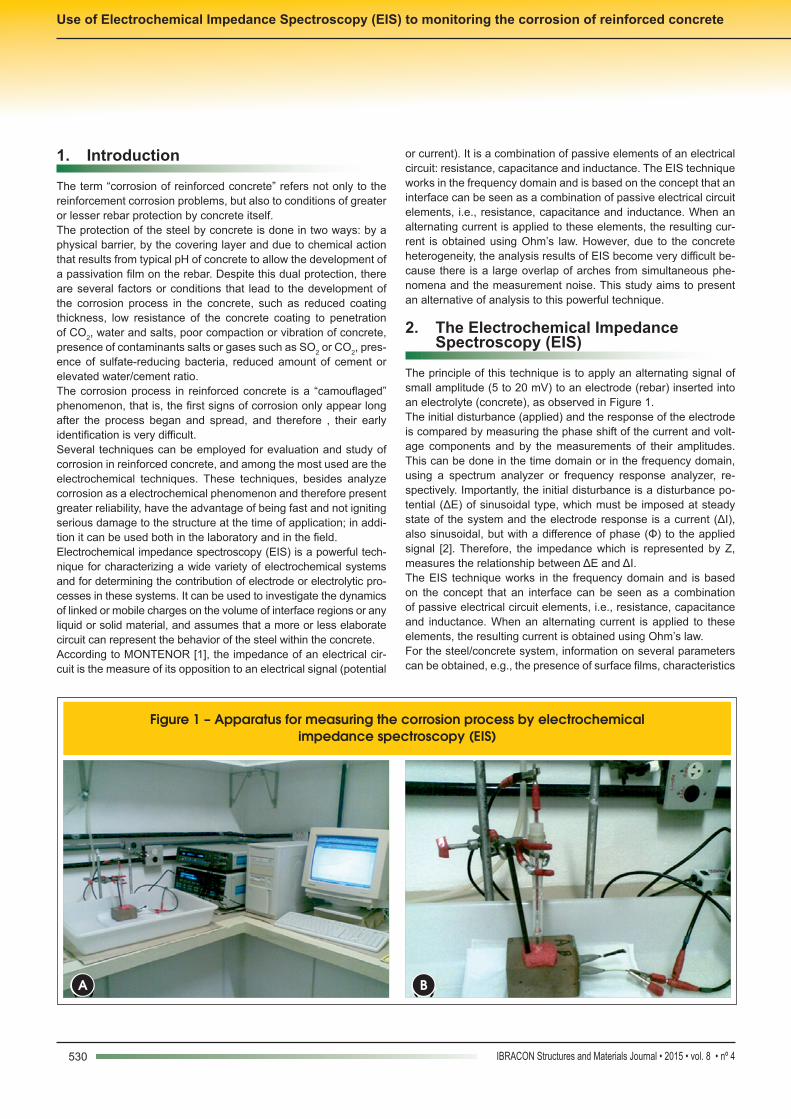
The principle of this technique is to apply an alternating signal of small amplitude (5 to 20 mV) to an electrode (rebar) inserted into an electrolyte (concrete), as observed in Figure 1.The initial disturbance (applied) and the response of the electrode is compared by measuring the phase shift of the current and volt-age components and by the measurements of their amplitudes. This can be done in the time domain or in the frequency domain, using a spectrum analyzer or frequency response analyzer, re-spectively. Importantly, the initial disturbance is a disturbance po-tential (ΔE) of sinusoidal type, which must be imposed at steady state of the system and the electrode response is a current (ΔI), also sinusoidal, but with a difference of phase (Φ) to the applied signal [2]. Therefore, the impedance which is represented by Z, measures the relationship between ΔE and ΔI.The EIS technique works in the frequency domain and is based on the concept that an interface can be seen as a combination of passive electrical circuit elements, i.e., resistance, capacitance and inductance. When an alternating current is applied to these elements, the resulting current is obtained using Ohm’s law. For the steel/concrete system, information on several parameters can be obtained, e.g., the presence of surface films, characteristics
A
Figure 1 – Apparatus for measuring the corrosion process by electrochemical impedance spectroscopy (EIS)
B
531IBRACON Structures and Materials Journal • 2015 • vol. 8 • nº 4
D.V. RIBEIRO | C.A.C. SOUZA | J.C.C. ABRANTES
of the concrete, interfacial corrosion, and mass transfer phenom-ena. However, interpreting the results may be difficult and the use of an equivalent circuit, which can change according to the condi-tions of the steel, makes the technique more suitable for laboratory studies [1]. The main advantages of EIS are: n It provides information about the corrosion kinetics.n It is an accurate and reproducible technique suitable for highly
resistive environments such as concrete.n It provides data about the electrochemical control mechanism,
indicating if corrosion occurs by activation, concentration or diffusion.
n It characterizes the state of the rebar and the morphology of the corrosion.
n It is a non-destructive and non-perturbative technique, since the signals applied are of small amplitude, so the corrosion potential is not changed; and
n It allows for monitoring of the evolution of the passive or active state over time.
2.1 Interpretation of results
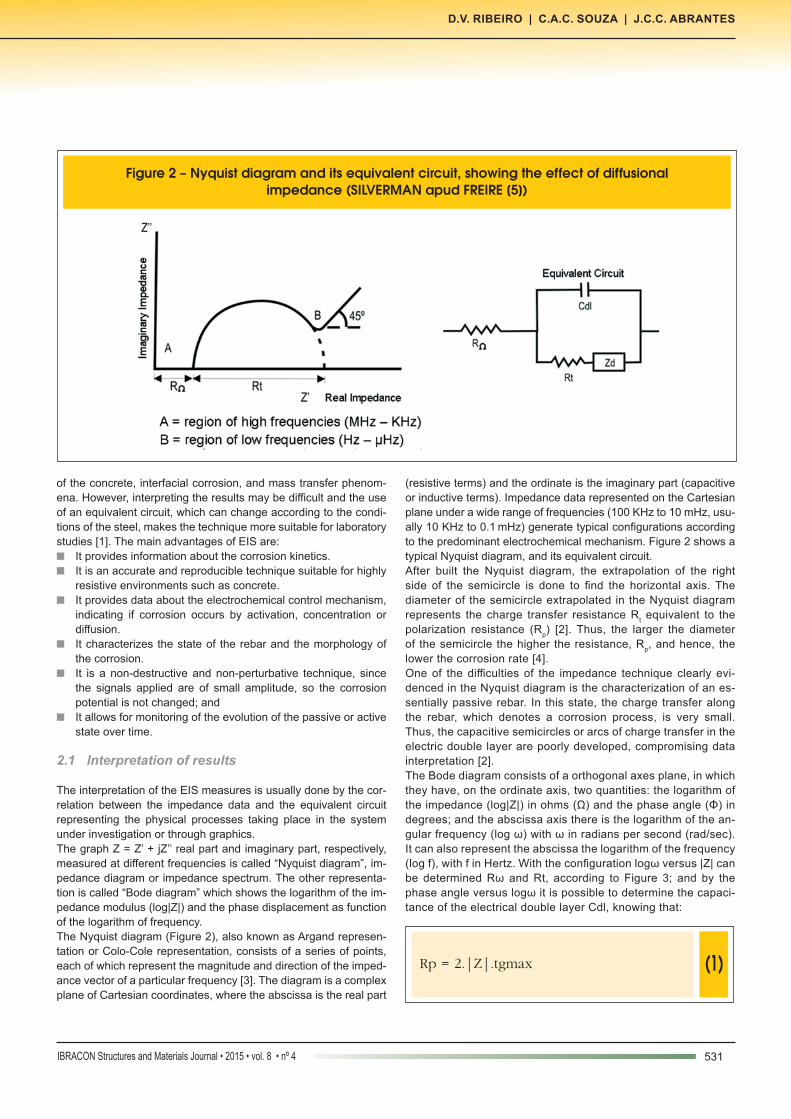
The interpretation of the EIS measures is usually done by the cor-relation between the impedance data and the equivalent circuit representing the physical processes taking place in the system under investigation or through graphics.The graph Z = Z’ + jZ’’ real part and imaginary part, respectively, measured at different frequencies is called “Nyquist diagram”, im-pedance diagram or impedance spectrum. The other representa-tion is called “Bode diagram” which shows the logarithm of the im-pedance modulus (log|Z|) and the phase displacement as function of the logarithm of frequency.The Nyquist diagram (Figure 2), also known as Argand represen-tation or Colo-Cole representation, consists of a series of points, each of which represent the magnitude and direction of the imped-ance vector of a particular frequency [3]. The diagram is a complex plane of Cartesian coordinates, where the abscissa is the real part
(resistive terms) and the ordinate is the imaginary part (capacitive or inductive terms). Impedance data represented on the Cartesian plane under a wide range of frequencies (100 KHz to 10 mHz, usu-ally 10 KHz to 0.1 mHz) generate typical configurations according to the predominant electrochemical mechanism. Figure 2 shows a typical Nyquist diagram, and its equivalent circuit.After built the Nyquist diagram, the extrapolation of the right side of the semicircle is done to find the horizontal axis. The diameter of the semicircle extrapolated in the Nyquist diagram represents the charge transfer resistance Rt equivalent to the polarization resistance (Rp) [2]. Thus, the larger the diameter of the semicircle the higher the resistance, Rp, and hence, the lower the corrosion rate [4].One of the difficulties of the impedance technique clearly evi-denced in the Nyquist diagram is the characterization of an es-sentially passive rebar. In this state, the charge transfer along the rebar, which denotes a corrosion process, is very small. Thus, the capacitive semicircles or arcs of charge transfer in the electric double layer are poorly developed, compromising data interpretation [2].The Bode diagram consists of a orthogonal axes plane, in which they have, on the ordinate axis, two quantities: the logarithm of the impedance (log|Z|) in ohms (Ω) and the phase angle (Φ) in degrees; and the abscissa axis there is the logarithm of the an-gular frequency (log ω) with ω in radians per second (rad/sec). It can also represent the abscissa the logarithm of the frequency (log f), with f in Hertz. With the configuration logω versus |Z| can be determined Rω and Rt, according to Figure 3; and by the phase angle versus logω it is possible to determine the capaci-tance of the electrical double layer Cdl, knowing that:
(1)Rp = 2.|Z|.tgmax
Figure 2 – Nyquist diagram and its equivalent circuit, showing the effect of diffusional impedance (SILVERMAN apud FREIRE [5])
532 IBRACON Structures and Materials Journal • 2015 • vol. 8 • nº 4
Use of Electrochemical Impedance Spectroscopy (EIS) to monitoring the corrosion of reinforced concrete
(2)
2/1)/1.(.
1
W+=
RRRC PPdlmáxfw
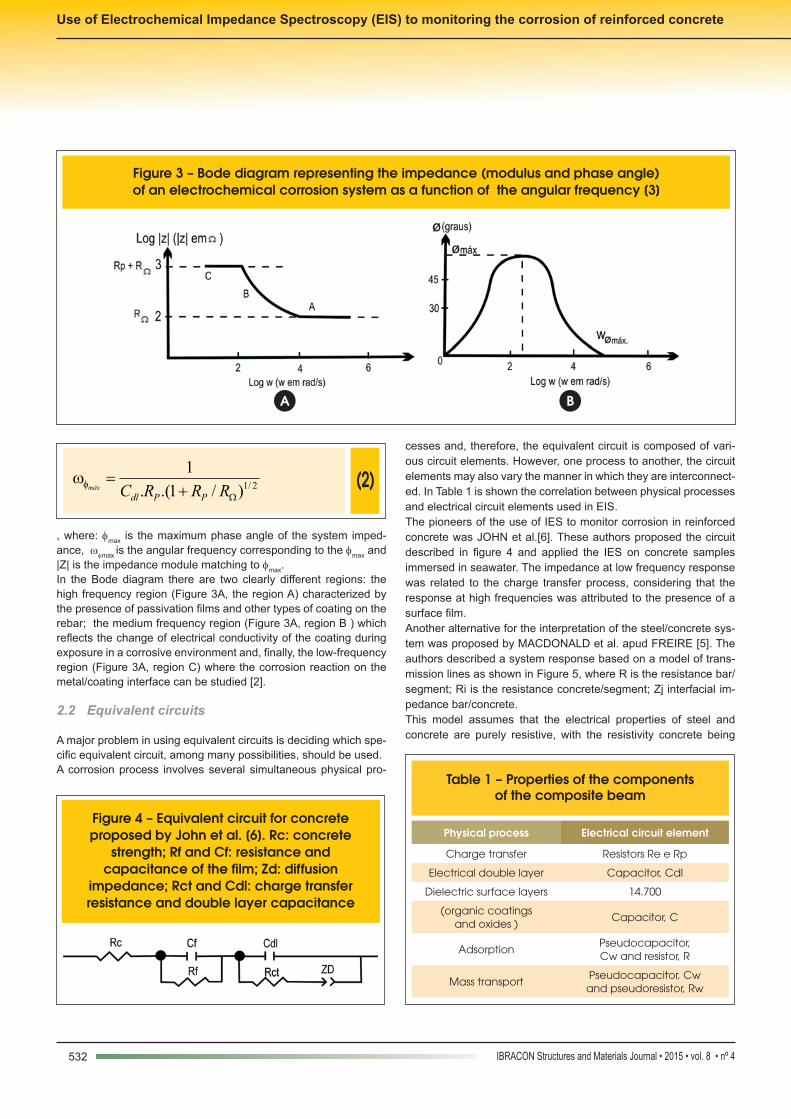
, where: fmax is the maximum phase angle of the system imped-ance, wfmax is the angular frequency corresponding to the fmax and |Z| is the impedance module matching to fmax.In the Bode diagram there are two clearly different regions: the high frequency region (Figure 3A, the region A) characterized by the presence of passivation films and other types of coating on the rebar; the medium frequency region (Figure 3A, region B ) which reflects the change of electrical conductivity of the coating during exposure in a corrosive environment and, finally, the low-frequency region (Figure 3A, region C) where the corrosion reaction on the metal/coating interface can be studied [2].
2.2 Equivalent circuits
A major problem in using equivalent circuits is deciding which spe-cific equivalent circuit, among many possibilities, should be used.A corrosion process involves several simultaneous physical pro-
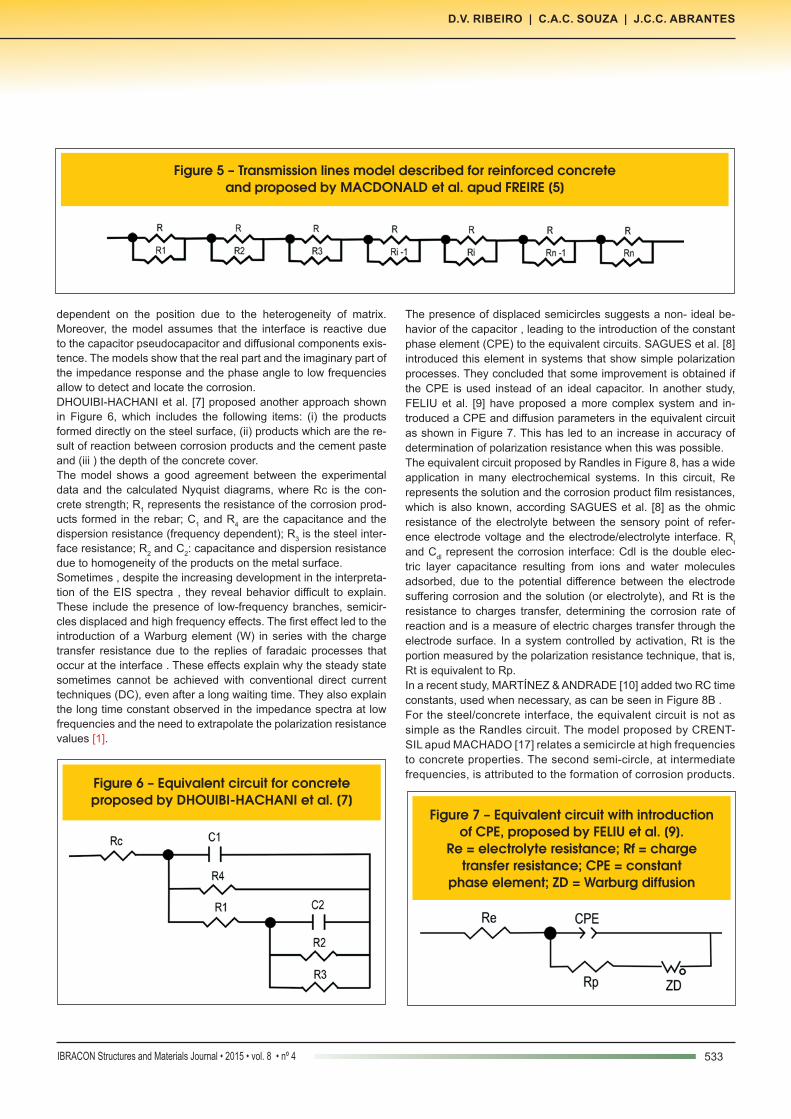
cesses and, therefore, the equivalent circuit is composed of vari-ous circuit elements. However, one process to another, the circuit elements may also vary the manner in which they are interconnect-ed. In Table 1 is shown the correlation between physical processes and electrical circuit elements used in EIS.The pioneers of the use of IES to monitor corrosion in reinforced concrete was JOHN et al.[6]. These authors proposed the circuit described in figure 4 and applied the IES on concrete samples immersed in seawater. The impedance at low frequency response was related to the charge transfer process, considering that the response at high frequencies was attributed to the presence of a surface film.Another alternative for the interpretation of the steel/concrete sys-tem was proposed by MACDONALD et al. apud FREIRE [5]. The authors described a system response based on a model of trans-mission lines as shown in Figure 5, where R is the resistance bar/segment; Ri is the resistance concrete/segment; Zj interfacial im-pedance bar/concrete.This model assumes that the electrical properties of steel and concrete are purely resistive, with the resistivity concrete being
Figure 3 – Bode diagram representing the impedance (modulus and phase angle) of an electrochemical corrosion system as a function of the angular frequency [3]
A B
Table 1 – Properties of the components of the composite beam
Physical process Electrical circuit element
Charge transfer Resistors Re e Rp
Electrical double layer Capacitor, Cdl
Dielectric surface layers 14.700
(organic coatings and oxides )
Capacitor, C
AdsorptionPseudocapacitor, Cw and resistor, R
Mass transportPseudocapacitor, Cw and pseudoresistor, Rw
Figure 4 – Equivalent circuit for concrete proposed by John et al. [6]. Rc: concrete
strength; Rf and Cf: resistance and capacitance of the film; Zd: diffusion
impedance; Rct and Cdl: charge transfer resistance and double layer capacitance
533IBRACON Structures and Materials Journal • 2015 • vol. 8 • nº 4
D.V. RIBEIRO | C.A.C. SOUZA | J.C.C. ABRANTES
dependent on the position due to the heterogeneity of matrix. Moreover, the model assumes that the interface is reactive due to the capacitor pseudocapacitor and diffusional components exis-tence. The models show that the real part and the imaginary part of the impedance response and the phase angle to low frequencies allow to detect and locate the corrosion.DHOUIBI-HACHANI et al. [7] proposed another approach shown in Figure 6, which includes the following items: (i) the products formed directly on the steel surface, (ii) products which are the re-sult of reaction between corrosion products and the cement paste and (iii ) the depth of the concrete cover.The model shows a good agreement between the experimental data and the calculated Nyquist diagrams, where Rc is the con-crete strength; R1 represents the resistance of the corrosion prod-ucts formed in the rebar; C1 and R4 are the capacitance and the dispersion resistance (frequency dependent); R3 is the steel inter-face resistance; R2 and C2: capacitance and dispersion resistance due to homogeneity of the products on the metal surface.Sometimes , despite the increasing development in the interpreta-tion of the EIS spectra , they reveal behavior difficult to explain. These include the presence of low-frequency branches, semicir-cles displaced and high frequency effects. The first effect led to the introduction of a Warburg element (W) in series with the charge transfer resistance due to the replies of faradaic processes that occur at the interface . These effects explain why the steady state sometimes cannot be achieved with conventional direct current techniques (DC), even after a long waiting time. They also explain the long time constant observed in the impedance spectra at low frequencies and the need to extrapolate the polarization resistance values [1].
The presence of displaced semicircles suggests a non- ideal be-havior of the capacitor , leading to the introduction of the constant phase element (CPE) to the equivalent circuits. SAGUES et al. [8] introduced this element in systems that show simple polarization processes. They concluded that some improvement is obtained if the CPE is used instead of an ideal capacitor. In another study, FELIU et al. [9] have proposed a more complex system and in-troduced a CPE and diffusion parameters in the equivalent circuit as shown in Figure 7. This has led to an increase in accuracy of determination of polarization resistance when this was possible.The equivalent circuit proposed by Randles in Figure 8, has a wide application in many electrochemical systems. In this circuit, Re represents the solution and the corrosion product film resistances, which is also known, according SAGUES et al. [8] as the ohmic resistance of the electrolyte between the sensory point of refer-ence electrode voltage and the electrode/electrolyte interface. Rt and Cdl represent the corrosion interface: Cdl is the double elec-tric layer capacitance resulting from ions and water molecules adsorbed, due to the potential difference between the electrode suffering corrosion and the solution (or electrolyte), and Rt is the resistance to charges transfer, determining the corrosion rate of reaction and is a measure of electric charges transfer through the electrode surface. In a system controlled by activation, Rt is the portion measured by the polarization resistance technique, that is, Rt is equivalent to Rp.In a recent study, MARTÍNEZ & ANDRADE [10] added two RC time constants, used when necessary, as can be seen in Figure 8B .For the steel/concrete interface, the equivalent circuit is not as simple as the Randles circuit. The model proposed by CRENT-SIL apud MACHADO [17] relates a semicircle at high frequencies to concrete properties. The second semi-circle, at intermediate frequencies, is attributed to the formation of corrosion products.
Figure 5 – Transmission lines model described for reinforced concrete and proposed by MACDONALD et al. apud FREIRE [5]
Figure 6 – Equivalent circuit for concrete proposed by DHOUIBI-HACHANI et al. [7]
Figure 7 – Equivalent circuit with introduction of CPE, proposed by FELIU et al. [9].
Re = electrolyte resistance; Rf = charge transfer resistance; CPE = constant
phase element; ZD = Warburg diffusion
534 IBRACON Structures and Materials Journal • 2015 • vol. 8 • nº 4
Use of Electrochemical Impedance Spectroscopy (EIS) to monitoring the corrosion of reinforced concrete
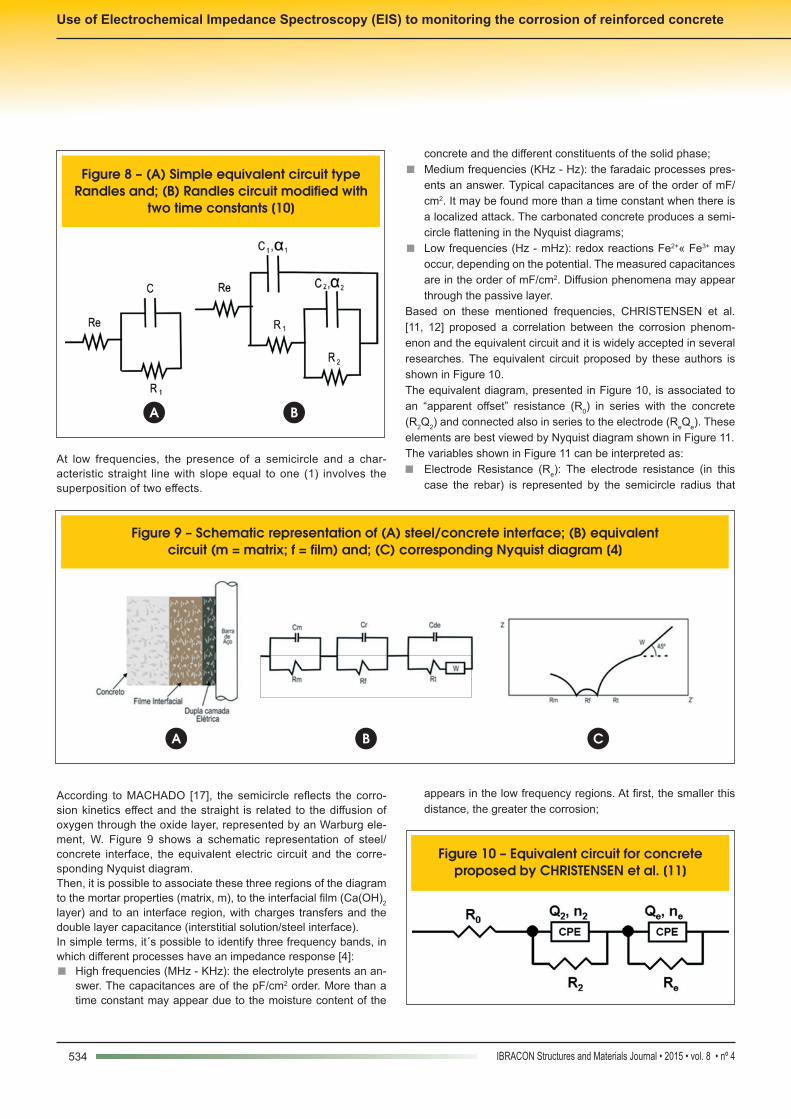
At low frequencies, the presence of a semicircle and a char-acteristic straight line with slope equal to one (1) involves the superposition of two effects.
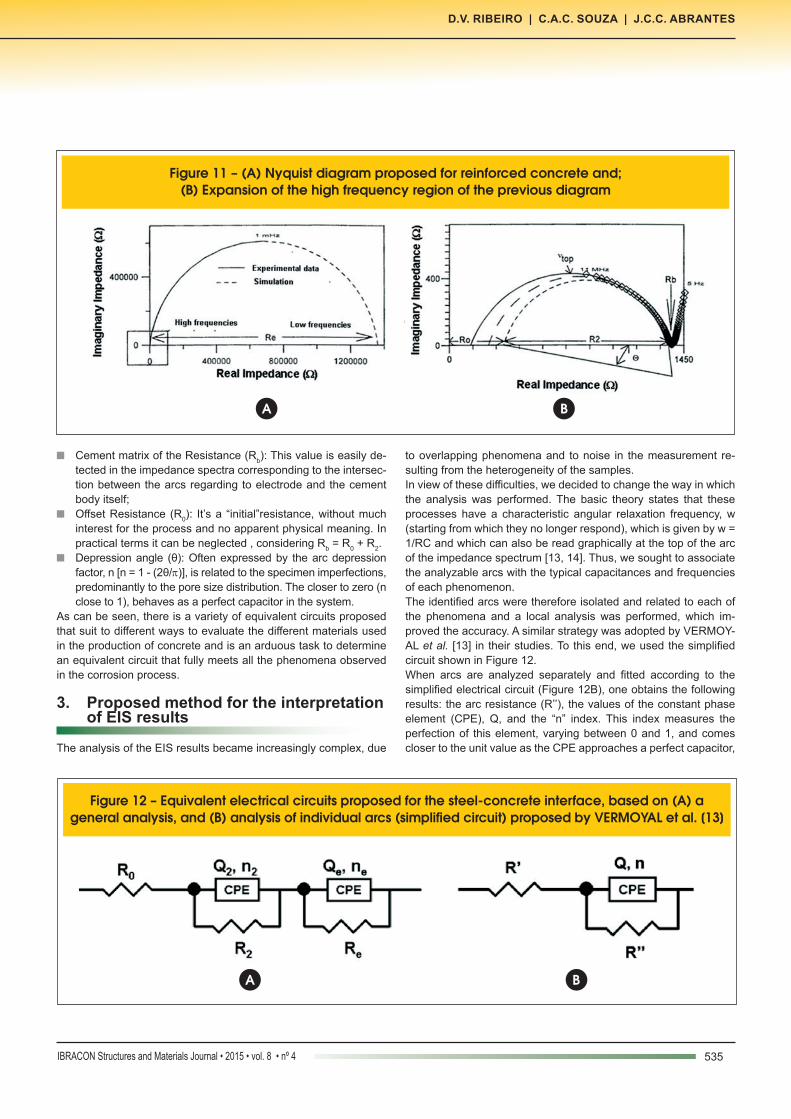
According to MACHADO [17], the semicircle reflects the corro-sion kinetics effect and the straight is related to the diffusion of oxygen through the oxide layer, represented by an Warburg ele-ment, W. Figure 9 shows a schematic representation of steel/concrete interface, the equivalent electric circuit and the corre-sponding Nyquist diagram.Then, it is possible to associate these three regions of the diagram to the mortar properties (matrix, m), to the interfacial film (Ca(OH)2 layer) and to an interface region, with charges transfers and the double layer capacitance (interstitial solution/steel interface).In simple terms, it´s possible to identify three frequency bands, in which different processes have an impedance response [4]:n High frequencies (MHz - KHz): the electrolyte presents an an-
swer. The capacitances are of the pF/cm2 order. More than a time constant may appear due to the moisture content of the
concrete and the different constituents of the solid phase;n Medium frequencies (KHz - Hz): the faradaic processes pres-
ents an answer. Typical capacitances are of the order of mF/cm2. It may be found more than a time constant when there is a localized attack. The carbonated concrete produces a semi-circle flattening in the Nyquist diagrams;
n Low frequencies (Hz - mHz): redox reactions Fe2+« Fe3+ may occur, depending on the potential. The measured capacitances are in the order of mF/cm2. Diffusion phenomena may appear through the passive layer.
Based on these mentioned frequencies, CHRISTENSEN et al. [11, 12] proposed a correlation between the corrosion phenom-enon and the equivalent circuit and it is widely accepted in several researches. The equivalent circuit proposed by these authors is shown in Figure 10.The equivalent diagram, presented in Figure 10, is associated to an “apparent offset” resistance (R0) in series with the concrete (R2Q2) and connected also in series to the electrode (ReQe). These elements are best viewed by Nyquist diagram shown in Figure 11.The variables shown in Figure 11 can be interpreted as:n Electrode Resistance (Re): The electrode resistance (in this
case the rebar) is represented by the semicircle radius that
appears in the low frequency regions. At first, the smaller this distance, the greater the corrosion;
Figure 8 – (A) Simple equivalent circuit type Randles and; (B) Randles circuit modified with
two time constants [10]
A B
A
Figure 9 – Schematic representation of (A) steel/concrete interface; (B) equivalent circuit (m = matrix; f = film) and; (C) corresponding Nyquist diagram [4]
B C
Figure 10 – Equivalent circuit for concrete proposed by CHRISTENSEN et al. [11]
535IBRACON Structures and Materials Journal • 2015 • vol. 8 • nº 4
D.V. RIBEIRO | C.A.C. SOUZA | J.C.C. ABRANTES
n Cement matrix of the Resistance (Rb): This value is easily de-tected in the impedance spectra corresponding to the intersec-tion between the arcs regarding to electrode and the cement body itself;
n Offset Resistance (R0): It’s a “initial”resistance, without much interest for the process and no apparent physical meaning. In practical terms it can be neglected , considering Rb = R0 + R2.
n Depression angle (θ): Often expressed by the arc depression factor, n [n = 1 - (2θ/p)], is related to the specimen imperfections, predominantly to the pore size distribution. The closer to zero (n close to 1), behaves as a perfect capacitor in the system.
As can be seen, there is a variety of equivalent circuits proposed that suit to different ways to evaluate the different materials used in the production of concrete and is an arduous task to determine an equivalent circuit that fully meets all the phenomena observed in the corrosion process.
3. Proposed method for the interpretation of EIS results
The analysis of the EIS results became increasingly complex, due
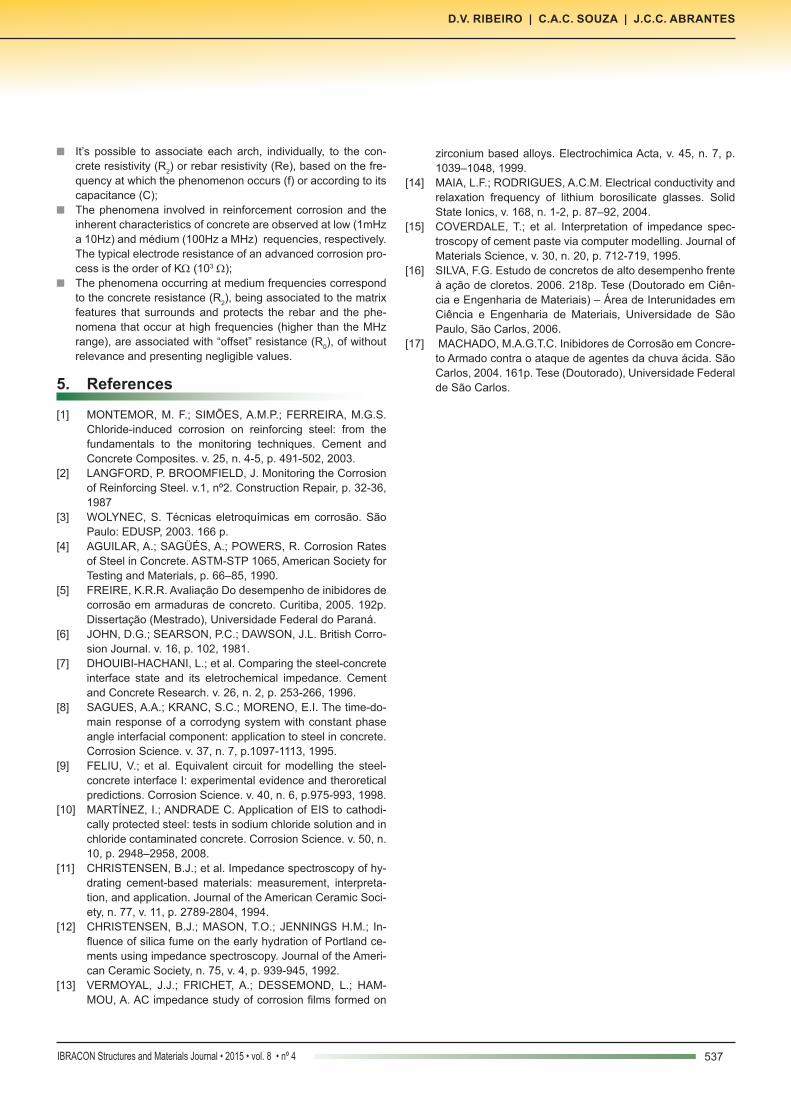
to overlapping phenomena and to noise in the measurement re-sulting from the heterogeneity of the samples.In view of these difficulties, we decided to change the way in which the analysis was performed. The basic theory states that these processes have a characteristic angular relaxation frequency, w (starting from which they no longer respond), which is given by w = 1/RC and which can also be read graphically at the top of the arc of the impedance spectrum [13, 14]. Thus, we sought to associate the analyzable arcs with the typical capacitances and frequencies of each phenomenon. The identified arcs were therefore isolated and related to each of the phenomena and a local analysis was performed, which im-proved the accuracy. A similar strategy was adopted by VERMOY-AL et al. [13] in their studies. To this end, we used the simplified circuit shown in Figure 12. When arcs are analyzed separately and fitted according to the simplified electrical circuit (Figure 12B), one obtains the following results: the arc resistance (R’’), the values of the constant phase element (CPE), Q, and the “n” index. This index measures the perfection of this element, varying between 0 and 1, and comes closer to the unit value as the CPE approaches a perfect capacitor,
A
Figure 11 – (A) Nyquist diagram proposed for reinforced concrete and; (B) Expansion of the high frequency region of the previous diagram
B
A
Figure 12 – Equivalent electrical circuits proposed for the steel-concrete interface, based on (A) a general analysis, and (B) analysis of individual arcs (simplified circuit) proposed by VERMOYAL et al. [13]
B
536 IBRACON Structures and Materials Journal • 2015 • vol. 8 • nº 4
Use of Electrochemical Impedance Spectroscopy (EIS) to monitoring the corrosion of reinforced concrete
C [4, 11, 15]. Thus, the characteristic capacitance, C, can be calcu-lated according to equation (3).
(3)/ /
.n
n nC Q R-
=
The characteristic frequency (f) associated with this characteristic capacitance is calculated in Hertz, according to equations (4) and (5), where w = 1/RC [4, 14].
(4)
p2)(
wHzf =
(5)
CRHzf
..2
1)(
p=
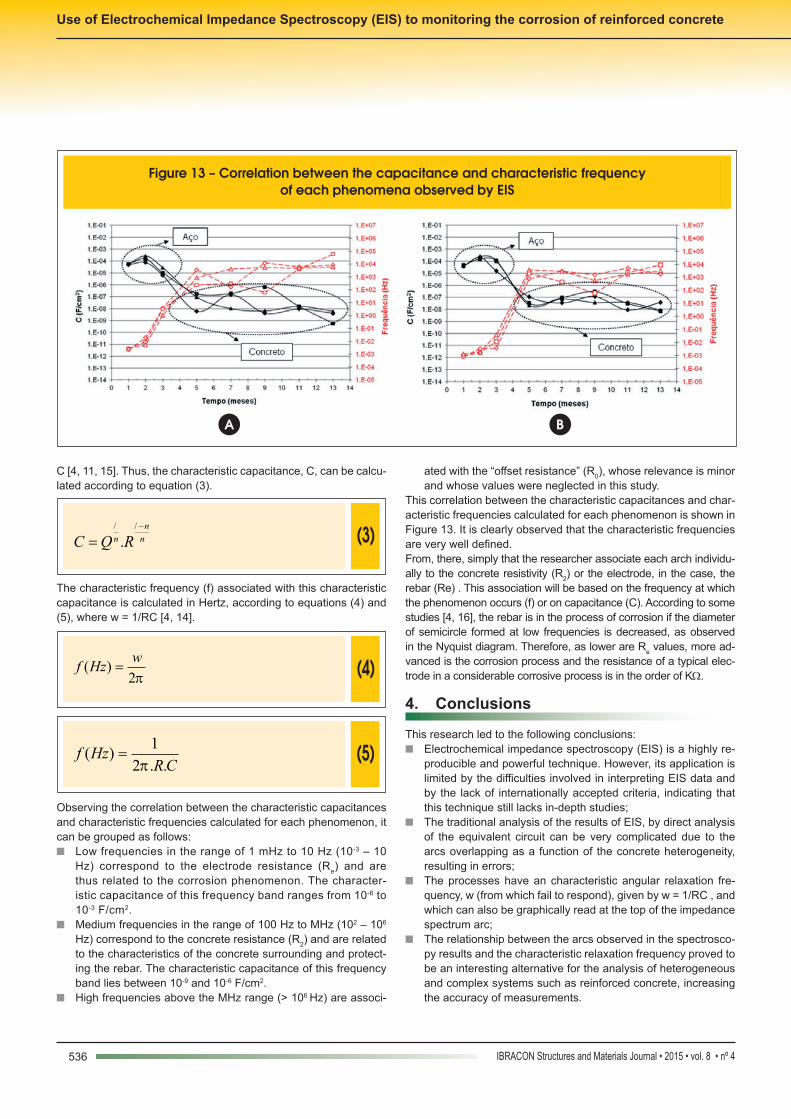
Observing the correlation between the characteristic capacitances and characteristic frequencies calculated for each phenomenon, it can be grouped as follows:n Low frequencies in the range of 1 mHz to 10 Hz (10-3 – 10
Hz) correspond to the electrode resistance (Re) and are thus related to the corrosion phenomenon. The character-istic capacitance of this frequency band ranges from 10-6 to 10-3 F/cm2.
n Medium frequencies in the range of 100 Hz to MHz (102 – 106 Hz) correspond to the concrete resistance (R2) and are related to the characteristics of the concrete surrounding and protect-ing the rebar. The characteristic capacitance of this frequency band lies between 10-9 and 10-6 F/cm2.
n High frequencies above the MHz range (> 106 Hz) are associ-
ated with the “offset resistance” (R0), whose relevance is minor and whose values were neglected in this study.
This correlation between the characteristic capacitances and char-acteristic frequencies calculated for each phenomenon is shown in Figure 13. It is clearly observed that the characteristic frequencies are very well defined.From, there, simply that the researcher associate each arch individu-ally to the concrete resistivity (R2) or the electrode, in the case, the rebar (Re) . This association will be based on the frequency at which the phenomenon occurs (f) or on capacitance (C). According to some studies [4, 16], the rebar is in the process of corrosion if the diameter of semicircle formed at low frequencies is decreased, as observed in the Nyquist diagram. Therefore, as lower are Re values, more ad-vanced is the corrosion process and the resistance of a typical elec-trode in a considerable corrosive process is in the order of KW.
4. Conclusions
This research led to the following conclusions:n Electrochemical impedance spectroscopy (EIS) is a highly re-
producible and powerful technique. However, its application is limited by the difficulties involved in interpreting EIS data and by the lack of internationally accepted criteria, indicating that this technique still lacks in-depth studies;
n The traditional analysis of the results of EIS, by direct analysis of the equivalent circuit can be very complicated due to the arcs overlapping as a function of the concrete heterogeneity, resulting in errors;
n The processes have an characteristic angular relaxation fre-quency, w (from which fail to respond), given by w = 1/RC , and which can also be graphically read at the top of the impedance spectrum arc;
n The relationship between the arcs observed in the spectrosco-py results and the characteristic relaxation frequency proved to be an interesting alternative for the analysis of heterogeneous and complex systems such as reinforced concrete, increasing the accuracy of measurements.
A
Figure 13 – Correlation between the capacitance and characteristic frequency of each phenomena observed by EIS
B
537IBRACON Structures and Materials Journal • 2015 • vol. 8 • nº 4
D.V. RIBEIRO | C.A.C. SOUZA | J.C.C. ABRANTES
n It’s possible to associate each arch, individually, to the con-crete resistivity (R2) or rebar resistivity (Re), based on the fre-quency at which the phenomenon occurs (f) or according to its capacitance (C);
n The phenomena involved in reinforcement corrosion and the inherent characteristics of concrete are observed at low (1mHz a 10Hz) and médium (100Hz a MHz) requencies, respectively. The typical electrode resistance of an advanced corrosion pro-cess is the order of KW (103 W);
n The phenomena occurring at medium frequencies correspond to the concrete resistance (R2), being associated to the matrix features that surrounds and protects the rebar and the phe-nomena that occur at high frequencies (higher than the MHz range), are associated with “offset” resistance (R0), of without relevance and presenting negligible values.
5. References
[1] MONTEMOR, M. F.; SIMÕES, A.M.P.; FERREIRA, M.G.S. Chloride-induced corrosion on reinforcing steel: from the fundamentals to the monitoring techniques. Cement and Concrete Composites. v. 25, n. 4-5, p. 491-502, 2003.
[2] LANGFORD, P. BROOMFIELD, J. Monitoring the Corrosion of Reinforcing Steel. v.1, nº2. Construction Repair, p. 32-36, 1987
[3] WOLYNEC, S. Técnicas eletroquímicas em corrosão. São Paulo: EDUSP, 2003. 166 p.
[4] AGUILAR, A.; SAGÜÉS, A.; POWERS, R. Corrosion Rates of Steel in Concrete. ASTM-STP 1065, American Society for Testing and Materials, p. 66–85, 1990.
[5] FREIRE, K.R.R. Avaliação Do desempenho de inibidores de corrosão em armaduras de concreto. Curitiba, 2005. 192p. Dissertação (Mestrado), Universidade Federal do Paraná.
[6] JOHN, D.G.; SEARSON, P.C.; DAWSON, J.L. British Corro-sion Journal. v. 16, p. 102, 1981.
[7] DHOUIBI-HACHANI, L.; et al. Comparing the steel-concrete interface state and its eletrochemical impedance. Cement and Concrete Research. v. 26, n. 2, p. 253-266, 1996.
[8] SAGUES, A.A.; KRANC, S.C.; MORENO, E.I. The time-do-main response of a corrodyng system with constant phase angle interfacial component: application to steel in concrete. Corrosion Science. v. 37, n. 7, p.1097-1113, 1995.
[9] FELIU, V.; et al. Equivalent circuit for modelling the steel-concrete interface I: experimental evidence and theroretical predictions. Corrosion Science. v. 40, n. 6, p.975-993, 1998.
[10] MARTÍNEZ, I.; ANDRADE C. Application of EIS to cathodi-cally protected steel: tests in sodium chloride solution and in chloride contaminated concrete. Corrosion Science. v. 50, n. 10, p. 2948–2958, 2008.
[11] CHRISTENSEN, B.J.; et al. Impedance spectroscopy of hy-drating cement-based materials: measurement, interpreta-tion, and application. Journal of the American Ceramic Soci-ety, n. 77, v. 11, p. 2789-2804, 1994.
[12] CHRISTENSEN, B.J.; MASON, T.O.; JENNINGS H.M.; In-fluence of silica fume on the early hydration of Portland ce-ments using impedance spectroscopy. Journal of the Ameri-can Ceramic Society, n. 75, v. 4, p. 939-945, 1992.
[13] VERMOYAL, J.J.; FRICHET, A.; DESSEMOND, L.; HAM-MOU, A. AC impedance study of corrosion films formed on
zirconium based alloys. Electrochimica Acta, v. 45, n. 7, p. 1039–1048, 1999.
[14] MAIA, L.F.; RODRIGUES, A.C.M. Electrical conductivity and relaxation frequency of lithium borosilicate glasses. Solid State Ionics, v. 168, n. 1-2, p. 87–92, 2004.
[15] COVERDALE, T.; et al. Interpretation of impedance spec-troscopy of cement paste via computer modelling. Journal of Materials Science, v. 30, n. 20, p. 712-719, 1995.
[16] SILVA, F.G. Estudo de concretos de alto desempenho frente à ação de cloretos. 2006. 218p. Tese (Doutorado em Ciên-cia e Engenharia de Materiais) – Área de Interunidades em Ciência e Engenharia de Materiais, Universidade de São Paulo, São Carlos, 2006.
[17] MACHADO, M.A.G.T.C. Inibidores de Corrosão em Concre-to Armado contra o ataque de agentes da chuva ácida. São Carlos, 2004. 161p. Tese (Doutorado), Universidade Federal de São Carlos.