Embed Size (px)
Citation preview

Use of Geosynthetics for Separation and Stabilization in Low-Volume Roadways http://www.virginiadot.org/vtrc/main/online_reports/pdf/20-r8.pdf EDWARD J. HOPPE, Ph.D., P.E. Associate Principal Research Scientist Virginia Transportation Research Council M. SHABBIR HOSSAIN, Ph.D., P.E. Associate Principal Research Scientist Virginia Transportation Research Council AUDREY K. MORUZA Senior Research Scientist Virginia Transportation Research Council CHAZ B. WEAVER, P.E., CPEM District Materials Engineer Virginia Department of Transportation
Final Report VTRC 20-R8

Standard Title Page - Report on Federally Funded Project 1. Report No.: 2. Government Accession No.: 3. Recipient’s Catalog No.: FHWA/VTRC 20-R8
4. Title and Subtitle: 5. Report Date: Use of Geosynthetics for Separation and Stabilization in Low-Volume Roadways
October 2019 6. Performing Organization Code:
7. Author(s): Edward J. Hoppe, Ph.D., P.E., M. Shabbir Hossain, Ph.D., P.E., Audrey K. Moruza, and Chaz B. Weaver, P.E., CPEM
8. Performing Organization Report No.: VTRC 20-R8
9. Performing Organization and Address: Virginia Center for Transportation Innovation and Research 530 Edgemont Road Charlottesville, VA 22903
10. Work Unit No. (TRAIS): 11. Contract or Grant No.: 109960
12. Sponsoring Agencies’ Name and Address: 13. Type of Report and Period Covered: Virginia Department of Transportation 1401 E. Broad Street Richmond, VA 23219
Federal Highway Administration 400 North 8th Street, Room 750 Richmond, VA 23219-4825
Final 14. Sponsoring Agency Code:
15. Supplementary Notes: This is an SPR-B report. 16. Abstract:
The implementation of geosynthetics in road construction in the United States dates back to the 1970s. Although the benefits of these materials are widely recognized, actual design and construction practices are not universal. Guidelines for use are often developed locally based on specific field experience.
Currently, the Virginia Department of Transportation (VDOT) provides specifications (but no design guidance) for only one function of subgrade geotextile: stabilization. Pavement layer separation is not explicitly addressed by VDOT. This study reviewed corresponding practices at other transportation agencies, focusing on subgrade and pavement applications. In addition, observations gathered from field testing of two known sites with geosynthetics in Virginia were analyzed. Finally, life cycle cost analyses (LCCAs) were performed on two common secondary road designs, each with the options of separator geotextile and preventive maintenance, to estimate comparative costs under three different rates of subbase contamination by fines migrating from the subgrade.
The LCCA employed actual VDOT cost data and conceptual pavement layer deterioration curves that are based on AASHTO curves augmented by differentiated subbase deterioration resulting from three hypothetical contamination rates. Unlike the current LCCA used by VDOT’s Materials Division, the LCCA model developed in this study explicitly recognizes the fact of potential subbase layer deterioration because of contamination by subgrade fines, comporting with the widely recognized function of geotextile separator. The results indicate that separator geotextile imparts long-run cost-effectiveness relative to pavements without geotextile separators at contamination rates of 0.1 in per year and greater. At contamination rates of 0.05 in per year and lower, the addition of separator geotextile is not cost-effective, although the results vary slightly depending on the treatment of estimated pavement design life remaining at the end of the analysis period.
The study recommends that VDOT revise its current specifications to include subgrade separation and subgrade
stabilization geosynthetics as separate and distinct pay items, and it provides suggested specification language to effect this change. Guidelines to implement these changes are also enumerated. 17 Key Words: 18. Distribution Statement: Geosynthetics, geotextile, geogrid, roadway, separation, stabilization, LCCA
No restrictions. This document is available to the public through NTIS, Springfield, VA 22161.
19. Security Classif. (of this report): 20. Security Classif. (of this page): 21. No. of Pages: 22. Price: Unclassified Unclassified 93
Form DOT F 1700.7 (8-72) Reproduction of completed page authorized

FINAL REPORT
USE OF GEOSYNTHETICS FOR SEPARATION AND STABILIZATION
IN LOW-VOLUME ROADWAYS
Edward J. Hoppe, Ph.D., P.E.
Associate Principal Research Scientist
Virginia Transportation Research Council
M. Shabbir Hossain, Ph.D., P.E.
Associate Principal Research Scientist
Virginia Transportation Research Council
Audrey K. Moruza
Senior Research Scientist
Virginia Transportation Research Council
Chaz B. Weaver, P.E., CPEM
District Materials Engineer
Virginia Department of Transportation
In Cooperation with the U.S. Department of Transportation
Federal Highway Administration
Virginia Transportation Research Council
(A partnership of the Virginia Department of Transportation
and the University of Virginia since 1948)
Charlottesville, Virginia
November 2019
VTRC 20-R8

ii
DISCLAIMER
The contents of this report reflect the views of the authors, who are responsible for the
facts and the accuracy of the data presented herein. The contents do not necessarily reflect the
official views or policies of the Virginia Department of Transportation, the Commonwealth
Transportation Board, or the Federal Highway Administration. This report does not constitute a
standard, specification, or regulation. Any inclusion of manufacturer names, trade names, or
trademarks is for identification purposes only and is not to be considered an endorsement.
Copyright 2019 by the Commonwealth of Virginia.
All rights reserved.

iii
TABLE OF CONTENTS
ABSTRACT .................................................................................................................................... v
INTRODUCTION .......................................................................................................................... 1
PURPOSE AND SCOPE ................................................................................................................ 2
METHODS ..................................................................................................................................... 3
Overview ..................................................................................................................................... 3
Literature Review........................................................................................................................ 3
Determination of State of the Practice in Virginia ...................................................................... 4
Analysis of Test Sites With Geosynthetics in Virginia .............................................................. 4
Development of New LCCA Method ......................................................................................... 8
RESULTS ..................................................................................................................................... 15
Literature Review...................................................................................................................... 15
Performance of Sites With Geosynthetics in Virginia .............................................................. 32
Life Cycle Cost Analysis .......................................................................................................... 41
DISCUSSION ............................................................................................................................... 50
CONCLUSIONS........................................................................................................................... 56
RECOMMENDATIONS .............................................................................................................. 58
SUGGESTIONS FOR FURTHER RESEARCH ......................................................................... 59
IMPLEMENTATION AND BENEFITS ..................................................................................... 59
Implementation ......................................................................................................................... 59
Benefits ..................................................................................................................................... 59
ACKNOWLEDGMENTS ............................................................................................................ 60
REFERENCES ............................................................................................................................. 60
APPENDIX A: SURVEY OF VDOT RESIDENT ENGINEERS ............................................... 69
APPENDIX B: LAYER DETERIORATION CURVES AND MAINTENANCE SCHEDULE
DETERMINATION PROCESS SUPPORTING THE LCCA ..................................................... 73
APPENDIX C: EXAMPLE OF MAINTENANCE SCHEDULE DETERMINATION
PROCESS: NO GTX PAVEMENT OPTION WITH AND WITHOUT PM .............................. 81
APPENDIX D: EXAMPLES OF PAVEMENT MAINTENANCE SCHEDULES WITH AND
WITHOUT PREVENTIVE MAINTENANCE ............................................................................ 83
APPENDIX E: PROPOSED SPECIAL PROVISION FOR SUBGRADE SEPARATION AND
SUBGRADE STABILIZATION GEOTEXTILES ...................................................................... 85

iv

v
ABSTRACT
The implementation of geosynthetics in road construction in the United States dates back
to the 1970s. Although the benefits of these materials are widely recognized, actual design and
construction practices are not universal. Guidelines for use are often developed locally based on
specific field experience.
Currently, the Virginia Department of Transportation (VDOT) provides specifications
(but no design guidance) for only one function of subgrade geotextile: stabilization. Pavement
layer separation is not explicitly addressed by VDOT. This study reviewed corresponding
practices at other transportation agencies, focusing on subgrade and pavement applications. In
addition, observations gathered from field testing of two known sites with geosynthetics in
Virginia were analyzed. Finally, life cycle cost analyses (LCCAs) were performed on two
common secondary road designs, each with the options of separator geotextile and preventive
maintenance, to estimate comparative costs under three different rates of subbase contamination
by fines migrating from the subgrade.
The LCCA employed actual VDOT cost data and conceptual pavement layer
deterioration curves that are based on AASHTO curves augmented by differentiated subbase
deterioration resulting from three hypothetical contamination rates. Unlike the current LCCA
used by VDOT’s Materials Division, the LCCA model developed in this study explicitly
recognizes the fact of potential subbase layer deterioration because of contamination by subgrade
fines, comporting with the widely recognized function of geotextile separator. The results
indicate that separator geotextile imparts long-run cost-effectiveness relative to pavements
without geotextile separators at contamination rates of 0.1 in per year and greater. At
contamination rates of 0.05 in per year and lower, the addition of separator geotextile is not cost-
effective, although the results vary slightly depending on the treatment of estimated pavement
design life remaining at the end of the analysis period.
The study recommends that VDOT revise its current specifications to include subgrade
separation and subgrade stabilization geosynthetics as separate and distinct pay items, and it
provides suggested specification language to effect this change. Guidelines to implement these
changes are also enumerated.

vi

FINAL REPORT
USE OF GEOSYNTHETICS FOR SEPARATION AND STABILIZATION
IN LOW-VOLUME ROADWAYS
Edward J. Hoppe, Ph.D., P.E.
Associate Principal Research Scientist
Virginia Transportation Research Council
M. Shabbir Hossain, Ph.D., P.E.
Associate Principal Research Scientist
Virginia Transportation Research Council
Audrey K. Moruza
Senior Research Scientist
Virginia Transportation Research Council
Chaz B. Weaver, P.E., CPEM
District Materials Engineer
Virginia Department of Transportation
INTRODUCTION
Geosynthetics are man-made materials designed for use in geotechnical applications with
the intent of improving engineering performance and facilitating construction. ASTM D 4439
(ASTM International [ASTM], 2018) defines geosynthetic as a “planar product manufactured
from a polymeric material used with soil, rock, earth, or other geotechnical engineering related
material as an integral part of a man-made project, structure, or system.” These materials can
serve various functions, including separation, stabilization, filtration, reinforcement, drainage,
and erosion protection. In road construction the primary applications involve subgrade
stabilization or reinforcement, separation between the subgrade and the unbound base material to
prevent intermixing of fines with aggregate bases, and filtration to allow the flow of water at the
subgrade-base interface. Recently there has been increased interest in the potential use of
geosynthetic interlayers in pavements to mitigate surface cracking.
Geosynthetic materials have been used with increased frequency in transportation
infrastructure since the1970s, but their incorporation into specifications and guidelines was
gradual. The first official mention of geotextiles in the Virginia Department of Transportation
(VDOT) pavement design method dates to 1995, when the Flexible Pavement Design Guide for
Primary and Interstate Roads in Virginia (VDOT, 1995) included the following guidance:
Geotextiles should be considered in lieu of the above [cement- and lime-stabilized subgrade and
aggregates] when the areas in question represent a relatively small amount of the subgrade soils.
This may prove to be more economical than the above alternatives in isolated cases.

2
This language was added to VDOT’s Pavement Design Guide for Subdivision and
Secondary Roads in Virginia (hereinafter “Pavement Design Guide”) (VDOT, 2000) and it
continued in nearly the same format in the latest 2018 edition (VDOT, 2018a), but with the word
“geotextile” replaced by “geosynthetic.” The current Pavement Design Guide (VDOT, 2018a)
does not identify the potential use of geotextile separators between subgrade soils and aggregate
layers and continues to reference Highway Subdrainage Design (Moulton, 1980), written at a
time when underdrains typically used a “filter layer” rather than a geosynthetic drainage fabric.
The VDOT Materials Division Manual of Instructions (MOI) includes some pavement
design guidance (VDOT, 2018b). However, the MOI does not include any specific
recommendations regarding subgrade stabilization options or separation of subgrade soils.
VDOT’s use of geosynthetics evolved over the years through field experience gained from
experimentation. Despite their proven benefits, to date no specific guidelines have been
articulated at VDOT to facilitate the systemic use of geosynthetics on road construction projects.
The creation of guidelines to incorporate a pay item into routine construction practice
implies that new incurred costs will be reasonable, but such an assumption should be tested, to
the extent possible, under current VDOT costs. This study employed actual VDOT cost data and
conceptual pavement layer deterioration curves that are based on AASHTO (American
Association of State Highway and Transportation Officials) curves augmented by differentiated
subbase deterioration resulting from three hypothetical contamination rates. Unlike the current
life cycle cost analysis (LCCA) used by VDOT’s Materials Division, the LCCA model
developed in this study explicitly recognizes the fact of potential subbase layer deterioration
because of contamination by subgrade fines, comporting with the widely recognized function of
geotextile separator.
PURPOSE AND SCOPE
The purpose of this study was to evaluate the current state of the practice regarding the
use of geosynthetics in road construction and to provide guidance in terms of long-term benefits
to VDOT regarding their use. There was no attempt to attribute structural value to geosynthetics
or to modify pavement design procedures currently employed by VDOT. The main emphasis
was the separation and stabilization functions provided by geosynthetics.
The scope of the study was limited to formulating best practices based on a literature
review; evaluating the long-term performance of two sites with geosynthetics in Virginia;
estimating the potential cost-effectiveness of separator geotextile in secondary pavements by
means of a cost model that conceptually incorporates pavement layer deterioration; and
identifying potential topics for future research. The study was focused on low-volume roads, as
they comprise the vast majority of the road network managed by VDOT.

3
METHODS
Overview
Four tasks were carried out to achieve the study objectives:
1. A literature review was conducted on the current state of the practice with regard to
the use of geosynthetics in road construction. The review focused on peer-reviewed
studies and literature sources and specifications and practice guidelines from various
state departments of transportation (DOTs) and other transportation agencies.
2. Current VDOT state of-the-practice information was gathered from VDOT
specifications and the MOI. In addition, a survey of VDOT resident engineers was
conducted to assess current practices and outcomes on low-volume roadways.
3. Two sites with geosynthetics in Virginia were analyzed using falling weight
deflectometer (FWD) equipment, field borings, and test pits. One site is in Bedford
County, at the junction of Routes 616 and 757. The other site is part of the
realignment of Route 743 in Albemarle County. The sites were constructed in 1994
and 2007, respectively. Field test results were compared with the in-service findings
from previous years.
4. An LCCA method was developed that incorporates pavement layer deterioration
detail that is absent from the LCCA method currently used by VDOT’s Materials
Division. The development of reasonable pavement deterioration curves was an
essential input to the proposed LCCA model. The benefit of geotextile separator was
quantified in terms of reduced pavement subbase deterioration over the analysis
period. As far as practicable, VDOT’s construction database was used to determine
the actual unit costs of construction and maintenance items as functions of the
quantities purchased.
Literature Review
The literature regarding geosynthetics use in pavement structures at the subgrade level
was identified by use of the resources of the VDOT Research Library and the University of
Virginia Library. Online databases searched included Transport Research International
Documentation (TRID), the Engineering Index (EI Compendix), Transport, and WorldCat,
among others. In addition to a search of the websites of the select state DOTs, pavement and/or
geotechnical engineers of several DOTs were contacted through e-mail to determine DOT
practices and the DOT’s specification with regard to geosynthetics use in pavements. The
practice guidelines were synthesized from personal communications with the DOT
pavement/geotechnical engineers, specifications, and the literature.

4
Determination of State of the Practice in Virginia
The information regarding VDOT’s current state of the practice was gathered by
consulting VDOT field engineers and examining the geosynthetics specification in Section 245
of VDOT’s Road and Bridge Specifications (VDOT, 2016). In addition, VDOT’s Pavement
Design Guide (VDOT, 2018a) and the MOI were examined.
A survey of VDOT resident engineers was also conducted to assess current practices and
outcomes for low-volume roadways. Survey questions and responses are presented in Appendix
A.
VDOT specifications and practices were compared to the specifications of other U.S.
highway agencies. Recommendations were made to amend the VDOT specifications to provide
for the effective use of geosynthetics in separation and stabilization applications.
Analysis of Test Sites With Geosynthetics in Virginia
The field performance of two VDOT test sites in which geosynthetics were used at the
interface between the unbound base and subgrade was evaluated. Two documented sections on
VDOT’s secondary road system were used for this evaluation: (1) a section in Bedford County,
and (2) a section in Albemarle County. These sites were selected because they were the only two
known and documented geotextile separator pavement sections on the VDOT network.
The experimental sections in Bedford and Albemarle counties had been in service for
approximately 24 and 10 years, respectively. The Bedford County section is near Smith
Mountain Lake, and the section in Albemarle County is in proximity to the Charlottesville-
Albemarle Airport. The construction details of the two sections were extensively documented in
research reports from Virginia Tech (Appea, 1997; Bhutta, 1998) and the Virginia Transportation
Research Council (VTRC) (Hossain and Schmidt, 2009). The field performance of these
sections was evaluated using pavement condition data, including visual (automated video
logging) distress survey and FWD deflection data. The Bedford County site was also excavated
to expose the base course aggregate to determine contamination from subgrade soil using
gradation analysis and X-ray diffraction (XRD) techniques. The exhumed geotextile was also
tested for retained tensile strength.
Bedford County Site
The Bedford County test sections were constructed by VDOT, as part of a Virginia Tech
research project, in June 1994 on Route 757, at the intersection of Route 616, and included nine
50-ft-long test strips with a base thickness of 4, 6, and 8 in. Sections with each of the three base
thicknesses included a control section (no geosynthetic), a geotextile section, and a section with
geogrid at the interface between the base and subgrade. These sections were documented and
monitored for performance for 8 years by researchers from Virginia Tech. Figure 1 shows the
layout of all nine sections.

5
Figure 1. Bedford County Geosynthetics Test Sections
The predominant subgrade soil type was reddish-brown fat clay (Unified Soil
Classification System [USCS] designation CH, AASHTO A-7-6) except for Sections 4 and 5,
where yellowish-brown silt (USCS designation ML, AASHTO A-5) was observed. The
optimum water content (OWC) and maximum dry density (MDD) for the modified Proctor test
along with other important soils properties, such as liquid limit, plasticity index, percent passing
the No. 200 sieve, specific gravity, and subgrade California bearing ratio (CBR) value, were
determined as follows:
Fat clay (CH): MDD = 100.6 pcf; OWC = 24.4%; liquid limit = 56 to 68; plasticity
index = 28-37; percent passing the No. 200 sieve = 76%; specific gravity = 2.77;
soaked CBR = 7
Silt (ML): MDD = 108.9 pcf; OWC = 17.0%; liquid limit = 41; plasticity index = 4 to
6; percent passing the No. 200 sieve = 73%; specific gravity = 2.74; soaked CBR = 7
Field compaction: water content (WC) = 29% to 36%; dry density = 78.3 to 89.1 pcf.
A local limestone aggregate satisfying VDOT 21B gradation was used as the base course
in all sections with variable thicknesses as follows: 4 in for Sections 1, 2, and 3; 6 in for Sections
4, 5, and 6; and 8 in for Sections 7, 8, and 9. Aggregate properties were OWC = 6.1%; MDD =
142.6 pcf; SG = 2.78; field dry density = 143.2 pcf; and field WC = 2% to 3.2%.

6
A polypropylene-based woven geotextile was placed on the subgrade soil in Sections 2,
5, and 8, and a biaxial geogrid was used in Sections 3, 6, and 9. Approximately 3.5 in of hot-mix
asphalt (HMA) was placed in two layers over a thin layer of chip seal with a 0.5-in-diameter
maximum stone rolled with a vibratory roller. The HMA was a VDOT SM-2A mixture, which is
a Marshall 50 blow mixture with air voids = 3% to 6%; stability = 5500 N; and flow = 2 to 4 in.
The road has an annual average daily traffic (AADT) of approximately 1,150 with 4%
trucks. The traffic count for the last 24 years was collected from a VDOT database and
converted to equivalent single-axle loads (ESALs). The load factors used for this conversion
were 0.0002, 0.46, and 1.05 for car, single unit, and tractor-trailer, respectively, and were typical
for VDOT. There was a difference between the traffic count on Route 616 and Route 757; the
approximate ESALs applied over 24 years were 62,000 and 90,000, respectively. Sections 1
through 3 were on Route 616; Sections 7 through 9 were on Route 757; and Sections 4 through 6
were at the intersection. An additional 10,000 ESALs was applied to these sections as part of the
Virginia Tech study (Al-Qadi and Appea, 2003) over a 2-week period in 1996.
The sections were located on a 4% profile grade with drainage ditches on both sides. No
drainage system was provided. Since this intersection was on a radius, the sections were
constructed with the required superelevation. During the last 24 years, the total rainfall amount
was 1,066 in, but the average annual rainfall was highly variable (coefficient of variance = 50%)
with a mean and standard deviation of 46 in and 23 in, respectively. It is important to note that
rainfall was unusually high in the first 2 years: in 1995, 129 in, and in 1996, 90 in. On the other
hand, the traffic count was very low for both of these years, i.e., below 400 AADT.
The performance of these sections was monitored by the Virginia Tech research team
over the first 8 years using distress ratings (mainly rutting), ground-penetrating radar, FWD
measurements, and other in-place instrumentation.
Albemarle County Site
The second Virginia test section is on Route 743 near the Charlottesville-Albemarle
Airport in Albemarle County, as shown in Figure 2. In August 2007, a 300-ft test section was
constructed with a geotextile at the interface between the base aggregate and subgrade on the
northbound lane of this realignment project. The southbound section, which did not contain
geotextile, served as the control. The construction of this test site was monitored and
documented by VTRC researchers.
There was some variation in the subgrade soil along the length of the pavement. In the
central portion of the test section, the subgrade soil was an elastic silt (MH) with a gradation of
91.7% passing the No. 200 sieve and liquid and plastic limits of 69% and 48%, respectively.
The Proctor MDD and OWC were 80.5 pcf and 37%, respectively. The soil had a soaked CBR
of 4.5. The subgrade soil just south of this test section was identified as sandy clay (CL) or
sandy silt (ML) with an MDD of 97 pcf and an OWC of 17%.

7
Figure 2. Albemarle County Geotextile Test Section
The base course was 8 in of aggregate satisfying VDOT 21B gradation. Another 8 in
of HMA was placed over the base aggregate in multiple layers: 6.5-in BM-25.0 and 1.5-in SM-
9.5A; both were VDOT-designated Superpave mixtures.
A 315-lb tensile strength woven polypropylene AASHTO Class 1 geotextile was placed
at the interface between the base and subgrade in the northbound lane for 300 ft as a test section,
and the corresponding southbound lane was considered a control (no geotextile) section during
the initial construction.
The traffic count on this secondary road is approximately 8,700 AADT, with 2% trucks.
The total applied ESAL count over the last 10 years was 173,000. The annual rainfall in this
area is approximately 40 in, with a total accumulation of 420 in of rain in the last 10 years. One
significant aspect of this test site is the presence of pavement edgedrain (VDOT UD-4 system)
placed along the entire paved section.

8
Development of New LCCA Method
LCCA is a method of transforming the initial and future costs of alternative paths to
accomplish a given outcome into comparable monetary terms in the present. LCCA is
particularly useful when alternatives with the same outcome have variously timed service life
costs over an extended time period. An “analysis period” denoted in years can be a proxy for
service life when alternatives are not distinguished by discrete service lives, as is true for
secondary pavements. LCCA methods are straightforward except for the treatment of “salvage
value.” A complete LCCA should be equipped with an approach for the incorporation of the
value of service life remaining at the conclusion of the analysis period for each alternative under
consideration. Two analytical approaches were evaluated here for incorporation of salvage
value.
Currently, there are no commonly accepted empirical LCCA models designed to evaluate
geotextile separators. There is a degree of consensus that the benefits of geotextiles are self-
evident even if unquantified (Christopher, 2014). For example, when soft soils are unexpectedly
encountered, the cost savings of stabilizing geosynthetics are so widely recognized that
geosynthetics are now considered by some to be the standard of practice (Christopher, 2014).
Similarly, advocates hold that separator geotextile used on a competent subgrade without an a
priori fines problem will result in maintaining long-term pavement performance.
Theoretical long-term benefits of using geotextile separators in pavement structures were
identified nearly 25 years ago. Al-Qadi et al. (1994) determined a traffic benefit ratio (TBR)
offered by pavement with geotextile relative to pavement without geotextile. The TBR consisted
of an increase of 1.7 to more than 2.5 times the design ESALs that a pavement with geotextile
could absorb before 25 mm of rutting damage was attained (Al-Qadi and Appea, 2003). Similar
results and corresponding TBR values were derived by Perkins (2001). Al-Qadi et al. (1994)
concluded that substantial improvement in pavement performance would be possible if
geosynthetics were used for pavement layer separation when the subgrade soil CBR was in the
range of 2 to 6 (Al-Qadi and Appea, 2003).
LCCA was subsequently performed for 25 hypothetical secondary pavements, with
varying traffic levels reflecting secondary roads in Virginia, that were designed in accordance
with 1993 AASHTO pavement design guidelines (Yang and Al-Qadi, 2007). This LCCA
exercise compared agency and user costs for geotextile-free AASHTO pavements with
pavements containing geotextile designed as earlier proposed separately by Al-Qadi and Perkins
for pavement stabilization and reinforcement, respectively. The results indicated that the
incorporation of geotextile for either stabilization or reinforcement purposes could save an
agency up to 40% but might also provide no savings over a geotextile-free pavement. A
significant contribution of the analysis was its approach to translation of theoretical TBR gains
into quantitative cost savings.
Although some empirical case studies reporting long-term savings resulting from the use
of separator geotextiles in unpaved roads have been published (Hawkins, 2009; Whitaker, 2014),
they are not applicable to this study even though good experimental conditions may have existed
because the monetary benefits of geotextiles for paved roads are not simple multiples of the

9
benefits for unpaved roads. However, a 2018 study from the National Center for Asphalt
Technology (NCAT) (Robbins and Tran, 2018) directly influenced the LCCA model developed
in this study. The study reported its own survey finding that most state DOTs performing LCCA
on asphalt and concrete pavements are internally inconsistent between their actual practices and
their LCCA calculations: the majority of agencies used an initial performance period of 10 to 15
years, and the average asphalt pavement age at time of first rehabilitation was approximately 18
years, according to the authors’ evaluation of Long-Term Pavement Performance (LTPP)
Program data.
The survey revealed that “[p]ractices for determining the actual timing of the first
rehabilitation for both [asphalt concrete] and [portland cement concrete] pavements are unique to
each DOT” and that “there does not appear to be a nationwide consensus among DOTs on
[International Roughness Index] values which indicate the need for first rehabilitation” (Robbins
and Tran, 2018). The survey findings supported the decision to adopt a realistic initial
performance period of 20 years in the LCCA model developed in this study for low-volume
secondary roads.
The Pennsylvania DOT (PennDOT) published an example of an economic analysis that
quantified the benefit of geotextile separation in one-third-scale pavement models under
simulated loading, finding a cost savings of at least 13% for a collector road (Petrasic, 2017).
That analysis and the analysis performed in this study used AASHTO (1993) for all pavement
designs; both analyses also assumed that geotextile provides no reinforcing function. However,
this analysis differed from the PennDOT approach in several critical aspects. First, the
PennDOT analysis contrasted the costs of geotextile with the costs of increasing subbase
thicknesses but this analysis did not address increases in pavement thickness as an alternative to
geotextile. Second, whereas the PennDOT analysis assumed geotextile prevented decreasing
subbase strength, this analysis assumed that subgrade strength remains constant while geotextile
prevents decreasing effective subbase thickness. Third, the PennDOT analysis assumed a single
rate of contamination and an initial CBR of 5 whereas this analysis set CBR to 3.3 and tested a
range of contamination rates with the lower bound at PennDOT’s assumed contamination rate.
Fourth, this analysis compared pavements with and without geotextile over a 50-year analysis
period by conventional discounting of future costs to present value whereas the PennDOT
analysis compared pavements with and without geotextile at the conclusion of a 20-year period
of service and inflated future costs by a presumed inflation rate.
The LCCA model developed in this study compared two pavement design options
corresponding to the initial AADT values of 155 and 1,500, each subject to four alternative
scenarios:
1. both separator geotextile and preventive maintenance
2. preventive maintenance but no separator geotextile
3. separator geotextile but no preventive maintenance
4. neither separator geotextile nor preventive maintenance.
Each scenario was analyzed under three different contamination rates. Thus, the entire analysis
encompassed 24 different hypothetical scenarios (2 AADT design x 4 options x 3 contamination

10
rates). Consistent with the observed VDOT practice for rural secondary roads, surface mixture
overlay on the existing road surface was considered typical activity when preventive
maintenance was not provided.
The two pavement design options are consistent with the MOI, Chapter 6 (VDOT
2018b). They were created by means of the 1993 AASHTO design method (AASHTO, 1993) in
conjunction with the values provided in Table 1. The year 2020 was used as the initial design
year (end of construction). AADT and truck % shown in Table 1 for the two pavement designs
cover the typical range of low-volume roadways. The subgrade resilient modulus value is
equivalent to a CBR value of 3.3.
An initial service life of 20 years was selected as realistic, regardless of AADT, for a
Superpave surface mixture on a secondary road, despite the ideal of an initial service life of 12
years. Separator geotextile was assumed to provide benefits consistent with the findings of the
literature review: specifically, it prevents the source of pavement deterioration caused by
aggregate contamination by subgrade fines. The LCCA model develops reasonable maintenance
activities and schedules that respond to deterioration of the four pavement design options over
the analysis period. Slower deterioration because of the presence of geotextile translates into
longer service life after initial construction and longer maintenance cycle spacing for each
subsequent maintenance activity as compared to a pavement without geotextile.
Appendix B describes the development of the pavement layer deterioration curves and
maintenance schedules. Deterioration curves developed for this LCCA model incorporate more
detail on structural deterioration, such as base mixture stripping and permeability loss because of
contaminated base aggregate layers, than do the deterioration curves that forecast network-wide
pavement surface conditions for the Pavement Management System (PMS) administered by
VDOT’s Maintenance Division. Because empirical pavement layer deterioration curves with
and without geotextiles are not currently available, idealized deterioration curves were developed
for this study under the following assumptions:
Table 1. Pavement Design Input Values for the Purposes of LCCA
Pavement Design Input
Values for Low Volume
Pavement Design
Values for Very Low
Volume Pavement Design
Annual average daily traffic (2020) 1,500a 155a
Performance period (yr) 20 20
Growth rate (%) 2.0a 2.0a
Tractor trailers (%) 5.0a 1.0a
Single unit trucks (%) 1.0a 0a
Trucks in design direction/lane (%) 50/100 50/100
ESAL factor Car 0.0002
Single unit truck 0.46
Tractor trailer 1.05
Car 0.0002
Single unit truck 0.46
Tractor trailer 1.05
Initial serviceability 4.0 4.0
Terminal serviceability 2.5 2.5
Reliability (%) 75 75
Overall standard deviation 0.49 0.49
Subgrade resilient modulus (psi) 5,000a 5,000a
LCCA = life cycle cost analysis; ESAL = equivalent single-axle load. a Values assumed for the initial pavement design; all others are in accordance with the VDOT Materials Division’s Manual of
Instructions, Chapter 6, for Farm to Market Secondary Route.
11
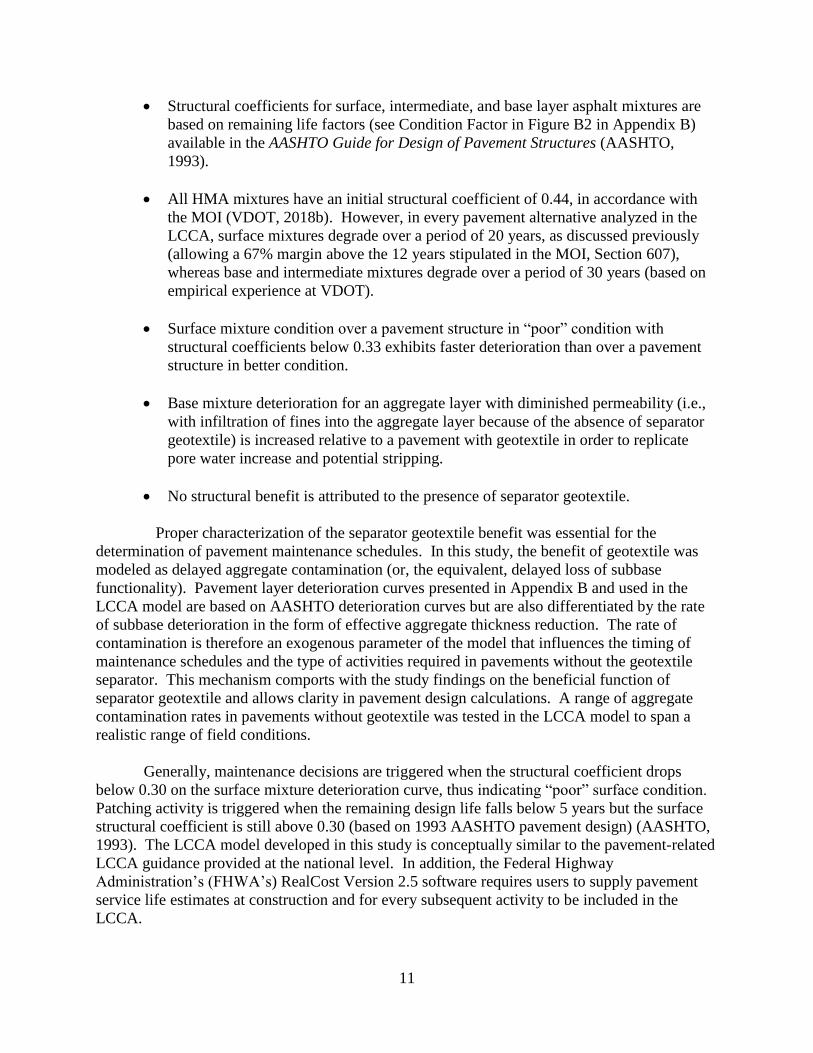
Structural coefficients for surface, intermediate, and base layer asphalt mixtures are
based on remaining life factors (see Condition Factor in Figure B2 in Appendix B)
available in the AASHTO Guide for Design of Pavement Structures (AASHTO,
1993).
All HMA mixtures have an initial structural coefficient of 0.44, in accordance with
the MOI (VDOT, 2018b). However, in every pavement alternative analyzed in the
LCCA, surface mixtures degrade over a period of 20 years, as discussed previously
(allowing a 67% margin above the 12 years stipulated in the MOI, Section 607),
whereas base and intermediate mixtures degrade over a period of 30 years (based on
empirical experience at VDOT).
Surface mixture condition over a pavement structure in “poor” condition with
structural coefficients below 0.33 exhibits faster deterioration than over a pavement
structure in better condition.
Base mixture deterioration for an aggregate layer with diminished permeability (i.e.,
with infiltration of fines into the aggregate layer because of the absence of separator
geotextile) is increased relative to a pavement with geotextile in order to replicate
pore water increase and potential stripping.
No structural benefit is attributed to the presence of separator geotextile.
Proper characterization of the separator geotextile benefit was essential for the
determination of pavement maintenance schedules. In this study, the benefit of geotextile was
modeled as delayed aggregate contamination (or, the equivalent, delayed loss of subbase
functionality). Pavement layer deterioration curves presented in Appendix B and used in the
LCCA model are based on AASHTO deterioration curves but are also differentiated by the rate
of subbase deterioration in the form of effective aggregate thickness reduction. The rate of
contamination is therefore an exogenous parameter of the model that influences the timing of
maintenance schedules and the type of activities required in pavements without the geotextile
separator. This mechanism comports with the study findings on the beneficial function of
separator geotextile and allows clarity in pavement design calculations. A range of aggregate
contamination rates in pavements without geotextile was tested in the LCCA model to span a
realistic range of field conditions.
Generally, maintenance decisions are triggered when the structural coefficient drops
below 0.30 on the surface mixture deterioration curve, thus indicating “poor” surface condition.
Patching activity is triggered when the remaining design life falls below 5 years but the surface
structural coefficient is still above 0.30 (based on 1993 AASHTO pavement design) (AASHTO,
1993). The LCCA model developed in this study is conceptually similar to the pavement-related
LCCA guidance provided at the national level. In addition, the Federal Highway
Administration’s (FHWA’s) RealCost Version 2.5 software requires users to supply pavement
service life estimates at construction and for every subsequent activity to be included in the
LCCA.

12
Appendix C provides an example of the decision process for determining the
maintenance schedule for one of the four pavement options analyzed in the LCCA. Appendix D
contains the detailed maintenance schedule of activities and costs over the 50-year analysis
period for the same pavement option, as used in the LCCA.
Final LCCA results consist of the sum of construction and maintenance costs at the end
of the analysis period discounted to their present value plus a factor that considers the varying
remaining service lives of the pavements at 50 years. Actual VDOT data were used to determine
construction and maintenance costs for each pavement design, including the pavement design
that incorporates geotextile. Because documentation of the use of geotextiles for separation is
not currently required by VDOT, identification of actual costs involved two subordinate tasks:
first, the choice of an item code for the geotextile typically used for separation purposes in
VDOT roads; and second, selection of a subset of construction projects in which the separator
GTX was used on the secondary system. When the tasks were completed, quantity-to-unit price
relationships were identified for the geotextile and for most major items in secondary pavement
construction. These costs were also used as representative for maintenance activities.
A discount rate of 4% was used as the base case, consistent with the MOI, Chapter 6
(VDOT, 2018). The life cycle cost calculation for a pavement option, assuming that interest was
compounded annually, is summarized in Equation 1.
LCC = (∑Costi
(1+d)ii=Ti=0 ) ± 𝑓 [Eq. 1]
where
i = years from project start Costi = project cost in year i T = analysis period in years
d = discount rate
𝑓 = remaining service life factor at 50 years.
Judicious accounting for the remaining service life factor is an aspect of LCCA about
which there is no clear consensus in practice. However, pavement alternatives will almost
certainly exhibit differing states of adequacy (surface asphalt condition, structural condition,
estimated remaining design life, etc.) at the end of an analysis period. To incorporate better or
worse final conditions into the present value of the cost of each alternative, some kind of
normalizing of different final states must be performed. In this study, two methods are offered in
which remaining design life is treated as either (1) an asset (salvage value) or (2) a “normalized”
liability reflecting differing final conditions.
In the first method, salvage value is calculated for each alternative pavement design as
the product of estimated remaining design life at the beginning of year 50 (prorated over 20
years) and the cost of a 20-year pavement design (constant for all alternatives) given the AADT
in year 50 and discounted to the present. Salvage value is monetized by this method and is
treated as a life cycle cost offset; i.e., the salvage value factor is subtracted from the sum of
construction and discounted maintenance costs up to year 50.

13
In the second method, the modeled condition of each existing pavement structure after 50
years is the basis for the creation of a 20-year “terminal pavement design” for each pavement.
Pavements with a low estimated remaining design life require more rehabilitation, at probably
higher total cost, to achieve a 20-year design life than pavements with a higher estimated
remaining design life at year 50. The costs of a terminal design for each pavement after year 50
are discounted in the same manner as earlier maintenance activity costs and added as another
liability, of greater or lesser magnitude depending on condition at year 50, to the sum of
discounted construction and maintenance costs through year 50.
Although the methods vary conceptually and lead to different magnitudes for life cycle
costs, the relative results are consistent between methods. Figure 3 summarizes the LCCA
process in general terms.
Last, the discount rate is sometimes assumed to be an exogenous input that can be set
near 3% with little supporting argument or repercussion even though it plays a critical role in
LCCA results. In fact, the discount rate at its simplest is a calculation of the expected nominal
interest rate less the expected inflation rate over the analysis period. Thus, to be meaningful, this
figure is tied to current and expected future economic conditions. In the simplest interpretation,
the discount rate should represent the “real” or inflation-adjusted earnings that are possible if
project funds were invested rather than spent on the project. Yet explicit price inflation over the
analysis period, at best a speculative undertaking to predict for the future, would be challenging
to forecast in detail for LCCA calculations.
To solve this issue consistently, the choice of the LCCA discount rate to be used by a
state highway agency is typically guided by FHWA recommendations. For LCCA of pavement
designs, FHWA favors a discount rate that represents a long period of time such as historical
values reported periodically in Appendix A of Circular A-94 issued by the U.S. Office of
Management and Budget (OMB) (FHWA, 1998). In 1992, the OMB revised policy by requiring
that applied discount rates be updated when the interest and inflation rate assumptions used in
preparation of the federal budget are changed (Federal Register, 2018). In other words, the
choice of a discount rate should be consistent with FHWA recommendations and therefore with
OMB guidance for cost-effectiveness analysis of federal programs in a given fiscal year, rather
than assumed to be a particular fixed value.
In November 2018, the OMB recommended an applied real discount rate of 1.5% for a
30-year analysis period (OMB, 2018), in contrast to a few years earlier when the required
discount rate for federal transportation grant applications was 7%. Reflecting stated OMB
policy, the recent figure of 1.5% represented real interest rates on 30-year treasury notes and
bonds of the maximum available specified maturities as incorporated in the federal budget for
2020. Two discount rates were used in this LCCA: 4% was used to place the rate in the range of
the existing LCCA of VDOT’s Materials Division, and 1.5% was used to comply with the OMB
recommendation. The application of a discount rate that is lower than the base case, however,
will often preserve the relative LCCA outcomes resulting from the higher rate.

14
Figure 3. Outline of Life Cycle Cost Analysis Method. Assumed constants = resilient modulus, performance period, initial annual average daily traffic
(AADT) and growth rate by scenario, equivalent single-axle load (ESAL) factors by vehicle type, initial and terminal serviceability, reliability, truck%
of AADT by scenario, drainage coefficient, and standard deviation.

15
RESULTS
Literature Review
There are four types of geosynthetics commonly used in roadway design (Equipment
World, 2014):
1. Geotextiles are either woven or nonwoven fabrics. They are used for separation,
filtration, stabilization, and reinforcement. A subset of geotextiles are paving fabrics
used between pavement layers. Woven fabrics are typically used in reinforcement
applications. Nonwoven geotextiles are used mainly for separation and filtration. In
practice, separation, filtration, and stabilization functions provide composite action,
although depending on the site conditions one is typically more dominant than the
others. The stabilization or reinforcement function of a geotextile stems from
providing lateral restraint of the base and subgrade. Geotextile allows for interface
friction forces to develop, thus reducing horizontal deformations and increasing
stability.
2. Geogrids are mesh-like materials formed by a network of tensile elements with
openings of sufficient size to allow interlock with the surrounding granular fill
materials. Geogrids are primarily used for reinforcement and confinement. They can
provide reinforcement in one direction (uniaxial), in two directions (biaxial), or in
three directions (triaxial). The performance of geogrid as reinforcement depends on
its rigidity and geometry of openings, which controls the interlock with soil and base
materials.
3. Geocomposites are a combination of two or more geosynthetic materials, such as
geotextiles with a core, used to enhance drainage, for example, as prefabricated
longitudinal edgedrains or a layer feeding into these drains.
4. Geomembranes are a single, solid sheet of geosynthetic material, used in construction
as an impermeable barrier.
In the United States, the first reported use of a cotton textile in road subgrade stabilization
was by the South Carolina Highway Department in 1926 (Beckham and Mills, 1935), but a
widespread use of synthetic textiles coincided with the developments in Europe in the 1970s.
The main objective was to prevent the intermixing of two adjacent dissimilar materials, so that
the integrity of the materials on both sides of the geotextile remained intact. Vosteen and
Wilmers described the extensive use of nonwoven geotextiles in the construction of the A-45
motorway in Germany in the mid-1970s (cited in Raymond and Giroud, 1993). Geotextiles were
used as separators on soft subgrade soils. Successful results were reported. King reported on the
use of separator geotextile in the construction of the M-11 motorway in the United Kingdom in
1978 (cited in Raymond and Giroud, 1993). The fabric was placed on a clay/silt subgrade with
low CBR values. Subsequently, data gained from this project served to develop Clause 609
specifications for the use of geotextiles as separators in the United Kingdom.

16
According to Koerner (2005), the main advantages of geosynthetics are as follows:
They are quality-control manufactured in a factory environment.
They can be installed rapidly in many cases.
They generally replace natural resources.
They generally replace different designs using soil or other construction materials.
They are generally cost competitive versus soils or other construction materials
that they replace or augment.
Their technical database (both design and testing) is reasonably established.
Geosynthetics are manufactured from polymeric materials that mainly include polyester,
polypropylene, polyethylene, polyamide, and polyvinyl alcohol (Greenwood et al., 2012). No
product is made of 100% resin. The primary resin is typically mixed with chemical additives
serving as antioxidants, thermal stabilizers, and ultraviolet light absorbers. The total amount of
each additive varies widely depending on the formulation developed by a manufacturer.
Geosynthetics in all applications should be tested for resistance to weathering. Although
geosynthetics contain carbon black to increase their ultraviolet resistance, they are considered
unsuitable for permanent exposure to sunlight. The assessment of durability of a geosynthetic is
often made with certain reduction factors applied to key properties used in design. In general,
the subject of durability of geosynthetic materials used on various construction projects has not
been reported as a critical issue to date, with most failures traced to the incorrect material
selection or faulty installation. Geosynthetics have been shown to be essentially inert materials
for most environments and applications.
The tensile strength of most geosynthetics is generally not the same in all directions, as
they behave as anisotropic materials (Shukla, 2016). In woven geotextiles, tensile strength is
governed by the weaving structure. The warp strength (machine direction) is usually greater
than the weft strength (cross-machine direction). Typically, woven geotextiles display lower
extensibility and higher strength as compared with nonwoven geotextiles. Geogrids normally
exhibit high dimensional stability, high tensile strength, and a high tensile modulus even at low
strains, which allows them to be effective in reinforcing applications. Many geosynthetics have
a viscoelastic stress-strain behavior. It is generally found that the modulus of a geosynthetic
confined in soil is likely to be higher than when tested without a confining load.
The commercial availability of geotextiles allows for economical construction on
marginal soils. Geosynthetics produced in a factory environment have specific and uniform
properties that can address challenging soil conditions. With a soft subgrade, it is often
impossible to build a stable base course without losing expensive base material into the subgrade
(Van Santvoort, 1994). Geosynthetic layers are placed during the initial construction phase,
typically at the interface between the subgrade and base course and sometimes within the base
course. Frequently, the primary objective is to allow access for heavy construction equipment
17
and to provide a stable platform to allow compaction of granular layers. Significant cost savings
can be realized in the early stages of road construction by minimizing the loss and waste of
aggregate base in the soft subgrade soil. The development of various geosynthetic materials
provided new options for constructing and enhancing performance.
There are two prevalent approaches to geosynthetic design, typically addressing either
function or specification. Design by function is based on the calculation of the required material
property with an added factor of safety (Koerner, 2016). In design by specification, several
application categories are listed in association with various physical, mechanical, hydraulic,
and/or endurance properties. The resulting material designation is determined by the intended
application. This method was originally advanced by an AASHTO task group and resulted in the
AASHTO M 288 geotextile specifications (Suits and Richardson, 1998). Government agencies
generally follow AASHTO M 288, often incorporating local modifications. Design by material
specification is based on decades of experience gained under various service conditions.
AASHTO M 288 covers six geotextile applications: subsurface drainage, separation,
stabilization, permanent erosion control, sediment control, and paving fabrics. However,
AASHTO M 288 is not a design guideline. It is the engineer's responsibility to select a
geotextile for the application that takes site-specific soil and water conditions into consideration.
AASHTO M 288 defines three classes of material strength. Class 1 designates severe or
harsh survivability conditions. Class 2 designates typical conditions and is used as a default
classification. Class 3 designates applications where there is little or no potential for
geosynthetic damage. Strength is considered the principal property required for a geosynthetic to
survive the installation and provide the required functionality.
AASHTO M 288 stipulates the use of geotextile separator for pavement sections
constructed over unsaturated subgrade soils with a CBR value greater than 3. It provides the
corresponding material and strength class properties. Of significance, AASHTO M 288 does not
set the upper CBR limit on the applicability of geotextile separators. When the subgrade soils
are saturated and CBR values range between 1 and 3, stabilization becomes the primary function.
AASHTO M 288 provides the required geotextile requirements for pavement structures
constructed in these conditions. The specification is not appropriate for embankment
reinforcement, where global stability is of concern. In addition, very soft subgrades with CBR
values below 1 are not addressed by AASHTO M 288, and geotextiles are not recommended in
such cases. AASHTO M 288 permittivity limits on separation and stabilization applications are
0.02 sec-1 and 0.05 sec-1, respectively.
AASHTO M 288 allows the use of woven slit-film geotextiles in separation and
stabilization applications but prohibits their use in subsurface drainage and erosion control.
These fabrics are produced by weaving individual flat yarns that are cut from an extruded film of
synthetic material. Their permittivity and surface friction are relatively low when compared to
those of other woven fabrics. The U.S. Bureau of Reclamation does not recommend the use of
slit-film geotextiles in embankment dams (Gobla, 2014). Unified Facilities Criteria (UFC) for
engineering use of geotextiles state that slit-film geotextiles are not preferred because their
opening sizes are unpredictable (U.S. Department of Defense, 2004). Long-term clogging is a

18
concern when these geotextiles are used for filtration. The Montana DOT (2008) is one of the
transportation agencies that explicitly prohibits their use for subgrade stabilization.
Testing of geosynthetic products used by DOTs is commonly conducted through the
National Transportation Product Evaluation Program (NTPEP) under the auspices of AASHTO
(AASHTO, 2018). In addition, the program provides on-site inspections of plants providing
products manufactured to AASHTO standards. Currently, there is an ongoing NTPEP task force
effort aimed at developing material specifications for the use of geogrids and geotextiles in
subgrade stabilization, with the possible inclusion in the future AASHTO M 288 standard.
The FHWA published a comprehensive set of design and construction guidelines for
geosynthetics by Holtz et al. (2008). The guidelines are directed to highway engineers as a
means to select and specify geotextiles and geogrids properly. Stabilization is defined as the
primary function when the subgrade CBR value is less than 3. Separation and filtration are the
primary functions for CBR values ranging between 3 and 7. Additional guidance on the use of
geosynthetics in pavement construction dealing with the geotechnical aspects of pavements is
provided in Christopher et al. (2006).
There are numerous reports indicating that geosynthetics provide a strengthening effect.
Various authors have reported a potential reduction of the design base thickness while the
original design load carrying capacity of pavements is maintained (Shukla, 2016). Rankilor
(1981) recommended that this should not be the key argument for using a geotextile separator.
In his opinion, the main economic benefit is derived from savings on the aggregate base material
that would otherwise be lost in the soft subgrade during construction.
Van Santvoort (1994) reported that the upper threshold for using geotextile should be 1
tsf undrained shear strength at the maximum water content. He referenced practical experience
from The Netherlands indicating that above 1 tsf no particles in the subgrade are loosened and
pumped into the base course.
A common argument is that the presence of a geosynthetic separator layer decreases the
potential for base contamination by fines migrating from the underlying soft soil subgrade. As a
consequence, contamination effectively leads to a reduced base layer thickness and, ultimately,
to a decreased road life (Zornberg, 2017). Al-Qadi et al. (1994) stated that in the absence of
separation, two simultaneous mechanisms tend to occur over time in pavements. Soil fines
migrate into the base course voids, resulting in a diminished drainage performance, and the base
course particles penetrate into the subgrade, compromising the pavement structure. The resulting
reduction in the effective thickness of the aggregate base was studied extensively by Jorenby and
Hicks (1986). Their laboratory study concluded that up to 6% added fines can be tolerated
without markedly affecting the base material stiffness and that the primary benefit derived from a
geotextile is the increased service life of pavement structure. Jorenby and Hicks also reported
that 8% fines was sufficient to disrupt the functioning of an aggregate drainage layer.
Koerner (2005) stated that separation is the most underrated of all geotextile functions
because although every field use involves separation, rarely is separation designed on its own
merit. When a geotextile is used as a separator, it is placed over the soft subgrade. It acts as a

19
filter to allow water but not fine particles to flow through it, preventing any mixing of the soft
soil and granular base under the action of the construction equipment and subsequent traffic.
When separation is considered the primary function in a paved road, an adequate survivability
criterion is required to ensure durability in service.
A recent laboratory study by Kermani et al. (2018) reported an approximate 30%
reduction in the amount of pavement rutting when geotextile separator is used on top of subgrade
under controlled drainage conditions. An accelerated pavement testing device (the MMLS3) was
used to simulate the cyclic traffic loading on a scaled model of a flexible pavement. The
laboratory study concluded that geotextile significantly reduces pumping of subgrade fines into
the granular subbase material. At the end of the test, the percentage of fines that migrated to the
subbase, based on the percentage mass of subbase, was 6.39% in the tests without geotextile and
1.81% in the test containing geotextile. Kermani et al. (2018) also documented how quickly the
contamination process progresses. Pennsylvania No. 2A dense-graded subbase material was
used in the study. Comparable results can be expected in Virginia as VDOT 21B dense-graded
aggregate has a similar design range of particle gradations.
The phenomenon of fine-grained subgrade infiltration caused by traffic-induced cyclic
stresses was studied extensively by Woods and Shelburne (1943) in their pioneering work on
pumping of jointed concrete pavements. Severe pumping at joints and cracks was observed
during periods of heavy rainfall. The upkeep of pumping pavements was considered a serious
challenge confronting U.S. highway engineers during the wartime period. The problem was
further compounded on roads carrying large volumes of heavy traffic, commonly associated with
military transports. Positive correlations were traced to plastic soils, primarily clays and silty
clays. The predominance of pumping was discovered in the cut sections with saturated
subgrades. The problem was largely confined to the heavily traveled concrete roads. At the
time, the recommended solutions included improvements to the subsurface drainage and the use
of properly graded aggregate to prevent clogging. Currently, this problem can be effectively
managed with the use of geosynthetics. For example, in Germany, nonwoven geotextile
separators are routinely placed under all new concrete pavements (Sarsby, 2006).
Geotextiles are used extensively in the railway industry. In most cases they operate in a
significantly harsher environment than most highway geotextiles. They are commonly installed
under the sub-ballast layer to maintain the integrity of railway sections by preventing the
pumping of subgrade fines and the resulting sub-ballast contamination. The railway industry,
recognizing the commonality of the pumping problem, consolidated the findings of Woods and
Shelburne with their historical field observations and identified pumping-susceptible soils as
shown in the plasticity chart in Figure 4 (American Railway Engineering Association, 1946).
The chart axes are plasticity index and liquid limit. Figure 4 depicts a synthesis of documented
case histories where extensive pumping of subgrade fines into the overlying granular layer has
been observed. A point on the chart represents unique plasticity characteristics of a particular
soil. It can be seen that field data are clustered parallel to the Casagrande A-line distinguishing
clays from silts.

20
Figure 4. Plasticity Chart for Pumping Soils Beneath Highway Pavements and Railways. Source: American
Railway Engineering Association, 1946.
Duong et al. (2014) further investigated the pumping phenomenon in railway
substructure. Significant migration of fine particles was observed only under near-saturated
subgrade conditions. On the contrary, under unsaturated conditions, no significant intermixing at
the interface was detected. Currently, the American Railway Engineering and Maintenance-of-
Way Association (2018) recommends the use of nonwoven geotextile separators at the subgrade
and sub-ballast interface. Applications are classified as regular, heavy, and extra heavy, with the
resulting specification defined by weight of fabric of 10 to 12 oz, 12 to 16 oz, and 16 to 20 oz,
respectively.
Black and Holtz (1999) reported on the performance of geotextile separators 5 years after
construction. Excavations were made in the test section of a state highway in Bucoda,
Washington, on a site with a documented history of poor pavement performance. Prior to
placement of the geotextile fabrics, subgrade undercuts of 18 and 24 in were performed on the
northbound and southbound lanes, respectively. The base course was compacted with a smooth
drum non-vibratory roller. The design base thickness was 12 in in the northbound lane and 18 in
in the southbound lane. The asphalt concrete pavement thickness was 6 in. Although some
subgrade fines had migrated through the geotextiles into the bottom of the base course, there was
no evidence of any adverse effect on the pavement performance after 5 years of service. The
researchers concluded that the long-term function of geotextile separators may not be as critical
in many cases because of the increased subgrade strength and reduced compressibility because of
consolidation. Of significance, they observed that subgrade sections beneath geotextiles became
more consolidated than areas without the geotextile. It appears that separation and drainage
functions of geotextiles have significantly more impact on pavement performance in the early

21
stages of pavement life because of consolidation and subsequent strength gain of subgrade soils.
All geosynthetics performed adequately as separators.
In an effort to quantify further the contribution of geotextile separators to the long-term
performance of pavements, the Bucoda test site was investigated at 12 years following
construction (Collins and Holtz, 2005). Extensive field and laboratory tests were conducted on
the subgrade, granular base, and geotextiles. The results of FWD tests revealed that the most
significant increase in the subgrade moduli occurred only in the first few months following
construction. Some of the grain size distribution test results indicated that the fines content in
the base course immediately above the geotextile increased by up to 5%, as compared with the
gradation at higher elevations, but in the opinion of Collins and Holtz (2005), this relatively
small percentage was negligible and would not be detrimental to pavement performance. The
authors concluded that geotextiles may not have provided any significant contribution to the
long-term performance of the pavement section over the 12-year period. This outcome was
likely influenced by the depth of placement (18 to 24 in of subgrade undercut).
Barksdale et al. (1989) studied the potential benefits of geosynthetics in flexible
pavements. Both woven and nonwoven geotextiles were found to perform the separation
function adequately, although thick nonwovens performed better than wovens. Long-term
durability was identified as being of primary importance in separation and filtration applications.
Separation problems are usually most pronounced during construction of the first lift of the
granular layer, when the vertical stress applied to the subgrade is greatest. Large, angular, open-
graded aggregates placed directly on a soft subgrade are most critical. Typically, the total
thickness of the intermixed zone is up to 2 times the diameter of the aggregate material that
overlies the subgrade. The tendency for aggregate penetration greatly increases as the subgrade
water content increases above the optimum value. For a separation problem to develop, the
applied stress level must approach the ultimate bearing capacity of the subgrade, as calculated
with Equation 2:
qult = 5.2 c [Eq. 2]
where
qult = subgrade ultimate bearing capacity
c = subgrade undrained shear strength.
The problem is further complicated by local yielding of soil at lower initial stresses.
Barksdale et al. (1989) recommended that a minimum safety factor of 1.5 to 2.0 be applied to
Equation 2 when no geotextile is used. At one test site where geosynthetics were not used, the
intermixing of subgrade and aggregate base was detected, with the calculated safety factor
ranging between 0.8 and 1.4. The use of separator geotextile to prevent contamination of the
granular layer is recommended in cases where the safety factor is less than 1.4. The practical
implication of these findings is that size, gradation, angularity of particles, subgrade strength,
and the applied stress level are the most significant parameters to consider in selecting a
separator geotextile. In general, subgrades under relatively thin pavement sections, typically
22
associated with low-volume roads, are more prone to experience pumping conditions than
subgrades under heavy structural pavements.
Metcalfe et al. (1995) evaluated the long-term separation and drainage performance of 22
geotextiles. The study focused on various mechanisms adversely affecting geotextile operation,
such as blocking (blinding) on the lower surface and lodging in (clogging) pore openings by fine
particles. In addition, the term “caking” is used to describe the blockage of pore openings,
including chemical precipitation, on the upper surface of geotextile. The authors reported that
some woven slit-film fabrics had significant blinding because of fines migration. Overall, field
observations and laboratory test results indicated that needle-punched nonwovens exhibit the
best long-term drainage performance, probably because of their three-dimensional structure.
Saathoff (1988) evaluated the long-term filtration performance of geotextiles used in
coastal, railway, and highway applications. The geotextiles consisted of 52 nonwoven and 29
woven fabrics that had been in service between 1 and 14 years. The nonwoven geotextiles were
found to have significantly better filtration performance as compared to the woven fabrics.
The use of nonwoven separator geotextile is recommended for permeable pavements at
airports (Bruinsma et al., 2017). Geotextile fabrics are specified to prevent the migration of fines
from the subgrade and contamination of the base layer. An apparent opening size equivalent to
the No. 70 sieve is required for the fabric.
The Virginia Department of Environmental Quality (2013) stormwater design
specifications for permeable pavement include measures to protect the bottom of the reservoir
level from intrusion by the underlying soils. One of the recommended methods to prevent soil
contamination is to use filter fabric separator. The fabric should have an apparent opening size
equivalent to the No. 70 or No. 80 sieve.
Bearden and Labuz (1998) presented results of large scale direct shear tests on soil-
fabric-aggregate systems. Lightweight silt-film woven, heavyweight woven, and heavyweight
nonwoven materials were tested. Test results indicated that nonwoven geotextiles generally had
interface friction angles approximately 20% higher than those of woven fabrics.
Mechanistically, when placed at the top of subgrade in a paved road, the principal
operating mode of a geosynthetic is the lateral confinement effect as opposed to the tension
membrane effect that is commonly associated with unpaved roads with substantial rutting.
Lateral displacement of base aggregate particles, resulting from repetitive traffic loading,
degrades the mechanical properties of base material (Zornberg, 2017). Such displacement is of
particular significance in the lower portion of the base layer, where tensile stresses are prone to
develop. It may be argued that the effective lateral confinement provided by geosynthetics can
reduce aggregate particle degradation or breakage, thus maintaining the performance of the
pavement section over the entire life cycle. The key factor in mobilizing lateral confinement is
interface friction. Nonwoven geotextiles are particularly well suited for this task.
Marginal subgrade can be stabilized chemically, typically using cement, lime, or asphalt
emulsion. The alternative approach is to excavate unsuitable soils and replace them with a

23
competent material. Sometimes, local groundwater conditions may adversely affect the
properties of the backfill material. The procedures of the Nebraska Department of Roads (2012)
stipulate that if high water table conditions exist at the project site, a geotextile is needed to
prevent the soft subgrade material from migrating into the granular layer. Another option
involves the use of open-graded aggregate wrapped with a geotextile to serve as a drainage
blanket below the pavement section. This concept can be implemented in various ways. For
example, the Australian specifications call for blending aggregate sizes of 20, 14, and 10 mm in
diameter with coarse, washed sand (Autostrads Ltd., 2012). This free-draining material can also
be cement stabilized to improve its strength when wet.
Kroening et al. (2017a, 2017b) conducted an extensive study for the Arizona DOT to
develop geosynthetic specifications and application guidelines. The study included a
comprehensive survey of DOTs. Of the 32 responding DOTs, 12 (including VDOT) reported
that they seldom use geotextile fabrics together with geogrids for separation. The most common
combined use of geotextiles and geogrids was for stabilization of soft subgrade soils. The
authors proposed that a 35% fines content, instead of 50%, should be used as a breakpoint
between coarse-grained and fine-grained subgrades. If the subgrade is classified as coarse
grained, the use of separation or stabilization fabric is not necessary. The authors indicated that
currently there is no consensus among the states on the use of AASHTO M 288. Their
recommendations included updating the Arizona DOT geotextile specifications in accordance
with AASHTO M 288, adding a specification for stabilization geotextile, and updating the
Arizona DOT geogrid specifications. Specifically, the authors recommended the removal of the
geotextile thickness because this requirement is already defined by the strength and durability
criteria in AASHTO M 288. A permittivity requirement compatible with Arizona soils was
proposed. The study concluded that although some research suggested that a pavement structure
with geogrid and geotextile will last longer and perform better over time, adequate information is
not currently available to quantify these benefits.
The Minnesota DOT performed extensive field studies on the use of geosynthetics on
county roads in the early 1990s (L. Tasa, personal communication). The research, spanning
more than 10 years, was initiated after several counties reported measurable gains from the use
of fabrics and geogrids. These benefits were identified primarily as the reduction of soft spots
caused by contractors’ equipment and a significantly stronger roadbed during paving operations.
Field observations also included a reduction in the transverse cracking of pavements. The
practice of using geogrids and geotextiles for stabilization and separation has been in effect to
date and the prevalent positive feedback from the counties indicates that the benefits are tangible.
Currently, local projects have been given approval to recognize geosynthetic strength in
pavement design, allowing for the reduction in base thickness.
The Minnesota DOT lists geotextile properties in terms of tensile strength and water
conductivity (Skok et al., 2003). Geogrid materials are specified by tensile strength, junction
strength, flexural stiffness, and torsional stiffness. Special considerations include ductility and
brittleness. Samples of the proposed geogrid must be submitted for approval. Minnesota DOT
Specification 3733 does not distinguish between subgrade separation and stabilization
(Minnesota DOT, 2005). The same geotextile type (AASHTO Class 1) is specified for a
combined use in both applications and listed as a separator geotextile.

24
The Missouri Highways and Transportation Commission (2018) also combines
separation and stabilization functions under the separation label. Specification 1011 for
geotextiles calls for AASHTO Class 1 material with the minimum permittivity of 1.0 sec-1.
The New York State DOT (NYSDOT) developed comprehensive guidelines for
geosynthetic design in their Geotechnical Design Manual (NYSDOT, 2018a). Generally,
NYSDOT follows the guidelines by Holtz et al. (2008) published by FHWA. Design
requirements for various applications are presented, including the separation and stabilization
functions under pavement structures. The manual is explicit in stating that it is not the practice
of NYSDOT to consider the reinforcing effect of the geotextile in pavement design. Geotextile,
if used, is assumed to act purely as a separator. Specifications for geosynthetics, according to
field applications, are compiled in Section 737 of the NYSDOT Standard Specifications.
Geosynthetics considered suitable for specific applications are placed on the list of approved
products (NYSDOT, 2018b).
The Colorado DOT (2005) geosynthetic specifications stipulate that all materials must
conform to the requirements of AASHTO M 288. NYSDOT-approved products are referenced
as a listing of materials that meet the requirements. Separation and stabilization functions are
combined.
The Washington State DOT (WSDOT) design manual addresses separation and
stabilization functions in roadway construction (WSDOT, 2016). Woven and nonwoven
geotextiles are permitted. In general, separator geotextile is specified when the subgrade
resilient modulus values range between 5,800 and 15,000 psi. These values correspond to the
CBR range of approximately 3 to 10 (Heukelom and Klomp, 1962). WSDOT follows the
requirements of AASHTO M 288, Class 2, for separators. Separator geotextile should be used
only on subgrades that can be prepared and compacted as required in the WSDOT Standard
Specifications. There is no need to use separators in dense and granular soils. When the
removal of subgrade soils and replacement with a granular material is required, no separation
fabric is applicable because it defeats the purpose of the geotextile separator. In this case, soil
stabilization geotextile is considered. The stabilization geotextile is placed directly on the soft
subgrade, even if some excavation is required. Backfill material used to replace the over-
excavated subgrade should not be placed below the geotextile. The need for stabilization
geotextile usually arises when the subgrade resilient modulus is less than 5,800 psi or clayey
subgrade is likely to be present. The fabric may also be required if the subgrade is not
anticipated to be saturated based on the available data but may become saturated during
construction. Soil stabilization geotextile should not be used under roadway fills greater than 5 ft
high or on extremely soft subgrades. A site-specific reinforcement design is required in such
cases. WSDOT follows the requirements of AASHTO M 288, Class 1, for stabilization
geotextiles.
The Oregon DOT (2011) Pavement Design Guide refers to Specification 00350,
applicable for all geosynthetics used in construction. The geotextile and the level of certification
must be included in the pavement design recommendations. Typically, nonwoven geotextiles are
used on subgrades with an increased potential for contamination, such as in areas with a high
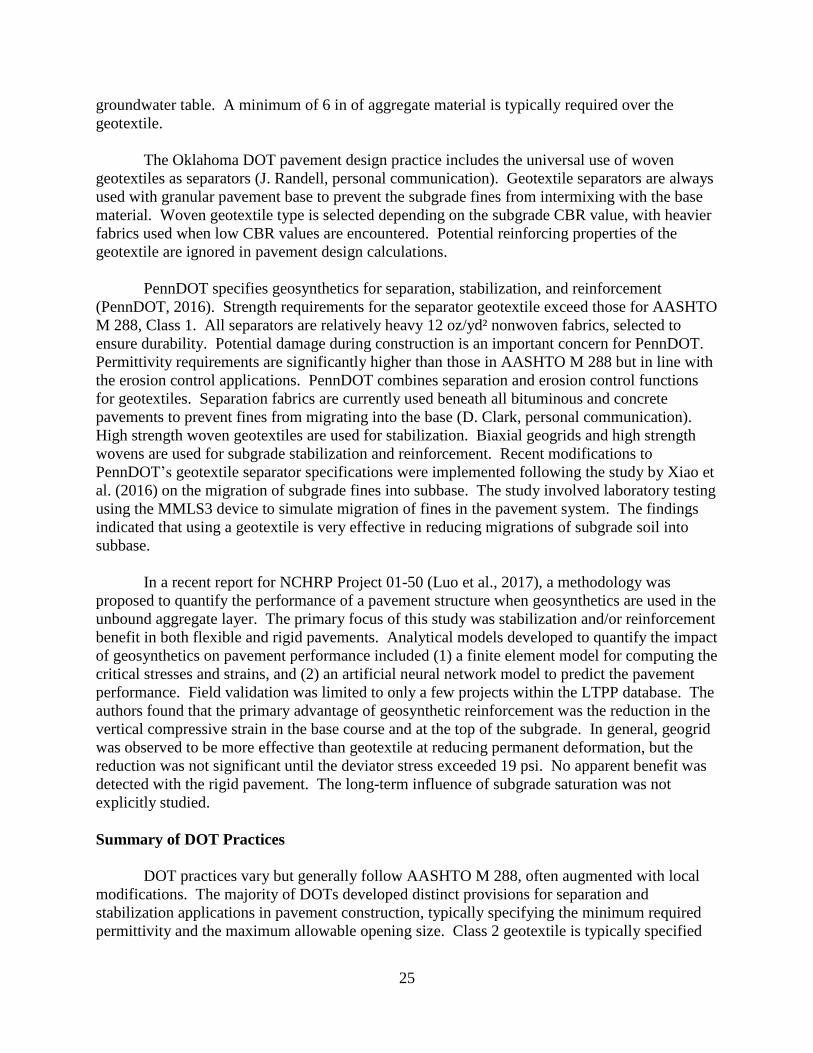
25
groundwater table. A minimum of 6 in of aggregate material is typically required over the
geotextile.
The Oklahoma DOT pavement design practice includes the universal use of woven
geotextiles as separators (J. Randell, personal communication). Geotextile separators are always
used with granular pavement base to prevent the subgrade fines from intermixing with the base
material. Woven geotextile type is selected depending on the subgrade CBR value, with heavier
fabrics used when low CBR values are encountered. Potential reinforcing properties of the
geotextile are ignored in pavement design calculations.
PennDOT specifies geosynthetics for separation, stabilization, and reinforcement
(PennDOT, 2016). Strength requirements for the separator geotextile exceed those for AASHTO
M 288, Class 1. All separators are relatively heavy 12 oz/yd² nonwoven fabrics, selected to
ensure durability. Potential damage during construction is an important concern for PennDOT.
Permittivity requirements are significantly higher than those in AASHTO M 288 but in line with
the erosion control applications. PennDOT combines separation and erosion control functions
for geotextiles. Separation fabrics are currently used beneath all bituminous and concrete
pavements to prevent fines from migrating into the base (D. Clark, personal communication).
High strength woven geotextiles are used for stabilization. Biaxial geogrids and high strength
wovens are used for subgrade stabilization and reinforcement. Recent modifications to
PennDOT’s geotextile separator specifications were implemented following the study by Xiao et
al. (2016) on the migration of subgrade fines into subbase. The study involved laboratory testing
using the MMLS3 device to simulate migration of fines in the pavement system. The findings
indicated that using a geotextile is very effective in reducing migrations of subgrade soil into
subbase.
In a recent report for NCHRP Project 01-50 (Luo et al., 2017), a methodology was
proposed to quantify the performance of a pavement structure when geosynthetics are used in the
unbound aggregate layer. The primary focus of this study was stabilization and/or reinforcement
benefit in both flexible and rigid pavements. Analytical models developed to quantify the impact
of geosynthetics on pavement performance included (1) a finite element model for computing the
critical stresses and strains, and (2) an artificial neural network model to predict the pavement
performance. Field validation was limited to only a few projects within the LTPP database. The
authors found that the primary advantage of geosynthetic reinforcement was the reduction in the
vertical compressive strain in the base course and at the top of the subgrade. In general, geogrid
was observed to be more effective than geotextile at reducing permanent deformation, but the
reduction was not significant until the deviator stress exceeded 19 psi. No apparent benefit was
detected with the rigid pavement. The long-term influence of subgrade saturation was not
explicitly studied.
Summary of DOT Practices
DOT practices vary but generally follow AASHTO M 288, often augmented with local
modifications. The majority of DOTs developed distinct provisions for separation and
stabilization applications in pavement construction, typically specifying the minimum required
permittivity and the maximum allowable opening size. Class 2 geotextile is typically specified
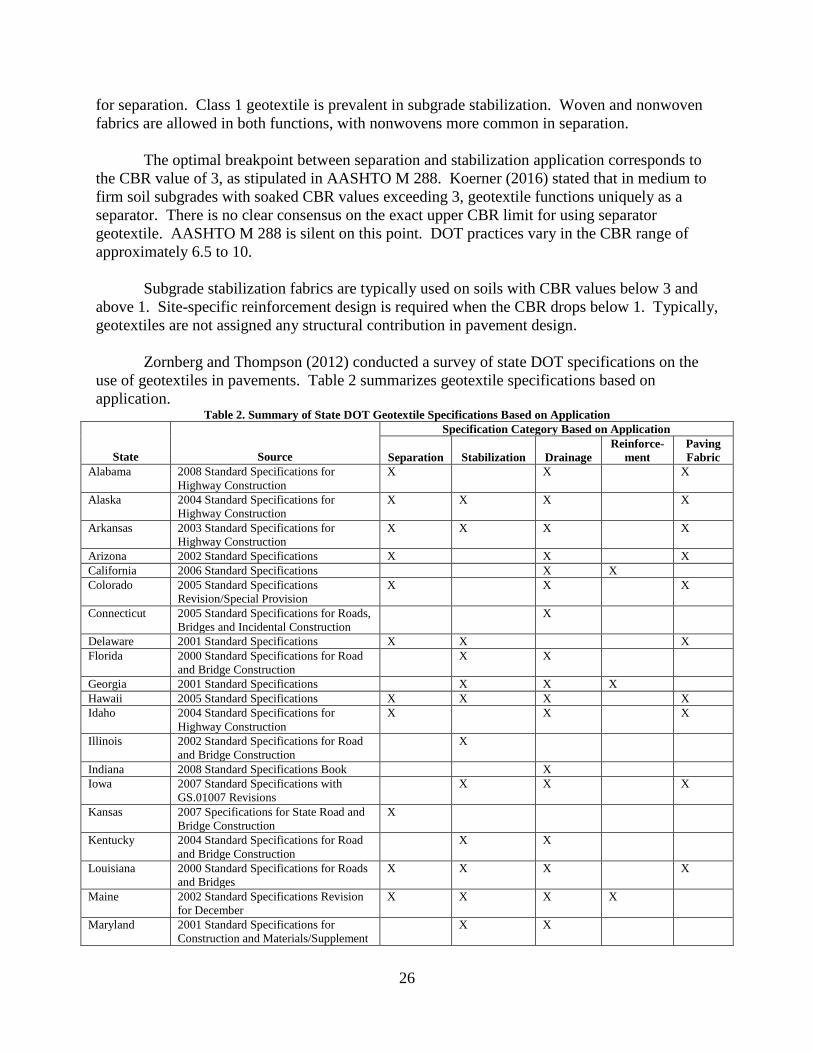
26
for separation. Class 1 geotextile is prevalent in subgrade stabilization. Woven and nonwoven
fabrics are allowed in both functions, with nonwovens more common in separation.
The optimal breakpoint between separation and stabilization application corresponds to
the CBR value of 3, as stipulated in AASHTO M 288. Koerner (2016) stated that in medium to
firm soil subgrades with soaked CBR values exceeding 3, geotextile functions uniquely as a
separator. There is no clear consensus on the exact upper CBR limit for using separator
geotextile. AASHTO M 288 is silent on this point. DOT practices vary in the CBR range of
approximately 6.5 to 10.
Subgrade stabilization fabrics are typically used on soils with CBR values below 3 and
above 1. Site-specific reinforcement design is required when the CBR drops below 1. Typically,
geotextiles are not assigned any structural contribution in pavement design.
Zornberg and Thompson (2012) conducted a survey of state DOT specifications on the
use of geotextiles in pavements. Table 2 summarizes geotextile specifications based on
application. Table 2. Summary of State DOT Geotextile Specifications Based on Application
State
Source
Specification Category Based on Application
Separation
Stabilization
Drainage
Reinforce-
ment
Paving
Fabric
Alabama 2008 Standard Specifications for
Highway Construction
X X X
Alaska 2004 Standard Specifications for
Highway Construction
X X X X
Arkansas 2003 Standard Specifications for
Highway Construction
X X X X
Arizona 2002 Standard Specifications X X X
California 2006 Standard Specifications X X
Colorado 2005 Standard Specifications
Revision/Special Provision
X X X
Connecticut 2005 Standard Specifications for Roads,
Bridges and Incidental Construction
X
Delaware 2001 Standard Specifications X X X
Florida 2000 Standard Specifications for Road
and Bridge Construction
X X
Georgia 2001 Standard Specifications X X X
Hawaii 2005 Standard Specifications X X X X
Idaho 2004 Standard Specifications for
Highway Construction
X X X
Illinois 2002 Standard Specifications for Road
and Bridge Construction
X
Indiana 2008 Standard Specifications Book X
Iowa 2007 Standard Specifications with
GS.01007 Revisions
X X X
Kansas 2007 Specifications for State Road and
Bridge Construction
X
Kentucky 2004 Standard Specifications for Road
and Bridge Construction
X X
Louisiana 2000 Standard Specifications for Roads
and Bridges
X X X X
Maine 2002 Standard Specifications Revision
for December
X X X X
Maryland 2001 Standard Specifications for
Construction and Materials/Supplement
X X

27
Massachusetts 2007 Standard Special Provisions &
1997 Standard Specs
X X X
Michigan 2003 Standard Specifications for
Construction
X X X
Mississippi 2004 Standard Specs for State Aid Road
and Bridge Construction
X X X X X
Minnesota 2005 Standard Specifications for
Construction
X X X
Missouri 2004 Specifications Book for Highway
Construction
X X X X
Montana 2006 Standard Specs for Road and
Bridge Construction/Supplement
X X X
Nevada 2007 Standard Specifications for Road
and Bridge Construction
X
New
Hampshire
2006 Standard Specifications for Road
and Bridge Construction
X X X
New Jersey 2007 Standard Specifications for Road
and Bridge Construction
X X
New Mexico 2007 Standard Specs for Highway and
Bridge Construction/Supplement
X X X
New York 2006 Standard Specifications X
North Carolina 2002 Standard Specifications X X
North Dakota 2002 Standard Specifications for Road
and Bridge Construction
X X X
Ohio 2008 Construction and Material
Specifications
X X X
Oklahoma 1999 Standard Specifications for
Highway Construction
X X X
Oregon 2008 Standard Specifications/2002
Supplement to Standard Specs
X X X X
Pennsylvania 2000 Standard Specifications for
Highway and Bridge Construction
X X X X
Rhode Island 2007 Standard Specifications for Road
and Bridge Construction
X
South Carolina 2007 Standard Specifications for
Highway Construction/Supplement
X
South Dakota 2004 Standard Specifications for Roads
& Bridges
X X
Tennessee 2004 Standard Specifications for Road
and Bridge Construction
X X
Texas 2004 Standard Specification for
Construction and Maintenance of
Highway
X
Utah 2008 Standard Specifications / 2005
Supplement
X X X
Vermont 2006 Standard Specifications for
Construction Book
X X X
Virginia 2007 Road and Bridge Specifications X X X
Washington 2008 Standard Specifications for Road,
Bridge, and Municipal Construction
X X
Wisconsin 2008 Standard Specifications for
Highway and Structure Construction
X X X
West Virginia 2000 Standard Specifications for Roads
and Bridges
X X X
Wyoming 2003 Standard Specifications for Road
and Bridge Construction
X X X
Total 31 30 42 10 17
Source: Zornberg and Thompson, 2012.

28
The specifications for different geotextile applications indicated that the use for
separation is well established. Further, 31 states had specifications for separation, 30 for
stabilization, and 19 for both.
The accompanying survey indicated that more than one-half of the respondents used
AASHTO M 288 in design. Geotextile selection requirements from various states were
summarized. The survey indicated that the majority of DOTs require AASHTO M 288, Class 2,
geotextile for separation.
At least two states currently use geotextile separators under all pavement types. The
Oklahoma DOT installs separator geotextile under most roadways on the conviction that once
fines have contaminated the aggregate, the drainage function of the aggregate is permanently
compromised (J. Randell, personal communication). In addition, PennDOT is in the process of
implementing separator geotextiles under all pavements (B. Miller, personal communication).
State of the Practice in Virginia
VDOT operates the third largest road network in the United States and is responsible for
maintaining approximately 128,000 lane-miles of interstate, primary, and secondary roads
(VDOT, 2018c). VDOT’s goal, as established by the Commonwealth Transportation Board, is
to have a minimum of 82% of interstate and primary pavements and 65% of secondary
pavements rated as excellent, good, or fair. In 2018, almost 90% of the interstate system was
rated as sufficient, exceeding the statewide performance target of 82%. Approximately 84.7% of
the primary system was rated as sufficient. Statewide, only 60.3% of the secondary road system
had pavement conditions rated as sufficient, effectively not meeting the performance target of
65%. Secondary and subdivision roads comprise approximately 79% of VDOT’s entire road
network. Traditionally, these roads receive comparatively little construction supervision and
service inspection.
Consistent with the practices adopted by other state DOTs, VDOT does not recognize any
structural contribution of geotextiles in pavement design. Current design methodologies include
the MEPDG method for roads carrying traffic volumes in excess of 10,000 vehicles per day
(high-volume roads) and the Vaswani method for secondary and subdivision roads (VDOT,
2018a). Both design approaches suffer from the general lack of recognition of the potential
adverse effect of base aggregate contamination.
The current version of the Vaswani method, as incorporated in VDOT’s Pavement
Design Guide (VDOT, 2018a), contains only two references to geosynthetics. It identifies
geosynthetics as a possible means of mechanical subgrade stabilization to produce a stable
platform for construction equipment. It also states that geosynthetics should be considered for
subgrade stabilization in isolated and limited cases. The guide stipulates that the pavement
section design should be based on the original subgrade soil CBR value, even if some
undercutting and backfilling with dense-graded material is performed to provide a stable
construction platform. The only exception to this rule is if the entire roadway subgrade is
undercut and backfilled to a minimum depth of 2 ft.

29
Some of the documented examples of significant base layer contamination on the VDOT
network include sections of I-81 in Augusta County, as shown in Figure 5. The left photograph
shows subgrade fines on the top surface of the 12-in-thick aggregate base layer. Subgrade soil is
highly plastic clay (CH). The pavement section consisted of approximately 12 in of dense-
graded aggregate and 12 in of asphalt mixture. Poor subsurface drainage led to subgrade
saturation that contributed to this pavement failure.
The right photograph in Figure 5 shows discoloration of the aggregate layer, discovered
during a sinkhole emergency repair spanning the right lane and the shoulder of I-81 in Augusta
County. The degree of contamination was highest near the wheel paths. These examples
indicate that base layer contamination can occur even in a very thick pavement section.
Figure 5. Examples of Base Layer Contamination on I-81 in Augusta County
Survey of VDOT Resident Engineers
A survey was sent to 29 VDOT resident engineers/administrators currently serving in
VDOT’s nine construction districts. Fifteen responses were returned, representing all districts
except Lynchburg and Fredericksburg. The response details are provided in Appendix A, and
the results are summarized as follows.
Approximately 71% of respondents stated that in their experience, subdivision streets that
are accepted into VDOT’s secondary road network fail to reach their 20-year design life. Nearly
43% attributed this failure either to incorrect pavement design factors or to construction quality;
another 7% attributed it partly to those factors but added that the most common cause of failure
was the inaccurate forecast of traffic loading. Two-thirds of respondents stated that subdivision
streets that are accepted by VDOT into the secondary system do not have the same level of
quality as VDOT secondary road projects. Primary causes cited for this perceived deficiency
prominently included inadequate field inspection and oversight. Several respondents specifically
cited unsuitable subgrade being overlooked as the leading factor. Some respondents expressed

30
the opinion that current pavement design requirements for land development / subdivision roads
are inadequate.
The highest cost maintenance activities performed on subdivision streets included asphalt
milling and resurfacing; asphalt overlays; deep culvert and drainage infrastructure replacement;
sidewalk reconstruction; repair of pavement settlements; and mechanized pothole patching and
filling. Typical percentages of maintenance budgets designated for asphalt paving were reported
to range from 1% to 40%. Subdivision streets that had exceeded their design life were most
commonly milled/scarified and overlaid, occasionally with base repair as needed; full
reconstruction was described as rare when mentioned at all.
Of respondents, 60% stated that the majority of subdivision streets in their residency did
not include any form of subsurface drainage system, and 93% stated that contamination of the
aggregate layer by subgrade soil was “sometimes” a contributing cause of pavement degradation
(0 respondents checked “never”). Approximately 73% of respondents stated that they were not
aware of any use of geotextiles in their residency.
Figure 6 summarizes the responses to two questions related to subdivision streets.
Figure 6. VDOT Resident Engineer/Administrator Responses to Survey Questions on Subdivision Roads
VDOT’s Geosynthetic Specifications
Currently, VDOT does not provide any design guidance for using geotextile separators in
road construction. The only specification relevant to pavement structures applies to the
stabilization geotextile, per Section 245 of the Road and Bridge Specifications (VDOT, 2016). It
is typically placed between the undercut subgrade and the replacement granular material. The
stabilization geotextile is also used in a drainage blanket below the pavement section, as a
wrapping fabric around the open-graded aggregate, typically consisting of VDOT No. 2 or No. 3
stone.
71.4%21.4%
7.1%
No Yes Usually yes
In general, is it your experience that
subdivision streets that are accepted
into VDOT's secondary system reach
their 20-year design life?
66.7%
33.3%
No Yes
In your opinion, are subdivision streets
that are accepted into VDOT’s secondary
system of the same level of quality
(i.e. as durable) as VDOT secondary
roadway projects?

31
VDOT subgrade stabilization geotextile is specified to meet the requirements of
AASHTO M 288, Class 3, and the maximum area opening size (AOS) corresponding to the No.
20 sieve (0.850 mm). Presently, no minimum permittivity requirement is specified and any
geotextile type is allowed. As a result, the AOS requirement is satisfied by virtually every
geotextile currently listed in the Industrial Fabrics Association International (IFAI) Specifier’s
Guide (IFAI, 2018). VDOT’s Materials Division compiles a list (Approved List No. 63) of
approved geosynthetic products (VDOT, 2018d). Current VDOT specifications do not stipulate
any installation requirements for geosynthetics. All geosynthetic materials used on the VDOT
road network are required to be NTPEP tested.
VDOT’s Resilient Modulus Database
VDOT’s Materials Division has been collecting laboratory test results on Virginia soils as
part of the resilient modulus testing program set up to facilitate the implementation of the
MEPDG pavement design methodology. In addition to resilient modulus results, various other
tests were performed to characterize and classify these soils. VDOT’s database contains
comprehensive results of 648 laboratory tests performed on 402 subgrade soils, including
gradation, plasticity, water content, and CBR values.
Figure 7 shows the plasticity chart of a subset of Virginia soils containing more than 35%
fines, with CBR values in the range of 3 to 8.
Figure 7. Plasticity Chart for Virginia Soils With 3 < CBR < 8 and More Than 35% Fines. CBR = California
bearing ratio.

32
The bubble size of each test result shown in Figure 7 is proportional to the magnitude of
the CBR value. Most of the high-value CBR soils plot below the liquid limit of approximately
30. It can be seen that Virginia soils containing in excess of 35% fine particles and having CBR
values ranging between 3 and 8 essentially mirror the characteristic pattern of pumping-
susceptible soils identified in Figure 4. Data shown in Figure 7 are representative of
approximately 41% of all soils tested by VDOT. These soils are cohesive according to the
AASHTO soil classification system, as the threshold between the fine-grained and coarse-
grained soils is 35% of particles passing the No. 200 sieve.
Performance of Sites With Geosynthetics in Virginia
VDOT constructed two experimental sections, one in Bedford Country and one in
Albemarle County to assess the structural benefits of using geosynthetics in a paved secondary
road. They have been in service for approximately 24 and 10 years, respectively.
Past Performance
The Bedford County site is well documented. It was evaluated by researchers from
Virginia Tech (Al-Qadi and Appea, 2003, Appea, 1997; Bhutta, 1998; Brandon et al., 1996).
Thirty months into the study, Appea (1997) found a significant difference in the rutting
performance between the control and geotextile sections where the base aggregate layer was 4 in
thick. After analyzing the FWD data, Appea hypothesized that the fouling of the aggregate layer
with the underlying subgrade soil was the main reason for the difference in rutting performance
and that the presence of the geotextile separator layer contributed to the reduction of rutting by
up to approximately 50%. For the subsequent 8 years, the pavement condition was assessed (Al-
Qadi and Appea, 2003) using FWD testing, and the contribution of the geotextile was confirmed
using rutting measurements and apparent subgrade modulus values from the FWD back-
calculation. In addition, three sections with a 4-in base course were excavated to verify
aggregate contamination after 3 years of service; the geotextile section showed the least amount
of contamination (Bhutta, 1998). This section had less rutting than the unreinforced section in
2001 when the base aggregate thickness was 4 in; much of the rutting occurred in the first 3
years. The sections with thicker base courses did not show any significant difference in
performance among the control, geotextile, and geogrid sections.
The Albemarle County site was constructed on a section of Virginia Route 743 near the
Charlottesville-Albemarle Airport. Geotextile was placed at the interface between the aggregate
base and the subgrade in one lane of the section to prevent failure attributable to intermixing, and
the adjacent lane was left unmodified as a control. Statistical analysis of data gathered by an
FWD during construction and after 8 months of traffic showed the lane with the geotextile
section to have a slightly higher structural capacity. As severe intermixing and base failure in
the control section were not expected during the 8-month period because of the low volume of
traffic and a dry season, the benefit may have been attributable to a reinforcing effect because of
construction traffic.
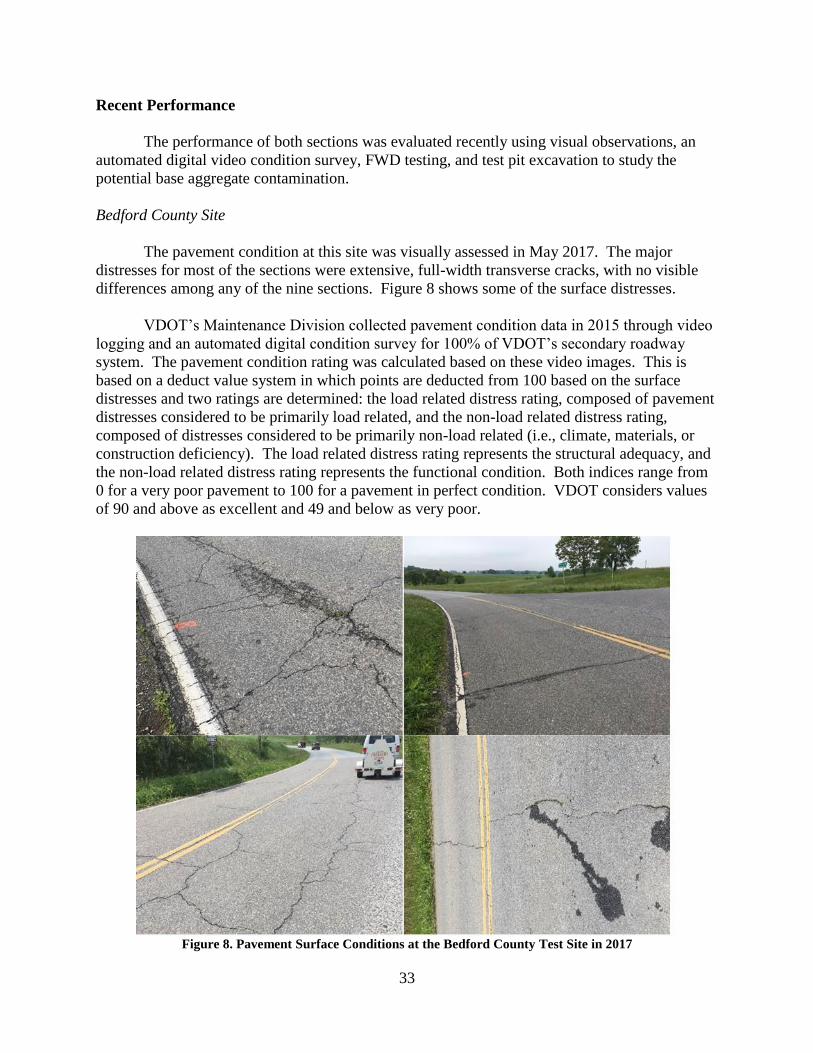
33
Recent Performance
The performance of both sections was evaluated recently using visual observations, an
automated digital video condition survey, FWD testing, and test pit excavation to study the
potential base aggregate contamination.
Bedford County Site
The pavement condition at this site was visually assessed in May 2017. The major
distresses for most of the sections were extensive, full-width transverse cracks, with no visible
differences among any of the nine sections. Figure 8 shows some of the surface distresses.
VDOT’s Maintenance Division collected pavement condition data in 2015 through video
logging and an automated digital condition survey for 100% of VDOT’s secondary roadway
system. The pavement condition rating was calculated based on these video images. This is
based on a deduct value system in which points are deducted from 100 based on the surface
distresses and two ratings are determined: the load related distress rating, composed of pavement
distresses considered to be primarily load related, and the non-load related distress rating,
composed of distresses considered to be primarily non-load related (i.e., climate, materials, or
construction deficiency). The load related distress rating represents the structural adequacy, and
the non-load related distress rating represents the functional condition. Both indices range from
0 for a very poor pavement to 100 for a pavement in perfect condition. VDOT considers values
of 90 and above as excellent and 49 and below as very poor.
Figure 8. Pavement Surface Conditions at the Bedford County Test Site in 2017

34
The pavement condition ratings for each of the nine sections were extracted from the
database and are presented in Figure 9; only the northbound ratings were available. Although
both geotextile and geogrid sections were structurally in better condition (above 90 except for
Section 5) than the control sections for all three base thicknesses, ratings for the controls were
around 80 or better, which is considered adequate. On the other hand, the functional condition
was poor to very poor for all of them, approximately 50 or below, except for Section 9, which
was located on the higher elevation. In contrast with earlier observations (Al-Qadi and Appea,
2003), there was very little rutting (<5 mm) observed in any of the sections during the 2015
survey. It is important to note that these sections were overlaid with HMA at least once in the
last 24 years, estimated to be around 2005 (no detailed maintenance records were kept). A drill
core from each section was collected for thickness measurements. Pavement thicknesses
throughout each section were verified using ground-penetrating radar.
Figure 10 shows the HMA thicknesses for all sections along with the original (Bhutta,
1998) constructed thicknesses in 1994; approximately 2 in of additional overlay on the
northbound lane, tapering to 1 in of overlay on the southbound lane, were placed since the
original construction. As opposed to the significant rutting observed in the first few years
(Appea, 1997), no appreciable rutting was observed with the 2015 rating; the additional overlay
thicknesses and the less severe rain events since 1997 may have contributed to this outcome.
Figure 9. Pavement Condition Rating in 2015 for Bedford County Sections

35
Figure 10. Asphalt Layer Thickness for Nine Bedford County Sections. NB = northbound; SB = southbound.
The structural capacity of these sections was evaluated using the FWD, which is a
standard device for testing the response (deflection) of pavement layers under dynamic load. A
series of velocity transducers (geophones) record the peak surface deflections of the pavement
structure in response to a pulse load supplied by a falling mass and transferred to the pavement
by a steel load plate with a radius of 5.91 in. Four standard load levels (6, 9, 12, and 16 kips)
were used to apply the dynamic load, and deflections were measured at 0, 8, 12, 18, 24, 36, 48,
60, and 72 in from the center of the load plate. FWD deflection data were collected at five points
per section per lane: three at the right wheel path and two at the center. Since there were many
transverse cracks on such short sections, a full basin deflection analysis was not performed. The
simplest comparison would use surface modulus, which is calculated as load over deflection and
is independent of layer thicknesses. Instead of surface modulus, the deflection right below the
load (D0 deflection) was used since the variation in load was not high enough to influence the
modulus value. The average deflections corresponding to 9,000 lb were calculated and
compared statistically (using the t-test); the results are presented in Table 3. Since the overlay
thicknesses in the northbound and southbound lanes were different, they were compared
separately.
In general, the geotextile sections showed lower average deflections than the control
sections (no geosynthetics) under a 9,000-lb load, but there was no statistical difference between
them. Although a lower deflection indicates a stronger structure, the numerical difference is only
about 1 mil or less in most cases except for two southbound thicker-base sections. The
performance of the geogrid sections was inconclusive: Section 9 was very strong and Section 6
was the weakest. During coring, the subgrade soil in Section 9 was found to be dry and stronger
than that of all other sections. It was also at the highest grade elevation.
Historical FWD deflections under the 9,000-lb load immediately after construction in
October 1994 were compiled from the Virginia Tech report by Appea (1997) and plotted along
with the 2017 data in Figure 11 for comparison. The northbound deflection data followed a
trend similar to that observed at initial construction.

36
Table 3. FWD D0-Deflection Data Under a 9,000-Lb Load for Bedford County Site
Base Aggregate
FWD Data: D0 Deflection for 9 Kips Load (mils)
Northbound Southbound
4-in Base Aggregate
Section 1 2 3 1 2 3
Geosynthetics None Geotextile Geogrid None Geotextile Geogrid
Average 13.6 12.8 15.4 31.1 30.0 28.4
Standard deviation 1.99 2.43 1.52 3.30 3.95 3.71
Statistical
significance at 5%
1 vs. 2: No 1 vs. 2: No
2 vs. 3: Yes 2 vs. 3: No
1 vs. 3: No (7%) 1 vs. 3: No
6-in Base Aggregate
Section 4 5 6 4 5 6
Geosynthetics None Geotextile Geogrid None Geotextile Geogrid
Average 28.3 27.7 30.0 31.5 28.2 39.3
Standard deviation 7.00 3.84 3.46 5.65 5.45 5.83
Statistical
significance at 5%
4 vs. 5: No 4 vs. 5: No
5 vs. 6: No (6%) 5 vs. 6: Yes
4 vs. 6: No 4 vs. 6: Yes
8-in Base Aggregate
Section 7 8 9 7 8 9
Geosynthetics None Geotextile Geogrid None Geotextile Geogrid
Average 25.7 24.7 15.6 32.3 27.3 18.3
Standard deviation 3.76 4.70 0.50 7.37 5.04 1.95
Statistical
significance at 5%
7 vs. 8: No 7 vs. 8: No
8 vs. 9: Yes 8 vs. 9: Yes
7 vs. 9: Yes 7 vs. 9: Yes
Figure 11. FWD Deflection (Do) Under a 9,000-lb Load for Bedford County Sections. FWD = falling weight
deflectometer.

37
Some of the sections were excavated to determine if there was base aggregate
contamination with subgrade soil. The bound asphalt layers were saw cut and then carefully
removed in 5 ft × 5 ft sections. Unbound base aggregate samples were collected with hand
digging tools in 2-in increments and then analyzed at the VTRC laboratory for grain size
distribution. In general, all base aggregate gradations, irrespective of depth and location
(Sections 1 through 9), were similar and were mostly within VDOT base aggregate specification
limits, as shown in Figure 12. All aggregate materials had a much higher percentage passing the
No. 200 or No. 100 sieve with respect to the as-constructed gradation, but these same differences
were observed in the 1997 excavation (Bhutta, 1998). Thus, no clear evidence of contamination
was discovered, as the results were similar for all nine sections and occurred during the first 3
years, as documented in previous reports (Appea, 1997; Bhutta, 1998).
Figure 12. Excavated Base Aggregate Gradation: top, Sections 1-3 with 4 in of base aggregate; bottom,
sections with 6 in and 8 in of base aggregate

38
The base samples close to the subgrade layer were observed to have a distinctive clay
stain during wet sieve analysis. With the exception of Section 1, none of the nine sections
showed the presence of any appreciable red clay stain. The Section 1 sample showed a slight red
stain in the wash water. The samples from Sections 1, 2, and 3 were further analyzed using a
hydrometer for grain size distribution of materials passing the No. 200 sieve. The clay-size
particle contents were approximately 4% for Section 1 and 3% for Sections 2 and 3. With the
possible exception of Section 1, these grain size analyses indicated that no significant base
contamination had occurred. Some representative samples were also analyzed using XRD to
detect the presence of underlying clay in the granular base layer.
Fines passing the No. 40 and No. 200 sieves were analyzed for mineral composition
using an Olympus BTX XRD. Diffraction patterns were analyzed using XPowder, Version
2010.01.26 software with the American Mineralogist Crystal Structure Database to identify the
minerals present. Base materials were washed over the No. 40 and No. 200 sieves, and wash
water was dried to prepare the samples. Samples were crushed to ensure that all materials passed
the No. 100 sieve as required by the diffractometer. Samples of subgrade from Section 2 and
Section 5 were analyzed and exhibited similar patterns in which kaolinite and quartz were
identified. Diffraction patterns for the base material showed its basic mineral content to be
calcite, dolomite, and quartz. In the base material analyzed from Sections 2, 3, 4, and 5, calcite,
dolomite, and quartz were the only minerals identified except for the Section 4 sample in which a
trace amount of montmorillonite was identified. In Section 1 base material samples, kaolinite
was identified in addition to calcite, dolomite, and quartz; this observation is consistent with the
red stain observed during the wet sieve analysis mentioned previously and confirms the presence
of some contamination in Section 1.
The exhumed geotextiles were tested for retained tensile strength and permittivity at the
George Mason University geotechnical laboratory (Ullah et al., 2019). Geotextiles exhumed
from below the 4-, 6-, and 8-in-thick base courses retained 68%, 64%, and 60% of their tensile
strengths, respectively. The strains at ultimate tensile strength values showed that there was not a
significant reduction as compared to the strains reported by the manufacturer. The results
indicated that no significant polymer aging took place over the 24 years in service. The
difference in the permittivity values of the original material and cleaned geotextiles showed a
reduction of approximately 60% in the test section with a 4-in base course and 72% in sections
with a 6- and 8-in base course. These permittivity reductions are attributed to the geotextiles
being compressed under the prolonged surcharge pressure, resulting in the decreased pore
openings.
Albemarle County Site
The pavement condition at this site was visually assessed in October 2016 and March
2018. Although the 2016 observation did not reveal any distresses, there were some cracks in
both the northbound and southbound lanes in 2018, as shown in Figure 13.
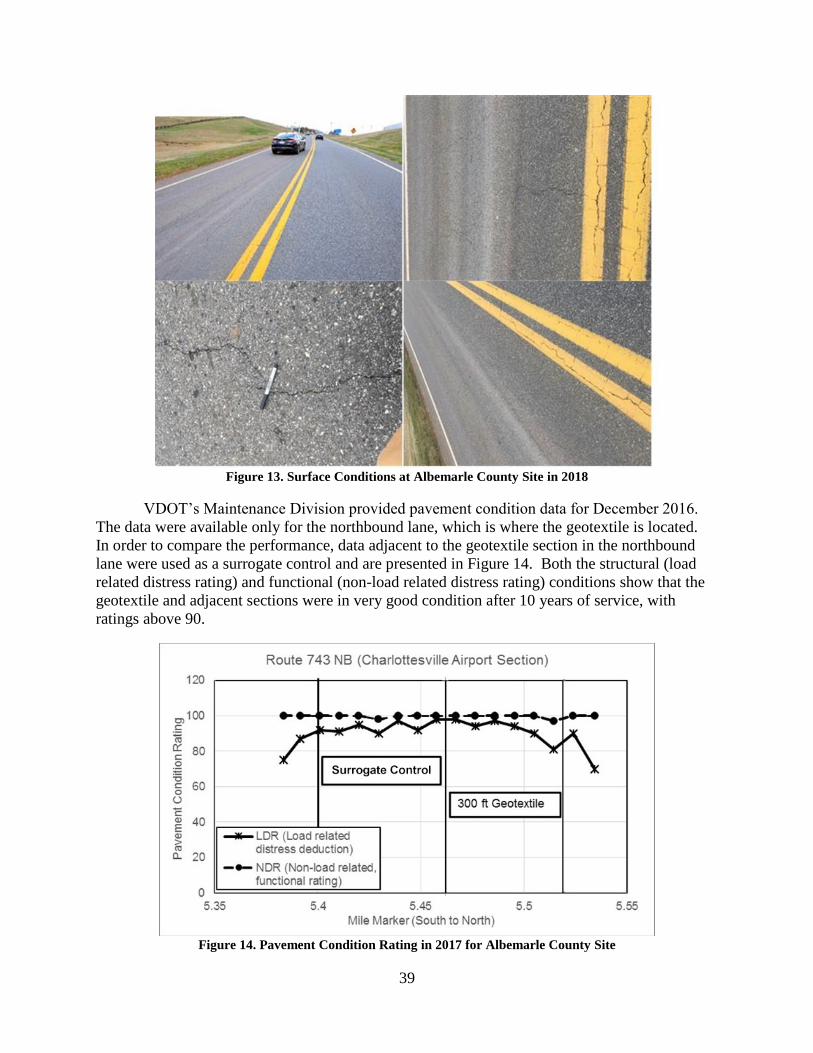
39
Figure 13. Surface Conditions at Albemarle County Site in 2018
VDOT’s Maintenance Division provided pavement condition data for December 2016.
The data were available only for the northbound lane, which is where the geotextile is located.
In order to compare the performance, data adjacent to the geotextile section in the northbound
lane were used as a surrogate control and are presented in Figure 14. Both the structural (load
related distress rating) and functional (non-load related distress rating) conditions show that the
geotextile and adjacent sections were in very good condition after 10 years of service, with
ratings above 90.
Figure 14. Pavement Condition Rating in 2017 for Albemarle County Site

40
FWD testing, similar to that conducted for the Bedford County sections, was performed
at 30-ft intervals. The resulting data were analyzed with VDOT’s FWD analysis program
MODTAG. To compare the two sections at each test point, the effective structural number and
the effective subgrade resilient modulus of the pavement were computed based on deflections
recorded under a 9,000-lb load. The apparent subgrade resilient modulus for each point was
computed from the deflection readings of the outer sensors so that only the influence of the
subgrade was measured. The effective structural number was computed based on the effective
resilient modulus and center sensor deflection. The deflection (Do-deflection) directly under a
9,000-lb load, effective structural number, and subgrade resilient modulus are shown in Figure
15. There were no statistical differences (at the 5% level of significance) between the
northbound and southbound measurements. One very low deflection recorded toward the middle
of the lane was due to the presence of a drainage structure.
Figure 15. FWD Defection Under 9-kip Load and Back-calculated Effective Structural Number (SNeff) and
Subgrade Modulus (MR) for Albemarle County Site. FWD = falling weight deflectometer.

41
Summary of Findings From Field Investigations
Neither Virginia test site provided a conclusive resolution of the long-term efficacy of
geotextile separators. It should be recognized that neither site was explicitly designed to
evaluate separation. They were used in this study because no adequate long-term records could
be compiled for any other roadway geosynthetic installations on the VDOT network.
Although no visual difference in surface condition was observed between the
geosynthetic and control sections for the Bedford County site after 24 years of service, the actual
distress ratings indicated that all nine sections were in good structural condition (this is expected
given that no contamination was detected), but their functional condition was uniformly very
poor, as shown in Figure 9. All the sections were overlaid with approximately 1 to 2 in of
asphalt around 2005. Both the geotextile and geogrid sections for all base thicknesses exhibited
better structural conditions than their respective control sections, implying that geosynthetics
(geotextiles and geogrids) provided some stabilization benefit or preserved the structural
condition.
The deflections recorded with the FWD equipment at the Bedford County site were lower
for the geotextile section than for the control or geogrid sections for all three base thicknesses,
implying better performance, but the differences were not statistically significant at the 5% level,
as shown in Table 3. The comparative geogrid section performance was inconclusive.
Overall, the Bedford County test site with its relatively high subgrade CBR values did not
provide conclusive proof of the performance benefit attributable to the separation function. The
gradation analyses of base aggregates from the Bedford County sections did not indicate a
significant difference in grain size distribution among any of the nine sections, irrespective of
depth. In addition, there was no evidence of contamination of base aggregate with subgrade clay
except for Section 1, where a trace of red clay was observed in the wash water and in the XRD
analysis. This was likely due to the 4% longitudinal profile grade of the roadway, coupled with
the superelevation, essentially keeping the pavement subbase and subgrade soil relatively well
drained.
There was no measurable difference in performance between the control and geotextile
sections at the Albemarle County (Charlottesville-Albemarle Airport) site after 10 years of
service. One possible reason for this outcome was the very thick pavement structure at this site.
Another is that the edgedrain, constructed along the entire test section, effectively prevented
subgrade saturation, reducing the likelihood of subbase contamination.
Life Cycle Cost Analysis
The LCCA methodology developed in this study combines empirical cost data with a
quantitative pavement deterioration model to measure the cost-effectiveness per mile of
pavements with separator geotextile over a 50-year analysis period. VDOT cost information was
gathered from the SiteManager construction database for the period 2008-2018. Based on
VDOT contract data, an empirical relation between bid quantity and unit bid price was

42
developed for major items so that unit prices would vary with project size, corresponding to
actual VDOT costs. These methods produced price-quantity formulae for separator geotextile;
surface, intermediate, and base asphalt mixtures; aggregate; planing; and guardrail. Quantitative
benefits of separator geotextile were shown through slowed deterioration of aggregate by
subgrade fines relative to pavements without geotextile between the subgrade and subbase, as
discussed in the “Methods” section. The cost data required for the LCCA, the benefits of
separator geotextile, and the results of the LCCA model are discussed in this section.
Costs
The unit cost of greatest uncertainty was that of geotextile used for pavement layer
separation in a roadway. Currently, VDOT does not require that placement of geotextile
separator on subgrade be tracked with a unique item code. Typically, three item codes are used
to track geotextiles purchased by VDOT: 00355 (Geotextile—Subgrade Stabilization), 27500
(Geotextile Fabric), and 00154 (NS Geotextile). At least one additional nonstandard item code is
also used to identify geosynthetic products, including geogrid materials.
Overall, VDOT construction records indicated that item codes 00355 and 27500 were
commonly used for most geosynthetic fabrics and that both codes can denote geotextile
separation function in roadways. The nonstandard item code 00154 is used most often for
geogrid but also for a number of other geosynthetic products: filter cloth, drainage fabric, paving
fabric, nonwoven geotextile fabric, impervious geofabric, membrane, impervious liner, subgrade
stabilization, and high-strength geosynthetic reinforcement. It was also observed that some of
the detailed descriptions of products purchased under (NS) item code 00154 appeared to fit
satisfactorily into either of the standard item codes of 00355 or 27500.
For the purposes of selecting an item code representative of a geotextile used for roadway
separation purposes, it was determined that a geotextile subject to Specification 305 and suitable
for subgrade and shoulders (item code 00355) would be preferred over one subject to
Specification 303 and suitable for earthwork (item code 27500). For this reason, item code
00355 was selected for tracking cost data representative of geotextile used for a separation
function.
Within item code 00355, it was expected that a unit cost estimate for item code 00355
geotextile used in a pavement LCCA would be improved if roadway projects were separated
from other transportation projects. VDOT’s SiteManager database employs a taxonomy for
project type in item code reports, which proved valuable in this regard. The item code report
showed that item code 00355 was used for 21 types of projects over the period 2008-2018,
including 5 types related to asphalt-surfaced roads. These project types were Grade/Drain/Pave,
New Roadway, Pavement Repair, Paving/Asphalt, and Widen Roadway. These 5 project types
were selected to the exclusion of other project types for further unit price analysis of the item
code 00355 geotextile.
Figure 16 shows the total annual quantities of item code 00355 geotextile bid and
installed for these 5 project types combined, as well as annual inflation-adjusted weighted
average unit prices, for the decade 2008-2018.

43
Figure 16. Item Code 00355 (Geotextile—Subgrade Stabilization) in Roadway Projects, 2008-2018 (2018
projects are in progress; quantities are installed, not final). Bid prices are inflation-adjusted weighted
averages of project bid prices. SY = square yard.
It was observed that installed quantities of item code 00355 geotextile typically exceeded
bid quantities over the period shown. Figure 17 shows the total bid and installed quantities of
item code 00355 geotextiles, grouped by each of the five roadway-related project categories for
the decade 2008-2018. It is evident that Grade/Drain/Pave and Widen Roadway project types
dominated bid and installed quantities of item code 00355 geotextiles and for the decade as a
whole in every project type that the quantity of geotextile installed exceeded the quantity that
was bid. Because of their dominance, these categories were developed further in Figures 18 and
19.
Figure 17. Item Code 00355 (Geotextile—Subgrade Stabilization) in Roadway Projects by Project Type, 2008-
2018. Bid prices are inflation-adjusted weighted averages of project bid prices. SY = square yard.
$-
$0.50
$1.00
$1.50
$2.00
$2.50
$3.00
$3.50
-
50
100
150
200
250
300
350
400
2008 2009 2010 2011 2012 2013 2014 2015 2016 2017 2018
BID
$ /
SY
QU
AN
TITY
BID
OR
INST
ALL
ED (1
000
SY)
00355 INSTALLED (SY) 00355 BID (SY) BID PRICE ($/SY)
$-
$0.50
$1.00
$1.50
$2.00
$2.50
$3.00
0
200
400
600
800
1000
1200
1400
BID
$ /
SY
QU
AN
TITY
BID
OR
INST
ALL
ED (1
000
SY )
00355 INSTALLED (SY) 00355 BID (SY) BID PRICE ($/SY)

44
Figure 18. Grade/Drain/Pave Project Types, 2008-2018. Bid prices are inflation-adjusted weighted averages
of project bid prices. SY = square yard.
Figure 19. Widen Roadway Project Types, 2008-2018. Bid prices are inflation-adjusted weighted averages of
project bid prices. SY = square yard.
$-
$0.50
$1.00
$1.50
$2.00
$2.50
$3.00
$3.50
$4.00
-
50
100
150
200
250
300
2008 2009 2010 2011 2012 2013 2014 2015 2016 2017 2018
BID
($/
SY)
QU
AN
TITY
BID
OR
INST
ALL
ED (1
000
SY)
00355 INSTALLED (SY) 00355 BID (SY) BID PRICE ($/SY)
$-
$0.50
$1.00
$1.50
$2.00
$2.50
$3.00
$3.50
$4.00
-
50
100
150
200
250
2008 2009 2010 2011 2012 2013 2014 2015 2016 2017 2018
BID
($/S
Y)
QU
AN
TITY
BID
OR
INST
ALL
ED (1
00
0 S
Y)
00355 INSTALLED (SY) 00355 BID (SY) BID PRICE ($/SY)
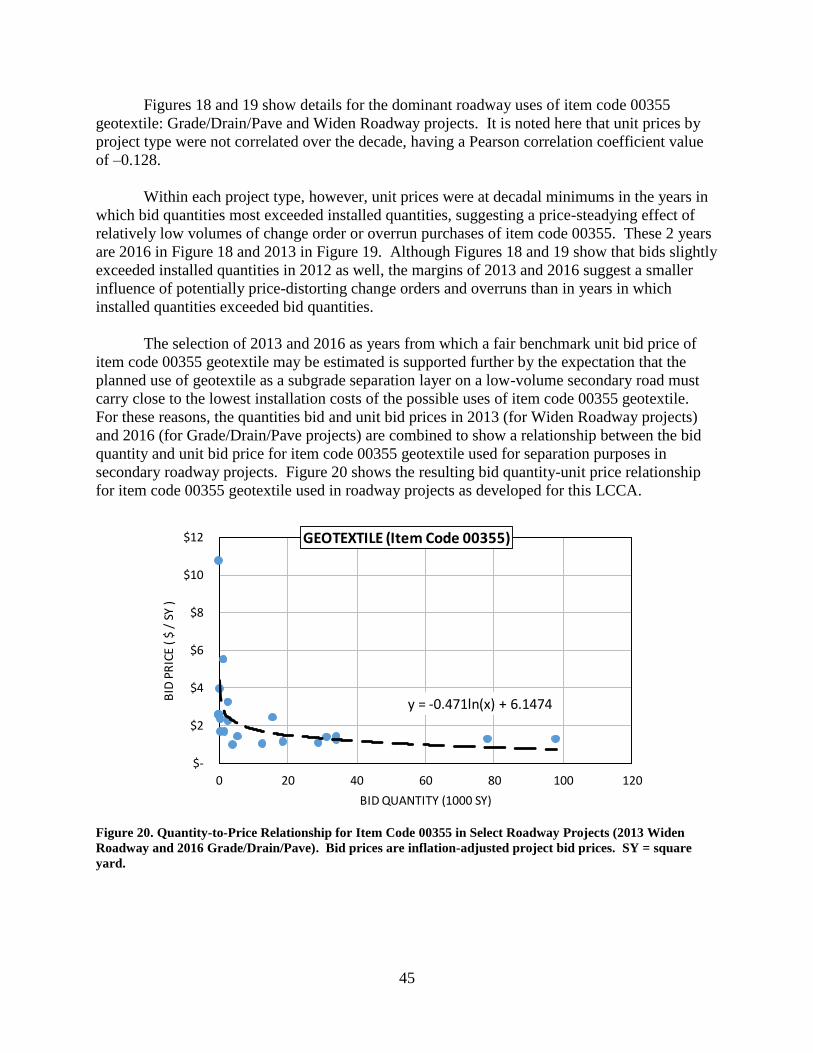
45
Figures 18 and 19 show details for the dominant roadway uses of item code 00355
geotextile: Grade/Drain/Pave and Widen Roadway projects. It is noted here that unit prices by
project type were not correlated over the decade, having a Pearson correlation coefficient value
of –0.128.
Within each project type, however, unit prices were at decadal minimums in the years in
which bid quantities most exceeded installed quantities, suggesting a price-steadying effect of
relatively low volumes of change order or overrun purchases of item code 00355. These 2 years
are 2016 in Figure 18 and 2013 in Figure 19. Although Figures 18 and 19 show that bids slightly
exceeded installed quantities in 2012 as well, the margins of 2013 and 2016 suggest a smaller
influence of potentially price-distorting change orders and overruns than in years in which
installed quantities exceeded bid quantities.
The selection of 2013 and 2016 as years from which a fair benchmark unit bid price of
item code 00355 geotextile may be estimated is supported further by the expectation that the
planned use of geotextile as a subgrade separation layer on a low-volume secondary road must
carry close to the lowest installation costs of the possible uses of item code 00355 geotextile.
For these reasons, the quantities bid and unit bid prices in 2013 (for Widen Roadway projects)
and 2016 (for Grade/Drain/Pave projects) are combined to show a relationship between the bid
quantity and unit bid price for item code 00355 geotextile used for separation purposes in
secondary roadway projects. Figure 20 shows the resulting bid quantity-unit price relationship
for item code 00355 geotextile used in roadway projects as developed for this LCCA.
Figure 20. Quantity-to-Price Relationship for Item Code 00355 in Select Roadway Projects (2013 Widen
Roadway and 2016 Grade/Drain/Pave). Bid prices are inflation-adjusted project bid prices. SY = square
yard.
y = -0.471ln(x) + 6.1474
$-
$2
$4
$6
$8
$10
$12
0 20 40 60 80 100 120
BID
PR
ICE
( $ /
SY
)
BID QUANTITY (1000 SY)
GEOTEXTILE (Item Code 00355)

46
Equation 3, expressing the logarithmic trendline of the data shown in Figure 20,
represents the VDOT bid quantity-bid price relationship for item code 00355 geotextile used in
all subsequent cost analyses.
Inflation adjusted unit bid price for item 00355 = −0.471 × ln(Bid quantity) + 6.1474 [Eq. 3]
Bid quantity-to-unit price relationships for other major construction items in secondary
pavements were also estimated from the SiteManager database, as shown in Figure 21. The
methodology used to identify quantity-price curves for the other major items consisted of four
steps: (1) include only projects in which the item was bid in the original contract; (2) include
only contracts categorized in the item code report as one of the five roadway types plus the type
“Surface (Overlay & Treatment)” if applicable; (3) include only contracts executed in the 2008-
2018 period; (4) eliminate high-price “outlier” bids from the data sets if the coefficient of
variation (standard deviation divided by mean) for the item’s unit price data can be reduced to an
arbitrary threshold of 33% when they are excluded, a threshold causing the elimination of only a
few outliers for most construction items. Planing 0-2” was not subject to this rule because of the
number of data points that would have had to be excluded to reach the threshold coefficient of
variation. Planing 0-2” was therefore separated into three functions depending on bid quantity in
square yards as shown in Figure 21(f), (g), and (h). In addition, the secondary road system was
specified in SiteManager reports for bid prices and bid quantities on aggregate, base material,
intermediate layer, planing, and guardrail. Except for guardrail, which spanned seven item
codes, the quantity-price relationships employed one to three item codes for each item.
The resulting bid quantity-to-unit price scatterplots for all items except planing were
coherent enough to use simple logarithmic trendlines as functional quantity-price relationships.
In the case of planing, price extremes appeared to be the norm at low quantities and thus were
not eliminated.
Benefits
The LCCA framework developed in this study is based on practical assumptions and
actual cost data, leading by logical steps to estimate the cost-effectiveness of geotextile separator
per mile of pavement. The key assumption allowing quantification of results is drawn from the
literature, i.e., that the primary benefit of separator geotextile is the prevention of contamination
of the unbound aggregate layer. Thus, in the resulting LCCA calculations, pavements without
geotextile deteriorate because of the loss of effective subbase thickness whereas pavements with
geotextile do not deteriorate from this cause. Through the application of a pavement
deterioration model that enables a pavement layer rating as shown in Appendix B, the selection
and timing of maintenance activities performed on the pavements with and without geotextile
were determined. The panel of LCCA results include pavement designs and maintenance
schedules for (1) two initial AADT levels; (2) the presence or absence of geotextile separator
between pavement subgrade and subbase; (3) the performance or nonperformance of preventive
maintenance, (4) three contamination rates of aggregate base by subgrade fines; and (5) two
discount rates consisting of a rate commonly assumed in VDOT LCCA and a rate dictated by
current OMB guidance.

47
Figure 21. Bid Price-Quantity Relationships for Major Construction Items in LCCA. All bid prices are adjusted for inflation. LCCA = life cycle cost
analysis; LF = linear foot; SY = square yard.
y = -7.202ln(x) + 143.37
$-
$100
$200
$300
$400
$500
$600
0 20 40 60 80
BID
$ /
TO
N
BID QUANTITY (1000 TONS)
ASPHALT SURFACE MIX (SM-9.5A)
y = -11.03ln(x) + 167.54
$0
$50
$100
$150
$200
$250
$300
0 5 10 15 20 25
BID
$ /
TO
N
BID QUANTITY (1000 TONS)
ASPHALT INTERMEDIATE MIX (IM-19.0A & 19.0D)
y = -10.95ln(x) + 172.53
$-
$50
$100
$150
$200
$250
$300
0 10 20 30 40
BID
$ /
TO
N
BID QUANTITY (1000 TONS)
ASPHALT BASE MIX (BM-25.0A)
y = -2.081ln(x) + 41.065
$0
$20
$40
$60
$80
0 10 20 30 40 50 60
BID
$ /
TO
N
BID QUANTITY (1000 TONS)
AGGREGATE BASE: VDOT NO. 21B
y = 4E-05x2 - 0.0617x + 31.264
$-
$20
$40
$60
$80
0 200 400 600 800 1000
BID
$ /
SY
BID QUANTITY (SY)
PLANING 0" TO 2" (< 1000 SY)
y = -2.023ln(x) + 35.138
$-
$20
$40
$60
$80
0 2000 4000 6000 8000
BID
$ /
LF
BID QUANTITY (LF)
GUARDRAIL
y = 11.884x-0.156
$0
$2
$4
$6
$8
$10
$12
$14
5 205 405 605 805 1005
BID
$ /
SY
BID QUANTITY (1000 SY)
PLANING 0" - 2" (≥ 5000 SY)
y = 877.57x-0.668
$-
$2
$4
$6
$8
$10
$12
$14
0 2000 4000 6000
BID
$ /
SY
BID QUANTITY (SY)
PLANING 0" - 2" (1000 - 4999 SY)
y = -0.528ln(x) + 8.8558
$-
$1
$2
$3
$4
$5
$6
$7
$8
0 100 200 300 400 500 600
BID
$ /
SY
BID QUANTITY (1000 SY)
PLANING 2" - 4"
(a) (b) (c)
(d) (e) (f)
(g) (h) (i)
48
LCCA Results
LCCA results are provided in the four tables of Figure 22. The LCCA model determines
life cycle costs for a hypothetical mile of roadway with two 12-ft travel lanes. For 1,500 AADT
only, 2-ft shoulders are provided on each side of the roadway. Pavement design alternatives for
each initial AADT are differentiated by the presence or absence of separator geotextile and of
preventive maintenance. As noted previously, pavement deterioration is modeled according to
the deterioration curves in Appendix B: specifically, surface mixture deteriorates more rapidly
over base mixture with a structural coefficient below 0.33. Each pavement design alternative is
subjected to three contamination rates. Each complete scenario is tested at two discount rates.
Cost results expressed in present value are calculated for a short-term period of 20 years
and for a 50-year analysis period, the latter employing two different treatments of the estimated
remaining roadway service life at the end of the analysis period. In the first treatment, monetized
salvage value is determined in accordance with Equation 4:
Monetized salvage value = (Estimated remaining design life (yr) 20 years⁄ ) ×Replacement cost at 50 years [Eq. 4]
The replacement cost at 50 years was uniform across all pavements with the same initial
AADT and is typical for a secondary road with traffic levels determined for year 50. Monetized
salvage value offsets the discounted stream of maintenance costs over the 50-year analysis
period and reduces life cycle costs in different amounts.
In the second treatment, the “normalized” liability approach, each pavement is given
warranted maintenance at year 50, but each pavement receives a 20-year terminal pavement
design based on its condition in year 50. Deficiencies are billed as hypothetical net costs
required to normalize the pavement with respect to other pavement alternatives for an additional
20 years of service. The net costs of this hypothetical terminal pavement design are discounted
and added to the sum of life cycle costs in a manner identical to the costs of earlier maintenance
activities.
Figure 22 shows the life cycle costs of each scenario in columns by contamination rate
and, in the two bottom (italicized) rows of each table, the calculated savings or added expense of
the geotextile separation layer in the pavement, given the presence or absence of preventive
maintenance activities for both pavements, for a 20-year interim period and for the longer
analysis periods. Minimum life cycle costs among the pavement designs within a scenario (in
each column) are shown by shaded cells; the cost deltas of a pavement with a separator
geotextile layer in each scenario, given a preventive maintenance decision applied to both
pavements, are shown in the two bottom rows.
The results indicated that the 20-year cost-effectiveness of geotextile increases with the
initial AADT and becomes most substantial in the scenario of the higher initial AADT, the high
contamination rate, and the lower discount rate. Geotextile is never cost-effective within 20
years of service life if the contamination rate is relatively low (e.g., 0.05 in/yr), the initial AADT
is very low, and preventive maintenance is foregone.

49
Figure 22. Life Cycle Costs per Mile for Very Low Initial AADT and Low Initial AADT at Two Discount
Rates. AADT = annual average daily traffic; LCC = life cycle cost; GTX = separator geotextile; PM =
preventive maintenance. Shaded cells indicate minimum life cycle costs among pavement designs within a
scenario.
The results also consistently indicated that 50-year life cycle costs for pavements with
geotextile were lower than for roads without geotextile at high- and mid-level contamination
rates (0.2 and 0.1 in/yr), regardless of initial AADT or performance of preventive maintenance
(on both or neither pavement), the discount rate, and the treatment of salvage value. On the other
hand, No GTX-No PM roads were consistently more cost-effective at the lowest contamination
rate with one exception that occurred in the low initial AADT, low contamination rate, low
discount rate, and monetized salvage value approach scenario (life cycle costs of $335,129). The
0.2-in/yr 0.1-in/yr 0.05-in/yr 0.2-in/yr 0.1-in/yr 0.05-in/yr 0.2-in/yr 0.1-in/yr 0.05-in/yr
GTX-PM 403,994$ 403,994$ 403,994$ 420,646$ 420,646$ 420,646$ 467,873$ 467,873$ 467,873$
GTX-NO PM 385,911$ 385,911$ 385,911$ 365,981$ 365,981$ 365,981$ 434,381$ 434,381$ 433,880$
NO GTX- PM 486,929$ 377,277$ 377,277$ 822,238$ 552,080$ 430,991$ 845,935$ 586,061$ 456,489$
NO GTX - NO PM 468,847$ 359,195$ 359,195$ 738,488$ 428,514$ 356,212$ 776,801$ 459,761$ 394,607$
PM (82,935)$ 26,717$ 26,717$ (401,592)$ (131,434)$ (10,345)$ (378,062)$ (118,188)$ 11,384$
NO PM (82,936)$ 26,716$ 26,716$ (372,507)$ (62,533)$ 9,769$ (342,420)$ (25,380)$ 39,273$
(a) Initial AADT = 155, discount rate = 0.04
0.2-in/yr 0.1-in/yr 0.05-in/yr 0.2-in/yr 0.1-in/yr 0.05-in/yr 0.2-in/yr 0.1-in/yr 0.05-in/yr
GTX-PM 851,221$ 851,221$ 851,221$ 1,186,732$ 1,186,732$ 1,186,732$ 1,306,328$ 1,306,328$ 1,306,328$
GTX-NO PM 823,152$ 823,152$ 823,152$ 1,124,058$ 1,124,058$ 1,128,309$ 1,233,732$ 1,227,041$ 1,231,292$
NO GTX- PM 1,090,331$ 930,624$ 877,394$ 1,574,374$ 1,247,701$ 1,197,869$ 1,626,952$ 1,352,033$ 1,252,976$
NO GTX - NO PM 1,090,331$ 859,532$ 793,304$ 1,574,374$ 1,259,785$ 1,104,134$ 1,626,952$ 1,364,116$ 1,200,732$
PM (239,110)$ (79,403)$ (26,173)$ (387,642)$ (60,969)$ (11,137)$ (320,624)$ (45,705)$ 53,352$
NO PM (267,179)$ (36,380)$ 29,848$ (450,316)$ (135,727)$ 24,175$ (393,220)$ (137,075)$ 30,560$
(b) Initial AADT = 1500, discount rate = 0.04
0.2-in/yr 0.1-in/yr 0.05-in/yr 0.2-in/yr 0.1-in/yr 0.05-in/yr 0.2-in/yr 0.1-in/yr 0.05-in/yr
GTX-PM 450,490$ 450,490$ 450,490$ 482,021$ 482,021$ 482,021$ 641,447$ 641,447$ 641,447$
GTX-NO PM 421,072$ 421,072$ 421,072$ 335,129$ 335,129$ 335,129$ 566,026$ 566,026$ 564,336$
NO GTX- PM 581,725$ 641,447$ 423,773$ 1,296,485$ 818,894$ 549,745$ 1,376,476$ 933,604$ 635,820$
NO GTX - NO PM 552,308$ 482,021$ 394,356$ 1,187,205$ 558,037$ 365,621$ 1,316,536$ 663,516$ 495,231$
PM (131,235)$ (190,957)$ 26,717$ (814,464)$ (336,873)$ (67,724)$ (735,029)$ (292,157)$ 5,627$
NO PM (131,236)$ (60,949)$ 26,716$ (852,076)$ (222,908)$ (30,492)$ (750,510)$ (97,490)$ 69,105$
(c) Initial AADT = 155, discount rate = 0.015
0.2-in/yr 0.1-in/yr 0.05-in/yr 0.2-in/yr 0.1-in/yr 0.05-in/yr 0.2-in/yr 0.1-in/yr 0.05-in/yr
GTX-PM 910,072$ 910,072$ 910,072$ 1,592,934$ 1,592,934$ 1,592,934$ 1,996,657$ 1,996,657$ 1,996,657$
GTX-NO PM 864,408$ 864,408$ 864,408$ 1,445,408$ 1,445,408$ 1,453,218$ 1,815,638$ 1,793,051$ 1,800,861$
NO GTX- PM 1,289,428$ 1,048,956$ 971,362$ 2,388,717$ 1,760,009$ 1,630,425$ 2,566,207$ 2,112,203$ 1,816,451$
NO GTX - NO PM 1,289,428$ 933,300$ 834,561$ 2,388,717$ 1,756,705$ 1,448,295$ 2,566,207$ 2,108,898$ 1,774,380$
PM (379,356)$ (138,884)$ (61,290)$ (795,783)$ (167,075)$ (37,491)$ (569,550)$ (115,546)$ 180,206$
NO PM (425,020)$ (68,892)$ 29,847$ (943,309)$ (311,297)$ 4,923$ (750,569)$ (315,847)$ 26,481$
(d) Initial AADT = 1500, discount rate = 0.015
Discounted Cost @ 20-yrLCC @ 50 years, Monetized Salvage
Value
LCC @ 70 years, Terminal Pavement
Design
Discounted Cost @ 20-yrLCC @ 50 years, Monetized Salvage
Value
LCC @ 70 years, Terminal Pavement
Design
Discounted Cost @ 20-yrLCC @ 50 years, Monetized Salvage
Value
LCC @ 70 years, Terminal Pavement
Design
Discounted Cost @ 20-yrLCC @ 50 years, Monetized Salvage
Value
LCC @ 70 years, Terminal Pavement
Design

50
explanation for this exception is the fortuitous combination of the extremely low cumulative cost
of the GTX-No PM road over the analysis period, a high remaining service life at 50 years, and
the monetized salvage value approach to salvage value incorporation. This exception disappears
under the terminal pavement design approach to the treatment of salvage value.
DISCUSSION
There is an abundance of successful case histories demonstrating that geosynthetics can
be used to resolve constructability problems on very soft soils. They can help establish a
working platform quickly and efficiently while minimizing the loss of base course material
during construction. Significant cost savings can be realized in the initial construction phase by
the proper selection and application of geosynthetic materials, with readily apparent and almost
immediate results.
Although geotextiles were introduced approximately 50 years ago, both researchers and
practitioners have remarked on the absence of published documentation quantifying their long-
term benefits (Christopher, 2014; Holtz, 2016). Koerner (1997) stated that the only justification
for the use of geotextile on firm subgrades is the longer service life of pavements. He proposed a
20-year study designed to analyze the performance of comparable test sites with and without
separator geotextiles to make a proper assessment of their respective service life. The need for
such a study still exists today. The empirical proof of reduced long-term maintenance costs of
pavements with geotextile separators remains to be documented. Unfortunately, there is
insufficient information as to the current status or even a standardized method of assessing the
situation (R. Koerner, personal communication). Reliable data needed for evaluating existing
geotextile pavement sections are virtually nonexistent at VDOT, as the current PMS is not
configured to capture geosynthetic materials used in construction or rehabilitation.
The difference between the length of the initial service life used in many state LCCAs
and the longer actual service lives reported by states in the LTPP database as documented for
asphalt pavements in the NCAT report by Robbins and Tran (2018) indicates that LCCAs in
current use often do not represent actual conditions for highway agencies. Until uniform and
universal physical criteria are adopted in practice, as Robbins and Tran (2018) recommended, an
LCCA model with reasonable assumptions, sufficient detail to capture the function of separator
geotextile, and accurate cost data remains the most effective decision support tool available.
The LCCA model developed in this study provides an analytical assessment tool and a
pathway to future research efforts. Figure 23 condenses the LCCA results from Figure 22 for the
50-year analysis period using both methods of incorporating remaining service life at the end of
the analysis period. Percentage figures represent the cost difference between the GTX pavement
and the No GTX pavement relative to the cost of the No GTX pavement. Unshaded cells show
the cost advantage or disadvantage of the GTX pavement (columns) relative to No GTX
pavements (rows) when both or neither received preventive maintenance over the 50-year
analysis period. Shaded cells show cross-comparisons of pavements; i.e., only one pavement
contains geotextile or received preventive maintenance.

51
In the highest and middle contamination rate scenarios [Figure 23, columns (a) through
(d)], whether or not any pavement received preventive maintenance, the GTX pavements were
consistently less costly in present value than No GTX pavements over the 50-year analysis
period. As expected, the effect of the 1.5% discount rate versus the 4% rate was to increase the
relative cost advantage of GTX pavements. Further, direct comparisons of GTX and No GTX
pavements (both receiving preventive maintenance or neither receiving preventive maintenance,
indicated by unshaded squares) in the mid- to high-contamination rate scenarios showed
negligible changes that were attributable to preventive maintenance in the consistent GTX
pavement cost advantage. It should be kept in mind, however, that prospective cost savings will
come at the price of deterioration in surface condition state and ride quality if preventive
maintenance activities are not performed.
Figure 23. Summary of Life Cycle Cost Analysis Results. AADT = annual average daily traffic; GTX =
geotextile; PM = preventive maintenance. Shading indicates cross-comparisons of pavements; i.e., only one
pavement contains geotextile or received preventive maintenance.
(a) (b) (c) (d) (e) (f)
GTX-No PM GTX-PM GTX-No PM GTX-PM GTX-No PM GTX-PM
No GTX-PM 45% 51% 66% 76% 85% 98%
No GTX-No PM 50% 57% 85% 98% 103% 118%
No GTX-PM 71% 75% 90% 95% 94% 99%
No GTX-No PM 71% 75% 89% 94% 102% 107%
No GTX-PM 26% 37% 41% 59% 61% 88%
No GTX-No PM 28% 41% 60% 86% 92% 132%
No GTX-PM 61% 67% 82% 91% 89% 98%
No GTX-No PM 61% 67% 82% 91% 100% 110%
(a) (b) (c) (d) (e) (f)
GTX-No PM GTX-PM GTX-No PM GTX-PM GTX-No PM GTX-PM
No GTX-PM 51% 55% 74% 80% 95% 102%
No GTX-No PM 56% 60% 94% 102% 110% 119%
No GTX-PM 76% 80% 91% 97% 98% 104%
No GTX-No PM 76% 80% 90% 96% 103% 109%
No GTX-PM 41% 47% 61% 69% 89% 101%
No GTX-No PM 43% 49% 85% 97% 114% 130%
No GTX-PM 71% 78% 85% 95% 99% 110%
No GTX-No PM 71% 78% 85% 95% 101% 113%
Contamination Rate
0.2-in/yr 0.1-in/yr 0.05-in/yr
Discount
Rate
Initial
AADT
Pavement
Design
4.0%
155
1500
1.5%
155
1500
(a) Monetized Salvage Value Method
(b) Terminal Pavement Design Method
Contamination Rate
4.0%
155
1500
1.5%
155
1500
0.2-in/yr 0.1-in/yr 0.05-in/yr
Discount
Rate
Initial
AADT
Pavement
Design

52
For the lowest contamination rate [columns (e) and (f)], the monetized salvage value
approach shows slightly more variety in the relative cost-effectiveness of GTX-PM pavements
than does the terminal pavement design approach. In the latter, GTX-PM pavements [column
(e)] are never cost-effective at the lowest contamination rate. The two approaches have similar
mixed results regarding the cost-effectiveness of GTX-No PM pavements [column (f)]. For the
lowest contamination rate, the tables agree that the largest cost advantage of a GTX pavement, at
-39% in Figure 23(a) and -11% in Figure 23(b), is in the cross-comparison of GTX-No PM vs.
No GTX-PM pavements under very low initial AADT and the lower discount rate. The tables
conflict regarding the scenario with the highest cost disadvantage of a GTX pavement, although
it is clear that the cost discrepancies are larger for pavement designed for very low AADT than
for pavement designed for higher AADT.
Under monetized salvage value [Figure 23(a)] and the higher discount rate, direct
comparisons of GTX and No GTX pavements under the lowest contamination rate showed
similar costs (±3 percentage points around 0) for GTX and No GTX pavements when they both
received or did not receive preventive maintenance, regardless of initial AADT. Yet the GTX
pavement showed an 8% to 12% cost advantage whether both pavements did or did not receive
preventive maintenance in the very low AADT–low contamination rate scenario under the lower
discount rate. This exception was likely due to the low contamination rate and initial traffic
loading, allowing for very low maintenance costs and a high remaining design life by year 50, as
well as the monetized salvage value approach at the end of the analysis period and the low
discount rate. By contrast, use of the terminal pavement design factor indicated that GTX
pavement has no significant cost-effectiveness to offer in this lowest contamination scenario or
any other direct comparison (i.e., both pavements receive or forego preventive maintenance).
GTX pavement showed a cost advantage only if the other pavement received preventive
maintenance in the scenario of the lower discount rate and lower initial AADT.
Overall, the LCCA results presented in this study consistently support the use of
separator geotextile when the estimated contamination occurs at a rate of at least 0.1 in per year,
even when the initial traffic volume is very low and regardless of whether preventive
maintenance is performed. The results indicated that the benefit of separator geotextiles
decreases with a decreasing contamination rate. For the highest contamination rate but
regardless of initial AADT and discount rate, GTX pavement had a consistent and sizable cost
advantage over No GTX pavement when both pavements received preventive maintenance, and
the cost advantage tended to increase if neither pavement received preventive maintenance. The
LCCA results also suggested that the contamination range tested in the LCCA model spans an
appropriate range for defining the contamination parameter that delineates cost advantages from
no cost advantages attributable to geotextile.
The price-quantity relationships determined from VDOT construction records for item
codes 00355 (geotextile) and 10128 (21B aggregate) allow another perspective regarding the
potential cost-effectiveness of using separator geotextile in road construction. Assuming a
hypothetical 100-home subdivision project consisting of 2 miles of 25-ft-wide road,
approximately 29,300 square yards of separator geotextile would be required at a unit cost of
about $1.30 per square yard (from Figure 21). If 100 houses were constructed, the addition of
separator geotextile would result in a delta cost of approximately $380 per house. The study by

53
Al-Qadi and Appea (2003) implied that the life of the subdivision pavement could be nearly
doubled for this delta cost.
When a smaller area is considered, such as a 1,000-ft section of road terminating in a cul-
de-sac with 10 homes, the delta cost for separator geotextile would be approximately $670 per
house. Therefore, using current VDOT data, separator geotextile appears to be most cost-
effective on large projects. The potential benefits of using a geotextile separator can be
identified with reference to Figure 24.
The primary purpose of a geotextile separator layer is to prevent the intermixing of base
aggregate and subgrade fines. It also provides lateral confinement, potentially leading to the
improved durability of the pavement section. Although the intermixing process is more likely to
occur on low-volume secondary roads than on heavily traveled arteries, the outcome is largely
dependent on the actual strain that develops at the subgrade level in response to the applied
traffic loads. In addition, the rate of fines migration can change over time because of a potential
decrease in subbase permeability. Ultimately, the main reasons for using separation fabrics
include preserving the integrity of the unbound aggregate base layer and maintaining the long-
term pavement performance. Although the surficial HMA layer must be replaced periodically as
it wears out under traffic, the base material can be reused in perpetuity if it remains structurally
intact.
It may be argued that the underlying mechanism of base course contamination and
subsequent weakening is in fact significantly more complex than originally advanced and the
actual field outcome is controlled by other inputs. Pumping-susceptible soils are only a part of
the overall phenomenon resulting in pavement subbase contamination. As Woods and Shelburne
observed in their 1943 study, pumping becomes a serious problem only as a result of the
synergistic influence of several factors. Subgrade saturation, porous base course, and heavy
cyclic loading, in addition to pumping-susceptible subgrade soils, must be simultaneously
present. It should be recognized that these same factors contribute to a large percentage of
various types of pavement failures. Absent any one of these components, the conditions for
subbase contamination are greatly diminished, reducing the need for separator membrane. Thus,
subbase contamination may be viewed as a transient phenomenon rather than a continuous
process.
Figure 24. Separator Geotextile in a Pavement System
54
The literature review and field observations indicated that subgrade separator geotextile
is not necessary for all roadways. Generally, the need for separator geotextile may be assessed
based on the following four criteria:
1. Fines content above 35%. This is the breakpoint between granular and silt-clay
materials according to the AASHTO soil classification system. There is no evidence
justifying the need for separation in subgrade soils with the fines content below 35%.
2. Subsurface drainage. This is a key factor to long-term pavement performance.
Simply stated, if subgrade soils do not become saturated, they do not pump. In the
case of VDOT, there are no requirements for any subsurface drainage for low-volume
roads (carrying less than 1,000 vehicles per day). The vast majority of subdivision
roadways within VDOT’s maintenance network fall into this category. Both test sites
(Bedford County and Albemarle County) appear to have resisted contamination
because of adequate subsurface drainage.
3. Subgrade soil strength. Subgrades with soaked CBR values between 3 and 8 should
be considered for the use of separator geotextiles. Subgrade soils identified for the
use of nonwoven geotextile separators exhibit the material properties shown in Figure
7. Stabilization applications should be evaluated below CBR 3.
4. Pavement section design. Long-term pumping of fines is not critical in pavement
structures with a relatively low traffic-induced strain at the subgrade level. The
Albemarle County test site appears to be an example of this.
The concept of adequate subsurface drainage is challenging to define for the multitude of
potential pavement design scenarios. However, the following list (in descending order of
effectiveness) identifies VDOT’s current subsurface drainage design options (VDOT, 2018a,
2018b):
1. Open-graded drainage layers. When connected to subsurface drains, these asphalt- or
cement-stabilized pavement layers have the greatest permeability. Although these
layers also require low-permeability materials underneath and tend to be more
expensive to construct (usually reserved for high-volume roadways), they provide
subsurface drainage well above that required for the typical rainfall in Virginia.
2. Subsurface drains. When connected to dense-graded aggregate layers, a variety of
VDOT standard drains improve the permeability of the pavement structure. Drains
that incorporate perforated pipe have a permeability an order of magnitude higher
than those that use prefabricated slot drains. Analyses using FHWA’s DRIP software
indicate that subsurface drains improve the pavement system’s permeability, but their
effectiveness is dependent on the aggregate layer gradation. Combination
underdrains should be used in all vertical (profile) sag sections to prevent ponding of
water within the aggregate layers; these are also typically used at cut and fill
transitions.

55
3. Daylighted aggregate layers. Simply constructing aggregate layers through the
shoulder and embankment to daylight provides the lowest permeability at the lowest
cost in most scenarios. However, as VDOT uses dense-graded base aggregates and
drainage paths may become exceedingly long, the permeability of the daylighted
layer may not be sufficient in all cases to prevent subgrade saturation. This option is
also the most susceptible to fines contamination by the subgrade soils.
The key to the consistent use and wider adoption of geosynthetics in road construction is
to implement design based on specifications, modeled on the AASHTO M 288 framework. It
should be recognized that the material strength is the primary consideration for durability. There
is an established consensus to require Class 1 material for stabilization and Class 2 material for
separation applications, as outlined previously. The other parameters critical for adequate
performance are AOS and permittivity. These parameters involve a trade-off between the
drainage and filtration properties. The reduction in AOS will ensure the filtration of fine
particles but may significantly impede flow through geotextile, potentially resulting in a
saturated subgrade. The permittivity of a geotextile should be maximized to provide adequate
drainage and redundancy over time.
The selection of appropriate permittivity and AOS parameter values may be optimized to
provide adequate functionality for typical applications. In the case of Virginia, VDOT Materials
Division records indicate that statewide, most of the cohesive subgrade soils contain in excess of
50% fines (approximately 60% of all soil samples tested contain 50% or more fines). Thus, the
optimal permittivity of 0.1 sec-1 may be adopted for design specifications. This requirement
matches the AASHTO M 288 minimum permittivity requirement for erosion control fabrics used
with soils containing 50% or more fines.
The optimal AOS for geotextile is determined based on the soil retention criteria
(Koerner, 2013). Sufficient conditions to prevent soil loss through the geotextile exist when the
soil contains more than 30% fines, has a coefficient of permeability less than 1 x 10⁻⁷ cm/s, has a
plasticity index greater than 15, and has an undrained shear strength in excess of 200 psf. A
geotextile with an AOS value less than that of a No. 70 sieve (0.212 mm) can be used with soils
meeting these criteria, essentially functioning more as a separator than a filter. This AOS
requirement can be considered applicable to the vast majority of cohesive subgrade soils in
Virginia.
Proposed application guidelines for the use of roadway geosynthetics are presented in
Table 4. These guidelines integrate current VDOT practices with respect to the treatment of
unsuitable soils and build on the findings of this study as related to subgrade separation.
Subgrade stabilization guidelines indicate that this practice should be viewed as an alternative to
chemical stabilization or excavation and replacement.

56
Table 4. Proposed Guidelines for Use of Roadway Geosyntheticsa
Primary
Application
(Pay Item)
AASHTO M 288
Class and Material
Type
Minimum
Permittivity
(sec-1)
Maximum
AOS
(mm)
Guidelines for Useb
Subgrade
Stabilization
Class 1
No silt-film woven
fabrics allowed.
Biaxial geogrid can be
used with nonwoven
or woven separator
geotextile
0.1 0.212
(No. 70)
Any of the following:
CH, MH, OH, OL, PT (VDOT,
2019)
organic content > 5% (VDOT,
2019)
swelling > 5%
natural WC > 30% above OWC
(VDOT, 2005)
subgrade CBR < 3 (AASHTO,
2017)
CBR or MR < design value
as judged by the Engineer (VDOT,
2013, 2019)
Subgrade
Separation
Class 2
Nonwoven geotextile
only
0.1 0.212
(No. 70)
All of the following:
more than 35% subgrade fines
(Kroening et al., 2017a)
subgrade CBR between 3 and 8
(AASHTO, 2017)
no adequate pavement subdrainage
as judged by the Engineer
AOS = apparent opening size; CH = fat clay; MH = elastic silt; OH = organic clay or silt; OL = organic clay or silt;
PT = peat; WC = water content; OWC = optimum water content; CBR = California bearing ratio; MR = resilient
modulus. a Although the use of stabilization geosynthetic(s) can reduce the depth of undercut and quantity of replacement
material, and in some limited cases eliminate them, VDOT pavement design methods should be followed without
adding any structural benefit of the geosynthetic(s). b
Special considerations: subgrade separator geotextile should be used between any open-graded aggregate layer and
soil and for all jointed concrete pavements constructed on pumping-susceptible subgrades.
The proposed Special Provision for Subgrade Separation and Subgrade Stabilization
Geotextiles is presented in Appendix E. It is estimated that more than 70 currently available
nonwoven geotextiles will meet the new separation criteria, based on the IFAI Specifier’s Guide
(IFAI, 2018).
Accurate determination of the “expected contamination rate” of an unknown roadway is a
very challenging problem. A practical solution is to ensure that contamination does not occur,
using a cost-effective analytical approach. Guidance provided in this study, coupled with LCCA
modeling, is focused on minimizing subbase contamination, leading to optimal life cycle road
maintenance expenditures.
CONCLUSIONS
The majority of state DOTs use geosynthetics in distinct separation and stabilization
applications.

57
Geosynthetic materials can provide long-term benefits when applied as an integral part of
the pavement design practice without reducing the aggregate base or bituminous layer
thickness.
Separator geotextiles are most suited to relatively thin pavement sections constructed on
pumping-susceptible soils and roadways with or subject to inadequate subsurface drainage.
The optimal range of soaked CBR values applicable to geotextile separators is between 3 and
8. AASHTO M 288 identifies a CBR of 3 as the threshold value between separation and
stabilization.
Separator geotextiles can help maintain the integrity of the unbound base material under
some conditions, typically representative of subdivision and secondary roads. The base can
remain functional in perpetuity if its structural integrity is not compromised by the intrusion
of subgrade fines.
Subgrade stabilization using geosynthetics is most applicable to soft soils with soaked CBR
values below 3. Site-specific stabilization design is required for subgrade soils with CBR
values below 1.
The results of the survey of VDOT resident engineers indicate the need to consider potential
quality improvements in the construction of subdivision roads, although it is not evident that
all of the identified problems could have been prevented by the use of geosynthetics.
Current record keeping at VDOT does not lend itself to a detailed empirical analysis of
geosynthetics use on Virginia roadways because no geotextile item code specifies a pavement
layer separation function. In addition, VDOT’s PMS does not currently document
geosynthetics used in construction or rehabilitation.
The Virginia test sites did not corroborate the claim of long-term benefits with woven
geotextiles and geogrids. Adequate subdrainage has kept these subgrade soils from
becoming saturated. Pavement section overdesign (Albemarle County site) and maintenance
overlay placement (Bedford County site) may have masked the identification of potential
benefits.
The LCCA model developed in this study permits differentiation and quantification of the
benefits of using separator geotextile under varying subbase contamination rates for a low-
volume roadway under two AADT assumptions and across a 50-year time period. The
results of the LCCA model indicate the following:
The 20-year cost-effectiveness of geotextile increases with the initial AADT assumption
and becomes substantial in the scenario of the higher initial AADT level, a high
contamination rate, and the lower discount rate, although geotextile is not cost-effective
within 20 years if the contamination rate is as low as 0.05 in/yr, initial AADT is at the
lower level, and preventive maintenance is not provided.
58
Pavements with separator geotextile are consistently cost-effective compared to
pavements without separator geotextile at contamination rates above 0.1 in/yr,
regardless of whether preventive maintenance is performed or whether initial AADT is
set at the lower or higher level, for discount rates within the range explored in this study
(4% and lower).
Separator geotextile in pavement has a consistent and sizable life cycle cost advantage
over pavement without geotextile for the highest contamination rate tested in this study
when both pavements receive preventive maintenance, and the cost advantage usually
increases if neither pavement receives preventive maintenance, regardless of initial
AADT.
The life cycle cost advantage of separator geotextile decreases with a decreasing
contamination rate.
Judicious use of separator geotextile can increase the reliability of unbound base aggregate
at a relatively low unit cost on large construction projects at current VDOT bid prices.
RECOMMENDATIONS
1. VDOT’s Materials Division should revise current geosynthetic specifications to include
“Subgrade Stabilization” and “Subgrade Separator Geotextiles” as two separate and
distinct pay items. This will result in providing additional design options and better tracking
of geosynthetics use on VDOT roadways. The addition of the subgrade separator geotextile
option is expected to result in a more economical use of fabrics on VDOT roadways by
differentiating textile properties and applications. It is also expected to help maintain
performance of unbound subbase material.
2. VDOT’s Materials Division should adopt the guidelines presented in Table 4 for the use of
geosynthetics on low-volume roads. This will result in optimized pavement design for low-
volume and subdivision roadways. The use of these geosynthetics consistent with the
guidance provided is expected to reduce VDOT maintenance and pavement replacement
costs.
3. VDOT’s Materials Division should implement changes to the existing geosynthetics special
provision, as presented in Appendix E. The proposed modifications expand on the existing
stabilization application and provide additional options to the road designer.
4. VDOT’s Maintenance Division should update PMS software to allow the inclusion of
geosynthetics in its pavement structure database. This will result in the documentation of the
use of geosynthetics in pavements, allowing future long-term studies of pavement
performance.
59
SUGGESTIONS FOR FURTHER RESEARCH
The literature review highlighted a particular need for additional research on the long-
term benefits of geosynthetics in the context of transportation asset management. It is important
for decision makers to look across the entire life cycle of an asset. Future research efforts should
include the refinement of LCCA to reflect actual maintenance decisions and realistic
maintenance cycles rather than prescriptive or idealized guidelines. The impact of maintenance
practices on deterioration rates remains an unresolved issue. The American Society of Civil
Engineers Grand Challenge promotes the use of LCCA to extend design life and support
sustainable infrastructure decisions, but it does not provide any specific guidance. There is a
growing need and opportunity for further research in this area.
The topic of adequate subsurface drainage also warrants further research, as the
functionalities of various standard materials are not known quantitatively. Targeted field studies
can provide the required information and fill knowledge gaps, leading to improved subsurface
drainage design guidelines.
IMPLEMENTATION AND BENEFITS
Implementation
With regard to Recommendations 1 through 3, VTRC will work with VDOT’s Materials
Division to help implement changes to the existing geosynthetics specifications and guidelines.
The proposed specification changes are not expected to affect geotextile prices or availability
adversely. According to IFAI’s Specifier’s Guide (IFAI, 2018), more than 70 currently available
nonwoven geotextiles meet the proposed minimum requirements for separation and more than 50
meet the proposed minimum requirements for stabilization. It is anticipated that the Materials
Division will conduct an internal review of proposed recommendations within the next 3 months
and decide on the appropriate outcome with regard to implementation. Meetings with VDOT
district materials engineers will be scheduled shortly to discuss this study. VTRC personnel will
be available for consultation.
With regard to Recommendation 4, VTRC will work with VDOT’s Maintenance
Division to implement changes to the existing PMS. The proposed changes address the need to
incorporate additional data entries required to track the use of geosynthetics. It is anticipated,
based on preliminary discussions, that the Maintenance Division will adopt Recommendation 4
within the next 3 months.
Benefits
The benefits of implementing Recommendations 1 through 3 include the harmonized use
of geosynthetic materials in road construction across the VDOT network in a cost-effective
manner. The revised specifications and guidelines will facilitate consistent, efficient, and
systemic use of separator geotextiles on road projects. It is anticipated that subdivision and

60
secondary roads will benefit appreciably from implementation of these recommendations,
resulting in reduced maintenance costs.
The benefit of implementing Recommendation 4 is that it will allow documentation of
the future use of geosynthetics in roadway construction/rehabilitation. This will provide a
database of geosynthetic pavement sections for future studies.
ACKNOWLEDGMENTS
This study was supported by the Federal Highway Administration. The researchers
express their appreciation to VDOT’s geotechnical and pavement engineers for their technical
guidance. Brian Diefenderfer assisted with ground-penetrating radar testing. Travis Higgs
facilitated field drilling and sampling. Stephen Lane performed the XRD tests. The study would
not have been possible without the extensive field support provided by the maintenance
personnel of VDOT’s Bedford and Charlottesville residencies. Linda Evans of VTRC assisted
with the editorial process.
REFERENCES
Al-Qadi, I.L., and Appea, A.K. Eight-Year Field Performance of Secondary Road Incorporating
Geosynthetics at Subgrade-Base Interface. Transportation Research Record: Journal of
the Transportation Research Board, No. 1849, 2003, pp. 212-220.
Al-Qadi, I.L., Brandon, T.L., Valentine, R.J., Lacina, B.A., and Smith, T.E. Laboratory
Evaluation of Geosynthetic-Reinforced Pavement Sections. Transportation Research
Record: Journal of the Transportation Research Board, No. 1439, 1994, pp. 25-31.
American Association of State Highway and Transportation Officials. AASHTO Guide for
Design of Pavement Structures. Washington, DC, 1993.
American Association of State Highway and Transportation Officials. AASHTO M 288-17:
Standard Specification for Geosynthetic Specification for Highway Applications.
Washington, DC, 2017.
American Association of State Highway and Transportation Officials. National Transportation
Product Evaluation Program. Washington, DC, 2018.
http://www.ntpep.org/Pages/What_is_NTPEP.aspx. Accessed January 2, 2019.
American Railway Engineering Association, Committee on Roadway and Ballast. Roadway and
Ballast. In Proceedings of the Forty-fifth Annual Convention of the American Railway
Engineering Association, Chicago, Vol. 47, 1946, p. 363.
American Railway Engineering and Maintenance-of-Way Association. Manual for Railway
Engineering. Lanham, MD, 2018.

61
Appea, A.K. In-situ Behavior of Geosynthetically Stabilized Flexible Pavement. Master’s
Thesis. Virginia Polytechnic Institute and State University, Blacksburg, 1997.
ASTM International. ASTM D 4439-18: Standard Terminology for Geosynthetics. In Annual
Book of ASTM Standards. West Conshohocken, PA, 2018.
Autostrads Ltd. Guide to Pavement Technology Part 2: Pavement Structural Design. Sydney,
New South Wales, Australia, 2012.
Barksdale, R.D., Brown, S.F., and Chan, F. NCHRP Report 315: Potential Benefits of
Geosynthetics in Flexible Pavement Systems. Transportation Research Board,
Washington, DC, 1989.
Bearden, J., and Labuz, J. Interface Friction of a Soil-Fabric-Aggregate System. In Proceedings
of Cold Regions Impact on Civil Works, American Society of Civil Engineers, Duluth,
Minnesota, 1998, pp. 339-350.
Beckham, W.K., and Mills, W.H. Cotton-Fabric-Reinforced Roads. Engineering News Record,
Vol. 114, No. 14, 1935, pp. 453-455.
Bhutta, S.A. Mechanistic-Empirical Pavement Design Procedure for
Geosynthetically Stabilized Flexible Pavements. Doctoral Dissertation. Virginia
Polytechnic Institute and State University, Blacksburg, 1998.
Black, P.J., and Holtz, R.D. Performance of Geotextile Separators Five Years After Installation.
Journal of Geotechnical and Geoenvironmental Engineering, Vol. 125, No. 5, 1999, pp.
404-412.
Brandon, T.L., Al-Qadi, I.L., Lacina, B.A., and Bhutta, S.A. Construction and Instrumentation
of Geosynthetically Stabilized Secondary Road Test Sections. Transportation Research
Record: Journal of the Transportation Research, No. 1534, 1996, pp. 50-57.
Bruinsma, J., Smith, K., Peshkin, D., Ballou, L., Eisenberg, B., Lurie, C., Costa, M., Ung, C.,
Nassiri, S., Shi, X., and Haselbach, L. ACRP Report 178: Guidance for Usage of
Permeable Pavements at Airports. Transportation Research Board, Washington, DC,
2017.
Christopher, B.R. Cost Savings by Using Geosynthetics in the Construction of Civil Works
Projects. In Proceedings of the 10th International Conference on Geosynthetics (Vol. 1),
September 2014. http://toc.proceedings.com/30777webtoc.pdf. Accessed December 4,
2018.
Christopher, B.R., Schwartz, C., and Boudreau, R. Geotechnical Aspects of Pavements. NHI-
05-037. Federal Highway Administration, Washington, DC, 2006.
Collins, B.M., and Holtz, R.D. Long-Term Performance of Geotextile Separators, Bucoda Test
Site—Phase III. WA-RD 595.1. Washington State Transportation Center, Seattle, 2005.

62
Colorado Department of Transportation. Geosynthetics & Geotextiles. Construction Standard
Specification. Denver, 2005. https://www.codot.gov/business/designsupport/cdot-
construction-specifications/2005-construction-specs/2005ssp/section-200-500-
revisions/208gg.doc/view. Accessed January 2, 2019.
Duong, T.V., Cui, Y.-J., Tang, A.M., Dupla, J.C., Calon, N., Canou, J., and Robinet, A.
Investigating the Mud Pumping and Interlayer Creation Phenomena in Railway Sub-
Structure. Engineering Geology, Vol. 171, 2014, pp. 45-48.
Equipment World. Geosynthetics Speed Construction. May 2014.
https://www.equipmentworld.com/down-to-earth/. Accessed January 2, 2019.
Federal Highway Administration. Life-Cycle Cost Analysis in Pavement Design. September
1998. https://www.fhwa.dot.gov/infrastructure/asstmgmt/013017.pdf. Accessed March
5, 2019.
Federal Register. Discount Rates for Cost-Effectiveness Analysis of Federal Programs. Office
of Management and Budget, The Daily Journal of the United States Government,
February 8, 2018. https://www.federalregister.gov/documents/2018/12/27/2018-
27962/discount-rates-for-cost-effectiveness-analysis-of-federal-programs. Accessed
April 8, 2019.
Gobla, M.J. Design Standards No. 13: Embankment Dams. U.S. Bureau of Reclamation,
Washington, DC, 2014. https://www.usbr.gov/tsc/techreferences/designstandards-
datacollectionguides/finalds-pdfs/DS13-19.pdf. Accessed January 2, 2019.
Greenwood, J.H., Schroeder, H.F., and Voskamp, W. Durability of Geosynthetics. CUR 243.
CUR Building and Infrastructure, 2012. https://www.geosynthetica.net/wp-
content/uploads/Publication243_Durability_C187.pdf. Accessed August 26, 2019.
Hawkins, W. Geotextiles in Unpaved Roads: A 35-Year Case History. July 2009.
http://dbbinc.ca/en/files/TGeo_35yr_Case_History.pdf. Accessed December 5, 2018.
Heukelom, W., and Klomp, A.J.G. Dynamic Testing as a Means of Controlling Pavements
During and After Construction. In Proceedings of First International Conference on the
Structural Design of Asphalt Pavements, Ann Arbor, Michigan, 1962.
Holtz, R. Geosynthetics R&D—The “Early” Days (1960s to Circa 1985). March 9, 2016.
http://www.geosynthetica.com/Uploads/KoernerSympBobHoltz.pdf.
Accessed December 4, 2018.
Holtz, R.D., Christopher, B.R., and Berg, R.R. Geosynthetic Design and Construction
Guidelines. FHWA NHI-07-092. Federal Highway Administration, Washington, DC,
2008.

63
Hossain, S., and Schmidt, B. Benefits of Using Geotextile Between Subgrade Soil and Base
Course Aggregate in Low-Volume Roads in Virginia. VTRC 10-R1. Virginia
Transportation Research Council, Charlottesville, 2009.
Industrial Fabrics Association International. Specifier’s Guide. Roseville, MN, 2018.
https://geosyntheticsmagazine.com/wp-
content/uploads/sites/26/2018/02/Geotextiles_2018.pdf. Accessed January 2, 2019.
Jorenby, B.N., and Hicks, R.G. Base Course Contamination Limits. Transportation Research
Record: Journal of the Transportation Research Board, No. 1095, 1986, pp. 86-101.
Kermani, B., Xiao, M., Stoffels, S.M., and Qiu, T. Reduction of Subgrade Fines Migration Into
Subbase of Flexible Pavement Using Geotextile. Geotextiles and Geomembranes, Vol.
46, 2018, pp. 377-383.
Kermani, B., Xiao, M., Stoffels, S.M., and Qiu, T. Measuring the Migration of Subgrade Fine
Particles Into Subbase Using Scaled Accelerated Flexible Pavement Testing: A
Laboratory Study. Road Materials and Pavement Design, Vol. 20, No. 1, 2019, pp. 36-
57.
Koerner, G.R. Data Base Development for Determination of Long Term Benefit/Cost of
Geotextile Separators. In Proceedings of the Geosynthetics ’97 Conference, Long Beach,
California, 1997, pp. 701-713.
Koerner, R.M. Designing With Geosynthetics, Fifth Edition. Prentice-Hall, Upper Saddle River,
NJ, 2005.
Koerner, R.M. Geosynthetics in Filtration, Drainage and Erosion Control. Elsevier, Essex,
England, 2013.
Koerner, R.M. Designing with Geosynthetics, Sixth Edition. Xlibris LLC, Bloomington, IN,
2016.
Kroening, J.R., Darmiento, F.T., and Hansen, H.E. Geosynthetics—Specifications and
Applications for Arizona. Report SPR-722, Vol. 1. Arizona Department of
Transportation, Phoenix, 2017a. Accessed January 8, 2019.
Kroening, J.R., Darmiento, F.T., and Hansen, H.E. Geosynthetics—Specifications and
Applications for Arizona. Report SPR-722, Vol. 2. Arizona Department of
Transportation, Phoenix, 2017b.
Luo, R., Gu, F., Luo, X., Lytton, R.L., Hajj, E.Y., Siddharthan, R.V., Elfass, S., Piratheepan, M.,
and Pournoman, S. Quantifying the Influence of Geosynthetics on Pavement
Performance. NCHRP Web-only Document 235. Transportation Research Board,
Washington, DC, 2017.

64
Metcalfe, R.C., Holtz, R.D., and Allen, T.M. Field Investigation to Evaluate the Long Term
Separation and Drainage Performance of Geotextile Separators. In Proceeding of the
Geosynthetics 1995 Conference, Vol. 3, Nashville, Tennessee, 1995, pp. 951-962.
Minnesota Department of Transportation. Specification 3733. St. Paul, 2005.
https://www.dot.state.mn.us/products/concrete/pdf/Specification_3733.pdf. Accessed
May 11, 2019.
Missouri Highways and Transportation Commission. Missouri Standard Specifications for
Highway Construction. Jefferson City, 2018.
https://www.modot.org/sites/default/files/documents/2018%20Missouri%20Standard%20
Specific%20-%20MHTC%20%28July%202018%29.pdf. Accessed January 8, 2019.
Montana Department of Transportation. Geotechnical Manual. Helena, 2008.
https://www.mdt.mt.gov/other/webdata/external/materials/geotech_manual/chapter20.pdf.
Accessed May 11, 2019.
Moulton, L. Highway Subdrainage Design. FHWA-TS-80-224. Federal Highway
Administration, Washington, DC, 1980.
Nebraska Department of Roads. Geotechnical Policies and Procedures Manual. Lincoln, 2012.
New York State Department of Transportation. Geotechnical Design Manual: Chapter 18:
Geosynthetic Design. Albany, 2018a.
https://www.dot.ny.gov/divisions/engineering/technical-services/geotechnical-
engineering-bureau/geotech-eng-repository/GDM_Ch-18_Geosynthetic_Design.pdf.
Accessed May 11, 2019.
New York State Department of Transportation. Geosynthetics for Highway Construction.
Albany, 2018b. https://www.dot.ny.gov/divisions/engineering/technical-
services/technical-services-repository/alme/pages/470-1a.html. Accessed May 11, 2019.
Oregon Department of Transportation. Pavement Design Guide. Salem, 2011.
Pennsylvania Department of Transportation. Section 735—Geotextiles. Harrisburg, 2016.
https://www.dot.state.pa.us/public/PubsForms/Publications/Pub_408/408_2016/408_201
6_IE/408_2016_IE.pdf. Accessed January 8, 2019.
Perkins, S.W. Mechanistic-Empirical Modeling and Design Model Development of Geosynthetic
Reinforced Flexible Pavements. FHWA/MT-01-002/99160-1. Federal Highway
Administration, Washington, DC, 2001.
Petrasic, K.W. Geotextile Separation to Prevent Migration of Subgrade Fines. PowerPoint
Presentation. 50th Mid-Atlantic Quality Assurance Workshop, February 7-9, Hershey,
Pennsylvania, 2017.

65
http://www.dot.state.pa.us/public/Bureaus/BOPD/2017_QAW/GeoTech_and_Aggregates
/Geotextile%20Separation-kwp.pdf. Accessed May 11, 2019.
Rankilor, R.R. Membranes in Ground Engineering. John Wiley & Sons Ltd., Chichester,
England, 1981.
Raymond, G.P., and Giroud, J.P. Geosynthetics Case Histories. BiTech Publishers Ltd,
Richmond, British Columbia, Canada, 1993, pp. 192-193.
Robbins, M., and Tran, N. Review of Initial Service Life Determination in Life Cycle Cost
Analysis (LCCA) Procedures and Practice. Report 18-02. National Center for Asphalt
Technology, Auburn, AL, July 2018.
Saathoff, F. Examinations of Long-Term Filtering Behaviour of Geotextiles. In Proceedings of
Durability of Geotextiles Seminar, Saint-Rémy-lès-Chevreuse, France, 1988, pp. 86-114.
Sarsby, R.W. Geosynthetics in Civil Engineering. Woodhead Publishing Limited, Cambridge,
England, 2006.
Shukla, S.K. An Introduction to Geosynthetic Engineering. Taylor & Francis Group, London,
2016.
Skok, E.I., Johnson, E.N., and Brown, M. Special Practices for Design and Construction of
Subgrades in Poor, Wet and/or Saturated Soil Conditions. Minnesota Department of
Transportation, St. Paul, 2003.
Suits, L.D., and Richardson, G.N. M288-96: The Updated AASHTO Geotextile Specifications.
Geotechnical Fabrics Report, Vol. 16, No. 2, 1998, pp. 39-41.
Ullah, S., Tanyu, B.F., Guler, E.F., Hoppe, E.J., and Akmaz, E. Evaluation of the Long-Term
Performance of Woven Geotextile Used Between Base Course and Subgrade of a Paved
Road. Transportation Research Record: Journal of the Transportation Research Board,
No. 2673, 2019, pp. 310-321.
U.S. Department of Defense. Engineering Use of Geotextiles. UFC 3 220 08fa 2004.
Washington, DC, 2004.
https://www.wbdg.org/FFC/DOD/UFC/ufc_3_220_08fa_2004.pdf. Accessed October 8,
2019.
U.S. Office of Management and Budget. Discount Rates for Cost-Effectiveness, Lease Purchase,
and Related Analyses. OMB Circular No. A-94. https://www.whitehouse.gov/wp-
content/uploads/2018/12/Appendix-C.pdf. Accessed March 5, 2019.
Van Santvoort, G. Geotextiles and Geomembranes in Civil Engineering. A. A. Balkema,
Rotterdam, The Netherlands, 1994.

66
Virginia Department of Environmental Quality. Permeable Pavement. Richmond, 2013.
https://www.swbmp.vwrrc.vt.edu/wp-
content/uploads/BMP_Spec_No_7_PERMEABLE_PAVEMENT.pdf. Accessed June 18,
2019.
Virginia Department of Transportation. Flexible Pavement Design Guide for Primary and
Interstate Roads in Virginia. Richmond, 1995.
Virginia Department of Transportation. Pavement Design Guide for Subdivision and Secondary
Roads in Virginia. Richmond, 2000.
Virginia Department of Transportation. Road Design Manual, Chapter 2E, Section 2E-1.
Richmond, 2005 [Rev. January 2019].
http://www.virginiadot.org/business/resources/LocDes/RDM/chap2e.pdf. Accessed June
18, 2019.
Virginia Department of Transportation. 2013 Lump Sum Design-Build Agreement Between
Department and Design-Builder. Richmond, 2013.
http://www.virginiadot.org/business/resources/2013_Parts_3-4-5_Documents_7-3-
2013.pdf. Accessed June 18, 2019.
Virginia Department of Transportation. 2016 Road and Bridge Specifications. Richmond, 2016.
Virginia Department of Transportation. Pavement Design Guide for Subdivision and Secondary
Roads in Virginia. Richmond, 2018a.
Virginia Department of Transportation. Chapter 6—Pavement Design and Evaluation. In
Manual of Instructions, Materials Division, Virginia Department of Transportation,
Richmond, August 2018b. http://www.virginiadot.org/business/resources/Materials/bu-
mat-MOI-VI.pdf. Accessed January 2, 2019.
Virginia Department of Transportation. State of the Pavement Reports. Richmond, 2018c.
http://www.virginiadot.org/info/state_of_the_pavement.asp. Accessed January 8, 2019.
Virginia Department of Transportation. Approved List No. 63: Geosynthetics (Soils Lab).
Richmond, 2018d.
Virginia Department of Transportation. Design Build Template Request for Proposal.
Richmond, 2019.
Washington State Department of Transportation. WSDOT Design Manual: Chapter 630:
Geosynthetics. M 22-01.10. Olympia, 2016.
http://www.wsdot.wa.gov/publications/manuals/fulltext/M22-01/630.pdf. Accessed
December 10, 2018.

67
Whitaker, B.A. 40-Year Study of Geotextiles in an Unpaved Road. Transportation Research
Board Annual Conference, 2014. https://trid.trb.org/view/1288672. Accessed October 4,
2019.
Woods, K.B., and Shelburne, T.E. Pumping of Rigid Pavements in Indiana. In Proceedings of
the Twenty-third Annual Meeting of the Highway Research Board. Highway Research
Board, Washington, DC, 1943, pp. 301-316.
Xiao, M., Stoffels, S., Qui, T., and Kermani, B. Evaluation of Geotextile Separation to Prevent
Migration of Subgrade Fines into Subbase. Pennsylvania State University, State College,
2016.
Yang, S.-H., and Al-Qadi, I.L. Cost-Effectiveness of Using Geotextiles in Flexible Pavements.
Geosynthetics International, Vol. 14, No. 1, 2007, pp. 2-12.
Zornberg, J.G. Functions and Applications of Geosynthetics in Roadways. Procedia
Engineering, Vol. 189, 2017, pp. 298-306.
Zornberg, J.G., and Thompson, N. Application Guide and Specifications for Geotextiles in
Roadway Applications. FHWA/TX-10/0-5812-1. Texas Department of Transportation,
Austin, 2012.

68

69
APPENDIX A: SURVEY OF VDOT RESIDENT ENGINEERS
1. In general, is it your experience that subdivision streets that are accepted into VDOT's
secondary system reach their 20-year design life?
No 71.4%
Yes 21.4%
Usually yes 7.1%
2. If not, in your opinion are their deficiencies more related to pavement design factors,
construction quality, or an inaccurate forecast of traffic loading?
Pavement design factors 40.0%
Construction quality 46.7%
All, esp. traffic forecast 6.7%
No answer 6.7%
3. In your opinion, are subdivision streets that are accepted into VDOT’s secondary system
of the same level of quality (i.e. as durable) as VDOT secondary roadway projects?
Yes 33.3%
No 66.7%
4. If not, please describe quality differences you have noted.
Surface issues with asphalt;
Unsuitable subgrade material and installation, differential settlement, insufficient pavement
foundation drainage, underdrains, crossdrains, etc.;
Pavement thickness over the length of road is inconsistent and subgrades with unsuitable
material can be overlooked;
Less field oversight during construction of subdivision streets as compared to secondary
roadway projects with dedicated inspection force;
VDOT oversight during secondary roadway construction is far greater than subdivision streets
due to staff and the way a project is facilitated compared to developer built streets. VDOT does
have an inspection manual for subdivision streets, but currently my Residency has 1 inspector
for 4 Counties;
VDOT secondary road specs have a more robust design. Most VDOT roadway projects meet or
exceed the designed life;
VDOT's minimum pavement specifications for subdivision streets are not sufficient;
Secondary road QA/QC programs are lacking. Pavement designs are insufficient and allowable
phasing is set up to allow the developer to minimize exposure during his maintenance period
and maximize traffic load after their maintenance period;
Lack of inspection allows substandard construction. Pipe bedding is poor, curb and gutter and
sidewalk construction is substandard;
Pavement failures occur much earlier than VDOT roadways;
Drainage is probably the biggest problem, erosion of ditch lines and undersized cross and
entrance pipes. Depth of aggregate.
5. In your experience, what type of maintenance performed on subdivision streets has the
highest cost?
Pavement rehabilitation

70
Asphalt resurfacing
Premature overlay, deep culvert failure/replacement
Repaving, sidewalk reconstruction, closed drainage failures
Mill/Overlay is a normal method however FDR is becoming popular, is expensive but corrects
base concerns that ultimately extends service life and condition.
Drainage infrastructure. Replacing pipes, sinkholes, sliplining, etc.
Heavy mechanized patching
Patching and filling potholes.
Resurfacing
Pavement
Pavement settlements and pavement failures
Pavement overlay
Patching and overlay
Pavement and drainage work
Resurfacing of various types
6. Approximately what percentage of your maintenance budget for asphalt paving is spent
on subdivision streets?
Low. Our percentage of subdivision streets are low, and we can use low cost options such as
slurry seal.
15%
Increasing - I will email specific percentage
10%
5% because I do not have as many subdivisions in our rural location.
1%
--
In NOVA, the Infrastructure Office controls the paving budget and not the Residency
Maintenance Administrator.
40%
--
Unsure but the funding available is insufficient to keep up with the needs.
< 5%
Surface treatment and slurry on subdivision streets are approximately 20%. We do not overlay
with asphalt.
15% to 20%
10%
7. For subdivision streets that have exceeded their design life (i.e. require reconstruction),
what method is typically used to reconstruct these streets?
If repairs beyond slurry seal are required, mill and repave due to curb and gutter sections on
many of the streets.
Hired equipment/Maintenance Forces
Surface-treatment unless County/subdivision contribute funds to use another resurfacing
solution

71
Mill and overlay surface asphalt. I can't think of a time we have done a complete rebuild to a
subdivision street outside of spot areas.
Base repair, patch and then overlay. FDR is being looked into as an option for streets with wide
spread base failure.
Slurry or mill/replace.
When they are resurfaced a base layer of asphalt may be added. Full road reconstruction has
such a large cost associated with it that it is only used in very rare circumstances.
If it's full mill then it's paved in kind. At times they do a curb mill with a layover.
Mill and overlay and possibly FDR.
--
Very rare we have the funds to reconstruction but when we do we will typically remove the
existing surface undercut in failing areas and replace with a double or triple shot of ST.
Rarely totally reconstruct subdivision streets. Some milling and patching may occur.
Scarify and resurface.
Overlays, dig up soft spots, and upgrading pipes.
Spot leveling, then repaving.
8. Do the majority of your subdivision streets include some form of subsurface drainage
system (i.e. underdrains, cross-drains, daylighted aggregate, etc.)?
Yes 40.0%
No 60.0%
9. Is contamination of the aggregate layer by the subgrade soil a cause of pavement
degradation in your residency?
Always 0%
Sometimes 92.9%
Never 0%
Sometimes depending on the
location 7.1%
10. Do you know of any examples in your residency of the use of geotextile to separate the
soil subgrade and aggregate layers?
Yes 26.7%
No 73.3%
Comments:
No, but we feel that would be a good practice.
Yes, the Research Council installed a couple areas on Rt. 743 in Albemarle around the airport
back around 2008
Yes. The majority of the time this is used in spot locations during construction when
undercutting is not feasible due to conditions.
Yes, this method has been used in various developments
No, not in subdivisions. We need more aggregate under these roads.

72

73
APPENDIX B: LAYER DETERIORATION CURVES AND MAINTENANCE
SCHEDULE DETERMINATION PROCESS SUPPORTING THE LCCA
Each initial pavement design compared in the LCCA is consistent with the inputs given
in Table 1 in the body of the report and with AASHTO (1993) (per VDOT Materials Division
Manual of Instructions, Chapter 6) in order to determine the remaining design life in all analysis
years of the LCCA.
As discussed in the body of the report, the LCCA model developed in this study depends
on proposed deterioration curves for secondary road pavement layers with and without separator
geotextile. Although based on the AASHTO approach, the proposed deterioration curves reflect
the consensus mechanism by which pavement structure deterioration occurs because of subbase
contamination with subgrade fines:
Aggregate subbase/base contamination: with and without separator geotextile,
proposed to model aggregate contamination by subgrade soils when a separator is not
used. The contamination rate was varied over a range including 0.2 in/yr in the base
case, and 0.1 in/yr and 0.05 in/yr, respectively, in lower contamination scenarios.
Asphalt base mixture: with and without separator geotextile, to reflect stripping and
accelerated deterioration because of loss of aggregate subbase.
Asphalt surface mixture: over both competent and poor asphalt base mixtures to
simulate overlays over cracked existing pavements where existing cracks propagate
through the new surface mixture. A maximum service life of surface asphalt was
conservatively set at 20 years to reflect typical mixture serviceability and reduced
maintenance on the secondary roadway system.
The AASHTO Guide for Design of Pavement Structures (AASHTO, 1993) provides the
basis for the deterioration curves proposed for this analysis. Figure B1 shows the widely
accepted serviceability and structural capacity curves; Figure B2 illustrates condition factors
based on the best-fit curve from the AASHO road tests.
It is the predominant understanding, however, that bound pavement materials do not
deteriorate suddenly to the structural coefficient of zero. Thus, the modified “idealized”
deterioration curves shown in Figure B3 were developed to represent engineering experience and
the consensus regarding the function of separator geotextiles. Aggregate contamination can be
idealized in two different ways: the aggregate layer thickness remains the same, but the structural
coefficient of the aggregate layer decreases over time or the structural coefficient of the
aggregate layer remains the same but the thickness of the aggregate layer diminishes with time.
The latter method was selected by the researchers to allow for more clarity in pavement design
calculations.

74
Figure B1. Serviceability and Structural Capacity (AASHTO, 1993)
Figure B2. Condition Factor vs. Remaining Life Curves (AASHTO, 1993)

75
Figure B3. Idealized Deterioration Curves With and Without Separator Geotextile Under Two
Contamination Rates: 1 in in 5 years and 1 in in 10 years
0
1
2
3
4
5
6
0 5 10 15 20 25 30 35 40 45 50
Rem
ain
ing
Laye
r (i
n.)
Years
Geotextile
No Geotextile (1 in/5yrs)No Geotextile (1in/10 yrs)
(b) Aggregate Contamination vs. Remaining Layer Depth
0
0.05
0.1
0.15
0.2
0.25
0.3
0.35
0.4
0.45
0.5
0 5 10 15 20 25
Stru
ctu
ral C
oef
fici
ent
Years
Surface Mix over BM > 0.33
Surface Mix over BM < 0.33
1993 AASHTO Best Fit Curve
Limit of Serviceable Surface Mix
(d) Surface Mixture Deterioration
0
0.02
0.04
0.06
0.08
0.1
0.12
0.14
0 5 10 15 20 25 30 35 40 45 50
Stru
ctu
ral C
oef
fici
ent
Years
Geotextile
No Geotextile (1in/5 yrs)No Geotextile (1in/10 yrs)
(a) Aggregate Contamination vs. Structural Coefficient
0
0.5
1
1.5
2
2.5
3
3.5
4
4.5
0 5 10 15 20 25
Stru
ctu
ral
Nu
mb
er (
Cx
* SN
o)
Years(e) AASHTO Asphalt Pavement Deterioration
0
0.05
0.1
0.15
0.2
0.25
0.3
0.35
0.4
0.45
0.5
0 5 10 15 20 25 30 35 40 45 50
Stru
ctu
ral C
oef
fici
ent
Years
Geotextile
No Geotextile (1 in/5 yrs)
No Geotextile (1 in/10 yrs)
Limit of Serviceable Base Mix
(c) Base Mixture Deterioration

76
In two recent reports, a comprehensive contract study for PennDOT (Xiao et al., 2016)
and a streamlined derivative report in Kermani et al. (2019), accelerated pavement testing
equipment (i.e., MMLS3, or model mobile load simulator at 1/3 scale) was used to determine
quantified rates of subgrade fines penetration into aggregate subbase. Some selected parameters
of the PennDOT study are shown in Table B1 in comparison with typical VDOT values.
The results from the PennDOT study indicate that fines contamination of the aggregate
subbase layer begins virtually immediately and increases with increasing “cycles,” which for the
modelled collector road section of both studies was essentially equivalent to ESALs (Kermani et
al. 2019; Xiao et al. 2016). The studies examined fines contamination of the top and bottom
aggregate strata as well as full-depth contamination.
A previous study demonstrated that, starting with aggregate already containing 5.5%
fines, the resilient modulus of a contaminated aggregate subbase drops precipitously at
approximately 13.5% fines content (Jorenby and Hicks, 1986). Given VDOT No. 21B gradation
and production tolerances shown in Table B1, additional fines content of 7% was identified as a
conservative contamination level for a potentially abrupt loss of resilient modulus in VDOT
aggregate No. 21B. (Note: Table B1 indicates that VDOT No. 21A aggregate can reach 13.5%
fines even without exceeding production tolerances for No. 21A, and thus the level of
contamination of No. 21A aggregate that could suddenly impair resilient modulus is much lower
than the corresponding one for No. 21B.)
Based on the best linear fit relationship between pavement loadings and full-depth
laboratory contamination findings in Kermani et al. (2019), the laboratory findings are (1)
extended to higher contamination rates within the Kermani model and (2) scaled from the
modeled collector facility design of Kermani et al. (2019) to the two low-volume pavement
designs in the LCCA, as described in Table B1. Figure B4 shows the resulting plots for ESAL-
to-percent of full-depth contamination for the LCCA pavement designs along with Kermani’s
extended findings.
Table B1. Comparison of PennDOT Study Parameters to Typical VDOT Values
Parameter PennDOT Study VDOT
Subgrade Soil
Soil Type A-4 (ML) A-4, A-6, A-7-5, A-7-6
ML, CL, MH, CH
Fines Content 55.9% 35 – 100%
Density AASHTO T 180 Proctor AASHTO T 99 Proctor
Soaked CBR 5 (initial) 3 to 8
Saturation Inundated Variable
Aggregate (VDOT Production Tolerance)
Fines Content 6.5% 4 – 7% (2-9%) (No. 21B)
6 – 12% (4-14%) (No. 21A)
Max Aggregate Size --- 1 in
Pavement Structure
Aggregate Subbase 6 in 8 in (155 AADT)
5 in (1500 AADT)
Asphalt 8.5 in 1.5 in (155 AADT)
6.0 in (1500 AADT)
ML = silt; CL= lean clay; MH = elastic silt; CH = fat clay; AADT = annual average daily traffic.

77
Figure B4. Collector Roadway Loadings, LCCA Secondary Road Loadings, and Resulting Full-Depth
Contamination Rates. Source: Kermani et al. (2019).
The combined findings of Kermani (2019) and Jorenby and Hicks (1986) provide a check
on the range of absolute contamination rates assumed in this study. At the 155 AADT (initial)
pavement (growing at 2% per year), the 7% fines contamination threshold for the full aggregate
depth (82,000 ESALs) is back-calculated by means of AASHTO (1993) to occur at
approximately 94 years after construction. At the 1,500 AADT pavement (also growing at 2%
per year), the 7% threshold is reached at about 327,000 ESALs, or about 18 years after
construction. The corresponding absolute annual rates of contamination are calculated at 0.064
in and 0.341 in, respectively.
The absolute contamination rate parameters used in the LCCA model lie within that
spread: a minimum of 0.05 in per year, 0.1 in per year, and a maximum of 0.2 in per year. These
rates are consistent with the properties of VDOT aggregate and typical VDOT pavement
structures shown in Table B1, as evidenced by the calculation of the contamination rate interval
(0.064, 0.341) based on VDOT values in Table B1. Yet it is important to recognize that the
threshold contamination percentages of fines indicate the point at which the aggregate layer loses
resilient modulus rather than the time when contamination initiates. In fact, without a GTX
separator, the aggregate subbase layer is subjected to contamination virtually concurrently with
the initial traffic loading. Below the threshold value of 7%, the aggregate is contaminated to
some degree; above the 7% threshold, the aggregate has probably lost nearly all of its resilient
modulus and is exhibiting behavior similar to that of the underlying subgrade soil.
The ESAL values shown in Figure B4 are technically ESALs applied while the subgrade
soil is saturated. In other words, if the pavement structure is designed and constructed with an
adequate subsurface drainage system and the subgrade is not allowed to approach full saturation,
then virtually no contamination can occur. Conversely, without separator GTX and assuming
full saturation, subgrade soils will contaminate the aggregate layer, in keeping with the findings
of Kermani et al. and Jorenby and Hicks. Effectively, it means that if the subgrade is saturated
only one-half of its life, the actual contamination rate will be approximately one-half of those
0
1
2
3
4
5
6
7
8
9
0 100 200 300 400 500 600
Co
nta
min
atio
n r
ate
(%)
Equivalent Single Axle Loads (Thousands)
Kermani ESALs
155 AADT
1500 AADT

78
shown. The actual saturation rate over a pavement’s service life, however, is typically
unquantifiable at the time of construction.
Significantly, when Kermani’s contamination rate curve for interstates is applied to a
typical interstate section of I-81 in Virginia (24,000 AADT, 28% tractor trailers, and 3% single
unit trucks), it indicates a contamination rate of approximately 2.47 in/yr. This is a very high
rate of contamination, especially considering the very thick pavement section (17.5 in of
asphalt), but not inconceivable, as shown in Figure 5 in the body of the report.
The remaining design life of each pavement structure is determined for each 5-year
period using the 1993 AASHTO pavement design method (AASHTO, 1993). Figure B5
illustrates the following steps for each calculation:
1. Step 1: Increase traffic data to reflect traffic at time i.
2. Step 2: Reduce structural coefficients of asphalt layers to reflect deterioration at time
i.
3. Step 3: Reduce aggregate layer (if applicable) to reflect contamination at time i.
4. Step 4: Iteratively change Performance Period until Calculated Design Structural
Number (required) equals the Total Calculated Structural Number (of the pavement
structure).
5. Step 5: The Performance Period at which these structural numbers is equal is taken to
be the remaining life of this pavement structure. This value is captured in the
maintenance history for this alternative.
Maintenance activities are determined based on the following decision criteria:
Surface condition: When the structural coefficient of the surface mixture falls below
0.30, overlay or mill/resurfacing is required. Preventive maintenance was modeled as
milling of the existing asphalt surface mixture and inlay with new asphalt surface
mixture. “No Preventive Maintenance” was modeled as simply overlay with new
asphalt surface mixture. In this analysis, the service period of initial surface asphalt
mixtures was taken to be 20 years to reflect typical reduced maintenance on the
secondary roadway system.
Remaining design life: When the remaining design life falls below 5 years (the
duration between the current and next analysis year), some amount of patching is
required. Although not directly known at the time of the maintenance activity in the
field, this is typically intuited through the necessity for patching. No patching is
performed when resurfacing or rebuilding is performed in the same analysis year.

79
Figure B5. Remaining Life Calculation Example
Rehabilitation/rebuild: If the typical maintenance activity (overlay or mill/inlay) does
not result in at least 5 years of remaining design life, rehabilitation or rebuild is
necessary. This pavement design calculation includes engineering judgment,
although the designs in this analysis minimally meet a new design life of 20 years.
However, the first maintenance activity performed consists of overlay or mill/inlay
rather than rehabilitation/rebuild, in accordance with typical maintenance procedures.
These decision criteria are evaluated in 5-year increments for each pavement alternative
for the 50-year analysis period. The maintenance histories determine the pay items input into the

80
LCCA. Some maintenance activities are not intuitive, and some are estimated, including the
following:
Twenty percent of the roadway length (both sides) requires guardrail.
Guardrail replacement is necessary after overlay exceeds 2 in.
Crack sealing is considered a routine maintenance activity common to all pavements
and is therefore not included in the pavement maintenance histories.
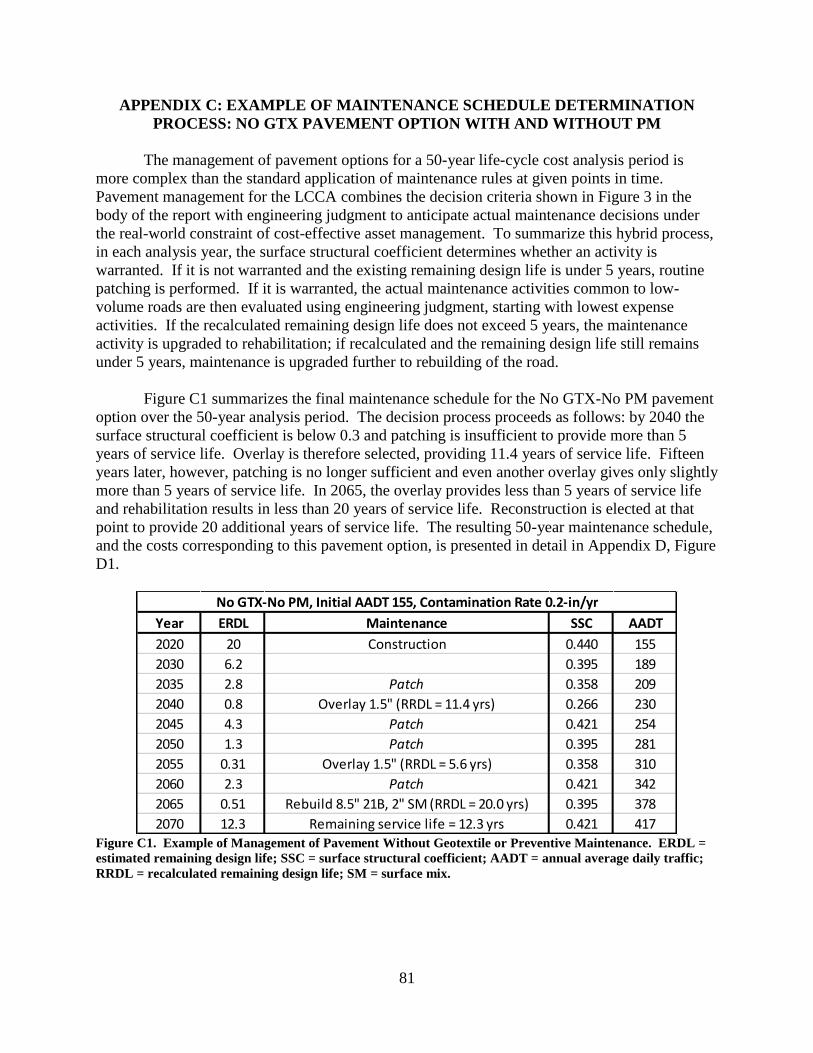
81
APPENDIX C: EXAMPLE OF MAINTENANCE SCHEDULE DETERMINATION
PROCESS: NO GTX PAVEMENT OPTION WITH AND WITHOUT PM
The management of pavement options for a 50-year life-cycle cost analysis period is
more complex than the standard application of maintenance rules at given points in time.
Pavement management for the LCCA combines the decision criteria shown in Figure 3 in the
body of the report with engineering judgment to anticipate actual maintenance decisions under
the real-world constraint of cost-effective asset management. To summarize this hybrid process,
in each analysis year, the surface structural coefficient determines whether an activity is
warranted. If it is not warranted and the existing remaining design life is under 5 years, routine
patching is performed. If it is warranted, the actual maintenance activities common to low-
volume roads are then evaluated using engineering judgment, starting with lowest expense
activities. If the recalculated remaining design life does not exceed 5 years, the maintenance
activity is upgraded to rehabilitation; if recalculated and the remaining design life still remains
under 5 years, maintenance is upgraded further to rebuilding of the road.
Figure C1 summarizes the final maintenance schedule for the No GTX-No PM pavement
option over the 50-year analysis period. The decision process proceeds as follows: by 2040 the
surface structural coefficient is below 0.3 and patching is insufficient to provide more than 5
years of service life. Overlay is therefore selected, providing 11.4 years of service life. Fifteen
years later, however, patching is no longer sufficient and even another overlay gives only slightly
more than 5 years of service life. In 2065, the overlay provides less than 5 years of service life
and rehabilitation results in less than 20 years of service life. Reconstruction is elected at that
point to provide 20 additional years of service life. The resulting 50-year maintenance schedule,
and the costs corresponding to this pavement option, is presented in detail in Appendix D, Figure
D1.
Figure C1. Example of Management of Pavement Without Geotextile or Preventive Maintenance. ERDL =
estimated remaining design life; SSC = surface structural coefficient; AADT = annual average daily traffic;
RRDL = recalculated remaining design life; SM = surface mix.
Year ERDL Maintenance SSC AADT
2020 20 Construction 0.440 155
2030 6.2 0.395 189
2035 2.8 Patch 0.358 209
2040 0.8 Overlay 1.5" (RRDL = 11.4 yrs) 0.266 230
2045 4.3 Patch 0.421 254
2050 1.3 Patch 0.395 281
2055 0.31 Overlay 1.5" (RRDL = 5.6 yrs) 0.358 310
2060 2.3 Patch 0.421 342
2065 0.51 Rebuild 8.5" 21B, 2" SM (RRDL = 20.0 yrs) 0.395 378
2070 12.3 Remaining service life = 12.3 yrs 0.421 417
No GTX-No PM, Initial AADT 155, Contamination Rate 0.2-in/yr

82
Figure C2 summarizes the final maintenance schedule for the No GTX-PM pavement
option over the 50-year analysis period. The reasoning in Figure 3 in the body of the report
governs maintenance decisions made for this pavement scenario, as it does for the scenario
shown in Figure C1. The 50-year maintenance schedule for this pavement scenario is shown in
detail in Figure D2 in Appendix D. Figures D1 and D2 show that Preventive Maintenance in the
LCCA model includes milling of deteriorated pavement whereas pavements without preventive
maintenance are overlaid without surface milling.
Figure C2. Example of Management of Pavement Without Geotextile But With Preventive Maintenance.
ERDL = estimated remaining design life; SSC = surface structural coefficient; AADT = annual average daily
traffic; RRDL = recalculated remaining design life; SM = surface mix.
Year ERDL Maintenance SSC AADT
2020 20.0 Construction 0.440 155
2030 6.2 0.395 189
2035 2.8 Patch 0.358 209
2040 0.80 Mill/Inlay 1.5" (RRDL = 2.6 yrs) 0.266 230
2045 1.2 Patch 0.421 254
2050 0.51 Rebuild 8" 21B, 2" SM (RRDL = 22.5 yrs) 0.395 281
2055 13.4 0.421 310
2060 7.2 0.395 342
2065 3.3 Patch 0.358 378
2070 0.82 Mill/Inlay 2" (RRDL = 3.5 yrs) 0.266 417
No GTX-PM, Initial AADT 155, Contamination Rate 0.2-in/yr

83
APPENDIX D: EXAMPLES OF PAVEMENT MAINTENANCE SCHEDULES WITH
AND WITHOUT PREVENTIVE MAINTENANCE
Figure D1. Maintenance Schedule for No GTX-No PM Pavement Option, Initial AADT 155, Contamination
Rate 0.2 in/yr. AADT = annual average daily traffic.
Mainline - HMA Surface 1.5 1,156 Tons 93$ 107,052$ 107,052$
Mainline - 21B 8 6,420 Tons 23$ 146,515$ 146,515$
Maintenance of Traffic 1.00 LS 10,000$ 10,000$ 10,000$
263,567$ 263,567$ CEI (15%) 39,535$ 39,535$
303,103$ 303,103$
Mainline - Patching 44% 1.5 509 Tons 350$ 178,073$ 98,878$
Maintenance of Traffic 1.00 LS 10,000$ 10,000$ 5,553$
188,073$ 104,430$
CEI (5%) 9,404$ 5,222$
197,477$ 109,652$
Mainline - Overlay HMA Surface1.5 1,156 Tons 93$ 107,052$ 48,857$
Maintenance of Traffic 1.00 LS 10,000$ 10,000$ 4,564$
117,052$ 53,421$
CEI (5%) 5,853$ 2,671$
122,905$ 56,092$
Mainline - Patching 14% 1.5 162 Tons 350$ 56,660$ 21,254$
Maintenance of Traffic 1.00 LS 10,000$ 10,000$ 3,751$
66,660$ 25,005$
CEI (5%) 3,333$ 1,250$
69,993$ 26,255$
Mainline - Patching 74% 1.5 856 Tons 350$ 299,487$ 92,337$
Maintenance of Traffic 1.00 LS 10,000$ 10,000$ 3,083$
309,487$ 95,421$
CEI (5%) 15,474$ 4,771$
324,961$ 100,192$
Mainline - Overlay HMA Surface1.5 1,156 Tons 93$ 107,052$ 27,129$
Maintenance of Traffic 1.00 LS 10,000$ 10,000$ 2,534$
117,052$ 29,663$
CEI (5%) 5,853$ 1,483$
122,905$ 31,146$
Mainline - Patching 54% 1.5 624 Tons 350$ 218,544$ 45,520$
Maintenance of Traffic 1.00 LS 10,000$ 10,000$ 2,083$
228,544$ 47,603$
CEI (5%) 11,427$ 2,380$
239,972$ 49,983$
Demolition of Pavement 14,080 SY 12$ 168,960$ 28,926$
Mainline - HMA Surface 2 1,542 Tons 91$ 139,529$ 23,887$
Mainline - 21B 8.5 6,822 Tons 23$ 154,786$ 26,499$
Maintenance of Traffic 1.00 LS 10,000$ 10,000$ 1,712$
473,275$ 81,024$
CEI (15%) 70,991$ 12,154$
544,266$ 93,178$
12.3 years PV of 50-year Cost 769,601$ Remaining Useful Life207050
205535
206040
206545
204020
204525
205030
Unit Cost Total Present Value
20200
Depth
(in)Quantity Unit
203515
Analysis
Year
Calendar
YearActivity
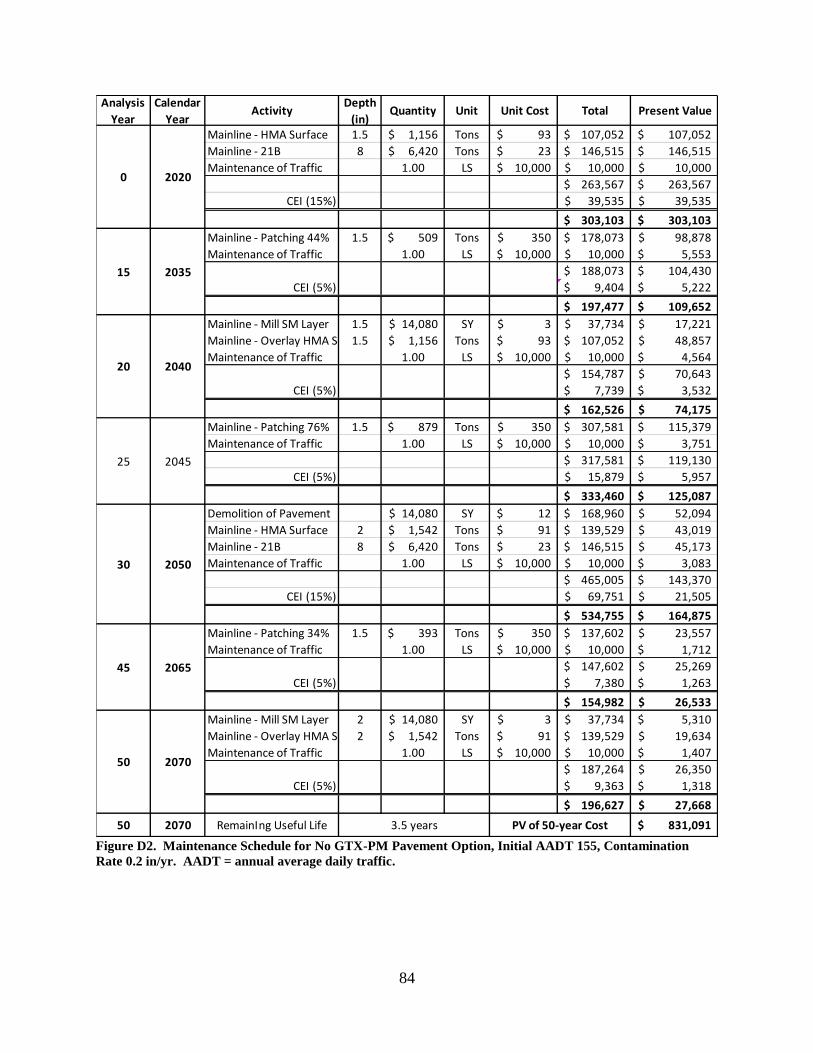
84
Figure D2. Maintenance Schedule for No GTX-PM Pavement Option, Initial AADT 155, Contamination
Rate 0.2 in/yr. AADT = annual average daily traffic.
Mainline - HMA Surface 1.5 1,156$ Tons 93$ 107,052$ 107,052$
Mainline - 21B 8 6,420$ Tons 23$ 146,515$ 146,515$
Maintenance of Traffic 1.00 LS 10,000$ 10,000$ 10,000$
263,567$ 263,567$
CEI (15%) 39,535$ 39,535$
303,103$ 303,103$
Mainline - Patching 44% 1.5 509$ Tons 350$ 178,073$ 98,878$
Maintenance of Traffic 1.00 LS 10,000$ 10,000$ 5,553$
188,073$ 104,430$
CEI (5%) 9,404$ 5,222$
197,477$ 109,652$
Mainline - Mill SM Layer 1.5 14,080$ SY 3$ 37,734$ 17,221$
Mainline - Overlay HMA Surface1.5 1,156$ Tons 93$ 107,052$ 48,857$
Maintenance of Traffic 1.00 LS 10,000$ 10,000$ 4,564$
154,787$ 70,643$
CEI (5%) 7,739$ 3,532$
162,526$ 74,175$
Mainline - Patching 76% 1.5 879$ Tons 350$ 307,581$ 115,379$
Maintenance of Traffic 1.00 LS 10,000$ 10,000$ 3,751$
317,581$ 119,130$
CEI (5%) 15,879$ 5,957$
333,460$ 125,087$
Demolition of Pavement 14,080$ SY 12$ 168,960$ 52,094$
Mainline - HMA Surface 2 1,542$ Tons 91$ 139,529$ 43,019$
Mainline - 21B 8 6,420$ Tons 23$ 146,515$ 45,173$
Maintenance of Traffic 1.00 LS 10,000$ 10,000$ 3,083$
465,005$ 143,370$
CEI (15%) 69,751$ 21,505$
534,755$ 164,875$
Mainline - Patching 34% 1.5 393$ Tons 350$ 137,602$ 23,557$
Maintenance of Traffic 1.00 LS 10,000$ 10,000$ 1,712$
147,602$ 25,269$
CEI (5%) 7,380$ 1,263$
154,982$ 26,533$
Mainline - Mill SM Layer 2 14,080$ SY 3$ 37,734$ 5,310$
Mainline - Overlay HMA Surface2 1,542$ Tons 91$ 139,529$ 19,634$
Maintenance of Traffic 1.00 LS 10,000$ 10,000$ 1,407$
187,264$ 26,350$
CEI (5%) 9,363$ 1,318$
196,627$ 27,668$
3.5 years PV of 50-year Cost 831,091$
206545
207050
RemainIng Useful Life207050
204020
204525
205030
203515
Present Value Total Unit Cost UnitQuantityDepth
(in)Activity
Calendar
Year
Analysis
Year
20200

85
APPENDIX E: PROPOSED SPECIAL PROVISION FOR SUBGRADE SEPARATION
AND SUBGRADE STABILIZATION GEOTEXTILES
VIRGINIA DEPARTMENT OF TRANSPORTATION
SPECIAL PROVISION FOR
SUBGRADE SEPARATION AND SUBGRADE STABILIZATION GEOTEXTILES
October 7, 2019
SECTION 245.03(d) – Geotextile for Use in Stabilization of the Specifications is replaced with
the following:
Geotextile for Use in Separation and Stabilization: These areSeparation geotextiles
are used as a permeable layer to separate fine-grained subgrades and aggregate base or
subbase. Stabilization geotextiles are used in saturated and/or unstable conditions to
provide the functions of separation and reinforcement.
1. Subgrade SeparationStabilization Fabric:
Physical Property Test Method Requirements
Apparent opening size ASTM D 4751 Max. No. 7020 (0.212 mm)
sieve
Permittivity ASTM D4491 Min. 0.1 sec-1
In addition to this requirement, tThe geotextile shall comply with the requirements of
AASHTO M 288 for strength property requirements, Table 1, Class 32, for grab
strength, tear strength, and puncture strength. Only nonwoven geotextiles shall be
used as subgrade separation geotextiles.
2. Subgrade Stabilization Fabric:
Physical Property Test Method Requirements
Apparent opening size ASTM D4751 Max. No. 70 (0.212 mm)
sieve
Permittivity ASTM D4491 Min. 0.1 sec-1
The geotextile shall comply with the requirements of AASHTO M 288 for strength
property requirements, Table 1, Class 1, for grab strength, tear strength, and
puncture strength. Geotextiles used for subgrade stabilization shall be woven or
nonwoven.

86
3. Embankment Stabilization Fabric Up to 6 Feet High:
Physical Property Test Method Requirements
Apparent opening size ASTM D 4751 Max. No. 20 sieve
Seam strength ASTM D 4632 90% specified grab
strength
In addition to this requirement, tThe geotextile shall comply with the requirements
of AASHTO M288 for strength property requirements, Table 1, Class 1 for grab
strength, tear strength, and puncture strength.
SECTION 305.03(d) – Geotextile (Subgrade Stabilization) of the Specifications is replaced
with the following:
Geosynthetics: Geosynthetics include Geotextile (Subgrade Separation) and Geotextile
(Subgrade Stabilization) in accordance with Section 245, and geogrid.
1. Subsurface preparation: Before placing the geotextile, geogrid, or
combination of both, prepare the subgrade in accordance with Sections 304
and 305. Separation and stabilization geotextiles shall not be placed when
weather conditions, in the opinion of the Engineer, are not suitable to allow
placement of geotextiles or cover materials. These include wet or snowy
conditions, rainfall, temperatures below freezing, frost, extreme heat, or
excessively windy conditions.
2. Geotextile or geogrid placement. Place geogrid on top of geotextile when
both are shown at the same elevation in the plans. Place the geosynthetic in
the direction of traffic. Geosynthetic shall be smooth and free of wrinkles and
folds. Placement by dragging the geosynthetic across the finished surface will
not be allowed. On curves, the geotextile may be folded or cut to conform to
the curve. The fold or overlap shall be in the direction of traffic and held in
place by pins, staples or piles of aggregate subbase or base materials.
Overlap in the direction of construction. Overlap at least 24 inches at the ends
and sides of adjoining sheets or sew the joints according to the
Manufacturer’s recommendations. Do not place longitudinal overlaps below
anticipated wheel loads or joints. Hold the geosynthetic in place with pins,
staples, or piles of aggregate subbase or base materials.
Replace or repair geosynthetic that is torn or punctured. Remove the damaged
area and place a patch of the same type of geosynthetic overlapping 36 inches
beyond the damaged area or sew a seam around the entire perimeter of the
damaged area.
3. Initial layer placement and compaction: Place initial layer in accordance
with Sections 308 and 309.

87
Tracked equipment shall not be operated directly on top of geosynthetic.
Rubber-tire equipment may pass over the geosynthetic at lower speed without
causing excessive rutting (2 inches or greater) or causing damage to the
geosynthetic. Contractor shall avoid sudden braking or sharp turning.
If equipment causes subgrade rutting in excess of 2 inches, end dump the
backfill material onto the geotextile or geogrid from the edge of the
geosynthetic or from previously placed cover material. Do not operate
equipment directly on the geosynthetic. Spread the end-dumped pile of cover
material maintaining the minimum specified lift thickness over the
geosynthetic. Avoid sudden stops, starts, or turns of the construction
equipment. Fill ruts from construction equipment with additional cover
material. Do not blade material down to remove ruts. If rutting exceeds 2
inches during placement, decrease the construction equipment size, decrease
the equipment weight, or increase the first lift thickness as directed by the
Engineer.
Compact in accordance with Sections 308 and 309. Do not use sheepsfoot or
studded compaction equipment. Compact the cover material with pneumatic-
tire or non-vibratory smooth drum rollers.
4. Subsequent layer placement and compaction. Place and compact subsequent
layers in accordance with Sections 308 and 309.
(d) Geotextile (Subgrade Stabilization) : When geotextile for subgrade stabilization is
required, it shall be placed as shown on the plans. Geotextile shall be spliced by an overlap
of at least 2 feet or by sewing double-stitched seams with stitching spaced ¼ inch to ½ inch
apart or as shown on the plans.
SECTION 305.04 – Measurement and Payment of the Specifications is amended to add the
following:
Geotextile for subgrade stabilization will be measured in square yards, complete-in-
place. Overlaps and seams will not be measured for separate payment. The accepted
quantity of geotextile will be paid for at the contract unit price per square yard price. This
price shall include furnishing, placing, lapping, or seaming material.
Payment will be made under:
Pay Item Pay Unit
Geotextile (Subgrade Separation) SY
Geotextile (Subgrade Stabilization) SY