Embed Size (px)
Citation preview
Use of GIS Data for Audits of Forest
Neelesh Kumar SahIAAS, B.Tech, PGDBM, CIA, CISA
Accountant General (A&E)-I, U.P., Allahabad
Office of the Comptroller and Auditor General of India
Media reporting on CAG’s report
ARE WE REALLY GREEN?
• Country's forest cover has increased by only about 2,000 sq km over 2010-2012 (a 0.29% increase) and not by 5,871 sq km, as the recently released "Indian State of Forest Report 2013" claims
• The 3,810 sq km of increase in the forest cover in West Bengal is really not an increase. It is only an accounting correction in the 2010 data, which had not captured the forest patch in West Bengal due to poor quality satellite data
• The Statistical Year Book 2014 of the government claims that in the 11th Five Year Plan period about 1,000 sq km of land was turned green through an afforestation programme that cost the country nearly Rs 2,000 crore
• Additionally, an amount of Rs 30,000 crore has been collected since 2006 from industry for additional compensatory afforestation
• Comptroller and Auditor General in its report of 2013 has noted only 7% of the targeted 103 sq km of afforestation was achieved against this sum (up to 2012) - much of the money is lying idle and badly accounted for
-Business Standard
GIS
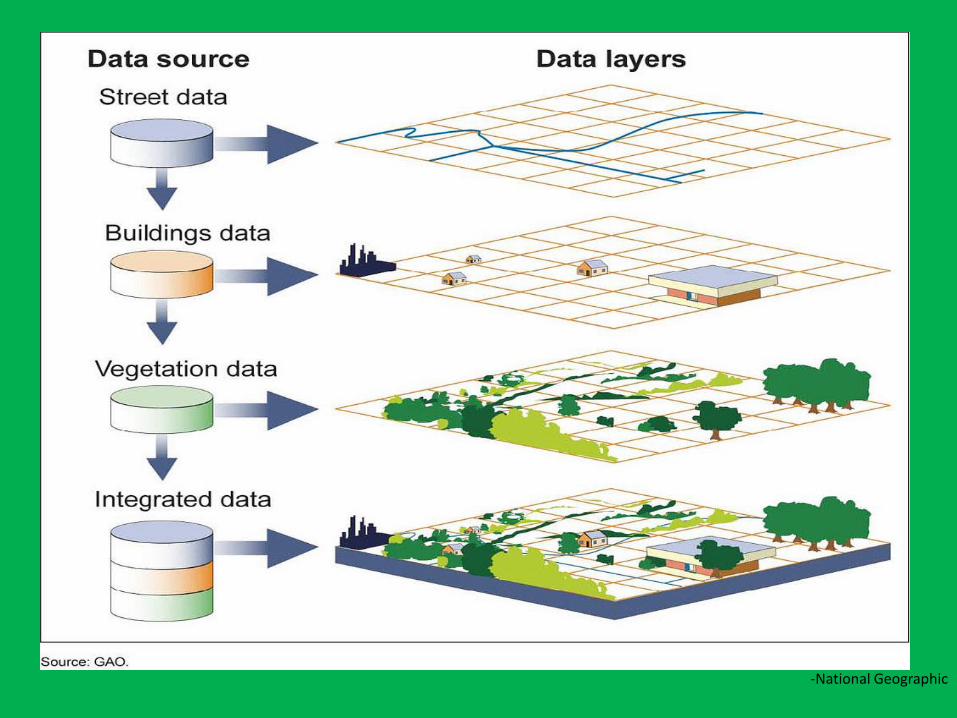
• A geographic information system (GIS) is a computer system for capturing, storing, checking, and displaying data related to positions on Earth’s surface. GIS can show many different kinds of data on one map. This enables people to more easily see, analyze, and understand patterns and relationships.
-National Geographic
GIS
• A Geographic Information System (GIS) is a computer-based tool for mapping and analyzing things that exist and events that happen on earth. GIS technology integrates common database operations such as query and statistical analysis with the unique visualization and geographic analysis benefits offered by maps.
• A system that provides a medium for representation, storage and manipulation of geographic information in terms of a database.
-NIC Primer on GIS
-National Geographic

GIS and Computers
• GIS incorporates graphical features with tabular data in order to assess real-world problems. This system came into being with the discovery of the fact that maps could be programmed using simple code and then stored in a computer allowing for future modification when necessary. This was a welcome change from the era of hand Cartography when maps had to be painstakingly created by hand.
Components of GIS
• Hardware
• Software
• Data– Spatial
– Attribute
• Users– System
– End
– Data generators
Functions
• Digital Capture– Digitisation
• Manual• Scanning
– Remote Sensing (Satellite)– GPS
• Digital Compilation– Relating spatial features to attributes– Cleaning– Correcting errors
• Digital Storage– Data Model
• Raster• Vector • Image

Vector_Raster
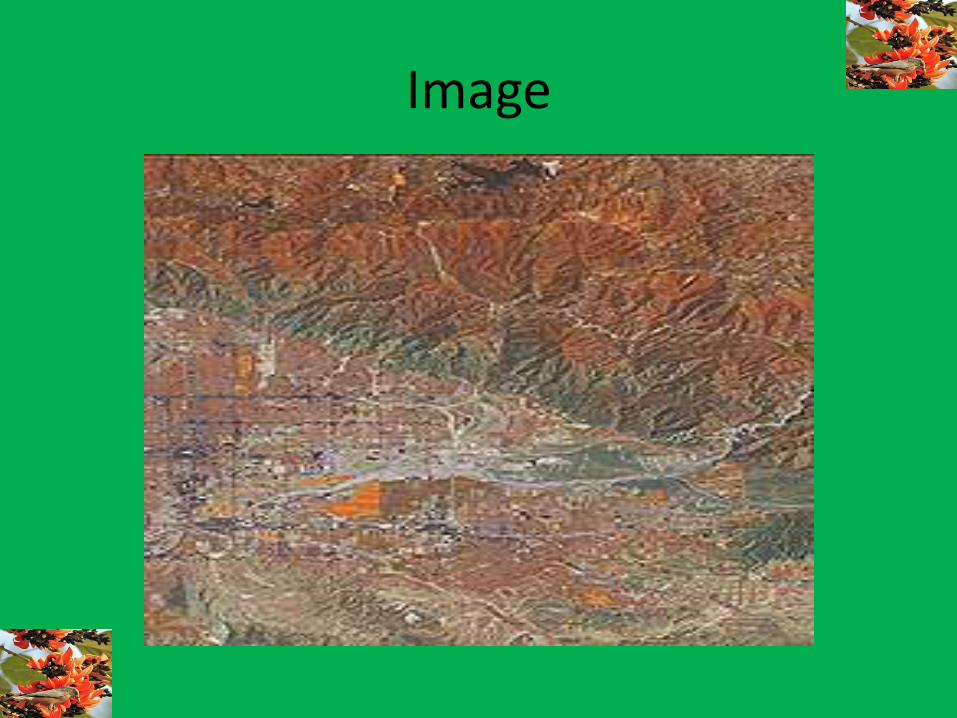
Image

Image
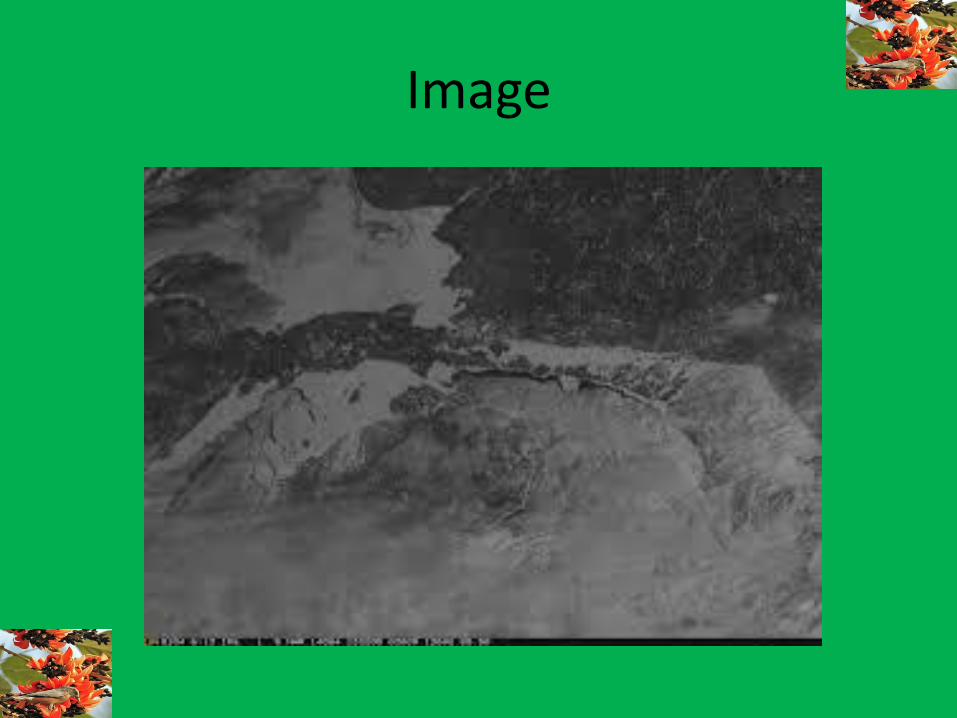
Image

Functions
• Manipulations– Data retrieval– Measuring area and perimeter– Overlaying maps– Performing map algebra
– Reclassifying map data
• Analysis– Database Query– Overlay– Proximity Analysis– Network Analysis– Statistical and Tabular Analysis
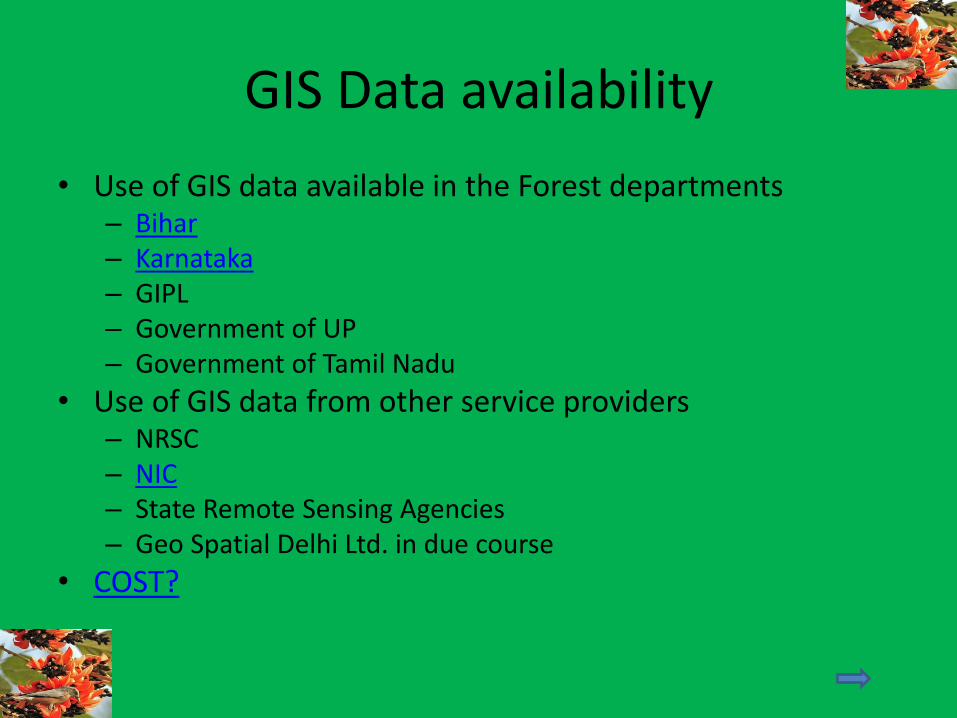
GIS Data availability
• Use of GIS data available in the Forest departments– Bihar– Karnataka– GIPL– Government of UP– Government of Tamil Nadu
• Use of GIS data from other service providers – NRSC– NIC– State Remote Sensing Agencies– Geo Spatial Delhi Ltd. in due course
• COST?
Use of GIS in Audit
• Assessing relevant risks
• Designing the audit
• Conducting the audit
• Analysing audit results and
• Communicating audit results
Checklist for use of geospatial data in audit
• What geospatial data is needed to answer the audit questions?• What accuracy is required of the geospatial data?• What is the required timeframe of the geospatial data?• What geospatial data is available?• From which sources can the required geospatial data been derived
from and how reliable are they?• What is the quality of the available geospatial data?• What are the costs of the available geospatial data?• If the required geospatial data are not available, could they be
gathered as part of the audit process and budget?• Do the auditors involved have the required knowledge to gather
and analyse the required geospatial data or should external expertise be sourced?
- ISSAI 5540
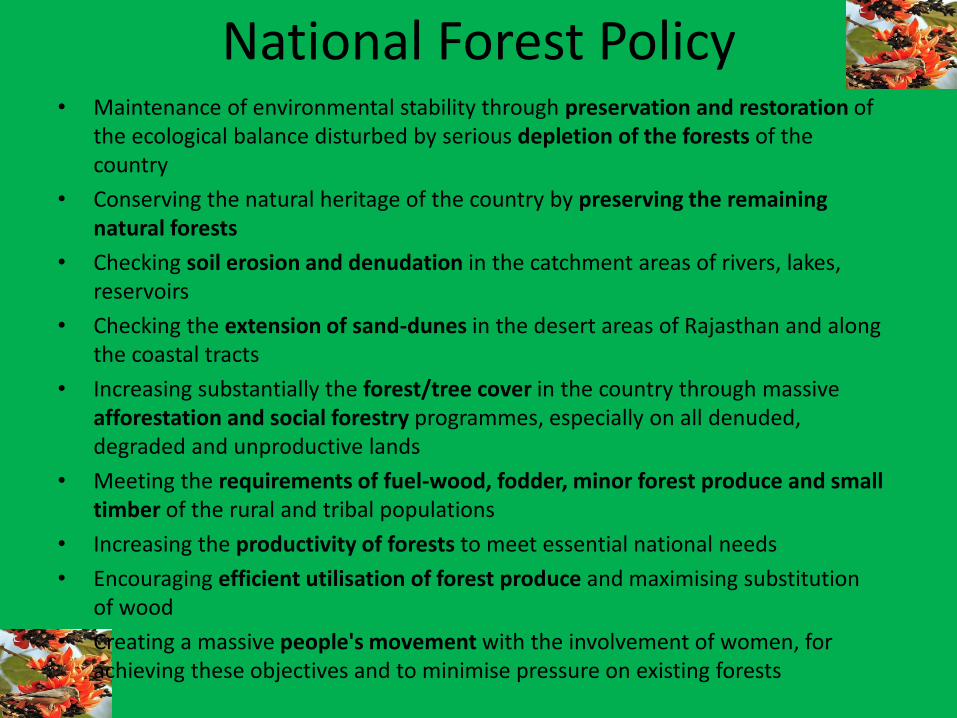
National Forest Policy• Maintenance of environmental stability through preservation and restoration of
the ecological balance disturbed by serious depletion of the forests of the country
• Conserving the natural heritage of the country by preserving the remaining natural forests
• Checking soil erosion and denudation in the catchment areas of rivers, lakes, reservoirs
• Checking the extension of sand-dunes in the desert areas of Rajasthan and along the coastal tracts
• Increasing substantially the forest/tree cover in the country through massive afforestation and social forestry programmes, especially on all denuded, degraded and unproductive lands
• Meeting the requirements of fuel-wood, fodder, minor forest produce and small timber of the rural and tribal populations
• Increasing the productivity of forests to meet essential national needs
• Encouraging efficient utilisation of forest produce and maximising substitution of wood
• Creating a massive people's movement with the involvement of women, for achieving these objectives and to minimise pressure on existing forests

Objectives of Audits for Forest
???
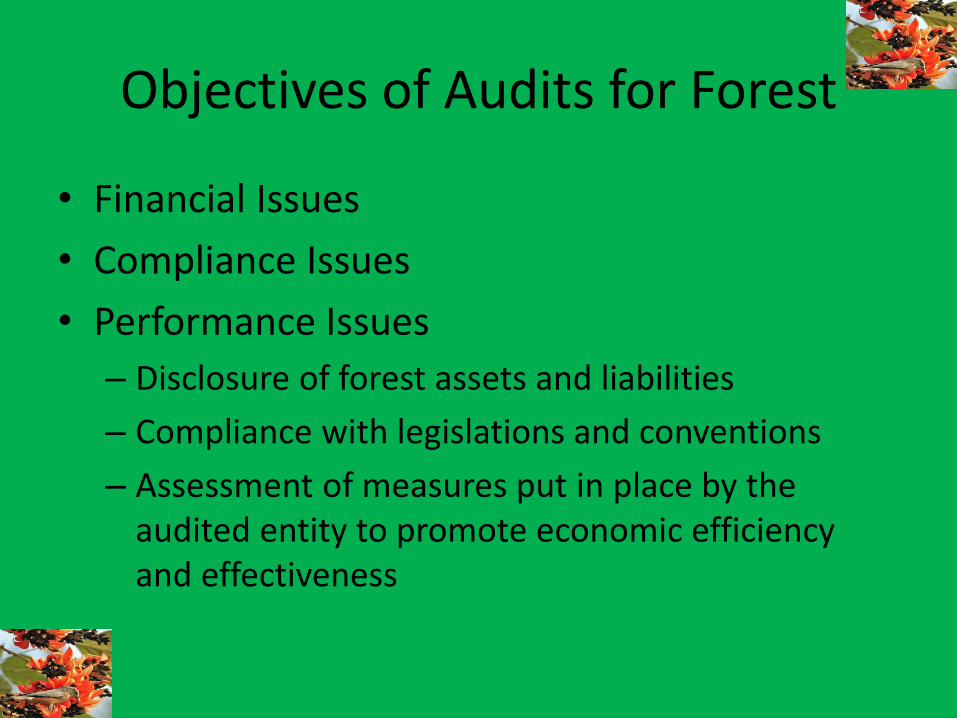
Objectives of Audits for Forest
• Financial Issues
• Compliance Issues
• Performance Issues
– Disclosure of forest assets and liabilities
– Compliance with legislations and conventions
– Assessment of measures put in place by the audited entity to promote economic efficiency and effectiveness
Objectives of Audits for Forest
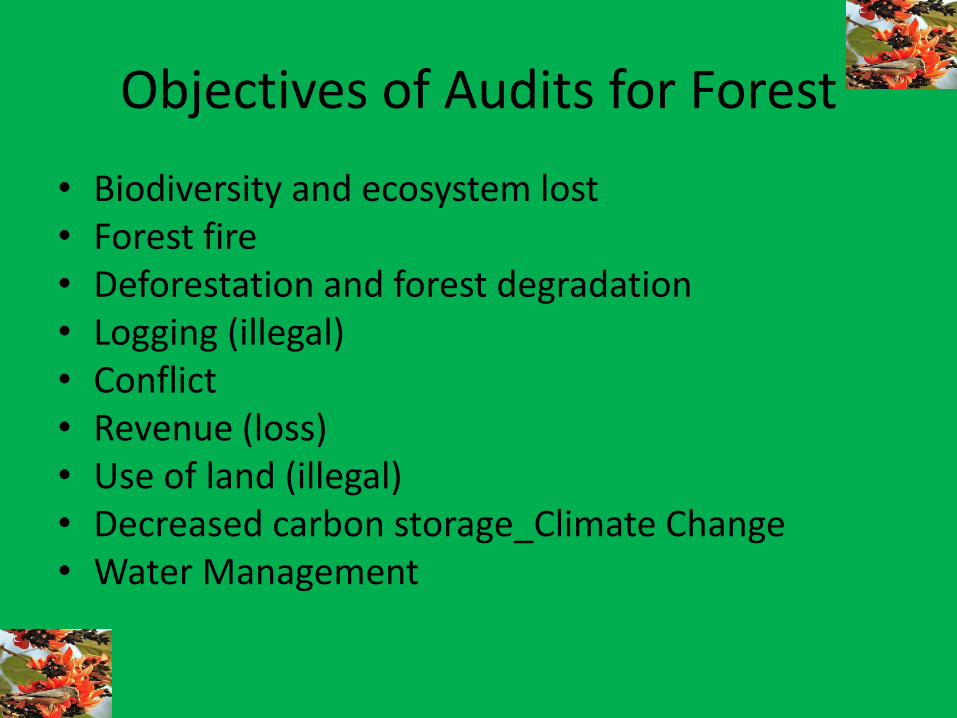
• Biodiversity and ecosystem lost• Forest fire• Deforestation and forest degradation• Logging (illegal)• Conflict• Revenue (loss)• Use of land (illegal)• Decreased carbon storage_Climate Change• Water Management
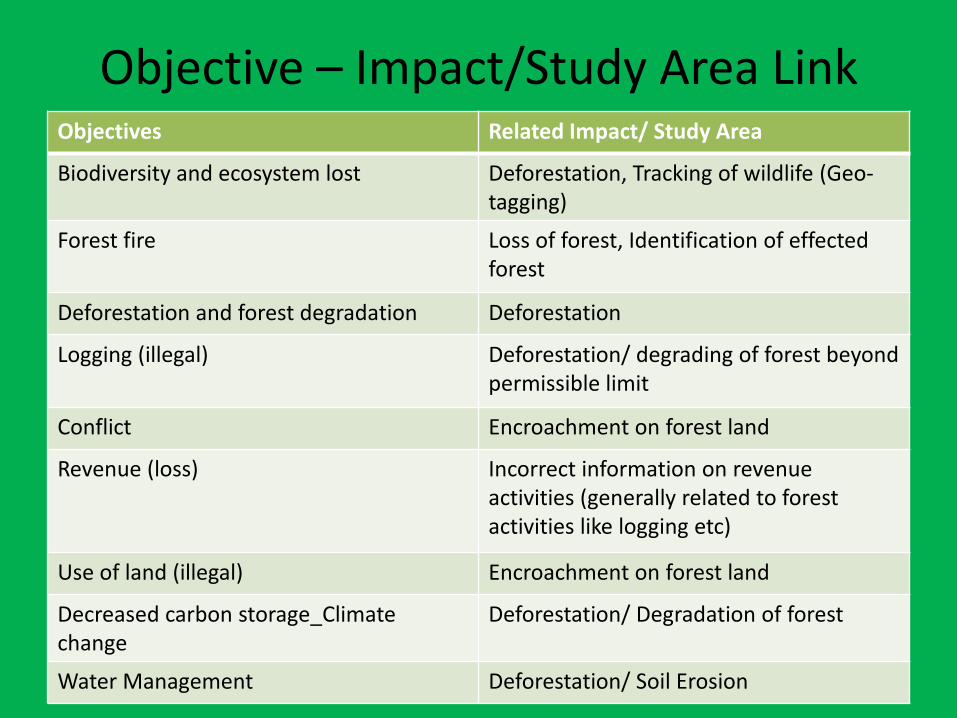
Objective – Impact/Study Area LinkObjectives Related Impact/ Study Area
Biodiversity and ecosystem lost Deforestation, Tracking of wildlife (Geo-tagging)
Forest fire Loss of forest, Identification of effected forest
Deforestation and forest degradation Deforestation
Logging (illegal) Deforestation/ degrading of forest beyond permissible limit
Conflict Encroachment on forest land
Revenue (loss) Incorrect information on revenue activities (generally related to forest activities like logging etc)
Use of land (illegal) Encroachment on forest land
Decreased carbon storage_Climatechange
Deforestation/ Degradation of forest
Water Management Deforestation/ Soil Erosion
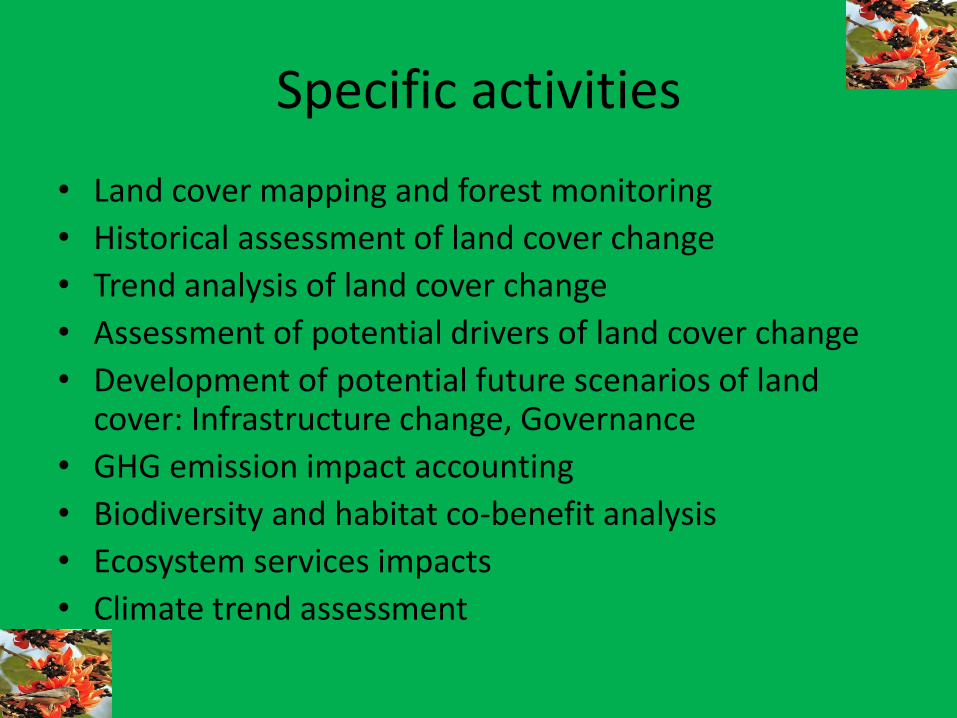
Specific activities
• Land cover mapping and forest monitoring
• Historical assessment of land cover change
• Trend analysis of land cover change
• Assessment of potential drivers of land cover change
• Development of potential future scenarios of land cover: Infrastructure change, Governance
• GHG emission impact accounting
• Biodiversity and habitat co-benefit analysis
• Ecosystem services impacts
• Climate trend assessment
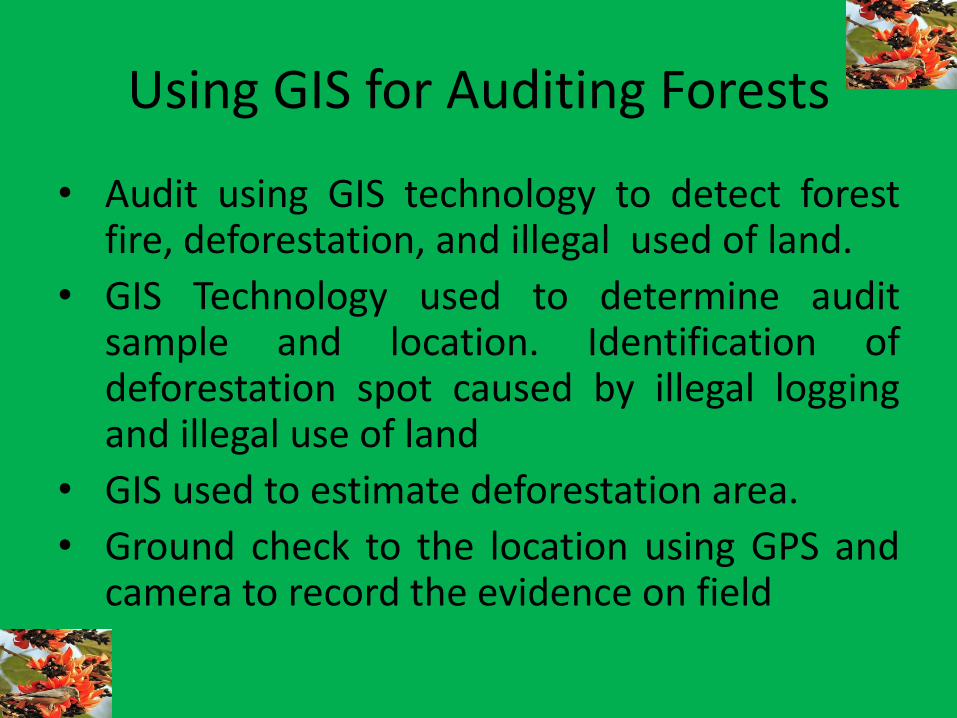
Using GIS for Auditing Forests
• Audit using GIS technology to detect forestfire, deforestation, and illegal used of land.
• GIS Technology used to determine auditsample and location. Identification ofdeforestation spot caused by illegal loggingand illegal use of land
• GIS used to estimate deforestation area.
• Ground check to the location using GPS andcamera to record the evidence on field
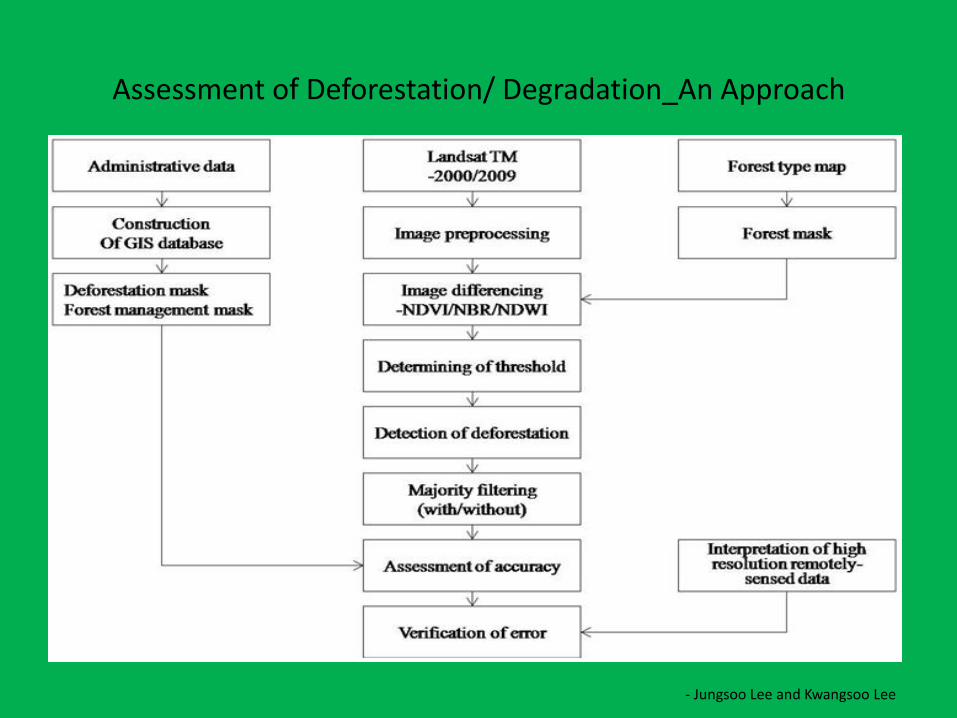
Assessment of Deforestation/ Degradation_An Approach
- Jungsoo Lee and Kwangsoo Lee
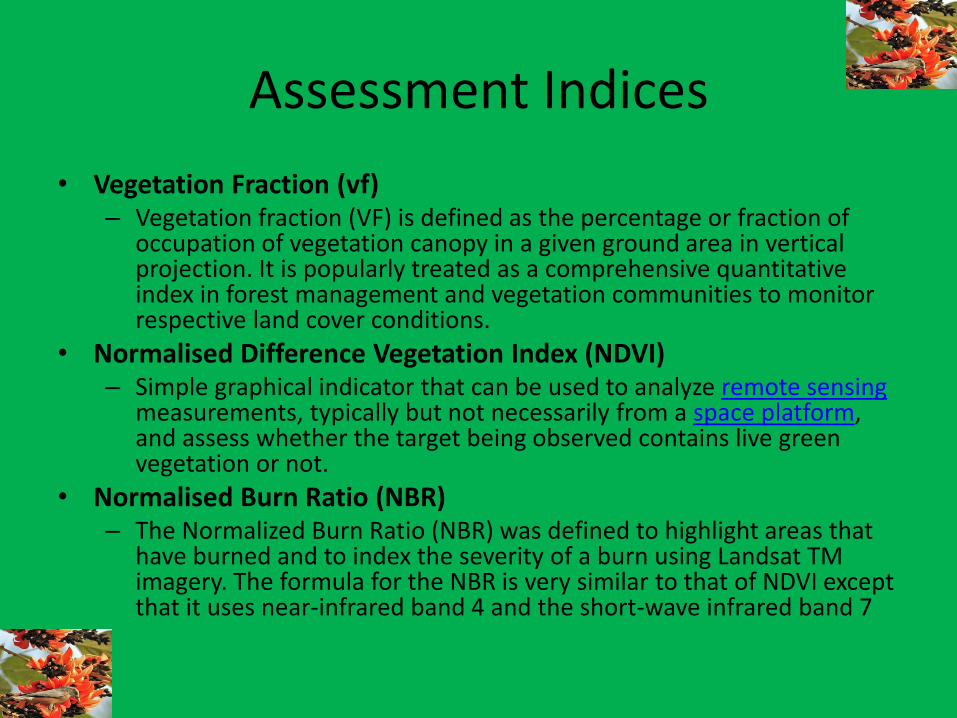
Assessment Indices
• Vegetation Fraction (vf) – Vegetation fraction (VF) is defined as the percentage or fraction of
occupation of vegetation canopy in a given ground area in vertical projection. It is popularly treated as a comprehensive quantitative index in forest management and vegetation communities to monitor respective land cover conditions.
• Normalised Difference Vegetation Index (NDVI)– Simple graphical indicator that can be used to analyze remote sensing
measurements, typically but not necessarily from a space platform, and assess whether the target being observed contains live green vegetation or not.
• Normalised Burn Ratio (NBR)– The Normalized Burn Ratio (NBR) was defined to highlight areas that
have burned and to index the severity of a burn using Landsat TM imagery. The formula for the NBR is very similar to that of NDVI except that it uses near-infrared band 4 and the short-wave infrared band 7
Good to know…
• NDVI of some special features will be similar to that of vegetation. It is difficult to identify vegetation and non-vegetation areas by using only the NDVI data, and land cover classification map is needed. Land use/land cover (LULC) classification map is used to delineate vegetation areas from the non-vegetated ones. LULC map was available for the entire country at a scale of 1:250, 000.
http://www.nrsc.gov.in/Data_Products_Services_Geophysical_Products.html
CAMPA
CASE STUDY
CAMPA
• CAMPA – Compensatory Afforestation Fund Management and Planning Authority
• State of Forest:– 770 lakh hectare ~ 23.41% of total geographical land
area– Gradual increase in forest cover over years
• Diversion of forest– Construction, power projects, irrigation projects,
roads, railways, schools, hospitals, rural electrification, telecommunication, drinking water facilities, mining etc.

CAMPA
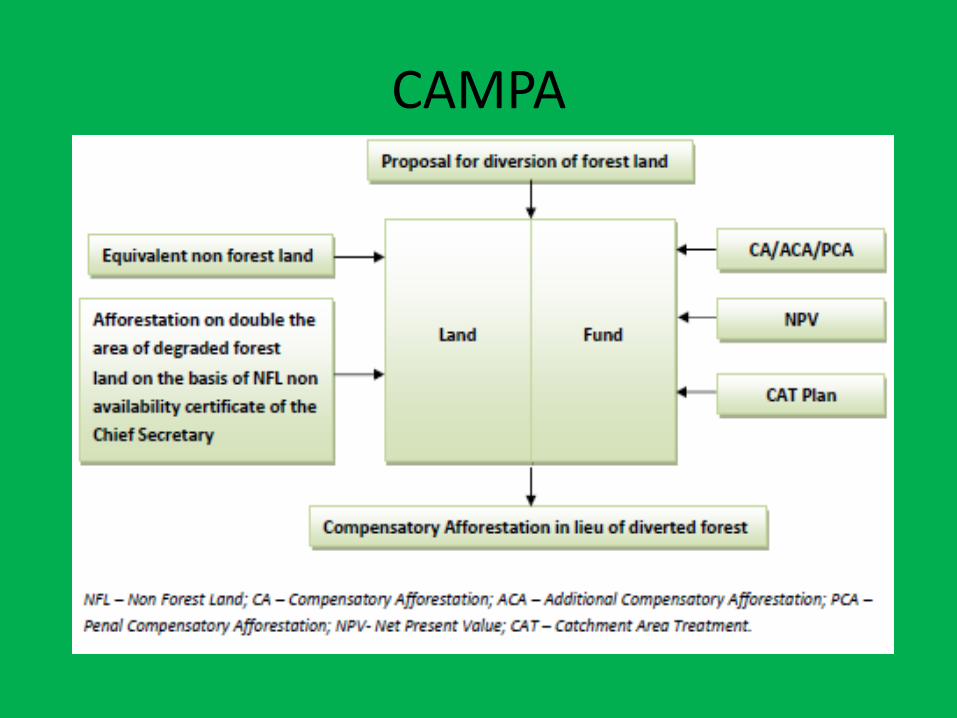
• Conditions on diversion– Equivalent non forest land for compensatory
afforestation– Funds for raising compensatory afforestation– If land not available in the state/ UT, fund for raising
CA in double the area had to be provided on the certificate of non availability of non forest land from the CS
– For government/ central undertaking projects, and some other projects, CA to be raised on degraded forest land twice the forest area being diverted without insisting on the certificate of CS
CAMPA
• Funding
– For compensatory afforestation
– For regeneration
CAMPA
• Proposals
– A comprehensive scheme of compensatory afforestation to be submitted with every proposal
• Details of CA
– Area identified for CA
– Year wise phased forestry operations
– Details of species
– Cost structure of operations
CAMPA
CAMPA
• Supreme Court– Put a stop to all on-going activity like functioning of saw
mills and mining within any forest in any state throughout the country that was being carried out without the approval of Central Government (December 1996)
– Fixed responsibility of ensuring the CA on MoEF• Monitoring conditions stipulated at the time of clearance (April
2000)
– Ordered setting up of Centrally Empowered Committee for monitoring implementation of court’s orders• Creation of CA fund
– Adhoc CAMPA
CAMPA
• Themes– Regulatory shortcomings in diversion of forest
land;
– Failure to promote compensatory afforestation;
– Diversion of forest land for grant/ renewal of mining leases;
– Environmental issues;
– Other issues of land management; and
– Inadequate and ineffective application of penal clause.
CAMPA
• Audit Objectives– Whether the diversion of forest land for non forest use was
permitted as per extant laws and all conditions in this regard were complied with
– Whether measures taken for conservation, afforestation and preservation of forest lands consequent to diversion of portions of these lands for non forest use were as per provisios of extant legislation, rules and SC judgements
– Whether the collection, utilisation, monitoring, accounting and arrangements for safeguarding of compensatory afforestationfunds was in compliance with applicable legislation, rules and SC judgements permitting diversion of forest land for non forest purposes
– Whether proper financial procedures had been followed in investing fund
CAMPA
• Findings
– Diversion of forest land for CA
– Collection of CA Funds
– Utilisation of CA funds
CAMPA_Use of GIS
• Purpose
– strengthen the quality of audit evidence
– verification of actual afforestation
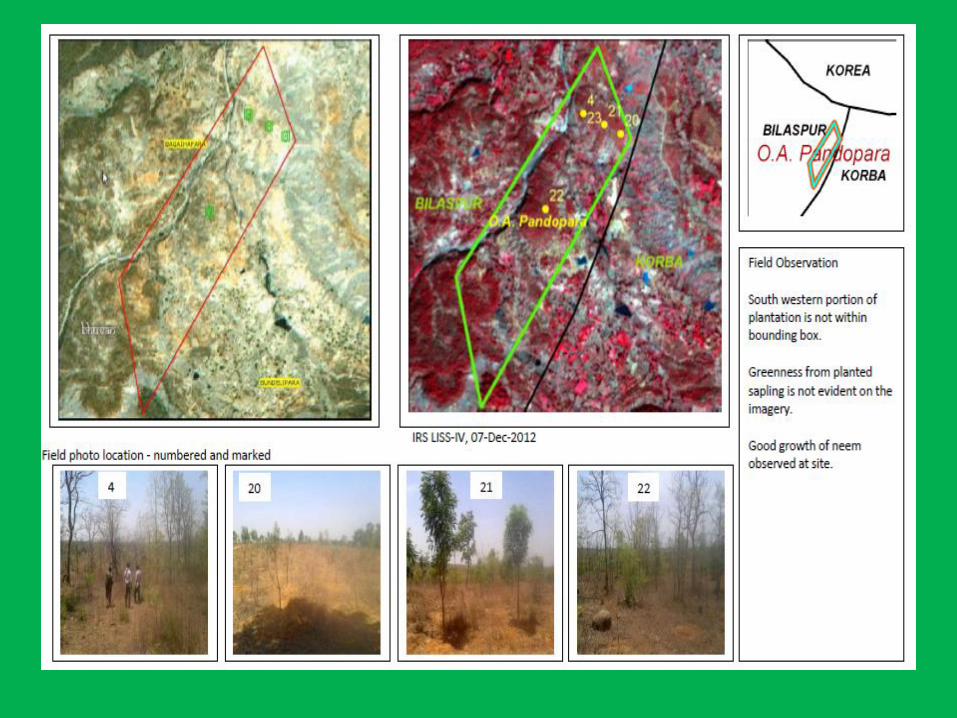
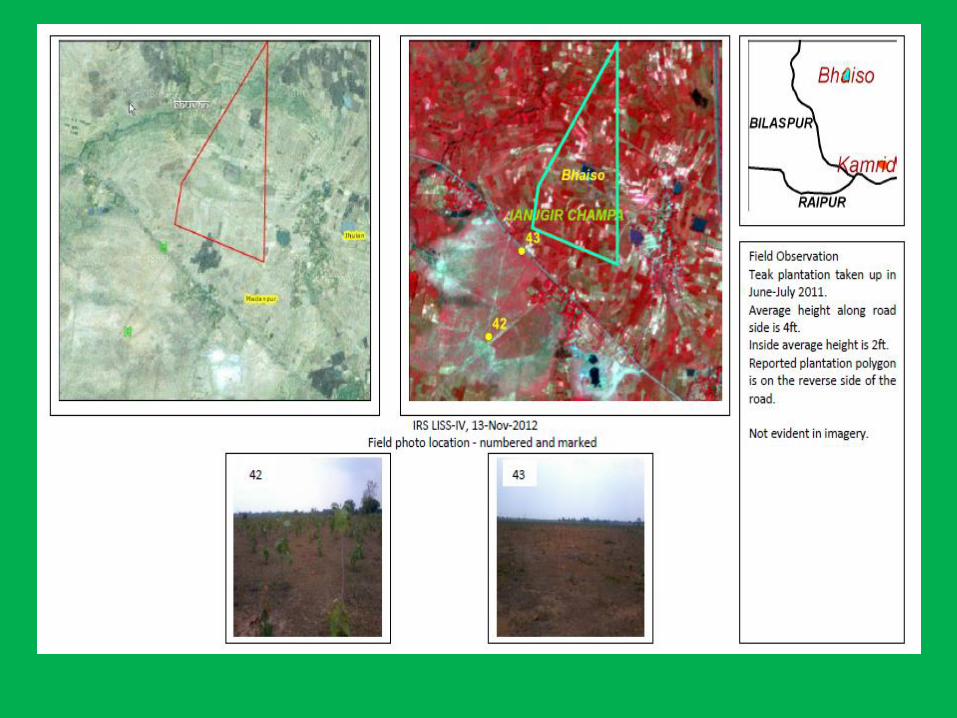
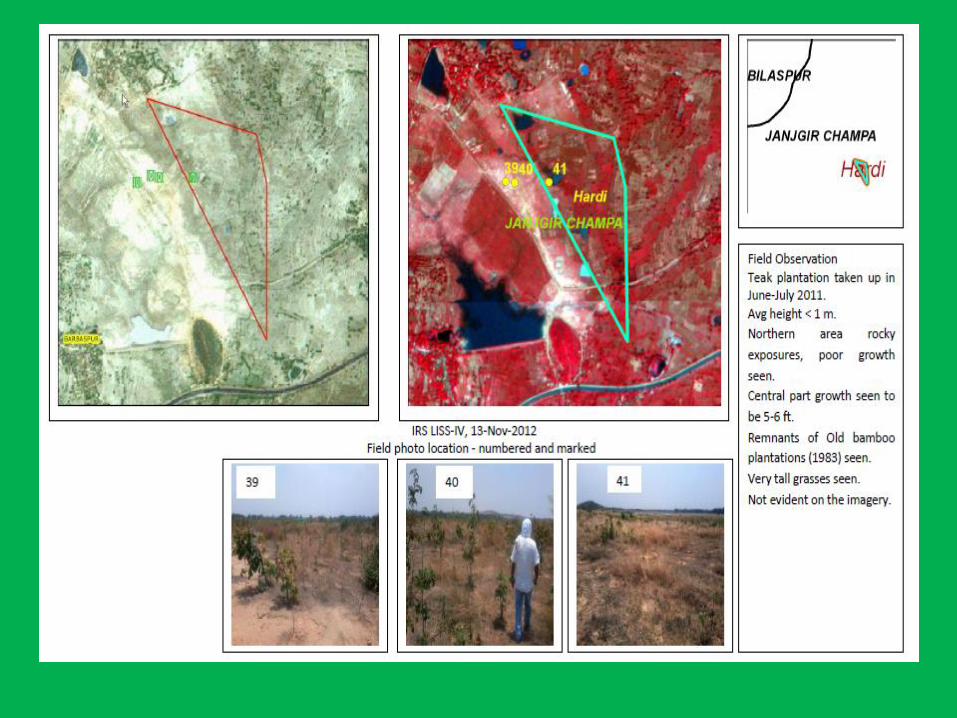
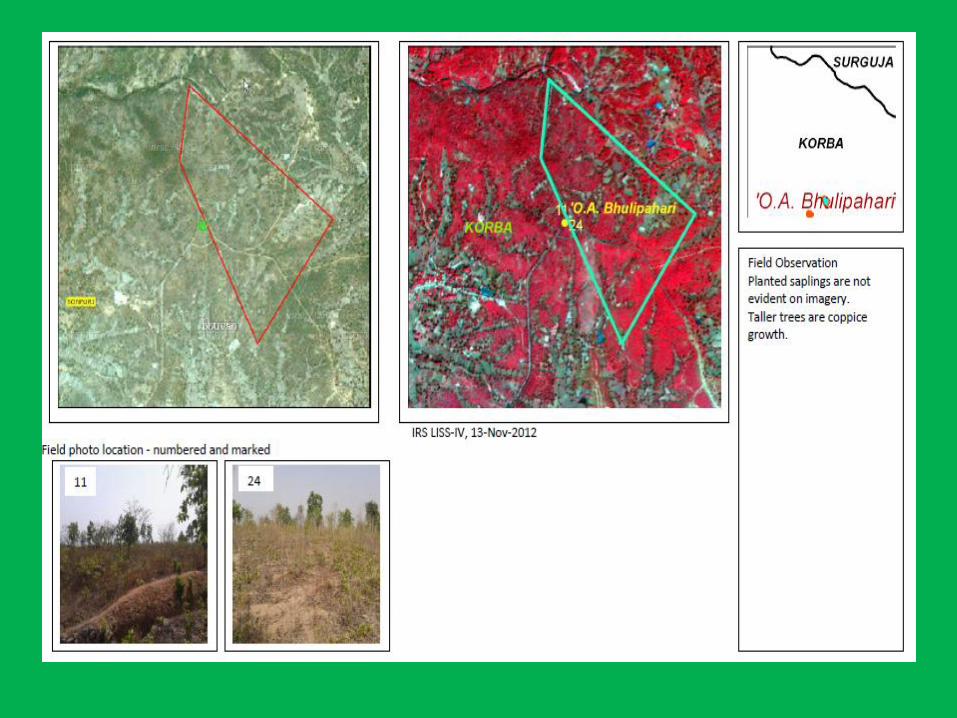
• Identification of plantation activity at specified sites using pre and post planting date remote sensing data based on a request of CAG
• To identify the newly established plantation at given point by comparing two date remotely sensed data with sapling signature
CAMPA
• Use of GIS– Assumptions and limitations
• Geographical coordinates accurately capture the corners of the plantation polygons ( required accuracy is better than +/- 5 m however most of the commercial models provide 20/30 m accuracy)
• Young plantations in early growth has very thin foliage (species specific) and till they are fully established, the remote sensing signal may not capture them fully
• It is presumed that planted site has significant contrast with the neighbourhood for better delineation with remote sensing data
• The identification of plantations is sensitive to spatial resolution. Spatial resolution of Resourcesat LISS IV of 5.8 m is considered to be adequate.
• When only two date images are compared, cases where plantation activity was carried out but plantation did not grow beyond the specific time, would not be detected.
• Positive detection may confirm existence of plantations; however, lack of detection does not indicate absence of plantation activity.
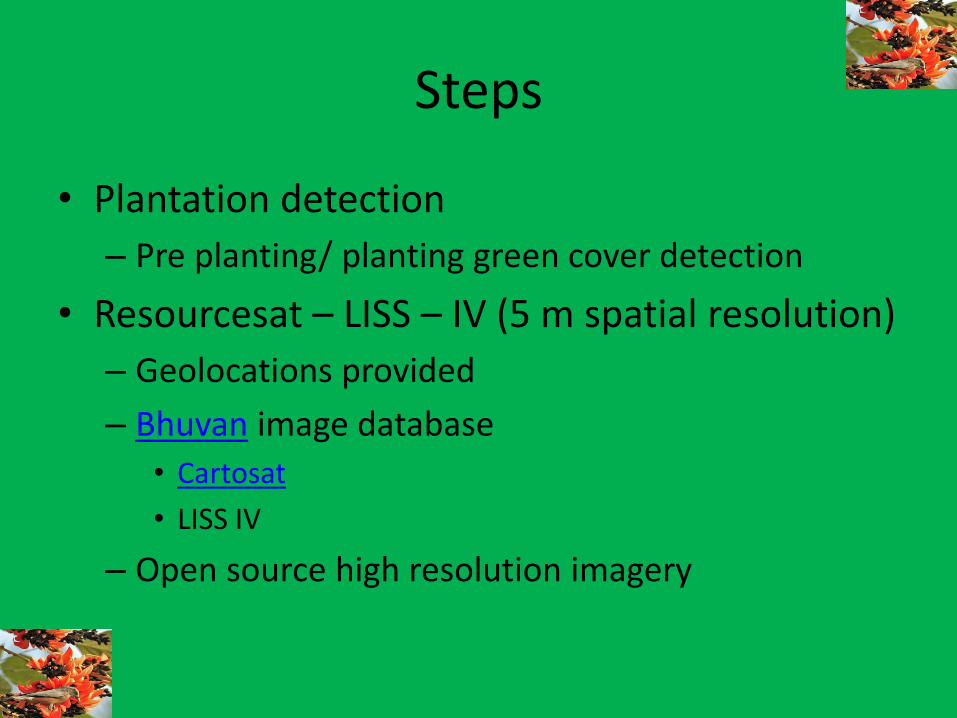
Steps
• Plantation detection
– Pre planting/ planting green cover detection
• Resourcesat – LISS – IV (5 m spatial resolution)
– Geolocations provided
– Bhuvan image database
• Cartosat
• LISS IV
– Open source high resolution imagery
Steps
• Corresponding LISS IV ortho corrected images for 2012-2013
• One to one comparision
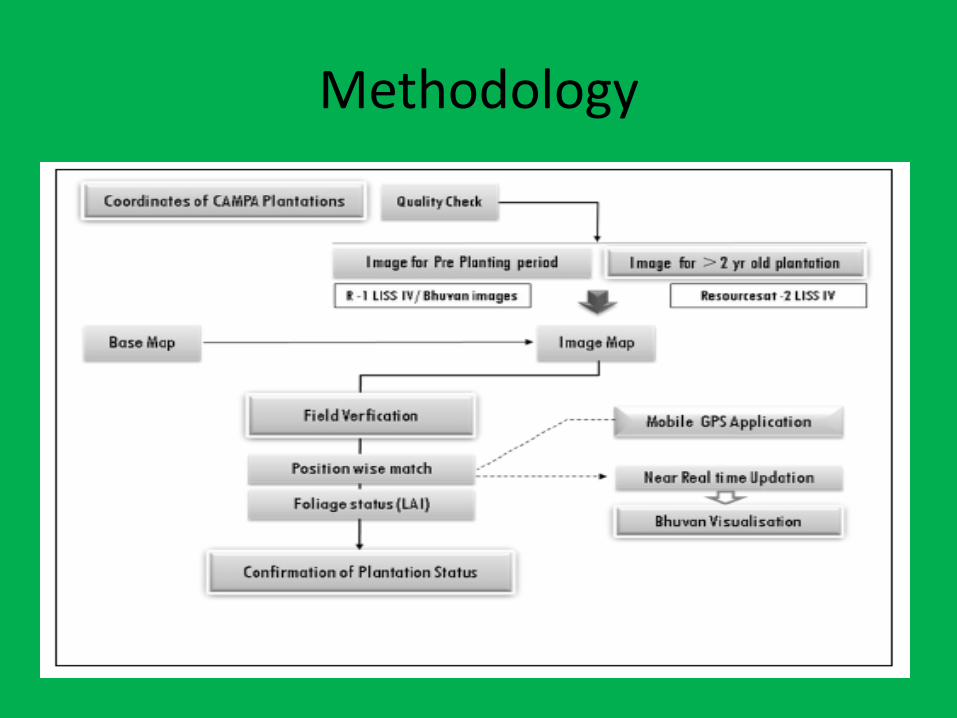
Methodology
Field Correlation
• To make field work efficient
• Field observations brought into framework of geo location of images– Mobile based application
• Geographic coordinates collected
• Real time entry of details into application
• Photographs of the locations taken and captured in database
• Uploaded on Bhuvan
– Field locations numbered and marked on images
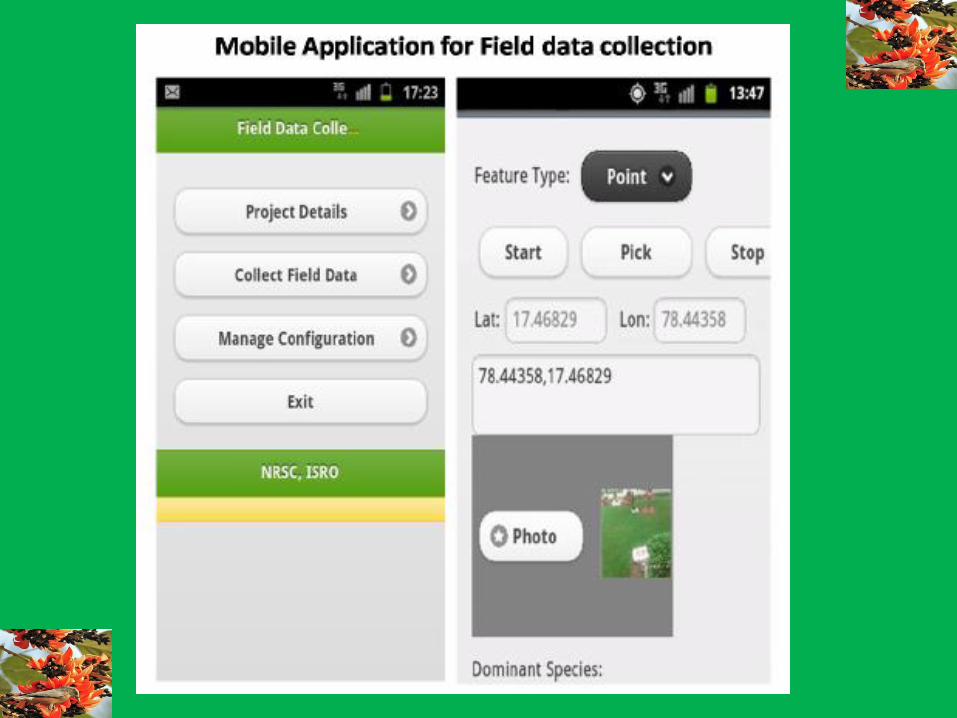

Data Collection from field

Details captured during field visits
• Mean height of saplings
• Spacing between saplings
• Types of species
• Compartment number
• Division
• District
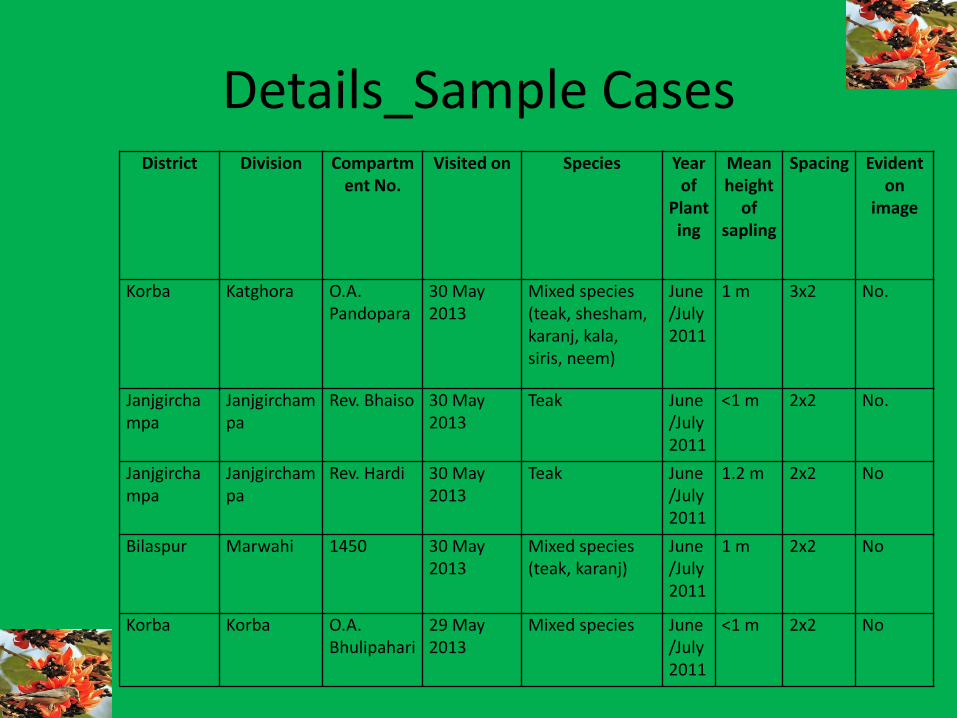
Details_Sample CasesDistrict Division Compartm
ent No.Visited on Species Year
of Planting
Mean height
of sapling
Spacing Evident on
image
Korba Katghora O.A. Pandopara
30 May 2013
Mixed species (teak, shesham, karanj, kala, siris, neem)
June/July 2011
1 m 3x2 No.
Janjgirchampa
Janjgirchampa
Rev. Bhaiso 30 May 2013
Teak June/July 2011
<1 m 2x2 No.
Janjgirchampa
Janjgirchampa
Rev. Hardi 30 May 2013
Teak June/July 2011
1.2 m 2x2 No
Bilaspur Marwahi 1450 30 May 2013
Mixed species (teak, karanj)
June/July 2011
1 m 2x2 No
Korba Korba O.A. Bhulipahari
29 May 2013
Mixed species June/July 2011
<1 m 2x2 No


Potential for projection/ estimation
• Use of statistical sampling in estimating
• Revenue projection by use of Raster images and statistical sampling
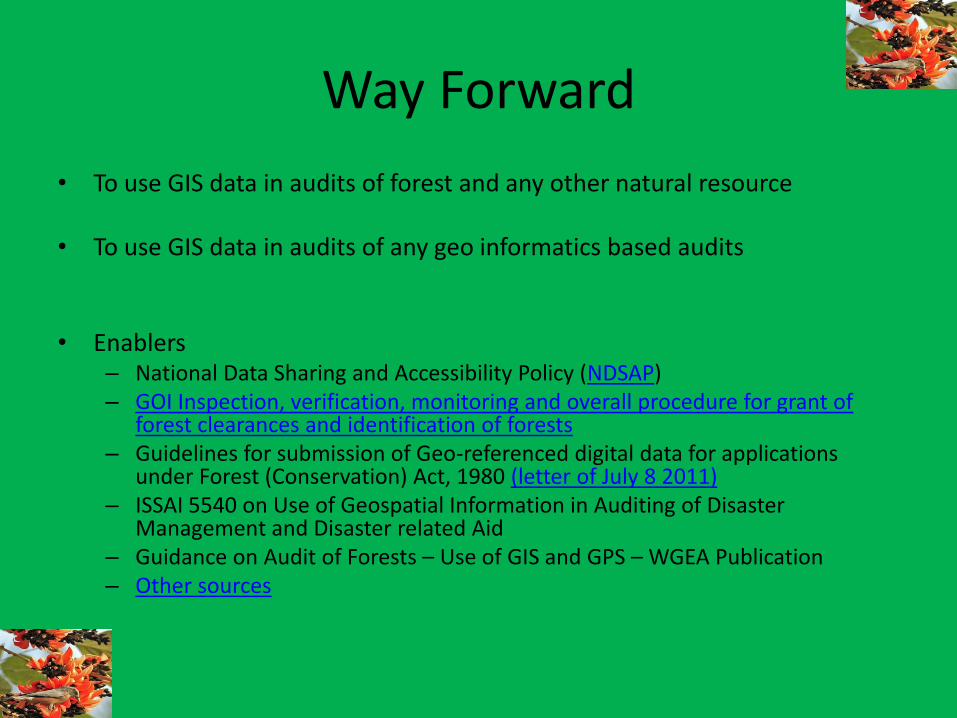
Way Forward
• To use GIS data in audits of forest and any other natural resource
• To use GIS data in audits of any geo informatics based audits
• Enablers– National Data Sharing and Accessibility Policy (NDSAP)– GOI Inspection, verification, monitoring and overall procedure for grant of
forest clearances and identification of forests – Guidelines for submission of Geo-referenced digital data for applications
under Forest (Conservation) Act, 1980 (letter of July 8 2011) – ISSAI 5540 on Use of Geospatial Information in Auditing of Disaster
Management and Disaster related Aid– Guidance on Audit of Forests – Use of GIS and GPS – WGEA Publication– Other sources

BHUVAN
A Geoportal of Indian Space Research Organisation showcasing Indian imaging capabilities in multi-sensor, multi-platform and multi-temporal domain. The portal gives a gateway to explore and discover virtual earth in 3D space with specific emphasis on Indian Region.
• Bhuvan» Bhuvan, the Earth browser - evinces Indian imaging capabilities.
» Portrays rich thematic information towards societal applications
» Experience OGC web services enabling interoperability
» Robust API for ease of development and integration
References
• NIC
• NRSC
• Monitoring of CAMPA plantations for Chhatisgarh and Odisha using ResourcesatHigh Resolution Multispectral images –Forestry & Ecology Group, Remote Sensing Application Area, National Remote Sensing Centre, Dept of Space, Govt. of India
• “Dr” Google

THANKS