Embed Size (px)
Citation preview

MAIN HEADING1
97Older Australia at a glance - 4th edition
28 The Australian health and welfare system
29 Care needs and sources of care
30 General practitioner services
31 Pharmaceuticals
32 Dental services
33 Hospital use
34 Reasons for admission to hospital
35 Aged care assessment
36 Home and Community Care (HACC) program
37 Community Aged Care Packages (CACPs)
38 Extended Aged Care at Home (EACH)
39 Respite Care
40 Residential aged care: resident profiles
41 Residential aged care: patterns of use
Use of health and aged care services
28 The Australian health and welfare system
29 Care needs and sources of care

98 Older Australia at a glance: 4th edition
Australia’s health care system
The Australian health system is complex, with many
types of service providers and a variety of funding and
regulatory mechanisms. Those who provide services
include a range of medical practitioners, other health
professionals, hospitals, clinics, and other government
and non-government agencies. Funding is provided
by the Australian Government, state and territory
governments, health insurers, individual Australians and
a range of other sources (see also AIHW 2006c).
Funding health care servicesAlmost 70% of total health expenditure in Australia
is funded by government, with the Australian
Government contributing two-thirds of this and state,
territory and local governments the other third. The
Australian Government’s major contributions include
the two national subsidy schemes: Medicare and the
Pharmaceutical Benefits Scheme. These schemes
subsidise payments for services provided by doctors
and optometrists, and for a high proportion of
prescription medications bought from pharmacies.
The Australian Government and state and territory
governments also jointly fund public hospital
services. Between them, these arrangements aim
to give all Australians—regardless of their personal
circumstances—access to adequate health care at
an affordable cost or no cost. These schemes are
further integrated with social welfare arrangements,
with larger rebates provided for individuals or families
who receive certain income support payments (such as
the Age Pension). There are also special health care
arrangements for members of the defence forces, and
for war veterans and their dependants.
Health care outside hospitalsMany people’s first contact with the health system is
through a general medical practitioner (GP) (see Topic
30: General practitioner services). People can choose
their own GP and are reimbursed for all or part of the
GP’s fee by Medicare, depending on the GP’s billing
arrangements. For specialised care, patients can be
referred to specialist medical practitioners, other health
professionals, hospitals or community-based health care
organisations. Community-based services—a range of
which can also be accessed directly by patients—provide
care and treatment in areas such as mental health,
alcohol and other drugs, and family planning.
Australians also visit dentists (see Topic 32: Dental
services) and other private sector health professionals
of their choice such as physiotherapists, chiropractors
and natural therapists. Charges are usually met by
the patients themselves or with the support of private
health insurance.
Health care in hospitalsPatients can access public hospitals through emergency
departments, where they may present on their own
initiative, via the ambulance services, or after referral
from a medical practitioner. Public hospital emergency
and outpatient services are provided free of charge.
Emergency ambulance services are not free of charge
for most Australians, but subscription schemes are
offered by the ambulance authorities or through private
health insurance.
Patients admitted to a public hospital can choose
to be treated as public or private patients. Public
patients receive treatment from doctors and specialists
nominated by the hospital, but are not charged for their
care and treatment.
Patients treated in a private hospital—or as a
private patient in a public hospital—can select their
treating specialist, but charges then apply for all of
the hospital’s services (such as accommodation and
surgical supplies). Medicare subsidises the fees
charged by doctors, and private health insurance funds
contribute towards medical fees and the hospital
costs for insured patients. ‘No-gap’ or ‘known-gap’
arrangements are increasingly being agreed on between
hospitals and insurers (see Topic 33: Hospital use and
Topic 34: Reasons for admission to hospital).
Other services The Australian Government and several state and
territory governments have established 24-hour
telephone-based health advice services which are
staffed by health professionals who answer queries
from callers about health problems, assisted by
specialised reference software.
Complementing the services outlined above is the
provision of public health services, which includes
activities to ensure food quality; immunisation services
and other communicable disease control; public health
education campaigns; injury prevention activities;
programs to reduce the use and harmful effects
of tobacco, alcohol and illicit drugs; environmental
monitoring and control; and screening programs for
diseases such as breast cancer and cervical cancer.
THE AUSTRALIAN HEALTH AND WELFARE SYSTEMS28

99Older Australia at a glance: 4th edition
USE O
F HEA
LTH A
ND
A
GED
CARE SERV
ICES
Health insuranceMany Australians purchase health insurance provided
by health benefits organisations (more commonly known
as private health insurance funds). Hospital insurance
schemes cover services in private hospitals as well
as services provided in public hospitals for private
patients and associated medical services. These are
supplemented by other additional schemes that cover
a wide range of allied health and other professional
services including some alternative/complementary
health services. As of late 2005, around 8.8 million
Australians (43% of the population) were covered by
private health insurance for hospital treatment.
Regulatory arrangementsThe health system is regulated in various ways. State
and territory governments are responsible for licensing
or registering private hospitals (including free-standing
day hospital facilities), medical practitioners and other
health professionals; and each state and territory has
legislation relevant to the operation of public hospitals.
The Australian Government’s regulatory roles include
overseeing the safety and quality of pharmaceutical and
therapeutic goods and appliances, managing international
quarantine arrangements, ensuring an adequate and safe
supply of blood products, and regulating the private health
insurance industry. There is also an established role for
governments in the regulation of food safety and product
labelling. State and territory governments are also largely
responsible for industry regulations, such as for the sale
and supply of alcohol and tobacco products which have
implications for associated health risks.
Australia’s welfare systemAustralia’s welfare system consists of programs that
are designed to enhance the wellbeing of individuals or
communities, and to provide more equal opportunities
for participation in the social and economic life of the
Australian community. Its main components—income
support and the provision of welfare services—are
provided through government agencies, non-government
organisations or private providers. However, family
members and volunteers also provide substantial
support and assistance to other Australians and form
an intrinsic and invaluable part of the ‘welfare’ sector.
This section outlines the support and services that
constitute Australia’s formal welfare system, with a
focus on those that target, or are mainly used by, older
people in the areas of income support, aged care,
housing and disability services (see also AIHW 2007c).
Funding welfare servicesThe majority (almost 70%) of funding for welfare
services is provided by governments. The states
and territories contribute 35% and the Australian
Government 32%. The remainder of government funding
for welfare services is contributed by local governments.
In addition, welfare services clients are charged fees
for some services, and non-government organisations
are sometimes called on to use their own resources to
support some of the welfare services they provide.
Income supportThe main source of income support for older Australians
is the Age Pension, which is assets and income tested
and available to people over the qualifying age (at 30
June 2006, the qualifying age for men was 65, and for
women 63). Age pensioners may also be entitled to a
range of additional payments and benefits such as the
Pharmaceutical Allowance, Rent Assistance, Telephone
Allowance, Remote Area Allowance, Utilities Allowance
and a Pension Concession Card entitling the holder to
medicines at a reduced cost as well as a range of state
and local government concessions (see Topic 13: Age
Pension and superannuation).
The Service Pension, paid to veterans, eligible partners,
widows and widowers, is similar to the Age Pension but
is generally available 5 years earlier. Other pensions
are available from the Department of Veteran’s Affairs
(DVA) which are compensation payments (such as the
Disability Pension and the War Widows’ Pension), and
are neither taxable nor subject to means testing.
Regardless of the source of their income, older
Australians of Age Pension age, are entitled to the
income-tested Senior Australians’ Tax Offset, and may
be exempted from the Medicare levy. The Pension
Bonus Scheme provides an incentive for older
Australians to defer claiming the Age Pension and
instead to remain in the workforce.
Older people who are carers may be able to access
two government payments, depending on their
circumstances. The Carer Payment is an income
support benefit payable to people who, because of
their caring responsibilities, are unable to support
themselves. For people of pension age it is an
alternative to, and equivalent to, the Age Pension. The
Carer Allowance is payable to carers who provide full-
time daily care at home to people who need substantial
amounts of care because of a disability or a severe
medical condition or because they are frail older people
(see Topic 9: Care provided by older people).

100 Older Australia at a glance: 4th edition
The Australian Government is the main source of income
support for people with disability and for their carers,
through the Disability Support Pension, Mobility Allowance,
Sickness Allowance, Carer Allowance, Carer Payment, Wife
Pension, Disability Pension, and other allowances.
Provision of aged care servicesThe Australian aged care system is characterised
by a mix of types of provision and a high degree of
cooperation between all levels of government, service
providers and the community. The non-government
sector has a long history in the provision of aged care
and continues to provide the majority of residential
service provision as well as community care services.
Private sector involvement in aged care is mostly
through high care residential services (see Topic 41:
Residential aged care: patterns of supply and use).
The Australian Government has the major role in funding
residential aged care services and aged care packages
in the community. It establishes the policy directions in
consultation with state and territory governments and the
aged care industry and consumers, and provides the bulk
of administrative support.
State and territory governments have a regulatory role in
the residential aged care sector, in areas such as building
compliance and fire safety regulations, and occupational
health and safety requirements. State and territory
governments administer the Home and Community Care
(HACC) Program through an agreement with the Australian
Government and directly operate some residential aged
care services. Together the Australian Government and
the state and territory governments provide funding for the
HACC and the Aged Care Assessment Program.
Local governments provide some residential aged
care services and community care services, as well as
having a regulatory role.
Community and flexible aged care servicesCommunity aged care services aim at enhancing the
independence of frail older people or older people with
disability, and delay or remove the need for entry to
residential aged care services.
The bulk of home- and community-based services
for older people are provided under the Home and
Community Care (HACC) Program. The program includes
home nursing services, delivered meals, home help
and home maintenance services, transport and
shopping assistance, allied health services, home- and
centre-based respite care, and advice and assistance
of various kinds. It is jointly funded by the Australian
Government and the state and territory governments
(see Topic 36: Home and Community Care Program).
Veterans’ Home Care (VHC) delivers in-home support
services to eligible veterans, war widows and war
widowers. The Program provides personal care
assistance, domestic assistance, home and garden
maintenance and respite care. Eligible people who
need higher amounts of personal care or community
nursing may be referred to the DVA Community Nursing
program. Except for respite care, clients are required to
pay a co-payment for VHC services.
Community Aged Care Packages (CACPs) provide
support services to older people with complex needs
living at home who would otherwise be eligible for
admission to at least ‘low-level’ residential care. They
provide a range of home-based services, excluding
home nursing assistance (which may, however, be
provided through HACC), with care being coordinated
by the package provider. The CACP program is solely
funded by the Australian Government. Clients may be
asked to contribute towards the cost of their care (see
Topic 37: Community Aged Care Packages).
The Extended Aged Care at Home (EACH) program
aims at delivering care at home that is equivalent
to high-level residential care. Clients may be asked
to contribute to the cost of their care, as with the
other community care programs. The program has
been extended to include EACH Dementia packages
which are designed to meet the needs of frail older
people with dementia who experience behavioural and
psychological symptoms associated with dementia.
Many of the services available to EACH recipients are
similar to those provided to CACP recipients (see Topic
38: Extended Aged Care at Home).
The Australian Government also provides other flexible
aged care services, sometimes in partnership with
other stakeholders, through:
• Multi-Purpose Services in rural and remote
communities
• services under the National Aboriginal and Torres
Strait Islander Flexible Aged Care Program
• a short–term Transition Care Program for older
people who have been in hospital, which aims at
meeting their rehabilitation, recovery and care needs
• Aged Care Innovative Pool funding, which supports
and evaluates pilot services or projects that will provide
aged care services in new ways, including at the
interface between aged care and other types of care.

101Older Australia at a glance: 4th edition
USE O
F HEA
LTH A
ND
A
GED
CARE SERV
ICES
Respite careRespite care may be provided in the home, at a centre
during the day, or in a residential service (see Topic 39:
Respite care). It is used by older people living in the
community including HACC, VHC and CACP recipients.
Respite services can also be accessed through the
National Respite for Carers Program, which provides
information and support for carers as well as respite care.
Residential care servicesResidential aged care services provide accommodation
and support for older people who can no longer live
at home. Two levels of care are available (low and
high) and short-term respite care services are also
available. All residential care services are required to
meet a number of national standards. Residential aged
care is mainly funded by the Australian Government,
via daily subsidies. In addition, all residents pay fees,
including an income-tested component, and government
subsidies for individual permanent residents are
reduced in line with the income-tested fees paid by
residents (see Topic 40: Residential aged care: resident
profiles and Topic 41: Residential aged care: patterns of
supply and use).
Accessing aged care servicesA network of Commonwealth Carelink Centres provide
a single point of contact for obtaining comprehensive
information on community aged care, residential care,
disability and other support services available in any
region within Australia. The centres are operated by
a wide range of organisations, including not-for-profit
and for-profit non-government organisations, and
government agencies.
Aged Care Assessment Teams (ACATs) play a crucial
role in the aged care system across Australia as they
determine eligibility for CACP, EACH, EACH Dementia,
the TCP and residential aged care. They also function
as a source of advice and referral concerning HACC
services but do not determine eligibility for these
services, although many clients assessed by ACATs are
recommended for HACC services (see Topic 35: Aged
care assessment).
Provision of VHC services is based on assessed need.
Assessments are undertaken by designated regional
assessment agencies, which also arrange for the
services to be provided. Veterans and war widow(er)s
are eligible to be assessed for the full range of services
provided under HACC, through arrangements with state
and territory governments, and can access different
services from both programs at the same time.
An ACAT assessment is not required for people
accessing respite through the National Respite for
Carers Program; there are, however, assessment
procedures within the program with the focus being on
primary carers and the relative need of clients. However,
an ACAT assessment is required for people accessing
residential respite in aged care homes.
To enter residential care, people must have an
assessment and approval for such care by an ACAT.
ACAT approval is also required for people moving
between low and high permanent residential aged care
facilities.
The Assistance with Care and Housing for the Aged
initiative links generally low income, frail older people in
insecure housing with appropriate community care and
housing services.
Housing assistance Key areas of assistance are the Commonwealth
Rent Assistance program, which provides an income
support payment for private renters linked to the
eligible household’s private rental costs; public rental
housing; community housing managed by not-for-profit
organisations; and various types of home ownership
assistance aimed at lower income households including
the First Home Owners Grant, low start loans, capital
indexed loans and shared equity schemes (see Topic 4:
Housing).
DisabilityOlder people with disability have access to the range
of community care and aged care services discussed
above (see Topic 17: Disability levels and Topic 29: Care
needs and sources of care). Disability support services
provided under the Commonwealth State/Territory
Disability Agreement, which include accommodation
support services, community support services,
community access services, respite services and
employment services, are generally aimed at younger
people.
102 Older Australia at a glance: 4th edition
The relationship between disability, health and age
is not necessarily straightforward, even though at
first glance it may seem so because of the general
tendency for the prevalence of certain health conditions
and of disability to increase with age (see topics in
Section 3). In the older age groups, illnesses affecting
human functioning become more prevalent, including
cardiovascular diseases, arthritis and dementia.
People with disability in older age groups need more
frequent assistance than younger people and with
more core activities. Older people also had more
health conditions associated with disability (AIHW
2005b). Other factors which change the environment
and circumstances of older people, such as loss of
a spouse, technological change or surrendering a
driver’s licence, may also result in older people needing
assistance with certain activities in order to support
their capacity for community living.
Care needs and unmet needThe expression of need for services is shaped by
the experiences, attitudes and beliefs of people, and
therefore can be affected by what is known to be
available or the perceived adequacy or accessibility of
what is available. In addition, social and cultural norms
can influence the likelihood of someone expressing
a need for assistance, and interpersonal dynamics,
such as the relationship between a carer and a care
recipient, can affect the way need for assistance is
experienced and expressed (Braithwaite 1996; AIHW:
Jenkins 1999). Bearing these cautions in mind,
reported need for assistance provides a valuable point-
in-time account of need and unmet need.
The Survey of Disability, Ageing and Carers (SDAC)
conducted by the ABS in 2003 (ABS 2004b) found that
43% (1,004,400 persons) of the 2.3 million people
aged 65 years and over living in households expressed
a need for some form of assistance to help them stay
CARE NEEDS AND SOURCES OF CARE29
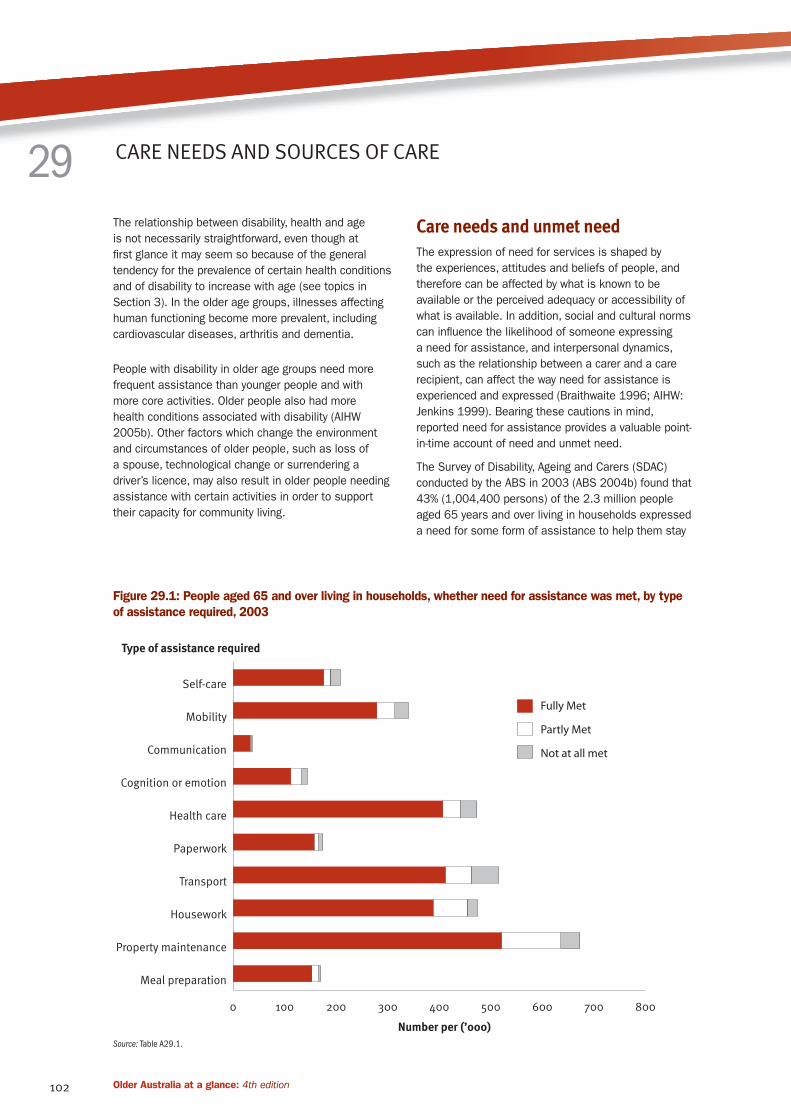
Figure 29.1: People aged 65 and over living in households, whether need for assistance was met, by type
of assistance required, 2003
Source: Table A29.1.
0 100 200 300 400 500 600 700 800
Not at all met
Partly Met
Fully Met
Meal preparation
Property maintenance
Housework
Transport
Paperwork
Health care
Cognition or emotion
Communication
Mobility
Self-care
Number per (’000)
Type of assistance required

103Older Australia at a glance: 4th edition
USE O
F HEA
LTH A
ND
A
GED
CARE SERV
ICES
at home (Table A29.1). The most common area of need
was property maintenance (29%) followed by transport
(22%), housework (20%) and healthcare (20%) (Table
A29.1 and Figure 29.1). Approximately 26% needed
some assistance with personal activities, such as self-
care, mobility, communication, cognition or emotion, and
health care.
A higher proportion of women than men aged 65 years
and over required assistance for all activities except
communication, a result which is consistent with
their older age profile; overall 50% of women needed
assistance with at least one activity compared with
35% of men. Areas of greatest difference between
men’s and women’s need for assistance were property
maintenance (35% of women and 21% of men),
housework (26% of women and 14% of men) and
transport (26% of women and 17% of men).
Unmet need occurs when a person does not have
sufficient assistance with activities where help is
required. Almost two-thirds of older people who needed
assistance with at least one activity (64% or 646,500)
feel that their needs were fully met, over one-quarter
(31% or 306,100) report that their needs were partly
met, and 5% (51,800) report that none of their needs
was met, even partially (Table A29.1).
The areas with the highest proportions of older people
reporting that their need for assistance was fully met
were paperwork and meal preparation (90%) and
communication (89%). Transport and self-care were
the areas with the highest proportions of older people
feeling that their need for assistance was not met at all
(10% each of people requiring assistance with transport
and with self-care).
Providers of assistanceInformal care networks of friends and family provide
most of the assistance received by older people in the
community. Among those receiving assistance, 83%
received help from informal providers, and 64% received
help from formal providers (including government
organisations as well as private for-profit and private
not-for-profit agencies) (Table 29.1). Overall, 47% of
older people received assistance from both informal
and formal sources. Informal providers were the major
source of support for communication and paperwork:
98% of those receiving assistance for these activities
were being helped by informal providers. The lowest
proportions receiving assistance from informal providers
were in the area of health care (54% of recipients). For
most activities, between 15% and 25% of those needing
and receiving assistance were getting help from both
formal and informal sources. Among older people with
disability who need assistance to manage their bladder
or bowel control and live in households around 50%
relied on informal self-care assistance, and another
26% used a mixture of informal and formal self-care
assistance (AIHW analysis, ABS 2004a).
Among informal providers, there are clear gender and
relationship differences (Table 29.1). Informal carers
are predominantly female partners or daughters/
daughters-in-law across most activities—the one
exception being property maintenance. There are also
clear gender differences in the types of assistance
provided by informal carers. This is true for informal
carers who are partners but is more pronounced
between daughters and sons. In 2003, daughters/
daughters-in-law were twice as likely as sons/sons-
in-law to provide assistance for all activities except
property maintenance. Interestingly, male partners were
more commonly recorded as providing assistance with
housework than female partners, although this possibly
reflects dominant gender roles and the expectation that,
for women, performing the bulk of household duties is
part of their routine responsibilities.
Among formal providers, data from the 2003 SDAC
indicate that government-owned agencies predominate
across most activities. However, these figures may
overstate the use of government providers because
respondents may not be able to distinguish between
government and non-government services. For example,
most Home and Community Care services are provided
by non-government agencies, even though the program
is funded by governments. Areas where a greater
proportion of people reported using non-government
rather than government services were health care (the
only area where more people received help from a
formal rather than an informal provider) and property
maintenance, both of which showed a clear majority
of people who received this type of service getting
assistance from a private for-profit source.
Data in Table 29.1 do not convey the total amount or
frequency of help provided to older Australians living
in the community. For instance, the greatest number
of older people in the community need and receive
assistance with property maintenance, yet the nature of
property maintenance tasks means that this assistance
is likely to be single episodes of short duration.
In contrast, activities such as meal preparation or
personal care typically occur on a daily basis for
sustained periods of time.

104 Older Australia at a glance: 4th edition
Informal careWith the growing emphasis on home-based care,
informal care by family, friends and neighbours is
increasingly being recognised as an important source
of support to people of all ages (see also Topic 9:
Care provided by older people). Carers play a key role
in assisting older people to remain in the community
and the need for this support is expected to increase.
In addition to providing direct assistance, a carer may
also act as a ‘bridge’ to formal services. For example,
results from the 2002 Community Aged Care Packages
Census (AIHW 2004b) show that 58% of those with a
carer were receiving CACP assistance with personal
care compared with only 48% of those without a carer.
According to the 2003 SDAC, there were 472,500
primary carers in 2003, where a primary carer is
defined as the person who provides the most ongoing
informal assistance with core activities (self-care,
mobility, communication) to a person with one or more
disabilities. Of these, around 239,400 were providing
assistance to persons aged 65 years and over, and
113,200 were themselves aged 65 years and over
(AIHW 2005b). A substantial proportion of primary
carers of older people are also over the age of 65 (40%
in 2003), and 87% are aged 45 years and over.
Women made up over two-thirds (69%) of primary carers
of older people (AIHW analysis, ABS 2004a). Older men
were most likely to be cared for by a female carer aged
65 years and over. The predominance of older female
carers was more marked for men aged 75 years and
over than among men aged 65–74 years. Women aged
65–74 years were most commonly cared for by an older
male, and women aged 75 years and over were most
likely to be cared for by a female carer aged 25–64
years, although older male carers were also important
in this age group.
Table 29.1: Source of assistance received by people aged 65 and over living in households, 2003
Provider type
Self-care Mobility
Com-
muni-
cation
Cognition or
emotion
Health
care Paperwork Transport Housework
Property
main-
tenance
Meal
prep-
aration Any activity
Per cent
Informal
Female partner 30.2 19.1 33.4 25.7 18.6 23.4 13.4 15.3 11.2 24.5 18.5
Male partner 23.4 19.0 *9.1 13.7 11.9 11.5 16.4 19.5 15.3 16.8 18.2
Daughter/
daughter-in-law 24.8 35.1 47.1 37.4 14.7 39.0 36.8 23.5 14.7 32.7 29.0
Son/son-in-law 11.0 22.5 *22.5 16.5 5.3 20.8 24.5 11.7 26.4 13.2 26.0
Other female(a) *5.5 11.9 *8.0 9.2 4.4 6.2 11.9 7.0 3.3 7.7 10.7
Other male(b) *3.5 7.6 *7.4 *4.7 2.6 6.3 8.1 3.4 12.0 *3.5 12.8
Total informal 89.1 93.8 98.4 93.6 54.2 97.5 93.4 70.6 71.6 86.7 83.0
Formal
Government 18.4 16.6 **4.4 12.0 26.3 *2.2 8.4 29.8 9.3 14.6 31.1
Private non-profit 6.6 7.1 **1.9 *1.7 6.4 **1.0 3.6 6.8 6.4 *5.3 10.6
Private for-profit *4.8 4.3 **1.5 19.5 37.9 *2.9 4.8 15.3 36.4 *4.4 42.0
Total formal 28.8 26.6 *7.8 29.1 65.9 *6.1 16.0 51.0 49.7 24.3 63.7
Both informal
& formal 17.9 20.3 6.2 22.7 20.1 3.6 9.4 21.5 21.3 11.1 46.7
Number 187,900 313,500 36,200 133,100 441,600 166,600 462,500 453,600 635,400 166,100 952,600
* Estimate has a relative standard error of 25% to 50% and should be used with caution.
** Estimate has a relative standard error greater than 50% and is considered too unreliable for general use.
(a) Includes mother, other female relative and female friend or neighbour.
(b) Includes father, other male relative and m
Source: AIHW analysis, (ABS 2004a) .

105Older Australia at a glance: 4th edition
USE O
F HEA
LTH A
ND
A
GED
CARE SERV
ICES
General practitioners (GPs) play a significant role in
the lives of many older people as primary health-care
providers and as a point of referral to other health
services. Most Australians (about 85%) will see their
GP at least once in any year (AIHW: Britt et al. 2007).
Information about the use of GPs by older people
complements that from national health surveys, hospital
services, aged care services and the mortality database,
as indicators of population health and wellbeing.
Use of GPs by older peopleBy far the majority of visits to GPs by Australians of all
ages are funded through the Commonwealth Medicare
Benefits Schedule (MBS) (AIHW: Britt et al. 2007).
During the financial year 2005–06 there were over
90 million unreferred attendances, or visits, paid by
Medicare (A1 and A2 items), at an average rate of 4.6
visits per person (Table 30.1). Approximately 25% (23.6
million) of these attendances were older patients.
Older Australians use the services of GPs more often
than younger people. For older Australians the average
number of visits was 8.6 per person in 2005–06
compared with about 4.0 per person for people aged
under 65 (Table 30.1). Although rates of use increased
with age and were highest for people aged 85 years
and over, visits in this oldest age group represented
less than 4% of all visits to the GP. Table 30.1 also
shows that for each age group, older women were more
likely than older men to use the services of a GP.
Most frequent patient reasons for GP–patient encountersSince 1998, Australia has had national data available
on the types of services provided by GPs through a
survey of general practice activity involving around
1,000 recognised practising GPs from across the
country each year. Called the BEACH (Bettering the
Evaluation and Care of Health) survey, it records where,
how and what type of services are delivered by general
practitioners each year (AIHW: Britt et al. 2005). BEACH
provides data about ‘encounters’, which include face-
to-face consultation of a patient with a GP, and indirect
encounters, such as where the GP provides a clinical
service (for example, a repeat prescription or a referral)
without seeing the patient face-to-face.
Table 30.2 shows the most frequent reasons given by
patients aged 65 years and over for their encounter
with the GP. The reasons for encounter are those
concerns and expectations that patients bring to the GP.
Participating GPs were asked to record at least one and
up to three reasons for encounter in words as close
as possible to those used by the patient, before the
diagnostic or management process had begun. These
reflect patients’ views of their reasons for consulting
the GP.
GENERAL PRACTITIONER SERVICES 30
Table 30.1: Use of GPs by Australians, by age and sex, 2005–06
Age Males Females Persons
Number of visits
Under 55 24,056,261 33,890,993 57,947,254
55–64 5,736,891 7,161,150 12,898,041
65–74 5,311,958 6,145,708 11,457,666
75–84 3,674,296 5,258,777 8,933,073
85 and over 842,433 2,378,888 3,221,321
Total 65 and over 9,828,687 13,783,373 23,612,060
Total 39,621,839 54,835,516 94,457,355
Rate (per 1,000 population)
Under 55 3,051 4,393 3,715
55–64 5,031 6,320 5,673
65–74 7,614 8,436 8,034
75–84 8,650 9,646 9,210
85 and over 7,589 10,480 9,531
Total 65 and over 7,969 9,185 8,636
Total 3,863 5,299 4,584
Note: Data relate to unreferred attendances paid by Medicare for Group A1 General Practitioner items and Group A2 Other non-referred items.
Sources: Medicare Australia 2007; ABS 2006d.

106 Older Australia at a glance: 4th edition
Overall, there were 158 individual reasons for every
100 encounters for older men and 163 for older women
(Table 30.2). The 15 most commonly recorded reasons
for the encounter in general practice account for about
a half of all reasons given.
The most frequent reasons given by older patients were
to obtain a prescription, a request for a check-up (both
about 20 per 100 encounters), and to receive test
results (about 8 per 100 encounters). Immunisation,
cough, hypertension and back complaint also ranked
highly for older men and older women. Rash was the
main reason given for 2 out of every 100 encounters,
slightly more often than skin symptom/complaint.
Diabetes was the main reason given in 2.1 per 100
encounters for older men and 1.7 per 100 encounters
for older women. Depression (not listed in Table 30.2)
accounted for 0.9 per 100 encounters in older men and
1.4 per 100 encounters in older women.
Most frequently managed problems In the BEACH survey, participating GPs can record up
to four problems managed through each GP–patient
encounter. A ‘problem managed’ is a formal statement
of the provider’s understanding of a health problem
presented by the patient, family or community, and
can be described in terms of a disease, symptom
or complaint, social problem or ill-defined condition
managed at the encounter (AIHW: Britt et al. 2005).
The average number of problems managed at
encounters increases steadily with patient age and
is generally higher for female patients than for male
patients. Overall, there were 167 problems managed
per 100 encounters for older men and 173 for older
women (Table 30.3). The 20 most frequently managed
individual problems in general practice account for just
over a half of all problems managed.
Table 30.2: Most frequent patient reasons for encounter by people aged 65 and over, by sex, 2005–06
Rank Males Number
Rate per 100
encounters Females Number
Rate per 100
encounters
1 Check-up—all 2,414 20.4 Prescription—all 3,125 20.8
2 Prescription—all 2,310 19.5 Check-up—all 2,964 19.7
3 Test results 997 8.4 Test results 1,189 7.9
4 Immunisation—all 837 7.1 Immunisation—all 1,081 7.2
5 Cough 528 4.5 Cough 596 4.0
6 Hypertension 379 3.2 Hypertension 542 3.6
7 Back complaint 313 2.6 Back complaint 539 3.6
8 Diabetes 247 2.1 Rash 298 2.0
9 Rash 235 2.0
Skin symptom/com-
plaint 271 1.8
10 Skin symptom/complaint 235 2.0 Vertigo/dizziness 266 1.8
11
Administrative procedure
NOS 221 1.9
Leg/thigh symptom/
complaint 260 1.7
12 Blood test NOS 221 1.9
Knee symptom/com-
plaint 257 1.7
13
Shortness of breath,
dyspnoea 210 1.8 Diabetes 250 1.7
14 Knee symptom/complaint 183 1.5 Blood test NOS 237 1.6
15 Blood test blood/lymph 170 1.4
Administrative proce-
dure NOS 230 1.5
Total (15 leading reasons) 9,501
Total (15 leading
reasons) 12,104
Total reasons 65+ 18,629 157.6 Total reasons 65+ 24,431 162.6
Total encounters 65+ 11,822 100.0 Total encounters 65+ 15,024 100.0
Note: NOS = not otherwise specified. ‘Check-up—all’ includes, for example, cardiac check-up, general check-up, skin check-up.
Source: AIHW analysis of 2005–06 BEACH database.

107Older Australia at a glance: 4th edition
USE O
F HEA
LTH A
ND
A
GED
CARE SERV
ICES
The top five problems managed by GPs for both older
men and women are hypertension, immunisation,
diabetes, osteoarthritis and lipid disorders (Table
30.3). Diseases of the cardiovascular system, skin,
and musculoskeletal (osteoarthritis, back complaint)
and respiratory systems are also relatively common
problems. Also common are oesophagus disease,
sleep disturbance, depression, dementia (2.3 per 100
encounters for older women, 1.4 for older men) and
urinary tract infection (3.2 per 100 encounters for older
women, 1.3 for older men).
Many of the most common problems managed in
older Australians are chronic in nature and are largely
preventable—problems such as hypertension, heart
disease, some forms of diabetes and osteoarthritis
(see also Topic 31: Use of pharmaceuticals). Australia’s
National Chronic Disease Strategy provides national
direction for improving chronic disease prevention and
care across Australia. One of its key directions is to
encourage primary health care, particularly general
practice, to engage in early intervention, through
appropriate screening and identification of risk factors,
and support for self-management (NHPAC 2006).
Annual health checks for older peopleVoluntary annual health assessments arranged and
performed by general practitioners are important for
early intervention and monitoring of chronic health
conditions in the older population. These Medicare-
funded assessments are available to all people aged
75 years and over and to Aboriginal and Torres Strait
Islander peoples aged 55 years and over, and can
Table 30.3: Most frequently managed problems by GPs for people aged 65 and over, by sex, 2005–06
Rank Males Number
Rate per 100
encounters Females Number
Rate per 100
encounters
1 Hypertension 2,185 18.5 Hypertension 3,068 20.4
2 Diabetes 973 8.2 Immunisation—all 1,138 7.6
3 Immunisation—all 867 7.3 Osteoarthritis 1,033 6.9
4 Lipid disorders 673 5.7 Diabetes 873 5.8
5 Osteoarthritis 575 4.9 Lipid disorders 806 5.4
6 Ischaemic heart disease 567 4.8 Prescription—all 579 3.9
7 Atrial fibrillation/flutter 404 3.4 Oesophagus disease 576 3.8
8 Oesophagus disease 403 3.4 Osteoporosis 573 3.8
9 Prescription—all 374 3.2 Sleep disturbance 485 3.2
10 General check-up 369 3.1 Urinary tract infection 475 3.2
11 Malignant neoplasm skin 322 2.7 Depression 474 3.2
12 Solar keratosis/sunburn 302 2.6 Atrial fibrillation/flutter 388 2.6
13
Chronic obstructive
pulmonary disease 300 2.5 Back complaint 380 2.5
14
Acute bronchitis/
bronchiolitis 297 2.5 General check-up 354 2.4
15 Sleep disturbance 272 2.3
Dementia (incl senile,
Alzheimer’s) 350 2.3
16 Heart failure 268 2.3 Ischaemic heart disease 340 2.3
17
Malignant neoplasm
prostate 265 2.2
Acute bronchitis/
bronchiolitis 330 2.2
18 Back complaint 252 2.1 Anxiety 325 2.2
19 Depression 231 2.0 Solar keratosis/sunburn 320 2.1
20 Cardiac check-up 231 2.0
Chronic ulcer skin
(incl varicose ulcer) 294 2.0
Total
(20 leading problems) 10,130
Total
(20 leading problems) 13,160
Total problems 65+ 19,742 167.0 Total problems 65+ 25,963 172.8
Total encounters 65+ 11,822 100.0 Total encounters 65+ 15,024 100.0
Source: AIHW analysis of 2005–06 BEACH database.

108 Older Australia at a glance: 4th edition
involve referral to other health professionals, such as
a physiotherapist, dietician or occupational therapist.
Patients may agree to a home visit for an assessment
of home safety and equipment needs. Assessment
covers the medical, physical, psychological and social
aspects of health and pays close attention to whether
preventive health care and education should be offered.
It provides an opportunity for older people to discuss
with a GP any area of concern about their health.
Over 240,000 such services were recorded in 2005–06
(Table 30.4). Just over half the assessments were
performed in doctors’ consulting rooms; the rest were
performed in other settings, which may include the
patient’s home.
Assessments were received by approximately 191 per
1,000 people aged 75 years and over. Assessments
were accessed by relatively more people aged
75–84 years than people aged 85 years and over,
and relatively more women than men. A lower rate
of assessment of people aged 85 and over (150
assessed per 1,000 population) compared with that of
people aged 75–84 years (204 assessed per 1,000
population) may in part reflect the greater propensity of
the very old to live in residential settings where there is
ongoing access to nursing care (comprehensive medical
assessment for new and existing residents in aged care
homes is funded under a Medicare item different from
voluntary health assessments for older people).
Table 30.4: Voluntary annual health assessments for people aged 75 and over(a), by sex, 2005–06
Sex/age
Location of assessment
In GP consulting rooms(b) Other(c) Total services Rate per 1,000 population(d)
Males
75–84 45,470 34,687 80,157 193
85+ 6,678 7,552 14,230 140
Total 52,148 42,239 94,387 183
Females
75–84 58,566 56,022 114,588 212
85+ 14,014 19,107 33,121 155
Total 72,580 75,129 147,709 196
Persons
75–84 104,036 90,709 194,745 204
85+ 20,692 26,659 47,351 150
Total 124,728 117,368 242,096 191
(a) 242,098 assessments of people aged 75 and over under MBS item numbers 700 and 702 (table excludes 2 cases with unknown patient age). An additional 2,517
assessments were performed for Aboriginal and Torres Strait Islander peoples aged 55 and over, under different item numbers.
(b) MBS item no. 700.
(c) MBS item no. 702.
(d) Based on the estimated resident population aged 75 and over at 30 June 2005.
Source: AIHW analysis of Medicare statistics (data downloaded from <www.medicare.gov.au> on 5 April 2007); ABS 2006d.

109Older Australia at a glance: 4th edition
USE O
F HEA
LTH A
ND
A
GED
CARE SERV
ICES
Medications are commonly used by older Australians to
treat and manage illness and health conditions. Broadly
defined, these include prescription pharmaceuticals,
over-the-counter medications and vitamins and minerals.
Prescription pharmaceuticals are provided through
pharmacies and hospitals, with a wide range subsidised
under the Pharmaceutical Benefits Scheme (PBS).
Prescribing patterns
AgeThe level of use of pharmaceuticals generally increases
with age. Data from the Bettering the Evaluation and
Care of Health survey (BEACH) show that the number of
prescriptions written at each encounter with a general
practitioner rises with advancing age of the patient
(AIHW: Britt et al. 2007). About 60 per 100 encounters
with patients aged 25 years and under resulted in the
provision of a prescription in 2005–06—for those aged
65 years and over the rate rose to over 100 per 100
encounters.
Types of medications prescribedData from the BEACH surveys of general practitioners
reveal the types of medications prescribed to
older Australians, and how prescriptions for these
medications have changed over time. An important
caveat for interpreting the results of the BEACH survey
should be noted—a prescription, irrespective of the
number of repeats ordered, is counted only once.
The results of the 2005–06 survey show that
women and men aged 65 and over were prescribed
medications at similar rates (131 and 123 per 100
encounters, respectively). Antihypertensive medication,
for the treatment of high blood pressure, was the
most frequently prescribed medication for both sexes
(Table 31.1). With a prescription rate of almost 19 per
100 encounters, antihypertensives were prescribed at
more than double the rate of the next most common
medication (simple analgesics for women, immunisation
for men).
Other common medications prescribed to both sexes
were other cardiovascular system drugs (7.4 per 100
encounters for males, and 6.3 for females), beta-
USE OF PHARMACEUTICALS 31
Table 31.1: Top 15 groups of medications prescribed for people aged 65 and over, by sex, 2005–2006
Rank Males
Rate per 100
encounters Females
Rate per 100
encounters
1 Antihypertensive 18.5 Antihypertensive 18.8
2 Immunisation 8.4 Simple analgesics 8.7
3 Other cardiovascular system drugs(a) 7.4 Immunisation 8.4
4 Simple analgesics 6.9 Other cardiovascular system drugs(a) 6.3
5 Hypoglycaemic agents 5.7 Diuretics 5.1
6 Antiulcerant 4.8
Non-steroidal anti-inflammatory drugs
(NSAIDs) 4.6
7 Beta-blockers (for cardiovascular problems) 4.6 Beta-blockers (for cardiovascular problems) 3.9
8
Non-steroidal anti-inflammatory drugs
(NSAIDS) 4.3 Hypoglycaemic agents 3.9
9 Other blood drug(b) 4.2 Sedative/hypnotic 3.6
10 Penicillin/cephalosporins 3.2 Penicillin/cephalosporins 3.6
11 Broad spectrum penicillin 2.8 Narcotic analgesics 3.5
12 Narcotic analgesics 2.8 Other antibiotics(c) 3.4
13 Other antibiotics(c) 2.7 Nutrition/metabolism/other 3.3
14 Bronchodilator/spasm relaxant 2.6 Antidepressants 3.1
15 Anti-angina 2.6 Anti-anxiety agents 2.9
Total prescribed (all medication groups) 122.9 Total prescribed (all medication groups) 131.4
(a) Cardiovascular system drugs other than antihypertensive, anti-arrhythmic, anti-angina, cardiac glycoside, beta-blocker, adrenergic stimulant, peripheral vasodilator,
antimigraine and hypolidaemic agents.
(b) Blood drugs other than haemopoietic.
(c) Antibiotics other than penicillin/cephalosporin, broad spectrum penicillin, tetracycline, antifungal, sulphonamide and anti-infective.
Source: AIHW analysis of 2005–06 BEACH data.

110 Older Australia at a glance: 4th edition
blockers and non-steroidal anti-inflammatory drugs.
The greatest difference in prescription rates for older
women and men, (for medications which were in the
top 15 prescribed for both sexes) were for simple
analgesics and hypoglycaemic agents (a difference of
1.8 encounters for both medication groups). Simple
analgesics were prescribed at the higher rate for
women, and hypoglycaemic agents were prescribed at
the higher rate for men.
Differences in the types of medications prescribed
to older women and men reflected the most frequent
types of problems managed by GPs for each sex (see
Topic 30: General practitioner services). Medications
for mental wellbeing were among the top 15 prescribed
medications for older women, but not for men. Sedative/
hypnotic medication, anti-depressants and anti-anxiety
medications were prescribed to older women at a rate
of around 3–4 out of every 100 encounters. Other
medications that were in the top 15 for one sex but not
for the other included anti-ulcerant medication for older
men and diuretic medication for older women.
Trends in medications prescribedPrescriptions for the majority of medication groups have
risen since the 2000–01 BEACH survey (which was
reported in the previous edition of this publication). The
total prescription rate rose by an average of 5.6 per 100
encounters for both older women and older men. Most
notable is the rise in prescriptions for immunisation. A
prescription or provision of an immunisation occurred
in 8.4 per 100 encounters for both sexes—an increase
of 4.5 encounters since 2000–01. The majority of
immunisation prescriptions were for protection against
influenza, which reflects government policy to promote
flu vaccination to older people. The National Influenza
Vaccine Program for Older Australians provides free
influenza (and pneumococcal since 2005) vaccinations
to Australians aged 65 years and over and to Indigenous
Australians aged 50 years and over.
In contrast to the rise in immunisation provisions,
prescriptions for non-steroidal anti-inflammatory drugs
(NSAIDs) fell considerably since 2000–01. A decline
from 7.3 to 4.6 per 100 encounters was noted for
women and from 6.6 to 4.3 for men. This decline
may, in part, reflect tightened Therapeutic Goods
Administration measures on the prescribing of anti-
arthritis drugs known as Cox-2 inhibitors (a type of
NSAID) (Therapeutic Goods Administration 2005). The
2004–05 general practice activity report (AIHW: Britt et
al. 2005) identified that the withdrawal of rofecoxib (a
Cox-2 inhibitor) from the market had an impact on the
prescription rate of NSAIDs.
Small declines in the prescriptions of other medication
groups were gender-specific. Prescriptions for
antidepressants and anti-anxiety agents fell slightly for
women, and bronchodilator/spasm relaxant, diuretic
and anti-angina medications declined for men.
Prescriptions for dementiaPrescription rates for medications for dementia
are recorded by the PBS and the Repatriation
Pharmaceutical Benefits Scheme (RPBS). Three
dementia-specific drugs (anticholinesterases) are
funded under the two schemes: Donepezil, Galantamine
and Rivastigmine (AIHW 2007e). In 2004–05, there
were 315,020 prescriptions under the PBS/RPBS for
these drugs, with prescriptions for Donepezil making up
the majority (66%).
Medication use
National Health Priority Area conditions The 2004–05 ABS National Health Survey collected
self-report data about medication use (both prescription
pharmaceuticals and other medications) for National
Health Priority Area conditions. National Health Priority
Areas are cancer control, injury prevention and control,
cardiovascular health, diabetes mellitus, mental health,
asthma, and arthritis and musculoskeletal conditions.
The most commonly used medications for priority
conditions by people aged 65 years and over were
medications for heart conditions (Table 31.2). Over 500
per 1,000 older people took medication for a heart
condition in 2004–05; with the rate of use peaking at
600 per 1,000 persons aged 75–84 years.
Medications for arthritis—the second most common
medication for priority conditions—were taken by just
over 300 per 1,000 older people. Like medications for
heart conditions, use of arthritis medication peaked at
ages 75–84 years. The usage rate of medication for
mental well-being, however, continued to increase with
increasing age, with 280 per 1,000 people aged 85
years and over taking medication for mental wellbeing
in 2004–05 (see Topic 23: Mental health).
Medications for diabetes and asthma were used at
much lower rates than the medications used for the
other health conditions. Just over 95 per 1,000 older
people took medication for diabetes and 70 per 1,000
took medication for asthma.

111Older Australia at a glance: 4th edition
USE O
F HEA
LTH A
ND
A
GED
CARE SERV
ICES
Polypharmacy Polypharmacy, the use of multiple medications at a
time, is common among older people. The use of
multiple medications increases with age. A South
Australian survey (Goldney R & Fisher L 2005) found
that 25% of people aged 65 years and over used four or
five medicines concurrently. Although polypharmacy is
often necessary for people with many health conditions
(and may be the best treatment), it increases the risk
of adverse events that can lead to hospitalisation. Data
from the Australian Council for Safety and Quality in
Health Care (2002) (now the Australian Commission on
Safety and Quality in Health Care) show that for older
people, approximately one in five unplanned admissions
to hospital are medication-related.
ExpenditureThe PBS, funded by the Australian Government,
provides a subsidy for over 800 drug substances
(AIHW 2006c). Subsidies are provided to the public
at a general and concession rate. People who hold a
Pensioner Concession Card, Commonwealth Seniors’
Health Card or Australian Government Health Care Card
are eligible for concession benefit. Australians who
are veterans, war widows or widowers and dependants
may additionally be eligible for the RPBS. The White,
Gold and Orange Cards issued by the Department of
Veterans’ Affairs determine the level of access to RPBS
benefits.
Expenditure under the PBS for people of all ages
totalled $6.2 billion in 2005–06 (DoHA: Data and
Modelling Section Pharmaceutical Policy and Analysis
Branch 2006). Benefits paid under the RPBS in
2005–06 totalled $465.7 million (DVA 2006a).
Per person expenditure on pharmaceutical benefits is
higher for older age groups than for younger age groups
(Table A31.1, Costello 2007). Per person expenditure
on pharmaceutical benefits peaks for the 75–84
years year age group where it is 4.5 times total per
person expenditure. About one-fifth of expenditure on
pharmaceutical benefits was for this age group (21%)
and almost one-quarter (24%) was for people aged
65–74 years (Figure 31.1).
Table 31.2: Age-specific usage rates of medications for priority health conditions
Treatment area 65–74 75–84 85+ 65+
Rates per 1,000
Ischaemic heart diseases 485.8 600.7 575.2 535.0
Arthritis 295.9 331.8 309.3 310.1
Mental wellbeing 231.7 246.3 280.3 240.9
Diabetes 98.5 93.7 81.3 95.4
Asthma 78.1 55.6 77.1 69.8
Note: The National Health Survey collects information only from people living in private dwellings. Because a significant proportion of people aged 85 and over live in aged
care facilities, these rates need to be interpreted with this in mind.
Source: AIHW analysis of the 2004—05 ABS National Health Survey (ABS 2006q).
Figure 31.1: Government expenditure on pharmaceuticals by age group, as a proportion of total government
expenditure on pharmaceuticals, 2005–06
Source: Table A31.1.
0
5
10
15
20
25
85+75–8465–7455–6445–5435–4425–3415–245–140–4
Age group
Per cent
112 Older Australia at a glance: 4th edition
The Australian population has shown improved oral
heath over recent decades, with decreased tooth
loss among adults (ABS 1979; AIHW: Carter &
Davies 2002; see also Topic 27: Oral health). This is
most pronounced among adults aged 75 years and
over—the proportion of this age group who have lost
all their teeth has declined from 36% to 27% between
1987–88 and 2004–06. Demographic changes are
projected to increase the population of middle to older
aged adults (see Topic 2: The changing demographic
profile). Consistent with these population trends, there
has been an increase in the proportion of middle-
aged and older adults attending for private dental
care (AIHW: Brennan & Spencer 2006). With declines
in the prevalence of complete tooth loss and in the
numbers of missing teeth, the dental needs of adults
may increase because of the larger pool of teeth at risk
(Joshi et al. 1996).
Changing demographics and technological advances
are expected to lead to higher patient expectations
and to a greater demand for oral health care
(Douglass & Sheets 2000). With more people
retaining their teeth and the age structure of the
population changing, shifts in service provision have
been observed among dental patients in private
general practice and dental service patterns have
changed towards more prevention and maintenance of
natural teeth (Brennan & Spencer 2006).
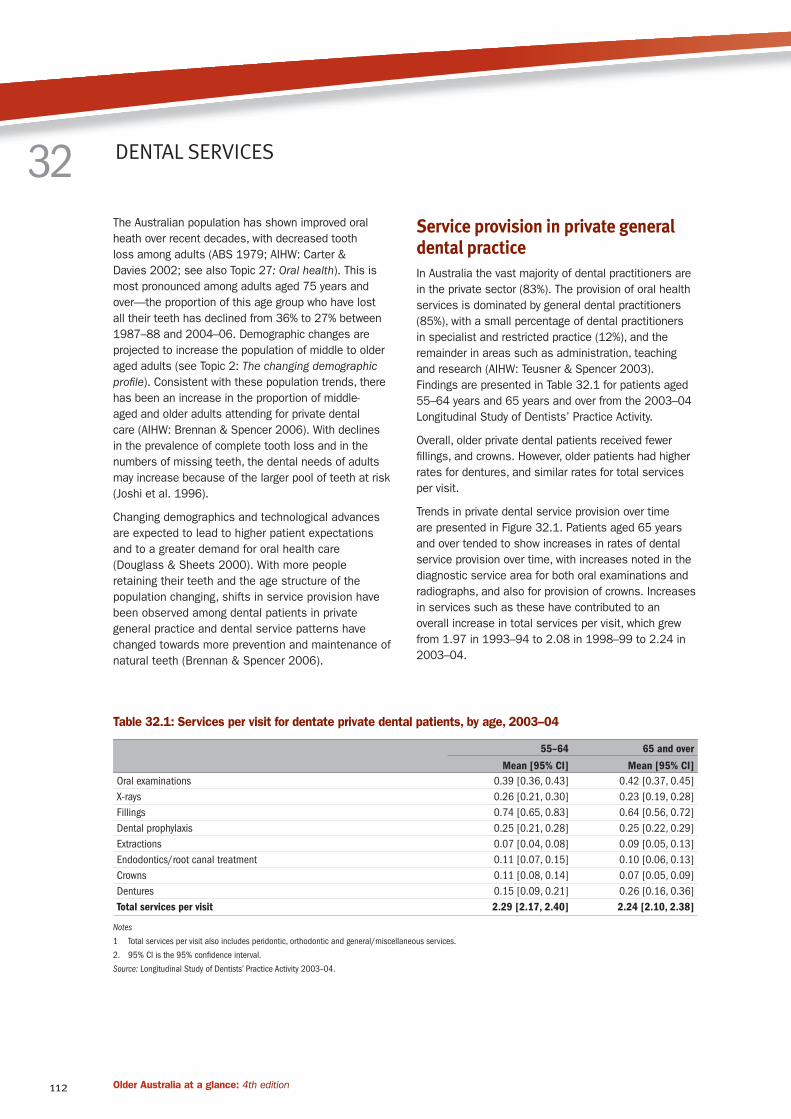
Service provision in private general dental practiceIn Australia the vast majority of dental practitioners are
in the private sector (83%). The provision of oral health
services is dominated by general dental practitioners
(85%), with a small percentage of dental practitioners
in specialist and restricted practice (12%), and the
remainder in areas such as administration, teaching
and research (AIHW: Teusner & Spencer 2003).
Findings are presented in Table 32.1 for patients aged
55–64 years and 65 years and over from the 2003–04
Longitudinal Study of Dentists’ Practice Activity.
Overall, older private dental patients received fewer
fillings, and crowns. However, older patients had higher
rates for dentures, and similar rates for total services
per visit.
Trends in private dental service provision over time
are presented in Figure 32.1. Patients aged 65 years
and over tended to show increases in rates of dental
service provision over time, with increases noted in the
diagnostic service area for both oral examinations and
radiographs, and also for provision of crowns. Increases
in services such as these have contributed to an
overall increase in total services per visit, which grew
from 1.97 in 1993–94 to 2.08 in 1998–99 to 2.24 in
2003–04.
DENTAL SERVICES32
Table 32.1: Services per visit for dentate private dental patients, by age, 2003–04
55–64 65 and over
Mean [95% CI] Mean [95% CI]
Oral examinations 0.39 [0.36, 0.43] 0.42 [0.37, 0.45]
X-rays 0.26 [0.21, 0.30] 0.23 [0.19, 0.28]
Fillings 0.74 [0.65, 0.83] 0.64 [0.56, 0.72]
Dental prophylaxis 0.25 [0.21, 0.28] 0.25 [0.22, 0.29]
Extractions 0.07 [0.04, 0.08] 0.09 [0.05, 0.13]
Endodontics/root canal treatment 0.11 [0.07, 0.15] 0.10 [0.06, 0.13]
Crowns 0.11 [0.08, 0.14] 0.07 [0.05, 0.09]
Dentures 0.15 [0.09, 0.21] 0.26 [0.16, 0.36]
Total services per visit 2.29 [2.17, 2.40] 2.24 [2.10, 2.38]
Notes
1 Total services per visit also includes peridontic, orthodontic and general/miscellaneous services.
2. 95% CI is the 95% confidence interval.
Source: Longitudinal Study of Dentists’ Practice Activity 2003–04.

113Older Australia at a glance: 4th edition
USE O
F HEA
LTH A
ND
A
GED
CARE SERV
ICES
Public dental patientsHealth card holders such as aged pensioners and the
unemployed constitute a low-income group and are the
target population eligible for publicly-funded dental care.
All Australian states and territories provide public dental
services. These services are largely provided at minimal
or no direct cost to the patient by publicly employed
dentists in government clinics located in major regional
centres, often associated with district hospitals or
health centres. These clinics provide access to a
restricted level of care and generally do not include
all aspects of dental treatment (AHMAC Steering
Committee for National Planning for Oral Health 2001).
Adults receiving public dental care have been shown to
have high levels of emergency visits resulting in higher
rates of extraction than patients attending for private
dental care (Brennan et al. 1997). This indicates a
pattern of service provision that is unfavourable to
the goal of maintaining a functional natural dentition
for life. This is most likely to be a reflection of access
problems such as waiting time for dental care among
public dental patients. Findings from the 2001–02 Adult
Dental Programs Survey are presented in Table 32.2
for patients attending for public dental care. A higher
percentage of male public dental patients received
emergency care.
The percentage of public patients receiving emergency
care was higher than that reported for private general
practice (29.2% of visits by people aged 65 and over
were for emergency care).
Figure 32.1: Trends in service provision in private general practice among patients aged 65 and over,
1993–94 to 2003–04
Table 32.2: Dentate public dental patients attending for emergency care, by age and sex, 2001–02
55–64 65–74 75–84 85+ 65+
Per cent
Males 47.2 48.8 52.3 46.7 49.5
Females 43.2 41.5 34.6 41.3 39.5
Persons 45.1 45.2 42.1 44.4 44.3
Source: Adult Dental Programs Survey 2001–02.
0.0
0.1
0.2
0.3
0.4
0.5
0.6
0.7
0.8
2003–04
1998–99
1993–94
DenturesCrownsEndodontics/root canal
ExtractionDental prophyFillingsX-raysOral exams
Services per visit
Service areaSource: AIHW: Brennan & Spencer 2006; see also Table A32.1.

114 Older Australia at a glance: 4th edition
Hospitals are a major component of Australia’s
healthcare system. In 2004–05, hospitals accounted
for over one-third (35% or $29 billion) of recurrent
health expenditure; expenditure on hospitals accounted
for the largest proportion of real growth in recurrent
health expenditure over the decade to 2004–05 (34%;
AIHW 2006d). People in the older age groups make
relatively high use of hospital services, and, hence, an
ageing population presents a significant challenge for
the management of supply of and demand for hospital
services. This chapter examines some key aspects of
hospital use by older people.
Access to hospital care is gained through referral
by a medical practitioner performing primary or
specialist care, through an emergency department, or
via outpatient departments. When a person receives
treatment as an admitted patient, the event is recorded
as a ‘separation’, which indicates that a hospital stay
was formally concluded. If a patient is treated in an
emergency department and is not admitted to hospital,
the event is recorded as a non-admitted patient
emergency department occasion of service.
Number of visits In 2004–05, 2.5 million separations were recorded by
public and private hospitals throughout Australia for
older admitted patients (65 and over), representing 35%
of all separations (Table 33.1; AIHW 2006a).
Separation rates in the older age groups are
considerably higher than the national average
rate. Compared with a crude national rate of 340
separations per 1,000 population (AIHW 2006a), the
age group 65 years and over recorded 926 separations
per 1,000 persons (Table 33.1). Within the mature-
age population, that is, 45 years and over, age-specific
rates of separation increase with increasing age up
to the 75–84 age group, for both males and females.
The older male population recorded a higher rate
of separation compared with older females (1,050
separations per 1,000 males versus 825 per 1,000
females).
Same-day separations constituted 53% of all older
patient separations in 2004–05, which reflects a higher
proportion of same-day separations than multi-day
stays for older male patients. Older female patients
HOSPITAL USE33
Table 33.1: Hospital separations for people aged 45 and over by same-day status, 2004–05
Age (years)/sex
Separations (per cent) Number per
1,000 populationNot same-day Same-day Total Total number
Per cent Number
Males
45–64 37.6 62.4 100.0 988,224 397
65–74 39.2 60.8 100.0 588,474 862
75–84 45.5 54.5 100.0 540,759 1,304
85+ 64.4 35.6 100.0 130,063 1,277
Total 65+ 44.5 55.5 100.0 1,259,296 1,050
Females
45–64 35.5 64.5 100.0 964,971 387
65–74 38.2 61.8 100.0 505,188 705
75–84 51.5 48.5 100.0 510,573 946
85+ 74.3 25.7 100.0 196,261 921
Total 65+ 49.6 50.4 100.0 1,212,022 825
Persons
45–64 36.5 63.5 100.0 1,953,195 392
65–74 38.7 61.3 100.0 1,093,662 782
75–84 48.4 51.6 100.0 1,051,332 1,102
85+ 70.3 29.7 100.0 326,324 1,036
Total 65+ 47.0 53.0 100.0 2,471,318 926
Notes
1. Table includes care types of acute care, rehabilitation, palliative care, geriatric evaluation and management, psychogeriatric care, maintenance care, other admitted
patient care. Excludes care types of hospital boarder and posthumous organ procurement.
2. Rates (per 1,000 population) are based on the estimated resident population at 30 June 2005 (preliminary; ABS 2006d).
Source: AIHW analysis of the National Hospital Morbidity Database.
115Older Australia at a glance: 4th edition
USE O
F HEA
LTH A
ND
A
GED
CARE SERV
ICES
recorded equal proportions of same-day and multi-day
separations. Same-day separations have increased as
a proportion of total separations for both males and
females since 2000–01 (AIHW 2002b). Much of the
shift towards same-day separations for both sexes has
been associated with increases in same-day cataract
procedures and more same-day treatment of endocrine,
nutritional and metabolic conditions.
For both males and females, same-day admission
and discharge accounts for a reducing proportion of
separations as age increases: from 61% of separations
for males aged 65–74 years to just 36% for males
aged 85 years and over, and from 62% of separations
for females aged 65–74 years to 26% of separations
for females aged 85 years and over (Table 29.1).
This probably reflects different patterns of reason
for admission to hospital of the ‘young old’ and the
‘old old’, which can be further explored by looking at
principal diagnosis and care type by age group (see also
Topic 34: Reasons for admission to hospital).
Detailed episode-level data on non-admitted patient
emergency department occasions of service were
reported for 76% of public hospitals in 2004–05. The
data include 797,756 occasions of service for people
aged 65 years and over, which make up approximately
18% of records in the non-admitted patient emergency
department data set (AIHW 2006a).
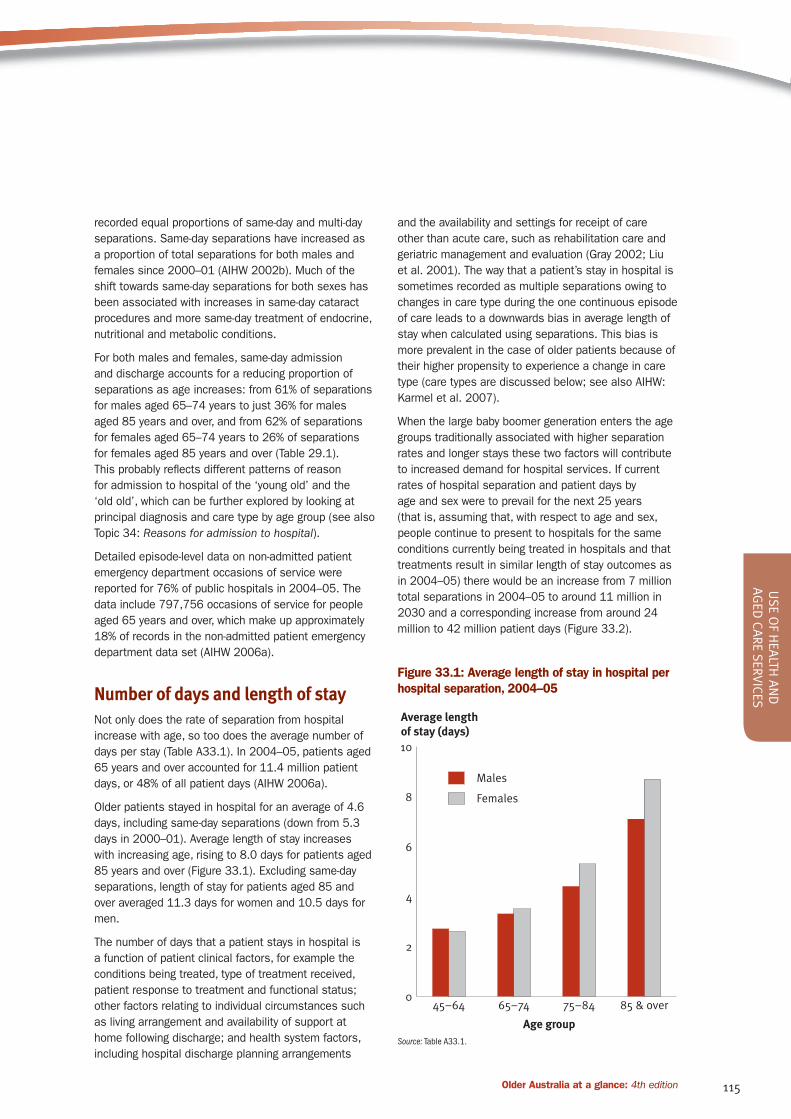
Number of days and length of stayNot only does the rate of separation from hospital
increase with age, so too does the average number of
days per stay (Table A33.1). In 2004–05, patients aged
65 years and over accounted for 11.4 million patient
days, or 48% of all patient days (AIHW 2006a).
Older patients stayed in hospital for an average of 4.6
days, including same-day separations (down from 5.3
days in 2000–01). Average length of stay increases
with increasing age, rising to 8.0 days for patients aged
85 years and over (Figure 33.1). Excluding same-day
separations, length of stay for patients aged 85 and
over averaged 11.3 days for women and 10.5 days for
men.
The number of days that a patient stays in hospital is
a function of patient clinical factors, for example the
conditions being treated, type of treatment received,
patient response to treatment and functional status;
other factors relating to individual circumstances such
as living arrangement and availability of support at
home following discharge; and health system factors,
including hospital discharge planning arrangements
and the availability and settings for receipt of care
other than acute care, such as rehabilitation care and
geriatric management and evaluation (Gray 2002; Liu
et al. 2001). The way that a patient’s stay in hospital is
sometimes recorded as multiple separations owing to
changes in care type during the one continuous episode
of care leads to a downwards bias in average length of
stay when calculated using separations. This bias is
more prevalent in the case of older patients because of
their higher propensity to experience a change in care
type (care types are discussed below; see also AIHW:
Karmel et al. 2007).
When the large baby boomer generation enters the age
groups traditionally associated with higher separation
rates and longer stays these two factors will contribute
to increased demand for hospital services. If current
rates of hospital separation and patient days by
age and sex were to prevail for the next 25 years
(that is, assuming that, with respect to age and sex,
people continue to present to hospitals for the same
conditions currently being treated in hospitals and that
treatments result in similar length of stay outcomes as
in 2004–05) there would be an increase from 7 million
total separations in 2004–05 to around 11 million in
2030 and a corresponding increase from around 24
million to 42 million patient days (Figure 33.2).
Figure 33.1: Average length of stay in hospital per
hospital separation, 2004–05
Source: Table A33.1.
0
2
4
6
8
10
Females
Males
85 & over75–8465–7445–64
Average length of stay (days)
Age group

116 Older Australia at a glance: 4th edition
Type of care receivedHospital separations can be classified according to
the type of care received using the broad categories
of acute care, rehabilitation, palliative care, geriatric
evaluation and management (GEM), psychogeriatric
care, maintenance care or other type of care. Higher
proportions of separations for non-acute care are
observed for the older, compared with younger, patients.
Acute care accounts for lower proportions of
separations for patients aged 75–84 years (74%) and
85 years and over (66%), compared with separations
for patients aged 65–74 years (82%) or under 65 years
(99%) (AIHW 2006a). This is due mainly to higher
proportions of separations in the older age groups that
are classified as rehabilitation or maintenance care.
According to AIHW: Health Data Standards Committee
(2006), maintenance care is ‘care in which the clinical
intent or treatment goal is prevention of deterioration
in the functional and current health status of a patient
with a disability or severe level of functional impairment.
Following assessment or treatment the patient does not
require further complex assessment or stabilisation,
and requires care over an indefinite period. This care
includes that provided to a patient who would normally
receive care in another setting, for example at home,
or in a residential aged care service, by a relative or
carer, that is unavailable in the short term. In 2004–05,
over 26% of patient days for patients aged 85 years
and over were classified as maintenance care or
rehabilitation (Table A33.2).
Figure 33.2: Actual (2004–05) and projected
(2010–2030) annual number of separations and
patient days, by age
Source: AIHW analysis of National Hospital Morbidity Database; ABS 2003d.
0
2
4
6
8
10
12
Total separationsSeparations 85+Separations 45+
203020252020201520102004–05
0
10
20
30
40
50
Total patient daysPatient days 85+
Patient days 45+
203020252020201520102004–05
Year
Separations (million)
Patient days (million)
Year

117Older Australia at a glance: 4th edition
USE O
F HEA
LTH A
ND
A
GED
CARE SERV
ICES
When a person is admitted to hospital, information
about the health conditions that cause or contribute
to admission, or which influence, affect, or arise during
treatment is recorded on the patient record. Of all the
diagnoses recorded, the principal diagnosis is defined
as ‘the diagnosis established, after study, to be chiefly
responsible for occasioning the admitted patient’s
episode of care in hospital’ (AIHW 2006a). This section
examines the principal diagnoses recorded on older
patient separations, with a focus on types of (often
preventable) injury that result in hospitalisation.
When a person experiences multiple chronic health
conditions, it can be difficult to identify one condition
that is responsible for hospitalisation. The interaction
of multiple conditions, medication use and social
factors can contribute significantly to the need for
hospitalisation among older people and the complexity
and cost of treatment. The likelihood of a person having
multiple chronic conditions increases with age, but
good primary care can reduce the risk of hospitalisation
associated with many of these conditions. Another
issue related to demand for hospital services by older
people is their exposure to preventable causes of injury
and their greater likelihood of experiencing an adverse
event during an episode of care. One approach to
managing increasing demand for hospital services by
an ageing population is to monitor and reduce rates of
preventable hospitalisation and adverse events.
Principal diagnosisTable 34.1 shows the number and percentage of
hospital separations of people aged 65 and over
in 2004–05 by principal diagnosis, based on broad
diagnosis categories in the International Classification
of Diseases 10th revision Australian Modification (ICD-
10-AM).
Four of these categories accounted for approximately
60% of older patient separations in 2004–05: Factors
influencing health status and contact with health
services, Diseases of the circulatory system, Neoplasms
(benign and malignant tumours), and Diseases of
the digestive system. The first three were also the
top three when ranked by patient days (Table 34.1).
Injury, poisoning and other consequences of external
causes accounted for a higher number of patient days
(956,977) than Diseases of the digestive system
(713,489) and is thus ranked fourth in terms of older
patient days by principal diagnosis category.
Factors influencing health status and contact with
health services accounted for almost 30% of older
patient separations. Although 85% of separations in
this category were for patients admitted and discharged
on the same day, Factors influencing health status
and contact with health services still accounted for
more older patient days than any other category (Table
34.1). This category covers need for specific types of
medical examination and investigation, care involving
dialysis, care involving rehabilitation procedures,
attention to artificial openings and prosthetic devices,
and presentation of potential health hazards related
to socioeconomic, psychosocial, personal and family
circumstances:
• care involving dialysis accounted for the highest
number of separations of older patients within this
category (399,485), all for patients admitted and
discharged on the same day
• the two diagnoses that accounted for the highest
numbers of older patient days within this category
in 2004–05 were Care involving the use of
rehabilitation procedures (1,337,160 days) and
Problems related to medical facilities and other
health care (656,989 days). Most days recorded
for older patients under the latter code were for
separations coded as Persons awaiting admission
to residential aged care service (452,930 days), for
which average length of stay was 35 days.
Diseases of the circulatory system include any disease
that affects the heart and blood vessels. Angina
pectoris (severe pain over the heart that signals a
possible impending heart attack) was associated with
the highest number of separations of older people in
2004–05 (48,101 separations; average stay 3.7 days).
Principal diagnosis of heart failure was associated with
higher average length of stay (8.1 days) and patient
days (289,386) than angina pectoris, despite fewer
separations (35,920).
Congestive heart failure was the most frequently
recorded specific heart failure principal diagnosis (73%),
accounting for 251,299 older patient days. Congestive
heart failure is one of a number of ‘ambulatory
sensitive care conditions’—chronic conditions for
which access to timely and effective primary care
can reduce the risk of hospitalisation, particularly
in older populations (Culler et al. 1998; Zeng et al.
2006; Menec et al. 2006). Close monitoring of rates
of potentially avoidable hospitalisations for elderly
patients in Australian hospitals contributes to improved
outcomes for older people with chronic conditions and
more effective use of hospital services.
Other cardiovascular principal diagnoses associated
with relatively high volumes of hospital patient days
REASONS FOR ADMISSION TO HOSPITAL 34

118 Older Australia at a glance: 4th edition
include Acute myocardial infarction, commonly known
as heart attack (28,790 separations; average 6.5 days)
and Cerebral infarction, or stroke (11,468 separations;
average 12.5 days).
A neoplasm, or tumour, is an abnormal, uncontrolled
and progressive tissue growth. Tumours can occur
throughout the body but in older people the tumours
associated with the highest number of separations are
those that occur in skin tissue. Malignant melanoma of
skin and Other malignancies of the skin were principal
diagnoses on 50,168 separations of older patients in
2004–05, together accounting for 97,196 patient days.
Malignant neoplasm of the colon (11,585 separations)
and Malignant neoplasm of bronchus and lung, or lung
cancer (11,744 separations), contributed the highest
volumes of patient days for older people: 102,181 and
99,793 days respectively.
Principal diagnoses for digestive system diseases and
disorders were recorded for 222,154 older patient
separations. The most common principal diagnosis in
this category was Diverticular disease of the intestine
(22,618 separations; 64,590 patient days). Diverticular
disease is a condition of the large intestine (colon) in
which small sacs or pouches (diverticula) form at weak
points in the intestinal wall, thought to be caused by
genetic factors or a diet low in fibre (over a third of
older people have reported having diets low in fruit
and vegetables; see Topic 15: Ageing and health risk
factors, Table 15.2). Diverticular disease is a common
diagnosis made by GPs for patients who present with
abdominal pain.
Among principal diagnoses classified as Injury,
poisoning and other consequences of external causes,
fracture of the femur was the most frequently recorded
on older patient separations (21,645). At an average
of 11.8 days per separation, older patients admitted
to hospital for femoral fractures accumulated 254,395
patient days in 2004–05. Fracture of the neck of
femur (hip fracture) is the most frequently recorded
femoral fracture associated with hospitalisation (49%
of separations for femoral fracture). AIHW: Kreisfield &
Newson (2006) have reported that most hip fractures
are the result of falls (91%). The most common
mechanism of falls that result in hospitalisation for
older people with fractures is slipping, tripping and
stumbling on a level surface (AIHW analysis of National
Hospital Morbidity Database). Hip fractures impose
a heavy burden on the community through death and
increased morbidity, causing increased dependency,
reduced quality of life, increased demands on families
for the provision of care, high costs associated with
acute care, rehabilitation and long-term institutional
care (AIHW: Kreisfield & Newson 2006; Swanson et al.
2000).
Other principal diagnoses in this category associated
with high numbers of older patient days in 2004–05
include:
• fracture of lumbar vertebra (6,351 separations;
80,351 patient days)
• complications of internal orthopaedic prosthetic
devices, implants and grafts, such as mechanical
complication, infection or inflammatory reaction
(8,065 separations; 91,727 patient days)
• complications with procedures, not elsewhere
classified, for example, haemorrhage, shock,
accidental puncture during a procedure, or disruption
of an operation wound (10,346 separations; 79,095
patient days).
This overview of the predominant reasons for
hospitalisation of older people serves to highlight
the importance of initiatives that encourage healthy
and active lifestyles (at all ages) and safe living
environments. Successful targeting of the causes of
chronic disease, improved primary care of chronic
conditions, initiatives aimed at reducing injury, and
close monitoring of clinical pathways of older surgical
patients all contribute to reduced population disability
and hospital use.
External causes of injury and illness As indicated above, many admissions to hospital are
the result of factors other than disease processes. An
important category of principal diagnosis as a cause of
hospitalisation is injury and effects owing to external—
often preventable—causes. Injury prevention and
control is one of seven National Health Priority Areas.
The National Falls Prevention for Older People Initiative
sits under this Health Priority Area.
Approximately 122,500 hospital separations for older
patients in 2004–05 were associated with injury,
poisoning or other consequence of an external cause.
In the treatment of injuries it is not uncommon for
patients to be transferred between hospitals or for
a patient episode to be administratively split and
recorded as multiple separations for different types
of care. For example, a patient might remain in the
same hospital but be reclassified from acute care to
rehabilitation care and this would normally generate
two separations for the patient; changes in care type

119Older Australia at a glance: 4th edition
USE O
F HEA
LTH A
ND
A
GED
CARE SERV
ICES
Table 34.1: Separations and patient days for patients aged 65 and over by principal diagnosis (ICD-10-AM
chapter), all hospitals 2004–05
Principal diagnosis
(ICD-10-AM chapter)
Not
same-day Same-day Total
Not
same-day Same-day Total Patient days
Number Per cent Number
Factors influencing health status
and contact with health services 110,662 631,925 742,587 9.5 48.3 30.0 2,851,885
Diseases of the circulatory system 217,318 49,147 266,465 18.7 3.8 10.8 1,580,402
Neoplasms 121,751 120,800 242,551 10.5 9.2 9.8 1,147,160
Diseases of the digestive system 108,268 113,886 222,154 9.3 8.7 9.0 713,489
Symptoms, signs and abnormal
clinical and laboratory findings 89,198 62,835 152,033 7.7 4.8 6.2 481,719
Diseases of the eye and adnexa 15,592 130,486 146,078 1.3 10.0 5.9 158,607
Diseases of the musculoskeletal
system and connective tissue 88,900 37,519 126,419 7.7 2.9 5.1 701,508
Injury, poisoning and other
consequences of external causes 100,785 21,764 122,549 8.7 1.7 5.0 956,977
Diseases of the respiratory system 102,507 11,259 113,766 8.8 0.9 4.6 829,546
Diseases of the genitourinary
system 63,693 31,108 94,801 5.5 2.4 3.8 385,936
Endocrine, nutritional and
metabolic diseases 30,271 25,470 55,741 2.6 1.9 2.3 286,536
Diseases of the nervous system 30,849 15,096 45,945 2.7 1.2 1.9 274,122
Mental and behavioural
disorders 23,444 16,908 40,352 2.0 1.3 1.6 540,321
Blood, blood-forming organs and
immunological disorders 17,519 20,599 38,118 1.5 1.6 1.5 110,609
Disease of the skin and
subcutaneous tissue 20,098 14,382 34,480 1.7 1.1 1.4 205,933
Infectious and parasitic diseases 15,496 2,612 18,108 1.3 0.2 0.7 151,287
Diseases of the ear and mastoid
process 4,393 2,755 7,148 0.4 0.2 0.3 19,192
Congenital malformations 642 587 1,229 0.1 — — 4,358
All ICD chapters 1,161,386 1,309,138 2,470,524 . . . . . . 11,399,587
Not reported/not applicable(a) 527 267 794 — — — 23,659
Total 1,161,913 1,309,405 2,471,318 100.0 100.0 100.0 11,423,246
(a) Includes 792 separations with a missing principal diagnosis and two with principal diagnosis of condition originating in the perinatal period.
Note: Separations for which the care type was reported as Hospital boarder or Posthumous organ procurement are excluded.
Source: AIHW analysis of the National Hospital Morbidity Database.

120 Older Australia at a glance: 4th edition
are recorded as statistical admissions and statistical
discharges. Eleven per cent of these injury-related
separations were patient transfers (in-transfers)
or change in care type, leaving just over 109,000
‘hospitalisations’ of people aged 65 years and over
with a principal diagnosis of injury and one or more
external causes recorded (Table A34.1). The following
discussion refers to these hospitalisations, not total
injury-related separations.
At age 65 years and over, the rate of hospitalisation for
injury increases markedly with increasing age. In 2004–
05 there were around 78 injury-related hospitalisations
per 1,000 men aged 85 and over and 100 per 1,000
women aged 85 years and over, compared with around
25 per 1,000 men and 25 per 1,000 women aged 65–
74 years (Table A34.1). Falls were the most frequently
recorded external cause, followed by complications of
medical and surgical care (Table A34.2). Home was the
most common place of occurrence of falls that resulted
in hospitalisation (approximately 49% of cases),
followed by aged care facilities (22%).
National hospital data on falls and complications of
medical and surgical care do not distinguish injuries
and complications that occur after admission to
hospital, that is, where a patient is admitted to hospital
for another reason and experiences an adverse event in
hospital. It has been found that older patients are more
susceptible to adverse events during a stay in hospital,
compared with younger patients3. For example, the
occurrence of adverse events associated with elective
surgery increases with age: an estimated 22% of
patients aged 65 years and over who undergo elective
procedures experience one or more complications
(Moje et al. 2006) and patients who experience a
post-admission adverse event have an estimated
mean age of 62.9 years (Ehsani et al. 2006). Ehsani
and colleagues estimated the cost of post-admission
adverse events in public hospitals in Victoria alone in
2003–04 to have been $460.3 million (adverse events
that take place during a hospital stay can be identified
in the Victorian Admitted Patient Episode Data Set).
3 The relevant data element ‘Diagnosis onset type’ (primary or post-
admit condition) is defined in the National Health Data Dictionary
(AIHW: Health Data Standards Committee 2006) but is not currently
implemented in the Admitted Patient National Minimum Data Set.

121Older Australia at a glance: 4th edition
USE O
F HEA
LTH A
ND
A
GED
CARE SERV
ICES
The Aged Care Assessment Program (ACAP) is jointly
funded by the Australian Government and state
and territory governments to support a network of
multidisciplinary Aged Care Assessment Teams (ACATs)
which operate as a single point of entry to packaged
and residential aged care services and as a point of
referral to other aged care services. ACATs assess
people referred because they need assistance. A
referral for ACAT assessment may be a self-referral or it
may come via family or friends, health care practitioners
or community services known to the person. ACAT
assessment of a person’s care needs takes into
account physical, medical, psychological and social
factors and facilitates access to appropriate care
services.
ACAT approval is a prerequisite for admission to
Australian Government accredited aged care homes
(for either permanent or respite care), or to receive a
Community Aged Care Package (CACP), an Extended
Aged Care at Home (EACH) or Extended Aged Care at
Home Dementia (EACH-D) package or a place in the
Transition Care Program (TCP). ACATs also function
as a source of advice and referral concerning other
community services such as those provided by the
Home and Community Care Program and the National
Respite for Carers Program, but they do not determine
eligibility for these services.
Aged Care Assessment TeamsACATs may be hospital–or community-based. The
main professional groups represented in teams are
doctors, nurses, social workers, physiotherapists and
occupational therapists. The number and composition
of staff on teams can vary depending on the location of
the team (i.e. whether they are in urban, rural or remote
regions), and the role, operation and organisation of
teams vary between jurisdictions, partly reflecting the
different health system environments within which they
operate.
Client profilesAlthough the target population for services accessed
through ACAT assessment is people aged 70 years and
over and Indigenous people aged 50 and over, access
to services is based on assessment of care needs,
not merely chronological age. Although not part of the
ACAT target group, young people with disability may be
assessed by ACATs if their care needs cannot be met
by other sources.
Almost half of all ACAP clients in 2004–05 (49%) were
aged 80–89 years and a further 16% were aged 90
years and over (ACAP NDR 2006:Table 30). Only 3%
of ACAP clients were aged less than 60. The average
age of clients has increased since 1995–96, with an
increase in the proportion aged 85 years and over (from
30% in 1995–96 to 39% in 2004–05). The majority of
ACAP clients are female (63%).
Almost three-quarters of clients assessed in 2004–05
(72%) had a severe or profound core activity limitation,
that is, they needed assistance or supervision with self-
care, movement activities, moving around places at or
away from home, or communication (ACAP NDR 2006:
Table 35a).
The most common diagnosed health conditions among
ACAP clients were diseases of the heart (50,311
clients), arthritis (48,284), hypertension (45,294)
and dementia (41,707) (ACAP NDR 2006:Table
AB19a). Arthritis was the most commonly recorded
main condition, that is, the health condition that has
most impact on the person’s need for assistance with
activities of daily living and social participation. Arthritis
was the main health condition for 29,158 clients,
followed by dementia (13,889), diseases of the heart
(12,980) and eye and vision disorders (12,459) (ACAP
NDR 2006:Table AB19b).
Assessments and recommendationsRecommendations and approvals in relation to care
needs and care arrangements are made following
comprehensive assessment and remain valid for 12
months unless otherwise specified. If a person’s care
needs change to the extent that a different level or type
of care is required within a 12-month period, he or she
may need to be reassessed. Once approval is granted
and should the client wish to proceed, the client is then
directed to the appropriate service providers. Receipt
of services is then subject to the availability of places
and other such considerations as client and family care
preferences.
Generally, the waiting time to receive an ACAT
assessment is short. In 2004–05, the median waiting
time for ACAP clients was 8 days from referral to the
first face-to-face contact (ACAP NDR 2006). Ninety
per cent of clients received a first face-to-face contact
within 47 days. The length of time clients wait for their
first clinical intervention and first face-to-face contact
varies according to the priority category accorded to
them, their location at assessment and certain client
characteristics. Hospital-based assessments were
AGED CARE ASSESSMENT 35

122 Older Australia at a glance: 4th edition
undertaken much more quickly than those in residential
care or in the community. This is partly because of
the efficiencies that result when several clients are
located in the same facility. Clients were less likely
to wait a long time for assessment if they had a core
activity limitation, had a non-resident carer, or had used
residential respite care.
In 2004–05, over half of the clients living in the
community at assessment (54%) were recommended
to remain in the community; around one-quarter were
recommended for low-level residential care and 19%
were recommended to high-level care. Of those clients
living in low-level residential care at assessment, 79%
were recommended for high-level care (Table 35.1).
In 2004–05, there were 13,964 younger ACAP clients
living in the community at assessment, and 59.1%
of this group were recommended to remain in the
community. The remainder were slightly more likely to
be recommended for high-level residential care (20%)
than low-level care (19%).
Clients with a primary diagnosis of dementia, clients
with a severe or profound core activity limitation and
clients assessed in hospital were all less likely to
be recommended to remain in the community and
more likely not only to receive a recommendation for
residential care but a recommendation for high-level
care (ACAP NDR 2006).
Assistance with activitiesMore than half of clients living in the community at
assessment were already receiving assistance, formal
or informal, with housework (65%), transport (57%),
and meals (56%) before ACAT assessment (ACAP NDR
2006: Tables AB15 and 38B). Thirty-seven per cent
had been receiving help with personal care. Across
most assistance types, relatively more clients had been
receiving assistance from informal providers (family
and friends) than from formal providers. Particularly in
the areas of mobility, transport, social and community
participation and communication, informal providers of
assistance provide help to the majority of ACAT clients
with needs in those areas.
Around one third of clients living in the community
at assessment had not been accessing government-
funded community care programs. Of those with a
known history of using community care programs,
most (52%) had been receiving assistance from HACC,
followed by CACP (14%).
For those clients with a recommendation to live in
the community (88,012), domestic assistance was
recommended for 58% and meals assistance for
38%; assistance with health and personal care were
recommended for 35% and 31% respectively. More than
one-third of these clients were recommended to receive
help with transport (40%) and social participation (37%)
(ACAP NDR 2006: Tables AC20 and 38B).
Table 35.1: ACAT assessment outcomes, recommended long-term care setting by usual accommodation
setting, 2004–05
Recommended long-term care setting
Community
Low-level
residential
care
High-level
residential
care
Other/
missing Total
Total
(number)
per cent
Usual accommodation setting
Community 54.3 25.4 18.8 1.5 100.0 152,696
Residential aged care service— low care 0.9 19.0 78.6 1.5 100.0 11,654
Residential aged care service—high care 5.3 11.2 78.9 4.7 100.0 1,751
Other/missing 45.5 20.8 24.2 9.5 100.0 10,776
Total 49.8 24.6 23.7 2.0 100.0 176,877
Notes
1. Table includes MDS version1 and MDS version2 data for complete assessments only as appropriate (clients of all ages).
2. Figures in the table reflect percentages (and numbers) of recommendations for completed assessments. A person can have more than one assessment per year.
Source: ACAP NDR 2006:Tables 38a, 38b.

123Older Australia at a glance: 4th edition
USE O
F HEA
LTH A
ND
A
GED
CARE SERV
ICES
The Home and Community Care (HACC) Program is the
main provider of home-based care services in Australia.
It provides a range of services to both frail older people
and younger people with disability as well as their
carers. The program was created in 1984 (via the Home
and Community Care Act 1985) following a report of
the House of Representatives Standing Committee on
Expenditure (HRSCE 1982), and brought together into
one system a range of separately funded programs.
HACC is funded jointly by the Australian Government
and state and territory governments.
In 2004–05 (the most recent data available in time for
publication) approximately 3,250 agencies delivered
HACC services, 3,100 of which reported service
provision data for the HACC Minimum Data Set (MDS)
collection (DoHA 2006a). Nearly 60% of HACC clients
in 2004–05 were referred to the program by formal
services such as general practitioners, hospitals, or
other government or non-government organisations. The
remainder were either self-referred or referred by family
or friends (DoHA 2006a).
Client profileIn 2004–05, HACC provided assistance to over
744,000 people, 75% of whom were aged 65 years and
over. Two-thirds of older clients were women, with the
single biggest group being women aged between 75
and 84 years (32% of all older clients) (Table A36.1).
People using HACC services have a younger profile than
people in residential aged care or people receiving care
HOME AND COMMUNITY CARE PROGRAM 36
Table 36.1: Home and Community Care clients aged 65 and over, by assistance type and age, 2004–05
Assistance type
65–74 75–84 85+ 65 and over(a)
Clients
Rate per
1,000(b) Clients
Rate per
1,000(b) Clients
Rate per
1,000(b) Clients
Rate per
1,000(b)
Assessment, case management or
case planning(c) 62,400 44.6 121,700 127.6 69,400 220.2 254,300 97.6
Domestic assistance 38,200 27.3 83,000 86.9 48,500 154.1 169,900 65.2
Meals (at home or at a centre)(c) 21,100 15.1 56,200 58.9 42,800 136.0 120,600 46.3
Nursing (home or centre based)(c) 29,500 21.1 52,300 54.8 34,500 109.4 116,600 44.8
Transport 22,400 16.0 48,100 50.4 25,800 81.7 97,000 37.2
Allied health (at home or at
centre)(c) 29,100 20.8 43,200 45.3 21,900 69.5 94,600 36.3
Home maintenance 22,900 16.3 45,900 48.1 22,000 69.8 90,900 34.9
Centre based day care 15,500 11.1 28,700 30.1 16,600 52.8 61,000 23.4
Social support 13,000 9.3 27,700 29.0 18,100 57.5 59,100 21.8
Personal care 9,400 6.7 21,500 22.5 18,500 58.7 49,400 19.0
Counselling 11,500 8.2 18,300 19.2 9,900 31.5 40,000 14.8
Provision of aids/car
modifications(c) 7,400 5.3 12,700 13.3 7,400 23.6 27,600 10.6
Home modification 4,500 3.2 8,900 9.4 4,500 14.3 18,000 6.9
Respite care 2,200 1.5 2,100 2.2 700 2.2 5,200 2.0
Other food services 500 0.4 1,000 1.0 800 2.6 2,300 0.9
Linen services 200 0.1 400 0.5 300 1.0 900 0.4
Total clients 143,400 102.5 265,700 278.5 149,600 474.9 561,800 207.5
Total clients (%) 25.5 . . 47.3 . . 26.6 . . 100.0 . .
(a) Includes clients with missing age.
(b) Usage per 1,000 people in the age group.
(c) Assistance type includes more than one category. Clients are counted only once per assistance type. For example, a client receiving allied health service both at home and
at a centre is counted only once for allied health services.
Notes
1. For 2004–05, 3,100 agencies submitted data to the HACC MDS.
2. Age is calculated at the end of the period. Clients with missing age are assumed to be over 65 and are included in 65+ totals.
3. Total number of clients is less than the sum of all clients as people may receive more than one type of assistance.
Source: AIHW analysis of the HACC (MDS). Methodological differences result in slightly different numbers from those published in the HACC MDS 2004–05 annual bulletin.

124 Older Australia at a glance: 4th edition
packages in the community. Looking at clients aged 65
and over, only 27% of those receiving HACC services
were aged 85 years and over, compared with 40% of
people using Community Aged Care Packages, 33% of
people using Extended Aged Care at Home packages
and 57% of all older people in permanent residential
aged care (see also Topic 37: Community Aged Care
Packages, Topic 38: Extended Aged Care and at Home
and Extended Aged Care at Home Dementia Packages
and Topic 40: Residential aged care: resident profiles).
Service provisionHACC clients may receive assistance over a
prolonged period, or for just a short period of time.
Of the 561,800 older people receiving assistance at
some stage in 2004–05, around 355,000 received
assistance in any one quarter of the year. Clients aged
85 years and over were more likely to have received
assistance more continuously throughout the year
(40%) than clients aged 65–74 years (31%) (AIHW
analysis of HACC MDS).
Table 36.2: Quarterly median volume(a) and total volume of Home and Community Care services used, by
assistance type and age, 2004–05
Assistance type
65–74 75–84 85+ All 65+ 65–74 75–84 85+ All 65+
Quarterly median(a) Annual total service volume (’000)
Centre-based day care (hours) 33 40 45 40 1,951.6 3,996.4 2,449.1 8,413.5
Respite care (hours) 26 23 17 24 167.8 136.4 36.3 350.7
Personal care (hours) 12 12 13 12 454.6 834.3 776.6 2,066.2
Domestic assistance (hours) 9 9 9 9 1,150.3 2,426.1 1,447.7 5,028.0
Other food services (hours) 8 7 9 8 18.2 24.1 23.8 66.2
Social support (hours) 7 8 9 8 315.9 673.5 485.8 1,482.9
Nursing (home or centre based) (hours)(b) 4 4 5 4 429.8 834.6 608.1 1,880.2
Home maintenance (hours) 3 3 3 3 167.5 331.7 158.1 660.3
Assessment, case management or case
planning (hours)(b) 2 2 2 2 319.6 600.9 378.0 1,304.9
Allied health (at home or centre-based)
(hours)(b) 1 1 1 1 149.8 221.6 112.0 484.9
Counselling (hours) 1 1 1 1 66.1 80.3 36.7 186.2
Total hours 7 8 9 8 5,191.4 10,159.9 6,512.2 21,924.0
Meals (at home or centre) (b) 18 26 37 29 1,511.8 4,732.5 4,270.6 10,548.3
Linen services (deliveries) 7 7 6 7 3.8 8.1 6.2 18.2
Transport (one-way trips) 8 8 11 9 720.6 1,637.2 985.8 3,359.1
Home modification ($) 70 68 66 68 1,381.3 2,394.6 1,020.9 4,801.7
Provision of aids/car modifications (number)(a) 2 2 2 2 44.4 73.0 40.6 158.2
Average number of types of assistance(c) 1.7 1.8 1.9 1.8 . . . . . . . .
(a) HACC service is reported quarterly. In 2004–05, 33% of clients received assistance in only one quarter, 17% in two quarters,14% in three quarters and 36% in four
quarters. As median service provision is strongly influenced by the number of quarters in which a client receives assistance, this table shows the median amount of
service received in any one quarter. The annual service received by a HACC client is broken down by quarters; a client who received assistance in all four quarters will
contribute four times to the calculation of the quarterly median amount of service.
(b) Assistance type includes more than one category. Clients are counted only once per assistance type in any one quarter. For example, a client receiving allied health
service both at home and at a centre in the same quarter is counted only once for allied health services for that quarter.
(c) Average of the 15 assistance categories listed in the table.
Notes
1. For 2004–05, 3,100 agencies submitted data to the HACC MDS.
2. Age is calculated at the end of the period. Clients with missing age are assumed to be over 65 and are included in 65+ totals.
3. ‘Median’ amount of assistance is the value of an item where half the clients are below this value and half are above it. Median measures in this table refer only to those
clients who received that particular type of assistance in the 12–month period.
4. Table includes a small proportion of clients with very heavy reported use. These are unlikely to affect the median value.
Source: AIHW analysis of the HACC MDS. Methodological differences result in slightly different numbers from those published in the HACC MDS 2004–05 annual bulletin.
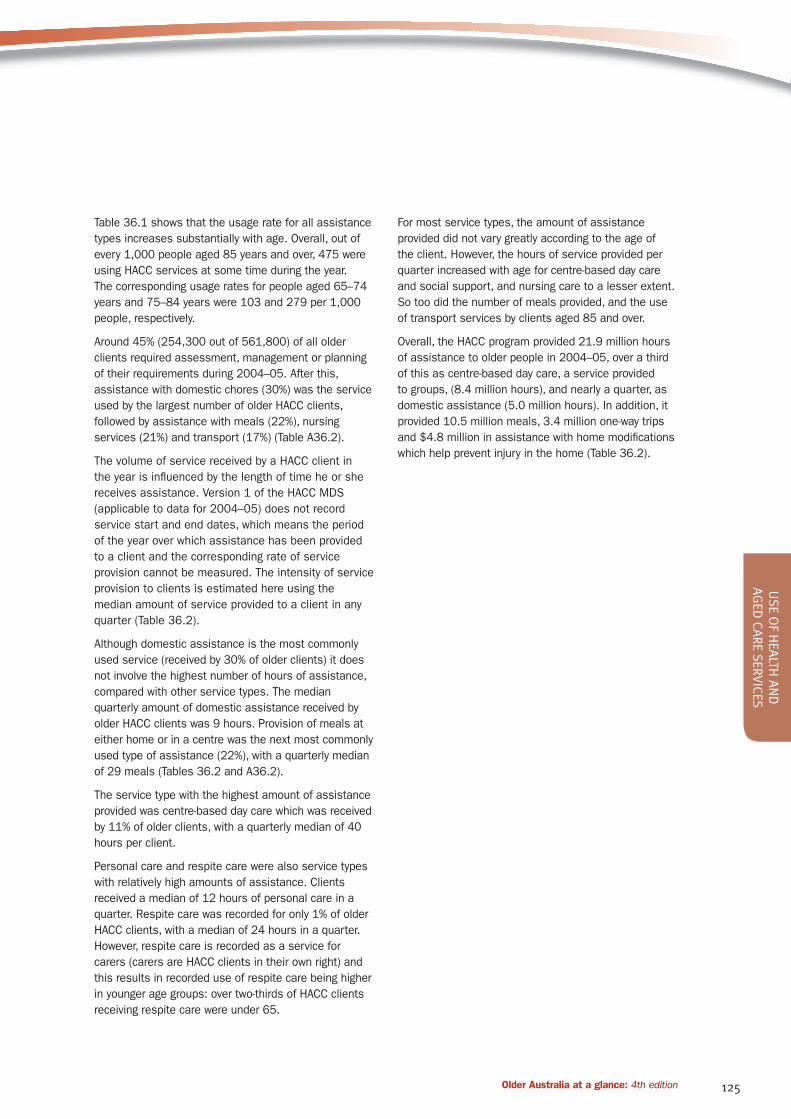
125Older Australia at a glance: 4th edition
USE O
F HEA
LTH A
ND
A
GED
CARE SERV
ICES
Table 36.1 shows that the usage rate for all assistance
types increases substantially with age. Overall, out of
every 1,000 people aged 85 years and over, 475 were
using HACC services at some time during the year.
The corresponding usage rates for people aged 65–74
years and 75–84 years were 103 and 279 per 1,000
people, respectively.
Around 45% (254,300 out of 561,800) of all older
clients required assessment, management or planning
of their requirements during 2004–05. After this,
assistance with domestic chores (30%) was the service
used by the largest number of older HACC clients,
followed by assistance with meals (22%), nursing
services (21%) and transport (17%) (Table A36.2).
The volume of service received by a HACC client in
the year is influenced by the length of time he or she
receives assistance. Version 1 of the HACC MDS
(applicable to data for 2004–05) does not record
service start and end dates, which means the period
of the year over which assistance has been provided
to a client and the corresponding rate of service
provision cannot be measured. The intensity of service
provision to clients is estimated here using the
median amount of service provided to a client in any
quarter (Table 36.2).
Although domestic assistance is the most commonly
used service (received by 30% of older clients) it does
not involve the highest number of hours of assistance,
compared with other service types. The median
quarterly amount of domestic assistance received by
older HACC clients was 9 hours. Provision of meals at
either home or in a centre was the next most commonly
used type of assistance (22%), with a quarterly median
of 29 meals (Tables 36.2 and A36.2).
The service type with the highest amount of assistance
provided was centre-based day care which was received
by 11% of older clients, with a quarterly median of 40
hours per client.
Personal care and respite care were also service types
with relatively high amounts of assistance. Clients
received a median of 12 hours of personal care in a
quarter. Respite care was recorded for only 1% of older
HACC clients, with a median of 24 hours in a quarter.
However, respite care is recorded as a service for
carers (carers are HACC clients in their own right) and
this results in recorded use of respite care being higher
in younger age groups: over two-thirds of HACC clients
receiving respite care were under 65.
For most service types, the amount of assistance
provided did not vary greatly according to the age of
the client. However, the hours of service provided per
quarter increased with age for centre-based day care
and social support, and nursing care to a lesser extent.
So too did the number of meals provided, and the use
of transport services by clients aged 85 and over.
Overall, the HACC program provided 21.9 million hours
of assistance to older people in 2004–05, over a third
of this as centre-based day care, a service provided
to groups, (8.4 million hours), and nearly a quarter, as
domestic assistance (5.0 million hours). In addition, it
provided 10.5 million meals, 3.4 million one-way trips
and $4.8 million in assistance with home modifications
which help prevent injury in the home (Table 36.2).

126 Older Australia at a glance: 4th edition
Community Aged Care Packages (CACPs) are funded by
the Australian Government and began in 1992 as an
alternative to low-level residential aged care. It provides
home-based care to frail or disabled older people
living in the community following an ACAT assessment
and recommendation. A CACP provides a package of
assistance managed by a care coordinator, who manages
the complex care needs of the recipients and arranges
provision of the following types of assistance: personal
care, domestic assistance, social support, assistance
with meal preparation and other food services, respite
care, rehabilitation support, home maintenance, delivered
meals, linen services and transport.
A CACP recipient is not excluded from receiving
additional community care if required. For example,
CACPs do not provide nursing services or allied health
care but these services are offered by the Home and
Community Care (HACC) Program. An exploratory study
(AIHW: Karmel & Braun 2004) found that at least 35%
CACP recipients were using at least one HACC service
in the second half of 2002, and that 11% of CACP
recipients were using HACC nursing services.
Growth in CACPsThe CACP program has grown rapidly since its inception,
from 235 packages in 1992 to 35,383 at 30 June
2006 (Figure 37.1). This 2006 figure equates to 18.2
packages per 1,000 persons aged 70 and over. There
were 1,011 service outlets providing these packages
throughout Australia as at 30 June 2006.
In 2005–06, the Australian Government target for
community aged care provision was 20 operational
places and packages per 1,000 persons aged 70
and over. The majority of these packages are currently
CACPs, but Extended Aged Care at Home (EACH)
packages are emerging as a significant community
care option for people with high care needs (see Topic
38: Extended Aged Care at Home and Extended Aged
Care at Home Dementia Packages). The combined
operational provision ratio for CACPs, EACH and EACH
Dementia packages at 30 June 2006 was 19.9 per
1,000 persons aged 70 and over (AIHW 2007a).
Profile of CACP recipientsAt 30 June 2006, a large proportion of CACP recipients
were aged 85 and over (38%), with 3% aged 95 and over.
Around 6% of package recipients were younger than 65,
and less than 1% of recipients were under the age of 50
(derived from Table 37.1). Female recipients predominated
in all age groups, varying from 59% of all recipients under
age 50, to 74% of all recipients aged 85 years and over.
Over 59% of all package recipients were women aged 75
years and over (derived from Table 37.1).
37 COMMUNITY AGED CARE PACKAGES
Figure 37.1: Number of Community Aged Care Packages, 1992–2006.
Source: Table A37.1.
0
5,000
10,000
15,000
20,000
25,000
30,000
35,000
40,000
200620052004200320022001200019991998199719961995199419931992
Year (at 30 June)
Number of operational packages

127Older Australia at a glance: 4th edition
USE O
F HEA
LTH A
ND
A
GED
CARE SERV
ICES
At 30 June 2006, of those with known responses, over
half of CACP recipients lived alone and a further 41%
lived with family. A small proportion (5%) lived with others.
Almost two-thirds (62%) owned their own home, and 12%
lived in public rental housing. Only 6% lived in a private
rental property and 1% lived in boarding or lodging houses.
Length of time on CACPOf those care recipients who left the program in 2005–
06, 48% entered a residential aged care service, and
18% died. The proportion of men who ceased receiving
the service and entered a residential aged care service
was lower (44% of male care recipients) than that
for women (51%). Conversely, there were a higher
proportion of deaths among men (24%) than among
women (16%). Just over half of the care recipients
leaving the program had been clients for more than 1
year (52%); 19% had used a package for 3 years or
more (Figure 37.2).
Table 37.1: Community Aged Care Package recipients, by age and sex, at 30 June 2006
Age
Females Males Persons
Number Per cent Number Per cent Number Per cent
0–49 110 0.5 76 0.8 186 0.6
50–54 110 0.5 118 1.3 228 0.7
55–59 297 1.3 215 2.4 512 1.6
60–64 570 2.5 335 3.7 905 2.8
65–69 1,104 4.9 700 7.7 1,804 5.7
70–74 1,855 8.2 933 10.2 2,788 8.8
75–79 3,705 16.3 1,593 17.4 5,298 16.7
80–84 5,918 26.1 2,076 22.7 7,994 25.1
85–89 5,391 23.8 1,866 20.4 7,257 22.8
90–94 2,900 12.8 971 10.6 3,871 12.2
95+ 702 3.1 258 2.8 960 3.0
Total 22,662 100.0 9,141 100.0 31,803 100.0
Source: AIHW analysis of DoHA Aged and Community Management Information System (ACCMIS) database.
Figure 37.2: Length of time with a CACP, separations, 2005–2006.
Source: Table A37.2.
0
5
10
15
20
25
4+years
3–<4years
2–<3years
1–<2years
39–<52 weeks
26–<39weeks
13–<26 weeks
8–<13 weeks
4–<8weeks
<4weeks
Length of time
Per cent

128 Older Australia at a glance: 4th edition
Extended Aged Care at Home (EACH) packages are
funded by the Australian Government to deliver care at
home to people who are otherwise eligible for high-level
residential care. EACH started as a pilot in 2000 and
was established as a program in 2002. At 30 June
2006 there were 2,580 available EACH packages and
2,131 EACH recipients. EACH packages provide a
similar range of care services as CACPs (see Topic 37:
Community Aged Care Packages), with the addition of
nursing and allied health care services.
EACH Dementia is a new program with packages
specifically aimed at frail older people with dementia
related high-care needs. A care recipient on an EACH
Dementia package can access the same types of
assistance that are available to an EACH package care
recipient. However, delivery of that assistance may be
provided using a more flexible approach and strategies
that are appropriate for people with dementia. In
addition, EACH Dementia packages also provide access
to dementia-specific specialist services and support
(DoHA 2005a).
The first allocation of 667 EACH Dementia packages
occurred in December 2005, and a total of 2,000
packages will be allocated over 4 years. At 30 June
2006 there were 601 operational EACH Dementia
packages and 297 EACH Dementia recipients.
Access to both types of package requires approval from
an Aged Care Assessment Team (ACAT). The combined
provision of EACH and EACH Dementia packages
per 1,000 persons aged 70 and over was 1.6. The
combined operational provision ratio for CACPs, EACH
and EACH Dementia packages at 30 June 2006 was
19.9 per 1,000 persons aged 70 and over (AIHW
2007a).
Profile of EACH package recipientsAs at 30 June 2006, 70% of EACH recipients were aged
75 and over and 31% were aged 85 and over (Table
38.1). Around 7% of recipients were aged less than 65.
Women predominate, especially at older ages where
they make up 71% of all recipients aged 85 years
and over. Of the EACH recipient population, 61% were
women.
Similar proportions (163 clients; 58%) of EACH
Dementia package recipients were women. Forty-four
per cent of EACH Dementia recipients were younger
than age 80. This proportion is higher than in CACP
(37%) and slightly lower than EACH (49%). Nearly 7% of
EACH Dementia package recipients were aged less than
65 although none were under age 50.
EXTENDED AGED CARE AT HOME AND EXTENDED AGED CARE AT HOME DEMENTIA PACKAGES38
Table 38.1: EACH recipients by age and sex, 30 June 2006
Age group
Females Males Persons
Number Per cent Number Per cent Number Per cent
0–49 6 0.5 5 0.6 11 0.5
50–54 9 0.7 4 0.5 13 0.6
55–59 19 1.5 12 1.4 31 1.5
60–64 46 3.6 46 5.5 92 4.3
65–69 104 8.1 97 11.5 201 9.4
70–74 144 11.2 142 16.9 286 13.4
75–79 206 16.0 198 23.5 404 19.0
80–84 284 22.0 155 18.4 439 20.6
85–89 240 18.6 107 12.7 347 16.3
90–94 158 12.3 57 6.8 215 10.1
95+ 73 5.7 19 2.3 92 4.3
Total 1,289 100.0 842 100.0 2,131 100.0
Note: This table excludes EACH Dementia recipients.
Source: AIHW analysis of DoHA Aged and Community Care Management Information System (ACCMIS) database.

129Older Australia at a glance: 4th edition
USE O
F HEA
LTH A
ND
A
GED
CARE SERV
ICES
EACH packages are available in all states and
territories, with the majority of recipients living in major
cities (1,378). There were no recipients in remote areas
but 535 recipients lived in inner regional areas and 218
recipients lived in outer regional areas.
A high percentage of care recipients live with others
(76%) reflecting the importance of informal care (mostly
provided by family) in supporting high-care recipients
in their homes. The majority lived with family. Living
arrangement was not recorded for 16% of recipients
but some were reported to have a co-resident carer.
An even higher proportion of EACH Dementia package
recipients lived with others—83% lived with family and
4% lived with others.
Most EACH package recipients (90%) were receiving
assistance from a carer at the time of their ACAT
assessment; 74% had a co-resident carer. Almost
all EACH Dementia package recipients (97%) were
receiving assistance from a carer at the time of ACAT
assessment, reflecting the critical need for assistance
from both formal service providers and from family
and/or friends. Most care recipients (85%) had a co-
resident carer, but 12% had a carer who did not live
with the care recipient.
Length of stayThe amount of data on length of stay within the EACH
program is limited and current patterns may change
as the program matures. However, of those recipients
who left the program between 1 July 2005 and 30 June
2006, 30% had received an EACH package for less than
3 months and 75% had used a package for less than 1
year (Figure 38.1). Overall, 44% left an EACH package
to enter residential care; 35% died and 9% went into
hospital (Table 38.2). Among those who received a
package for less than one 1 month, almost equal
proportions died (39%) as entered residential aged care
(38%).
Figure: 38.1: Length of time on EACH package, separations 2005–06
Source: Table A38.1.
0
5
10
15
20
25
4+ years3–<4years
2–<3years
1–<2years
39–<52 weeks
26–<39weeks
13–<26 weeks
8–<13 weeks
4–<8weeks
<4weeks
Length of stay
Per cent

130 Older Australia at a glance: 4th edition
Table 38.2: EACH separations, length of stay by separation mode, 2005–06
Length of stay Death To hospital
To residential
aged care
Resident
withdrew Other Total
Number
<4 weeks 24 2 23 7 5 61
4 to <8 weeks 41 14 41 6 5 107
8 to <13 weeks 49 12 65 7 7 140
13 to <26 weeks 69 19 99 7 18 212
26 to <39 weeks 50 7 80 5 10 152
39 to <52 weeks 32 12 46 6 16 112
1 to <2 years 72 18 78 7 18 193
2 to <3 years 20 5 24 2 4 55
3 to <4 years 2 0 2 0 0 4
4+ years 2 0 3 1 1 7
Total 361 89 461 48 84 1,043
Per cent (row)
<4 weeks 39.3 3.3 37.7 11.5 8.2 100.0
4 to <8 weeks 38.3 13.1 38.3 5.6 4.7 100.0
8 to <13 weeks 35.0 8.6 46.4 5.0 5.0 100.0
13 to <26 weeks 32.5 9.0 46.7 3.3 8.5 100.0
26 to <39 weeks 32.9 4.6 52.6 3.3 6.6 100.0
39 to <52 weeks 28.6 10.7 41.1 5.4 14.3 100.0
1 to <2 years 37.3 9.3 40.4 3.6 9.3 100.0
2 to <3 years 36.4 9.1 43.6 3.6 7.3 100.0
3 to <4 years 50.0 0.0 50.0 0.0 0.0 100.0
4+ years 28.6 0.0 42.9 14.3 14.3 100.0
Total 34.6 8.5 44.2 4.6 8.1 100.0
Note: EACH Dementia packages are not included.
Source: AIHW 2007a.
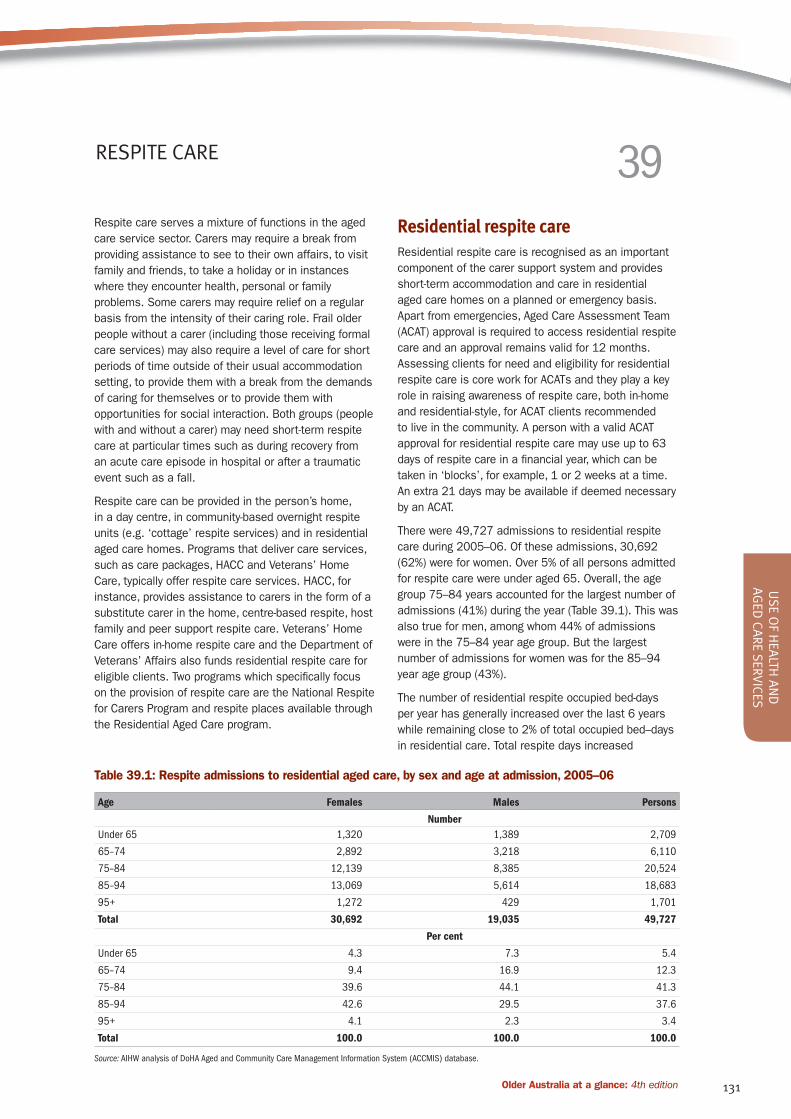
131Older Australia at a glance: 4th edition
USE O
F HEA
LTH A
ND
A
GED
CARE SERV
ICES
Respite care serves a mixture of functions in the aged
care service sector. Carers may require a break from
providing assistance to see to their own affairs, to visit
family and friends, to take a holiday or in instances
where they encounter health, personal or family
problems. Some carers may require relief on a regular
basis from the intensity of their caring role. Frail older
people without a carer (including those receiving formal
care services) may also require a level of care for short
periods of time outside of their usual accommodation
setting, to provide them with a break from the demands
of caring for themselves or to provide them with
opportunities for social interaction. Both groups (people
with and without a carer) may need short-term respite
care at particular times such as during recovery from
an acute care episode in hospital or after a traumatic
event such as a fall.
Respite care can be provided in the person’s home,
in a day centre, in community-based overnight respite
units (e.g. ‘cottage’ respite services) and in residential
aged care homes. Programs that deliver care services,
such as care packages, HACC and Veterans’ Home
Care, typically offer respite care services. HACC, for
instance, provides assistance to carers in the form of a
substitute carer in the home, centre-based respite, host
family and peer support respite care. Veterans’ Home
Care offers in-home respite care and the Department of
Veterans’ Affairs also funds residential respite care for
eligible clients. Two programs which specifically focus
on the provision of respite care are the National Respite
for Carers Program and respite places available through
the Residential Aged Care program.
Residential respite careResidential respite care is recognised as an important
component of the carer support system and provides
short-term accommodation and care in residential
aged care homes on a planned or emergency basis.
Apart from emergencies, Aged Care Assessment Team
(ACAT) approval is required to access residential respite
care and an approval remains valid for 12 months.
Assessing clients for need and eligibility for residential
respite care is core work for ACATs and they play a key
role in raising awareness of respite care, both in-home
and residential-style, for ACAT clients recommended
to live in the community. A person with a valid ACAT
approval for residential respite care may use up to 63
days of respite care in a financial year, which can be
taken in ‘blocks’, for example, 1 or 2 weeks at a time.
An extra 21 days may be available if deemed necessary
by an ACAT.
There were 49,727 admissions to residential respite
care during 2005–06. Of these admissions, 30,692
(62%) were for women. Over 5% of all persons admitted
for respite care were under aged 65. Overall, the age
group 75–84 years accounted for the largest number of
admissions (41%) during the year (Table 39.1). This was
also true for men, among whom 44% of admissions
were in the 75–84 year age group. But the largest
number of admissions for women was for the 85–94
year age group (43%).
The number of residential respite occupied bed-days
per year has generally increased over the last 6 years
while remaining close to 2% of total occupied bed–days
in residential care. Total respite days increased
RESPITE CARE 39
Table 39.1: Respite admissions to residential aged care, by sex and age at admission, 2005–06
Age Females Males Persons
Number
Under 65 1,320 1,389 2,709
65–74 2,892 3,218 6,110
75–84 12,139 8,385 20,524
85–94 13,069 5,614 18,683
95+ 1,272 429 1,701
Total 30,692 19,035 49,727
Per cent
Under 65 4.3 7.3 5.4
65–74 9.4 16.9 12.3
75–84 39.6 44.1 41.3
85–94 42.6 29.5 37.6
95+ 4.1 2.3 3.4
Total 100.0 100.0 100.0
Source: AIHW analysis of DoHA Aged and Community Care Management Information System (ACCMIS) database.

132 Older Australia at a glance: 4th edition
from 968,791 in the year ending 30 June 2000 to
1,095,220 in the year ending 30 June 2006. There is
no obvious year-by-year trend.
Average completed length of stay for respite care was
3.1 weeks in 2005–06. It had declined from 3.5 weeks
in 1998–99 to 3.1 weeks in 2002–03, after which it
has remained stable (AIHW 2007f). A residential respite
bed is used on average between 15 and 17 times in a
year for respite residents.
Use of respite care can also be considered in relation
to the population aged 70 and over, and the population
aged 65 and over with a severe or profound limitation
as shown in Figure 39.1. In terms of these measures
of provision, respite use has doubled in both cases
between 1991–92 and 2005–06. The ratio of occupied
bed-days per 1,000 persons with a severe or profound
limitation peaked in 1999–00 at 1,979 but then
declined year by year to 1,713 days in 2003–04
(approximately the 1996–97 level). This ratio has
increased over the last 2 years and in 2005–06 it was
1,783. In contrast, the ratio of occupied bed-days per
1,000 persons aged 70 and over has remained within
a narrower band between 1996–1997 and 2005–06 of
around 550 days.
By providing support for people living at home and
their carers, residential respite can delay or obviate
the need to enter permanent residential care. It
can also be a ‘stepping stone’ towards permanent
residential care. About one-fifth (19%) of admissions to
permanent care are transfers of residents from respite
care to permanent care (transfers are defined as
admissions following separation within the residential
aged care system within 2 days). Further, around
40% of residential respite care clients are admitted
to permanent residential aged care within 3 months
of using respite (AIHW: Karmel 2006). Analysis of
ACAT recommendations also supports the view that
residential respite is often a precursor to permanent
placement: at each level of client dependency a higher
likelihood of ACAT recommendation for permanent
residential care is associated with the previous use of
residential respite ( ACAP NDR 2006:176, 183). Less
commonly, people may be connected, or reconnected,
to community care services as a result of a period of
residential respite.
Figure 39.1: Occupied residential aged care respite bed-days per 1,000 persons in stated population, for
financial years 1991–92 to 2005–06
0
500
1,000
1,500
2,000
Aged 70+
Aged 65+ with severe or profound restriction
200
5–0
6
2004
–0
5
2003
–04
2002
–03
200
1–02
200
0–
01
1999
–0
0
1998
–99
1997
–98
1996
–97
1995
–96
1994
–95
1993
–94
1992
–93
1991
–92
Year
Days per1,000 persons
Source: Table A39.1.

133Older Australia at a glance: 4th edition
USE O
F HEA
LTH A
ND
A
GED
CARE SERV
ICES
Community-based respite care Respite care in the community is provided through
the Home and Community Care (HACC) program,
the Community Aged Care Package (CACP) program,
Extended Aged Care at Home (EACH) packages and the
Veterans’ Home Care program (see Topic 36: Home
and Community Care Program, Topic 37: Community
Aged Care Packages, Topic 38: Extended Aged Care
at Home and Extended Aged Care at Home Dementia
Packages and Topic 45: Older Veterans). The Australian
Government also funds respite care services, through
the National Respite for Carers Program (NRCP).
The NRCP funds direct and indirect respite care options,
offering respite care in a range of accommodation
settings, including day centres, host homes, overnight
cottages and in-home respite services. These services
can be arranged by Commonwealth Respite and
Carelink Centres (Centres) on behalf of clients. In
2004–05, approximately 56,000 carers received direct
respite care through the Centres where the primary
purpose of the respite care was to meet the needs of
carers by the provision of a break from their caring role.
Under the NRCP, Centres are able to purchase short–
term and emergency respite for carers. This includes
indirect respite options which offer the ‘side benefit’
of providing help to carers by relieving them from the
other tasks of daily living, which may or may not be
directly related to their caring responsibility. The carers
remain the main focus although the services provided
are for the people being cared for, including domestic
assistance, social support, meals, and nursing/
personal care and showering assistance.
Over the last decade there has been substantial
growth in the provision of in-home respite care
under the HACC Program. In 2004–05, 82% of HACC
agencies participated in annual reporting for the HACC
Minimum Data Set. The coverage is higher than the
figures indicate, because non-participation by smaller
agencies contributed to the bulk of the information
gap. Nevertheless, the figures stated below are
underestimates of the actual statistics. In 2004–05
HACC provided respite services to 16,452 people with
an average number of 92.6 hours of assistance during
the period. This compares with 14,889 clients who
received HACC respite services in 2001–2002 with an
average of 86.3 hours of assistance.
HACC also provided centre-based day care (which is
often called centre-based respite care) to 80,802
clients with an average of 137.9 hours of assistance
in 2004–05, compared with 60,050 clients with an
average of 121.9 hours in 2001–02. Note that respite
care, centre-based day care and home meals provided
by far the highest average number of hours per client of
all the types of HACC assistance (DoHA 2002, 2006a).
Data about the provision and use of respite care by care
package recipients is not available through an ongoing
data collection. In a 2002 Census of Community Aged
Care Package recipients, 1,144 of 25,410 recipients
received respite care as part of their package with an
average of 3.3 hours of assistance during the census
week (AIHW 2004b).
Karmel reported that people who use community care
services in conjunction with residential respite tend
to enter permanent residential aged care later than
those who use only residential respite care (AIHW:
Karmel 2006). This apparent interaction between
use of residential respite and community care for
delaying admission to permanent residential care has
important implications. It indicates the importance of
timely access to community care, particularly systems
and processes to identify people who need formal
assistance before carers reach crisis point.
Several initiatives are seeking to develop models of
respite care for groups of carers with special needs,
including the Employed Carer Innovation Pilots and
the Overnight Respite in Community Houses initiative
introduced under the National Respite for Carers
Program.

134 Older Australia at a glance: 4th edition
Permanent residential aged care provides
accommodation and care services to people who are
no longer able to support themselves or be supported
by others in their own homes. Government makes a
substantial financial contribution to residential aged
care in the form of subsidised daily care fees and
payments for concessional residents and residents
with special needs in Australian Government-accredited
aged care homes with recurrent funding of $5.3 billion
in 2005–06. This includes funding appropriated through
the Department of Health and Ageing as well as funding
for veterans in residential care through the Department
of Veterans’ Affairs (DoHA 2006b).
The number of occupants in residential aged care
places at 30 June each year has steadily increased
from 132,655 in 1997, to 138,929 in 2002 and
154,872 in 2006. Although there is growing provision
of care packages which may prevent or delay entry into
residential aged care (see Topic 37: Community Aged
Care Packages and Topic 38: Extended Aged Care at
Home and Extended Aged Care at Home Dementia
packages), the pattern over the last 10 years has
still seen regular annual increases in the number of
residential aged care places and residents.
Age and sexAt 30 June 2006, there were 151,737 permanent
residents and 3,135 respite residents in residential
aged care (Table A40.1;AIHW 2007f). Around 72%
of permanent residents were women. By far the
majority of permanent residents were aged 75 years
and over (87%); 53% were aged 85 years and over,
and 7% were 95 years and over. The proportion of
permanent residents who were aged 80 years and over
increased from 64% in 1998–99 to 71% in 2005–06.
In younger age groups, men have proportionally higher
representation than women. For example, only 20% of
women were under age 80 compared with 39% of men.
This gender pattern reverses in older age groups with
58% of females being 85 years and over compared
with 37% of men. At 30 June 2006 there were 6,562
residents of aged care services who were under 65,
which equates to 4% of all permanent residents. Of
these, less than half (47%) were women (Figure 40.1).
Marital statusA majority of permanent residents at 30 June 2006
were widowed at the time they entered an aged care
service (57%). Widowhood was predominant among
female residents—68% of women were widows but
only 29% of men were widowers (AIHW 2007f). In
contrast, relatively more men than women in permanent
residential aged care were married or in a de facto
relationship (41% of men compared with 18% of
women), single (16% of men compared with 8% of
women) or divorced (9% of men, 4% of women).
Birthplace and Indigenous statusAlmost three-quarters of aged care residents were
born in Australia (73%), with most of the remainder
born in the United Kingdom and Ireland (11%) and
‘other’ areas of Europe (11%) (AIHW 2007f). Given
the increasing diversity in the origins of older people,
these proportions could be expected to change over
the coming decade, (see Topic 1: Age, sex and cultural
diversity and Topic 2: The changing demographic
profile).
There were also 872 Indigenous Australians in
mainstream permanent residential aged care. This
may be an underestimate, however, as 5% of residents
(6,972 people) did not report their Indigenous status.
At 30 June 2006, an additional 2,283 places were
provided by services receiving flexible funding under the
Aboriginal and Torres Strait Islander Aged Care Strategy,
40 RESIDENTIAL AGED CARE: RESIDENT PROFILES
Figure 40.1: Residents in aged care by age and
sex, 30 June 2006
Source: AIHW analysis of DoHA Aged and Community Care Management
Information System (ACCMIS) database.
0
10,000
20,000
30,000
40,000
50,000
60,000
Males
Females
95+85–9475–8465–74< 65Age group
Number

135Older Australia at a glance: 4th edition
USE O
F HEA
LTH A
ND
A
GED
CARE SERV
ICES
and from Multi-Purpose Services which serve people in
rural and remote communities (AIHW 2007f).
Need for assistanceThe Resident Classification Scale (RCS) provides a
measure of dependency of people in residential aged
care based on an appraisal of care needs carried out
by the service provider. Providers use the instrument to
determine the level of care needed by a client across a
number of functional domains. The level of Australian
Government care subsidy to services is based on the
level of care need indicated by each resident’s score
on this scale. Phasing-in of the Aged Care Funding
Instrument (ACFI) to replace the RCS is planned to begin
in 2008. This instrument will produce a different, though
comparable, measure of client dependency (DoHA 2005d).
Over two-thirds of residents (69%) are classified as
high-care (RCS categories 1–4). A larger proportion
of younger residents have high levels of dependency
compared with older residents (except for those aged
95 and over). Seventy-five per cent of those under 65
were classified as high-care along with 74% of those
aged 95 years and over. There were few differences
between male and female residents in relation to
dependency levels.
Residents’ need for different types of assistance over
the past 8 years is shown in Table 40.2. The area where
need for assistance has increased most in this period
is bowel management (an increase of 21 percentage
points). There have been steady increases in the
proportions of residents needing assistance in most of
the remaining categories. More than 90% of residents
required assistance with personal hygiene (95% in 2006)
and communication (96% in 2006) over the whole period.
Incontinence is considered a significant predictor for
institutionalisation of older people (see AIHW 2006b).
In 2006, 88% of permanent residents needed some
assistance with bowel management, 70% needed
assistance with toileting, and 69% needed assistance
with bladder management (Table 40.2). Estimates of
the prevalence and severity of incontinence among
permanent aged care residents suggested that, in 2003,
75,300 residents experienced profound problems with
urinary and/or faecal incontinence and a further 48,000
had severe problems (AIHW 2006b: Table 6.10).
Table 40.1: Dependency levels of permanent residents, by age, 30 June 2006
High dependency
(RCS1–RCS4)
Low dependency
(RCS5–RCS8)
Total
(RCS1–RCS8)
Age Number
Under 65 4,911 1,594 6,505
65–69 3,343 1,321 4,664
70–74 5,922 2,360 8,282
75–79 13,083 5,347 18,430
80–84 22,561 10,579 33,140
85–89 25,624 13,367 38,991
90–94 19,690 9,586 29,276
95+ 8,334 2,892 11,226
Total 103,468 47,046 150,514
Per cent
Under 65 75.5 24.5 100.0
65–69 71.7 28.3 100.0
70–74 71.5 28.5 100.0
75–79 71.0 29.0 100.0
80–84 68.1 31.9 100.0
85–89 65.7 34.3 100.0
90–94 67.3 32.7 100.0
95+ 74.2 25.8 100.0
Total 68.7 31.3 100.0
Note: This table excludes 1,223 residents whose dependency levels were not reported at 30 June 2006.
Source: AIHW analysis of DoHA Aged and Community Care Management Information System (ACCMIS) database.
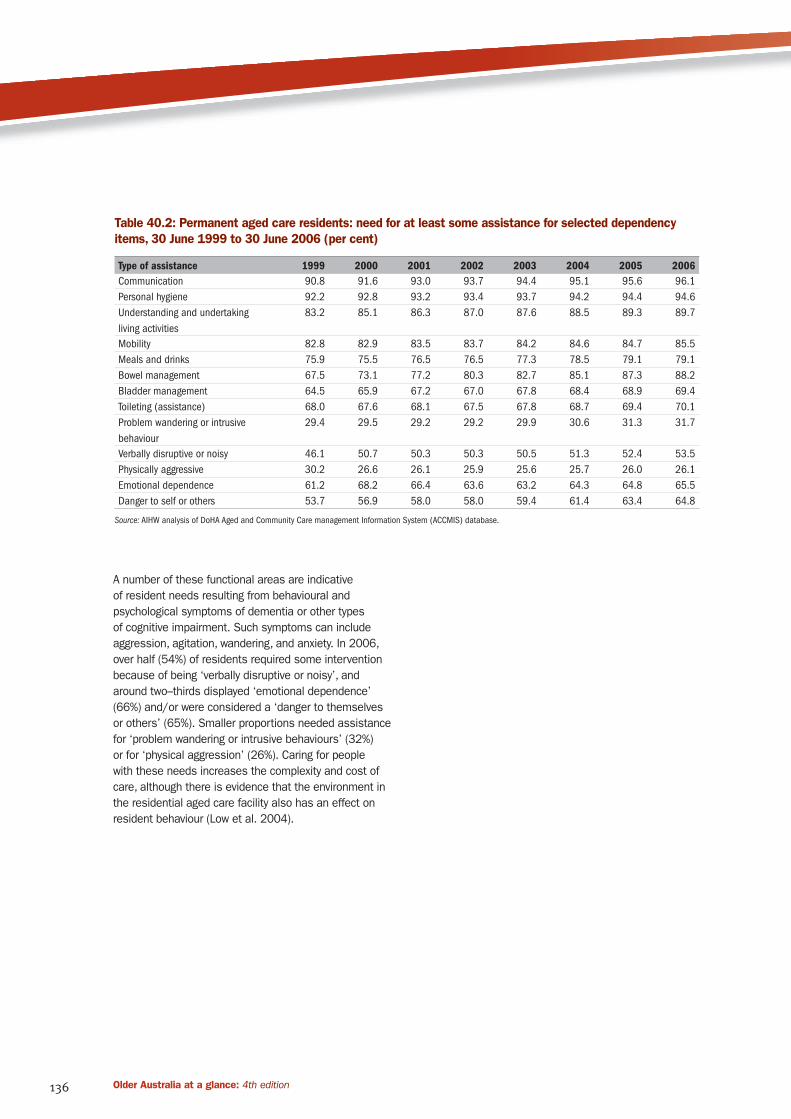
136 Older Australia at a glance: 4th edition
A number of these functional areas are indicative
of resident needs resulting from behavioural and
psychological symptoms of dementia or other types
of cognitive impairment. Such symptoms can include
aggression, agitation, wandering, and anxiety. In 2006,
over half (54%) of residents required some intervention
because of being ‘verbally disruptive or noisy’, and
around two–thirds displayed ‘emotional dependence’
(66%) and/or were considered a ‘danger to themselves
or others’ (65%). Smaller proportions needed assistance
for ‘problem wandering or intrusive behaviours’ (32%)
or for ‘physical aggression’ (26%). Caring for people
with these needs increases the complexity and cost of
care, although there is evidence that the environment in
the residential aged care facility also has an effect on
resident behaviour (Low et al. 2004).
Table 40.2: Permanent aged care residents: need for at least some assistance for selected dependency
items, 30 June 1999 to 30 June 2006 (per cent)
Type of assistance 1999 2000 2001 2002 2003 2004 2005 2006
Communication 90.8 91.6 93.0 93.7 94.4 95.1 95.6 96.1
Personal hygiene 92.2 92.8 93.2 93.4 93.7 94.2 94.4 94.6
Understanding and undertaking
living activities
83.2 85.1 86.3 87.0 87.6 88.5 89.3 89.7
Mobility 82.8 82.9 83.5 83.7 84.2 84.6 84.7 85.5
Meals and drinks 75.9 75.5 76.5 76.5 77.3 78.5 79.1 79.1
Bowel management 67.5 73.1 77.2 80.3 82.7 85.1 87.3 88.2
Bladder management 64.5 65.9 67.2 67.0 67.8 68.4 68.9 69.4
Toileting (assistance) 68.0 67.6 68.1 67.5 67.8 68.7 69.4 70.1
Problem wandering or intrusive
behaviour
29.4 29.5 29.2 29.2 29.9 30.6 31.3 31.7
Verbally disruptive or noisy 46.1 50.7 50.3 50.3 50.5 51.3 52.4 53.5
Physically aggressive 30.2 26.6 26.1 25.9 25.6 25.7 26.0 26.1
Emotional dependence 61.2 68.2 66.4 63.6 63.2 64.3 64.8 65.5
Danger to self or others 53.7 56.9 58.0 58.0 59.4 61.4 63.4 64.8
Source: AIHW analysis of DoHA Aged and Community Care management Information System (ACCMIS) database.

137Older Australia at a glance: 4th edition
USE O
F HEA
LTH A
ND
A
GED
CARE SERV
ICES
Population ageing poses challenges for the provision
of aged care to growing numbers of older people,
particularly when the fastest rates of population growth
are among the very old age groups (see Topic 1, Age,
sex and cultural diversity). A key mechanism used by
the Australian Government in planning residential aged
care service provision is the planning target for levels
of provision relative to population. In 2006, this target
was 88 residential aged care places per 1,000 persons
aged 70 and over. Of these 88 places, 40 were targeted
to high-care places and 48 to low-care places. This
planning target has applied since 2004—before that
the planning target for residential aged care was 90
places per 1,000 persons aged 70 years and over (50
targeted to low-care and 40 targeted to high-care).
Only a small proportion of the older population of
Australia is in residential aged care at any point in
time, and use among those aged 65 years and over
has declined from 5.9% in 1997 to 5.7% in 2006. This
decline needs to be understood in the context of the
growing provision and use of aged care packages in
the community (see Topic 37: Community Aged Care
Packages and Topic 38: Extended Aged Care at Home
and Extended Aged Care at Home Dementia Packages).
Supply of residential aged care placesAt 30 June 2006, there were 166,291 operational
residential aged care places, including 2,273 places
provided by Multi-Purpose Services and places funded
under the Aboriginal and Torres Strait Islander Aged
Care Strategy (AIHW 2007f). The number of residential
aged care places has grown by 19% since 1998.
Although the absolute number of places has been
increasing steadily, the ratio of operational places to
the population aged 70 and over (the provision ratio)
decreased between 1995 when the provision ratio was
92.2 and 2002 when it reached 81.7 (Table 41.1).
Since then the ratio has increased quite substantially—
in 2006, it was 85.6, compared to the planning ratio of
88. Provisional figures indicate that the provision ratio
for residential care will rise to 86.8 at 30 June 2007.
Taken together, the overall provision ratio (residential
and community places) had increased from 96.4 in
2002 to 109.3 places for every 1,000 people aged 70
and over (DoHA unpublished data); above the combined
target of 108 places.
Aged Care Approval Rounds cater for the ongoing
provision of new residential places and aged care
packages in the community (CACPs and EACH
packages) that are needed to achieve the planning
targets. Service providers who receive an allocation
of new places and/or packages are required to make
them operational within 2 years or the places are either
reallocated or renegotiated. In the year to 30 June
2006, the main allocation from the planning round
announced on 15 December 2005 was 11,112 places
and packages of which 28% were low-care places,
19% were high-care places, 39% were CACPs and 14%
were EACH packages (AIHW 2007f). Allocations from
the rounds in 2004–05 and onwards are still not fully
reflected in the number of operational places.
Table 41.1: Operational residential aged care
places, 30 June 1996 to 30 June 2006
Year
Number of
places
Places per 1,000
persons aged
70 and over
1996(a) 136,851 90.6
1997(a) 139,058 89.2
1998 139,917 87.1
1999 141,698 85.6
2000 142,342 83.6
2001 144,013 82.2
2002 146,268 81.7
2003 151,181 82.8
2004 156,580 84.2
2005 161,765 85.3
2006 166,291 85.6
(a) Combines nursing homes and hostels places. From 1 October 1997
nursing homes and hostels were combined into a single residential
aged care system.
Notes
1. Places available in Multi-Purpose Services and places supplied with
flexible funding under the Aboriginal and Torres Strait Islander
Aged Care Strategy have been included since 1999.
2. Ratios are recalculated using updated population data.
Source: AIHW 2007f.
Residential aged care service providersAs at 30 June 2006, there were 2,931 mainstream
residential aged care services in Australia providing a total
of 164,008 places (AIHW 2007f). Also at 30 June 2006,
Multi-Purpose Services provided 1,951 residential care
places, and services receiving flexible funding under the
Aboriginal and Torres Strait Islander Aged Care Strategy
provided 332 residential care places. The number of
mainstream services has declined since 30 June 1998
when a total of 3,015 services provided residential aged
care. At the same time, the corresponding number of
operational places has risen, resulting in an increase
in the average number of places per facility from 46 at
30 June 1998 to 60 at 30 June 2006.
RESIDENTIAL AGED CARE: PATTERNS OF SUPPLY AND USE 41

138 Older Australia at a glance: 4th edition
At a national level, the main providers of residential
aged care services were religious organisations (29%),
private providers (26%), community-based providers
(17%) and charitable organisations (15%). There are
state and territory variations in this service provider
profile (AIHW 2007f).
Use by age and sexRates of use of residential aged care increase with
age—in 2006 rates of residency for people aged 85
years and over were 153 per 1,000 men and 284 per
1,000 women. This compares with rates of 41 per
1,000 men and 66 per 1,000 women aged 75–84
years in the same year. Use of residential aged care
is higher for women than men (Figure 41.1). These
are similar patterns of use of residential aged care in
the 65–74 year age group for both men and women.
However, at older ages, use by women is substantially
higher than that by men.
At all ages there has been a decrease in usage rates
between 2000 and 2006 which is particularly marked
among the older groups. To some extent this reflects
the growing availability and use of community care
options by people who are assessed as eligible for
residential aged care (see Topic 37: Community Aged
Care Packages and Topic 38: Extended Aged Care at
Home and Extended Aged Care at Home Dementia
Packages).
Patterns of use by dependencyThere has been a consistent and long-term trend of
rising dependency levels among permanent residents,
as measured by scores on the Resident Classification
Scale (RCS) (Gray 2001; see also AIHW report
Residential aged care in Australia, published annually).
Table 41.2 shows changes in the distribution of
residents across the eight RCS categories between
1998 and 2006. The most dramatic change in use
can be seen in the highest care category (RCS 1). The
proportion of residents classified as RCS 1 has more
than tripled, from 7% in 1998 to 23% in 2006. At the
other end of the scale, the proportion of residents
assessed as needing least care (in categories RCS 7
and RCS 8) has declined from 20% to 9% and from 5%
to less than half a percent, respectively.
Figure 41.1: Age- and sex-specific usage rates of residential aged care, 30 June 2000, 2003 and 2006.
0
50
100
150
200
250
300
350
2006
2003
2000
85+75–8465–7485+75–8465–74
Number per1,000 persons
Males Females
Age group
Source: Table A41.1.

139Older Australia at a glance: 4th edition
USE O
F HEA
LTH A
ND
A
GED
CARE SERV
ICES
Length of stay The number of residents staying in residential aged
care for 5 years or more increased from 17% at 30
June 1999 to 23% in 2002, and at 30 June 2006 was a
little lower at 21%. The proportion of shorter stays has
decreased over the same period (Table 41.3). As at 30
June 2006, 39% of permanent residents had already
stayed 3 years or more and over one-fifth had stayed 5
years or more. In part, these patterns reflect structural
changes in residential aged care since 1997. Under
the unified system of residential aged care, low and
high care may often be provided in the same aged care
home, resulting in increased lengths of stay for those
moving between low and high care.
The data in Table 41.3 measure the length of stay of
an existing resident up to a particular point in time (in
this case, 30 June each year). It does not take into
account how much more time an existing resident will
spend in care before leaving; it also excludes residents
who separated before the 30 June in the year reported.
Figure 41.2 shows differences in average completed
length of stay for male and female permanent residents
who left care during a financial year since 2001–02.
In general, female residents have longer average
completed length of stay than their male counterparts.
For separations during 2005–06, female and male
residents had average lengths of stay of 167 weeks
and 109 weeks respectively. The aggregate completed
length of stay for the period of separations was 146
weeks. These differences between males and females
have been consistent over the time period examined.
Death was the major reason for separation from
permanent residential aged care in 2005–06 (87%);
4% returned to the community, 4% moved to another
residential aged care service and 5% were discharged
to hospitals (AIHW 2007f). Among those who died, 17%
had stayed for less than 3 months, 19% for between 3
months and 1 year, 45% for 1 to 5 years and 20% for
5 years and more. People leaving residential aged care
after a shorter period of stay were more likely to return
to the community and less likely to die in residential
aged care than those with longer periods of stay.
Table 41.2: Permanent residents, by level of dependency, at 30 June 1998 to 30 June 2006
Year RCS 1 RCS 2 RCS 3 RCS 4 RCS 5 RCS 6 RCS 7 RCS 8 Total
1998 6.9 24.9 20.3 5.7 7.7 9.7 20.3 4.5 100.0
1999 12.4 25.9 17.9 4.6 8.6 10.1 17.4 3.1 100.0
2000 14.4 26.0 16.7 4.7 8.9 10.3 16.8 2.3 100.0
2001 17.3 25.5 15.6 4.7 9.9 10.6 14.9 1.7 100.0
2002 18.9 25.3 14.8 4.6 10.5 10.8 13.8 1.4 100.0
2003 20.5 24.6 14.6 4.7 11.1 10.8 12.7 1.0 100.0
2004 21.9 24.5 14.5 4.8 12.0 10.6 11.1 0.8 100.0
2005 22.5 24.5 14.9 5.6 11.7 10.1 10.1 0.6 100.0
2006 23.4 24.2 15.4 5.7 12.1 9.8 8.8 0.4 100.0
Source: AIHW analysis of DoHA Aged and Community Care Management Infomation System (ACCMIS) database.
Table 41.3: Current permanent residents, length of stay to date, 30 June 1998 to 2006 (per cent)
1999 2000 2001 2002 2003 2004 2005 2006
< 4 weeks 3.0 2.5 2.7 2.6 2.6 2.6 2.5 2.5
4–13 weeks 5.8 4.8 4.8 5.1 5.1 5.3 5.1 5.0
13–26 weeks 7.8 6.1 6.4 6.4 6.7 6.8 6.4 6.6
26–52 weeks 13.8 11.9 12.1 6.0 12.9 13.1 12.6 12.4
1–2 years 20.5 18.2 18.0 18.8 18.5 19.6 20.2 19.3
2–3 years 14.6 14.5 13.6 13.4 13.7 13.4 14.5 15.0
3–5 years 17.7 20.1 19.6 18.2 17.2 17.0 17.3 18.0
5 years or more 16.8 21.9 22.7 23.4 23.2 22.2 21.4 21.2
Total (number) 132,420 133,387 134,004 136,507 140,297 144,994 149,091 151,737
Source: AIHW analysis of DoHA Aged and Community Care Management Infomation System (ACCMIS) database.

140 Older Australia at a glance: 4th edition
Occupancy and place turnoverThe national occupancy rate in 2006 was 95%, which
varied by state and territory and by region. Over the
last 8 years the occupancy rate at the national level
has remained in a narrow band between 95% and 96%
(AIHW 2007f).
The amount of turnover in the system is a function of
the number of admissions, length of stay and the overall
growth, or reduction, in the size of the system. Turnover
of permanent and respite places has been relatively
stable over the last 8 years. Approximately one-third of
permanent places are associated with new admissions
in a year, whereas nominal respite places are used by
about 15 to 17 people per year (AIHW 2007f).
Figure 41.2: Average completed length of stay, separations of permanent residents, 2001–02 to 2005–06.
Source: AIHW analysis of DoHA Aged and Community Care Management Infomation System (ACCMIS) database.
0
50
100
150
200 PersonsMalesFemales
2005–062004–052003–042002–032001–02
Weeks
Financial year