Embed Size (px)
Citation preview

Use of Indicators in Policy Analysis Annotated Training Module Prepared for the World Bank Institute
László Pintér and Darren Swanson with Jane E. Barr
March 2004
DRAFT 23/11/2006

Table of Contents Sustainability Indicators: Types and Uses SLIDE 1: Use of indicators in policy analysis................................................................................ 1 SLIDE 2: Overview ........................................................................................................................ 2 SLIDE 3: The state of sustainability indicators, ca. 1992............................................................... 3 SLIDE 4: The state of sustainability indicators, ca. 2003............................................................... 4 SLIDE 5: Consider these assumptions............................................................................................ 5 SLIDE 6: Types of indicator use .................................................................................................... 6 SLIDE 7: Mini-exercise.................................................................................................................. 7 Indicators in the Policy Cycle SLIDE 8: The policy cycle and the functions of indicators and indicator processes ..................... 8 SLIDE 9: The role of indicators in the policy cycle ....................................................................... 9 SLIDE 10: The policy cycle ......................................................................................................... 10 SLIDE 11: The policy cycle, illustrated ....................................................................................... 11 Example 1: The Agricultural Policy Framework SLIDE 12: Agricultural Policy Framework.................................................................................. 12 SLIDE 13: Challenges and opportunities to agriculture sector .................................................... 13 SLIDE 14: Ministers’ agreement in Whitehorse (June 2001) launched the APF......................... 14 SLIDE 15: A coherent process involves a series of inter-linked steps ......................................... 15 SLIDE 16: Areas of focus and the APF........................................................................................ 16 TSLIDE 17: APF elements ........................................................................................................... 17 SLIDE 18: Common outcome goals - environment ..................................................................... 18 SLIDE 19: Common management goals ...................................................................................... 19 SLIDE 20: Targets and indicators................................................................................................. 20 SLIDE 21: Agriculture and Agri-Food Canada’s Agri-Environmental Indicators Report........... 21 SLIDE 22: Agri-environmental indicators in AAFC’s 2000 Report ............................................ 22 SLIDE 23: Indicator example from the report.............................................................................. 24 SLIDE 24: National Agri-Environmental Health Analysis and Reporting Program (NAHARP) 25 SLIDE 25: National Agri-Environmental Health Analysis and Reporting Program (NAHARP) 26 SLIDE 26: Implementation measures........................................................................................... 27 SLIDE 27: Resources committed.................................................................................................. 28 SLIDE 28: Federal-Provincial-Territorial Implementation Agreements on Agricultural and Agri-Food Policy ................................................................................................................................... 29 SLIDE 29: Need for targets and indicators specified in Federal-Provincial-Territorial Framework Agreement..................................................................................................................................... 30 SLIDE 30: Canadian Regional Agricultural Model (CRAM) ...................................................... 31 SLIDE 31: Diagram of AAFC’s CRAM model ........................................................................... 32 SLIDE 32: References .................................................................................................................. 33
DRAFT 23/11/2006
Example 2: The Energy Sustainability Gauge SLIDE 33: The Energy Sustainability Gauge............................................................................... 35 SLIDE 34: The framework ........................................................................................................... 36 SLIDE 35: The gauge ................................................................................................................... 37 SLIDE 36: 1. Identifying shared objectives and key issues......................................................... 38 SLIDE 37: Guiding principles for assessment.............................................................................. 39 SLIDE 38: 2. Assessing progress toward sustainability .............................................................. 40 SLIDE 39: 2. Assessing progress toward sustainability .............................................................. 41 SLIDE 40: 3. Assessing policy implementation ........................................................................... 42 SLIDE 41: 3. Assessing policy implementation ........................................................................... 43 SLIDE 42: 4. Communicating the results ..................................................................................... 45 SLIDE 43: References .................................................................................................................. 46
DRAFT 23/11/2006

SLIDE 1: Use of indicators in policy analysis
1
Use of Indicators in Policy Analysis
Training Module Prepared for the World Bank Institute
This training module is one of a pair developed as part of an agreement between the International Institute for Sustainable Development (IISD) and the World Bank Institute (WBI). The training modules build on IISD’s experience in capacity building and training in environmental and sustainable development assessment and the development and use of indicators. This module focuses on the use of performance indicators in policy analysis in the context of sustainable development. Specifically, these modules build on and complement some aspects of the World Bank’s emerging Country Environment Analysis (CEA) methodology, IISD’s five-year work programme with Agriculture and Agri-Food Canada, and our work with the Tata Energy Research Institute (TERI) in India on sustainable development of the energy sector funded by the Canadian International Development Agency (CIDA). They also incorporate lessons from an early pilot testing of various aspects of the modules, which took place in November 2003 in Moscow in the context of a World Bank Institute training event. We appreciate and acknowledge insightful comments provided by Giovanni Ruta and Karoline Rogge of the World Bank Institute and hope that we managed to address them in this final version of the module. Primary audiences for this module include national or state/provincial government officials and experts involved in the design and implementation of policy performance measurement, reporting, and evaluation systems. In particular, this includes countries that are in the early phases of scoping out the establishment of such systems or in the process of rethinking the application of indicators to strengthen policy planning and evaluation.
DRAFT 23/11/2006 1

SLIDE 2: Overview
2
Overview
• Indicators and their use• The policy cycle and the functions of
indicators and indicator processes• Examples
– Canada’s Agriculture Policy Framework– Energy Sustainability Gauge
• Concluding remarks• Questions
This training module will cover the following: • Indicators and their use • The policy cycle and the functions of indicators and indicator processes • Examples
- Canada’s Agriculture Policy Framework - IISD’s Energy Sustainability Gauge
• Concluding remarks • Questions
DRAFT 23/11/2006 2

SLIDE 3: The state of sustainability indicators, ca. 1992
3
We need to develop sustainability indicators
The state of sustainability indicators, ca. 1992
In the wake of Agenda 21, interest in Sustainable Development and indicators to measure progress towards this goal increased at all scales, from the global to the local. Many governments, research institutions, and multilateral organizations got involved. They expressed a keen initial interest in developing indicators. As a result, efforts to make data and indicators available have been initiated in many different contexts: global, sectoral, regional, national, ecosystem, or community based. In many cases, access to data and indicators have improved, although significant major gaps and data problems also remain.
DRAFT 23/11/2006 3

SLIDE 4: The state of sustainability indicators, ca. 2003
4
We need policy institutions that can incorporate and
take advantage of sustainability indicators
The state of sustainability indicators, ca. 2003
One of the key underlying assumptions about indicators, made explicit in Chapter 40 of Agenda 21 for example, is that they are a precondition for improved decision-making for sustainable development. Having established indicator systems, many organizations are becoming increasingly interested in ensuring that indicators fulfil their promise to help decision-making in concrete and demonstrable ways. Interest in implementing specific, often legislated, provisions related to sustainable development also fuels an interest in strategic planning and management systems in which indicators, assessment, and reporting play important roles. The question is complex because:
• Policy communities are diverse; • Policies are diverse; • Indicators are diverse; and • Potential indicator uses are diverse.
This module aims to highlight these complexities and offers an opportunity to explore practical implications for the use of indicators in planning and assessment in further detail.
DRAFT 23/11/2006 4

SLIDE 5: Consider these assumptions
5
Consider these assumptions
• Indicators will provide clear answers to question about environmental change and sustainability
• Indicators will help explain how decisions and decision outcomes are linked
• Having the right indicators will result in better decisions
Indicators are quantitative measures that express the status and trends of complex phenomena based on monitoring data, and that resonate with the interests of relevant audiences. The surge of interest in indicators over the last few years has been fuelled by a number of explicit or implicit assumptions. Consider these assumptions:
• Indicators will provide clear answers to questions about environmental change and sustainability;
• Indicators will help to explain how decisions and decision outcomes are linked; and • Having the right indicators will result in better decisions.
While these assumptions tend to be widely accepted, closer examination and review of the experience with indicators over the years reveals that they cannot be taken for granted.
DRAFT 23/11/2006 5

SLIDE 6: Types of indicator use
6
Types of indicator use
The fact, however, is that indicator sets do not readily and automatically lead to changes in policymaking
• Political use – indicators used to support a predetermined position• Symbolic use – ritualistic assurance about appropriate attitudes towards decision-making (“we even developed indicators”)• Tactical use – indicators and the process used as a delaying tactic or substitute for action (“we will do it later once we have indicators”)• Conceptual use for enlightenment – change the understanding of an issue • Instrumental – direct relationship between indicators and decision outcomes
(Hezri 2003)
Indicator sets do not readily and automatically lead to changes in policymaking; indeed, they often are used for ulterior motives:
• Political use – indicators are used to support a predetermined position • Symbolic use – they can be developed to give ritualistic assurance about appropriate
attitudes towards decision-making (“we even developed indicators”) • Tactical use – indicators and the process of developing them can be used as a delaying
tactic or a substitute for action (“we will do it later once we have indicators”)
Ideally, indicators should inform decision-making: • Conceptual use for enlightenment – indicators can be used as a tool to illustrate concepts,
helping to change the understanding of an issue • Instrumental – finally, they can disclose a direct relationship between indicators and
decision outcomes. For example, they can be used to measure the impact of certain decisions, and when used to measure effectiveness, they can be instrumental in changing policies.
(Hezri 2003)
DRAFT 23/11/2006 6

SLIDE 7: Mini-exercise
7
Mini-exercise
• Form groups of 2-3 with your neighbours• Find an example from your own
experience that could serve as illustration for some of these categories
• Be ready to mention an example in plenary
• Time available: 5 minutes
TO THE INSTRUCTOR: The exercise intends to provide an opportunity for participants to explore types of indicator use through examples related to their work and country. It also serves to ‘break the ice’ and start engaging people in discussion. Go through the instructions as shown, and ask for questions for clarifications. Emphasize that a short report-back and discussion in plenary will follow.
DRAFT 23/11/2006 7

SLIDE 8: The policy cycle and the functions of indicators and indicator processes
8
The Policy Cycle and the Functions of Indicators and
Indicator Processes
In order to understand the use of indicators in the process of decision-making, we need to first look at the cycle of policy-making. In both principle and often in practice also, policy-making is a cycle involving policy planning, implementation, evaluation and learning and adjustment. Indicators play a role by helping to outline policy goals in specific terms, monitoring progress, and providing feedback to managers and the public about outcomes. Assuming that a straightforward connection between specific policies and outcomes can be made – which not always the case – indicators can play a key role in continuous policy learning and adaptation.
DRAFT 23/11/2006 8

SLIDE 9: The role of indicators in the policy cycle
9
The Role of Indicators in the Policy Cycle
• Indicators play an important role in the policy cycle and can serve a useful purpose in the discourse on SD. They can– Help assimilate and better understand stakeholder views– Add to the process of governance– Help guide and mould policy decisions
• Indicators are not exogenous to the governance process, “which can act like a magic bullet causing decision-making to become instantly objective and scientific”
(The Pastille Consortium 2002)
Indicators play an important role in the policy cycle and can serve a useful purpose in the discourse on sustainable development by:
• Helping to assimilate and better understand stakeholder views; • Adding to the process of governance; and • Helping to guide and mould policy decisions. •
What is important to understand is that “indicators function inside the governance process; they are not exogenous factors parachuted in, which can act like a magic bullet causing decision-making to become instantly objective and scientific”. “Creating successful indicators relies far more on focusing on how they are integrated into the processes of… governance and far less on devising, designing, and tweaking particular indicator sets” (The Pastille Consortium 2002). The next slide illustrates the policy cycle and how indicators are integrated into the governing process.
DRAFT 23/11/2006 9

SLIDE 10: The policy cycle
10
Environment
Social SphereEcon
omy
Policy Intent
Policy
Policy application Environment
Social
SphereEcon
omy
Impacts
Modified from Boyle, Kay and
Pond (1996)Target group
decisions
This diagram illustrates the process a policy intent goes through before it is analyzed for effectiveness, and how the performance analysis, through the use of indicators, feeds back to influence the original policy. This conceptualization was developed as part of UNEP’s Global Environment Outlook (GEO) initiative. A policy intent or goal adopted by a government (whether related to the economy, the environment, or society) is formulated into a policy statement. The policy is then taken up, interpreted, and applied to the target group. Its character and strength are influenced by the degree of understanding with which it is applied and the vigor with which it is enforced. Once enacted, the policy will affect the target, in this case the environment, and potentially other spheres as well, such as socioeconomic aspects related to the issue. Analysis of the policy’s effectiveness will determine to what extent it is having the desired result and could lead to policy revisions to improve its performance. Indicators are used to identify policy effects and to measure policy effectiveness.
DRAFT 23/11/2006 10

SLIDE 11: The policy cycle, illustrated
11
Environment
Social SphereEcon
omy
Policy Intent
Policy
Policy application
Target group decisions
Environment
Social
SphereEcon
omy
Impacts
Modified from Boyle, Kay and
Pond (1996)
Goals and targets
Strategies and instruments to move towards
targets
Implementation, monitoring,
enforcement
Evaluation, reporting, feedback, adaptive learning
This sequence can be illustrated by an example: Goals and targets: A national government institutes a climate change policy to support international efforts to curb the human influences on global warming. It sets targets for reducing greenhouse gas emissions. Strategies and instruments: It initiates financial incentives, such as energy taxes; legal instruments, such as limits on emissions; and other strategies, such as budgetary support for public transportation, that are intended to help achieve the goals and targets. Policy implementation: Regional and local governments implement the policies by monitoring and enforcing emission limits in industry, for example, and improving and increasing bus, subway and train services, and cycling routes. Impact evaluation: Indicators are used to measure the effectiveness of the policy change. For example, indicators would help evaluate the policy’s performance by comparing data about greenhouse gas emissions before and after the policy change and comparing the rate of progress to the desired goal. The indicators should serve to inform decision-making in a cycle of adaptive learning.
DRAFT 23/11/2006 11

SLIDE 12: Agricultural Policy Framework
12
Agricultural Policy Framework
• Sustainable development is a major policy goal of the Government of Canada
• Agriculture and Agri-Food Canada’s first Sustainable Development Strategy integrated environmental thinking into policies, programs and operations
• Its second SD Strategy contributed to the development of a new Agricultural Policy Framework (APF).
• The APF’s goal is to increase profitability of the agri-food sector, identify environmental targets, and establish clear and measurable indicators to track success.
The next two examples focus on the use of indicators in this cycle of adaptive learning. The first comes from Agriculture and Agri-Food Canada and shows how they inform sustainable development strategies in the agriculture sector. Sustainable development is a major policy goal of the Government of Canada and federal departments must develop sustainable development strategies. Agriculture and Agri-Food Canada’s first Sustainable Development Strategy (SDS-I) was designed to help the Department formalize the process of integrating environmental issues into policies, programs, and operations. It also established a systematic approach for monitoring and reporting departmental activities through the lens of sustainable development. Its second Sustainable Development Strategy (SDS II) was released in the spring of 2001 and contributed to the development of a new Agricultural Policy Framework (APF). The comprehensive Agriculture Policy Framework (APF) was jointly developed by Canada’s federal, provincial, and territorial Ministers of Agriculture, in consultation with producer and industry groups, with the goal of increasing the profitability of the entire agri-food sector and of establishing clear and measurable indicators to track the success of its implementation as well as assisting with the identification of environmental targets. To understand how monitoring and indicators fit together, a brief overview of the APF is useful.
DRAFT 23/11/2006 12

SLIDE 13: Challenges and opportunities to agriculture sector
13
Challenges and opportunities to agriculture sector
Institution of the APF was stimulated by new challenges and opportunities to agriculture sector: • Trade and subsidy policies of competitors• Decline in commodity prices, stressed farm incomes• Changing consumer preferences - food safety, environmental impacts• Need to maintain a profitable agriculture and agri-food sector that is recognized as a world leader
The development of the APF was stimulated by new challenges and opportunities to the primary agriculture sector as it moves into the 21st century. It aims to help the sector adapt to rapid advances in technology and changing consumer demands and to compete against other countries in an increasingly complex global food market.
• Trade and subsidy policies of competitors: Canada faces trade-distorting farm support policies in other countries. Subsidies play a role in driving prices down.
• Decline in commodity prices, stressed farm incomes: Canada exports almost half of its farm products, but competition in the international market is increasing. Rapid technological change and increased international competition are driving down commodity prices.
• Changing consumer preferences - food safety, environmental impacts: Increasing consumer demands for food safety, food quality, and new production methods are transforming agriculture and agri-food sectors. The recent incidence of Mad Cow Disease (BSE) created a high-profile food safety crisis in Canada and the United States that had important impacts on Canada’s agriculture sector. Canadians are also placing increasing demands on farmers and processors concerning the environmental soundness of their production methods.
• The APF responds to the need to maintain a profitable agriculture and agri-food sector that is recognized as a world leader
DRAFT 23/11/2006 13

SLIDE 14: Ministers’ agreement in Whitehorse (June 2001) launched the APF
14
Whitehorse agreement
“Ministers...agree to work towards a comprehensive plan for accelerated environmental action, fully covering all Canadian farms, that will help achieve measurable and meaningful environmental goals in the areas of water, air and soil quality, and bio-diversity. Ministers will seek agreement on indicators, targets, timetablesand approaches”.
Ministers’ agreement in Whitehorse (June 2001) launched the APF
The Agricultural Policy Framework (APF) was launched through the Whitehorse Agreement, which was signed by federal, provincial, and territorial governments in June of 2001. The Agreement states that: “Ministers...agree to work towards a comprehensive plan for accelerated environmental action, fully covering all Canadian farms, that will help achieve measurable and meaningful environmental goals in the areas of water, air and soil quality, and bio-diversity. Ministers will seek agreement on indicators, targets, timetables and approaches”.
DRAFT 23/11/2006 14

SLIDE 15: A coherent process involves a series of inter-linked steps
15
A coherent process involves a series of inter-linked s teps
• T he APF is a goal-driven approach
Environmental& farm
managementgoals
Government policies andinvestment
On-farm planning,investment andimprovements
Reporting toCitizens and
Partners
Environmentaland economic
benefits
• T he environmental & management goals determine the shape of the future approach and the results it will achieve.
• Clear, quantitative goals will improve all subsequent elements
• T he environmental & management goals determine the shape of the future approach and the results it will achieve.
• Clear, quantitative goals will improve all subsequent elements
Targets
Indicators & trends
The Agriculture Policy Framework is a goal-driven approach. It establishes environmental and farm management goals that are supported by clear and quantitative targets. These in turn are supported by programs, for example those related to on-farm investments, social programs, environmental farm planning and so on, which aim to increase environmental and economic benefits and ensure progress towards the stated goals and targets. Indicators measure progress towards the stated goals and targets and results are reported to stakeholders and the public. Progress reports are also incorporated into the department’s mandatory reports on departmental sustainable development reports.
DRAFT 23/11/2006 15

SLIDE 16: Areas of focus and the APF
16
Areas of focus and the APF
• Food safety and food quality• Environment• Science and innovation• Renewal• Business risk management
The Agriculture Food Policy is composed of five elements:
• Food safety and food quality – The APF will help industry develop and adopt new systems and strengthen present government food safety surveillance and information systems to trace their products through the entire food chain to consumers and expand food safety and quality monitoring at the production level.
• Environment - The APF sets out areas where governments can provide help, including better information and research on the links between agriculture and the environment, the development of best management practices, and stepped-up action on environmental priorities on farms through agri-environmental scans and environmental farm plans.
• Science and innovation - The APF aims to make the agriculture sector a world leader in innovation. It emphasizes the coordination of research and innovation efforts across governments, the sector, and private research institutions to achieve maximum return on investments in the key areas of food safety, the environment, and innovative production.
• Renewal – This refers to the continuous learning required of produces to keep pace with change. Renewal efforts include enhanced public and private business management and consulting services, management and marketing information to assist farmers to enhance their profitability, and networks to better link scientific advances to the creation of new economic opportunities.
• Business risk management - The APF is looking at new approaches to managing business risks on the farm, such as yield losses because of weather. These would not only protect farmers against traditional and emerging risks but would also encourage the use of new practices and strategies to reduce risk in the future.
This example focuses on the Environment element of the Agriculture Policy Framework.
DRAFT 23/11/2006 16

SLIDE 17: APF elements
17
APF elements
1. Common outcome goals2. Common management goals3. Targets and indicators4. Implementation measures5. PLUS: Federal-Provincial-Territorial
agreements
Under the Agriculture Policy Framework, the Parties agree to achieve a number of goals, targets and measures related to the environment, in collaboration with the agriculture sector and other stakeholders:
• Common environmental outcome goals, refer to the health of water, soils, the air and the atmosphere, and biodiversity;
• Common farm environmental management goals, include conducting an agri-environmental scan on all farms and initiating farm plans to manage environmental aspects;
• Targets and indicators: Targets are set to achieve these common outcome and management goals in Implementation Agreements. Indicators are developed to measure the progress in achieving them within the period of the Framework Agreement;
• Implementation measures: These include developing and using environmental monitoring networks, environmentally-beneficial agricultural production and management practices, and agri-environmental standards;
• Federal-Provincial-Territorial Agreements: The Agricultural Policy Framework (APF) is cost-shared with the provinces and territories, all of which have signed on to the Framework. Eight provinces have also signed Implementation Agreements with the Government of Canada.
The following slides describe these goals, targets, indicators, and implementation measures in more detail.
DRAFT 23/11/2006 17

SLIDE 18: Common outcome goals - environment
18
COMMON OUTCOME GOALS - ENVIRONMENT
• reduce agricultural risks and provide benefits to the health andsupply of water, with key priority areas being nutrients, pathogens, pesticides and water conservation;
• reduce agricultural risks and provide benefits to the health of soils, with key priority areas being soil organic matter and soil erosioncaused by water, wind or tillage;
• reduce agricultural risks and provide benefits to the health of air and the atmosphere, with key priority areas being particulate emissions, odours, and emissions of gases that contribute to global warming; and
• ensure compatibility between biodiversity and agriculture, with key priority areas being habitat availability, species at risk, and economic damage to agriculture from wildlife.
1. Common environmental outcome goals2. Common management goals3. Targets and Indicators4. Implementation measures5. Federal-Provincial-Territorial agreements
Under the APF, governments collaborate with the agriculture sector and other stakeholders to achieve the following common environmental outcome goals:
• reduce agricultural risks and provide benefits to the health and supply of water, with key priority areas being nutrients, pathogens, pesticides and water conservation;
• reduce agricultural risks and provide benefits to the health of soils, with key priority areas being soil organic matter and soil erosion caused by water, wind or tillage;
• reduce agricultural risks and provide benefits to the health of air and the atmosphere, with key priority areas being particulate emissions, odours, and emissions of gases that contribute to global warming; and
• ensure compatibility between biodiversity and agriculture, with key priority areas being habitat availability, species at risk, and economic damage to agriculture from wildlife.
DRAFT 23/11/2006 18

SLIDE 19: Common management goals
19
COMMON MANAGEMENT GOALS
The APF proposes that governments work in collaboration with the agriculture sector and other stakeholders towards the following common management goals:
• The voluntary completion of a basic agri-environmental scan on all farms so as to identify farms and regions requiring corrective action;
• All farms found to need corrective action shouldvoluntarily complete an environmental farm plan
• The farm plans should improve stewardship through the adoption of environmentally beneficial practices in the management of nutrients, pests, land and water, nuisances, and biodiversity
1. Common environmental outcome goals2. Common management goals3. Targets and Indicators4. Implementation measures5. Federal-Provincial-Territorial agreements
The APF proposes that governments work in collaboration with the agriculture sector and other stakeholders towards the following common management goals:
• the voluntary completion of a basic agri-environmental scan on all farms so as to identify farms and regions requiring corrective action;
• the voluntary completion of an environmental farm plan or voluntary participation in an equivalent environmental plan for all farms identified as requiring significant corrective action under the basic agri-environmental scan; and
• the implementation of environmental farm plans or equivalent environmental plans and improved stewardship through the adoption of environmentally beneficial practices in the management of nutrients, pests, land and water, nuisances, and biodiversity, as appropriate to the needs and circumstances of individual farms.
DRAFT 23/11/2006 19

SLIDE 20: Targets and indicators
20
TARGETS AND INDICATORS
• Under the APF, the Parties agree to set targets for the environmental outcome goals and farm environmental management goals
• Targets could vary across Canada given that both the scope of the environmental challenge and the natural ecosystems are different.
• They agree to use indicators to measure the progress in achieving the environmental outcome goals and the farm environmental management goals
• Indicators could be reported within the timeframe of the APF allowing for measurements to be made and meaningful change to be detected.
1. Common environmental outcome goals2. Common management goals3. Targets and Indicators4. Implementation measures5. Federal-Provincial-Territorial agreements
• Under the APF, the Parties agree to set targets for the environmental outcome goals and farm environmental management goals through Implementation Agreements
• Targets under each goal could vary across Canada given that the scope of the environmental challenge is different, as are the natural ecosystems.
• The Parties agree to use indicators to measure the progress made in achieving the environmental outcome goals and the farm environmental management goals of the Framework Agreement
• Indicators could be reported within the timeframe of the APF on a frequency over which meaningful change can be detected and on which measurements can be made.
DRAFT 23/11/2006 20

SLIDE 21: Agriculture and Agri-Food Canada’s Agri-Environmental Indicators Report
21
• In 1993, Agriculture and Agri-Food Canada began work on the development of a set of agri-environmental indicators (AEIs).
• Results were published in February 2000 in Environmental Sustainability of Canadian Agriculture: Report of the Agri-Environmental Indicator Project.
• Agri-environmental indicators are science-based measures of key environmental conditions, risks, and changes resulting from agriculture, and of management practices used by producers.
Agriculture andAgri-Food Canada’sAgri-EnvironmentalIndicators Report
1. Common environmental outcome goals2. Common management goals3. Targets and Indicators4. Implementation measures5. Federal-Provincial-Territorial agreements
Work on agri-environmental indicators has a longer history at AAFC:
• In 1993, in response to the need for indicators to assess the impacts of agricultural policies on the environment, Agriculture and Agri-Food Canada began work on the development of a set of agri-environmental indicators (AEIs).
• Results were published in February 2000 in Environmental Sustainability of Canadian Agriculture: Report of the Agri-Environmental Indicator Project.
• Agri-environmental indicators are science-based measures of key environmental conditions, risks, and changes resulting from agriculture, and of management practices used by producers.
• These indicators are meant to contribute to a more informed debate in Canada regarding the establishment and pursuit of environmental sustainability goals for agriculture.
DRAFT 23/11/2006 21

SLIDE 22: Agri-environmental indicators in AAFC’s 2000 Report
22
Agri-Environmental Indicators in AAFC’s2000 Report
• Environmental farm management– Soil cover by crops and residue– Management of farm nutrient and pesticide inputs
• Soil quality– Risk of water erosion– Risk of wind erosion– Risk of tillage erosion– Soil organic carbon– Risk of soil compaction– Risk of fosil salinization
• Water quality– Risk of water contamination by nitrogen– Risk of water contamination by phosphorous
• Agroecosystem greenhouse gas emissions– Agricultural greenhouse gas budget
• Agroecosystem biodiversity– Availability of wildlife habitat on farmland
• Production intensity– Residual nitrogen– Energy use
1. Common environmental outcome goals2. Common management goals3. Targets and Indicators4. Implementation measures5. Federal-Provincial-Territorial agreements
The report focused on environmental indicators most relevant to the agri-food sector and covered the following:
• Environmental farm management • Soil cover by crops and residue • Management of farm nutrient and pesticide inputs
• Soil quality • Risk of water erosion • Risk of wind erosion • Risk of tillage erosion • Soil organic carbon • Risk of soil compaction • Risk of soil salinization
• Water quality • Risk of water contamination by nitrogen • Risk of water contamination by phosphorous
• Agroecosystem greenhouse gas emissions • Agricultural greenhouse gas budget
• Agroecosystem biodiversity • Availability of wildlife habitat on farmland
• Production intensity
DRAFT 23/11/2006 22

• Residual nitrogen • Energy use
Source: McRae, T., C.A.S. Smith, and L.J. Gregorich, eds. 2000. Environmental Sustainability of Canadian Agriculture: Report of the Agri-Environmental Indicator Project. A Summary. Ottawa: Research Branch, Policy Branch, Prairie Farm Rehabilitation Administration, Agriculture and Agri-Food Canada.<http://www.agr.gc.ca/policy/environment/pubs_aei_01_e.phtml>
DRAFT 23/11/2006 23

SLIDE 23: Indicator example from the report
23
Indicator examplefrom the report
1. Common environmental outcome goals2. Common management goals3. Targets and Indicators4. Implementation measures5. Federal-Provincial-Territorial agreements
As an example, tillage erosion is one of these indicators: Tillage erosion risk is affected by a number of variables, some of which are related to natural conditions such as soil types and slope conditions, and others to agricultural practices, particularly tillage. This indicator estimates the risk of tillage erosion on Canada’s cropland and assesses how this risk changed between 1981 and 1996 as a result of changes in agricultural management practices. The risk of tillage erosion dropped in all provinces by values ranging from a high of 26 percent to a low of 2 percent. Lower risk of tillage erosion is associated with the introduction or increase in soil conservation practices, including conservation tillage, no-till, reduced area in summerfallow, increased area in forages, and removing marginal land from production. In some cases, intensive cropping and inherent erodibility of the land offset the benefits of these practices. Source: King, D.J., J.-M. Cossette, R.G. Eilers, B.A. Grant, D.A. Lobb, G.A. Padbury, H.W. Rees, I.J. Shelton, J. Tajek, L.J.P. van Vliet, and G.J. Wall. 2000. Indicator: Risk of Tillage Erosion. In Environmental Sustainability of Canadian Agriculture: Report of the Agri-Environmental Indicator Project. A Summary, edited by T. McRae, C. A. S. Smith and L. J. Gregorich. Ottawa: Research Branch, Policy Branch, Prairie Farm Rehabilitation Administration, Agriculture and Agri-Food Canada.
DRAFT 23/11/2006 24

SLIDE 24: National Agri-Environmental Health Analysis and Reporting Program (NAHARP)
24
NationalAgri-EnvironmentalHealth Analysis andReporting Program (NAHARP)
• Building on this initial work, it was decided to continually develop and improve AEIs
• This capacity was established through the National Agri-Environmental Health Analysis and Reporting Program (NAHARP).
• Under NAHARP, the AEIs are being updated, the methodology and underlying data are being enhanced, and new indicators are being developed.
1. Common environmental outcome goals2. Common management goals3. Targets and Indicators4. Implementation measures5. Federal-Provincial-Territorial agreements
• Building on the initial work in agro-environmental indicators (AEIs) and in light of current
and future needs for the kind of information they reveal, it was decided to strengthen the departmental capacity in the development and continuous improvement of AEIs and of tools that use these indicators in policies that help to integrate the environment and the economy.
• This capacity was established through the National Agri-Environmental Health Analysis and Reporting Program (NAHARP).
• Under NAHARP, the existing set of AEIs is being updated, the methodology and underlying data are being enhanced when appropriate and possible, and new indicators to address key gaps in environmental information are being developed.
DRAFT 23/11/2006 25

SLIDE 25: National Agri-Environmental Health Analysis and Reporting Program (NAHARP)
25
NationalAgri-EnvironmentalHealth Analysis andReporting Program (NAHARP)
To provide a comprehensive portrait of the situation, three types of indicators are being developed under NAHARP:
• State indicators to provide information on the main impact (state) or potential impact (risk) from farm activities
• Pressure indicators to provide information on major environmental stresses to agroecosystems
• Response indicators to provide information on the use by producer of various key management options that may influence the environmental performance of the sector
1. Common environmental outcome goals2. Common management goals3. Targets and Indicators4. Implementation measures5. Federal-Provincial-Territorial agreements
To provide a comprehensive portrait of the situation, three types of indicators are being developed in NAHARP: • State indicators to provide information on the main impact (state) or potential impact (risk)
from farm activities (e.g. risk of soil degradation, risk of water contamination, agricultural atmospheric emissions, state of agricultural biodiversity);
• Pressure indicators to provide information on major environmental stresses to agroecosystems (e.g. risks from invasive alien species, desertification, wildlife damage); and
• Response indicators to provide information on the use by producers of various key management options that may influence the environmental performance of the sector (e.g. use of integrated pest management, production eco-efficiency).
DRAFT 23/11/2006 26

SLIDE 26: Implementation measures
26
IMPLEMENTATIONMEASURES
• Sectoral information and understanding• Stewardship tools and capacity• Agri-environmental scans and
environmental farm planning• Incentives for accelerated action• Securing benefits for the future
1. Common environmental outcome goals2. Common management goals3. Targets and Indicators4. Implementation measures5. Federal-Provincial-Territorial agreements
The fourth key environmental component of the Agriculture Policy Framework is to implement measures to achieve the targets and goals. The Parties to the Framework agree to the following measures:
• Sectoral information and understanding: The development and use of common agri-environmental indicators to track and predict agri-environmental performance, increase public awareness, support policy and program development, and report to the public.
• Stewardship tools and capacity: This includes developing and evaluating environmentally-beneficial agricultural production and management practices; establishing agri-environmental standards; and identifying and assessing emerging and innovative environmentally-responsible technologies and systems and making them available.
• Agri-environmental scans and environmental farm planning: The development and widespread use of basic agri-environmental scans and agri-environmental farm plans to increase farmer environmental awareness; assess environmental risks and benefits from agricultural operations; and mitigate environmental risks.
• Incentives for accelerated action: The establishment of cost-shared programs to provide incentives to address identified environmental risks and enhance environmental benefits from agriculture, as well as other funding incentives.
• Securing benefits for the future: Developing a voluntary farm environmental certification program and making it available to farmers; promoting environmentally-beneficial agricultural goods and services and markets for them.
DRAFT 23/11/2006 27

SLIDE 27: Resources committed
27
Resourcescommitted• New federal funding - 5.2 Billion
Funding for the APF - 3.4 BillionSpecial transition funding:2002-03 - 600 Million2003-04 - 600 MillionAccelerating the benefits of the APF - 589 Million
• Drought measures • Environmental action • Tools to improve global market access for Canadian
products • Innovation • Rural development and cooperatives
1. Common environmental outcome goals2. Common management goals3. Targets and Indicators4. Implementation measures5. Federal-Provincial-Territorial agreements
Making the APF and associated programs, including its monitoring and indicators component, work requires significant resources. As an indication of the priority AAFC assigns to these programs, significant budget allocations have been made, as shown. Source: AAFC. 2004. The Agricultural Policy Framework (APF). Agriculture and Agri-Food Canada: http://www.agr.gc.ca/cb/apf/index_e.php?section=env&group=docu&page=env_pres0203, Viewed 30 March 2004.
DRAFT 23/11/2006 28

SLIDE 28: Federal-Provincial-Territorial Implementation Agreements on Agricultural and Agri-Food Policy
28
FEDERAL-PROVINCIAL-TERRITORIAL IMPLEMENTATION AGREEMENTSON AGRICULTURAL AND AGRI-FOOD POLICY
• Quebec• Manitoba• Nova Scotia• Yukon• New Brunswick• British Columbia• Alberta• Newfoundland and Labrador
1. Common environmental outcome goals2. Common management goals3. Targets and Indicators4. Implementation measures5. Federal-Provincial-Territorial agreements
Because of Canada’s federal system, successful implementation of the APF depends on the full participation of provincial governments. AAFC has engaged all provinces and territories in developing the APF and the following have already signed the Implementation Agreement (Federal-Provincial-Territorial Framework Agreement on Agricultural And Agri-Food Policy for The Twenty-First Century) with the Government of Canada: Quebec Manitoba Nova Scotia Yukon New Brunswick British Columbia Alberta Newfoundland and Labrador
DRAFT 23/11/2006 29
SLIDE 29: Need for targets and indicators specified in Federal-Provincial-Territorial Framework Agreement
29
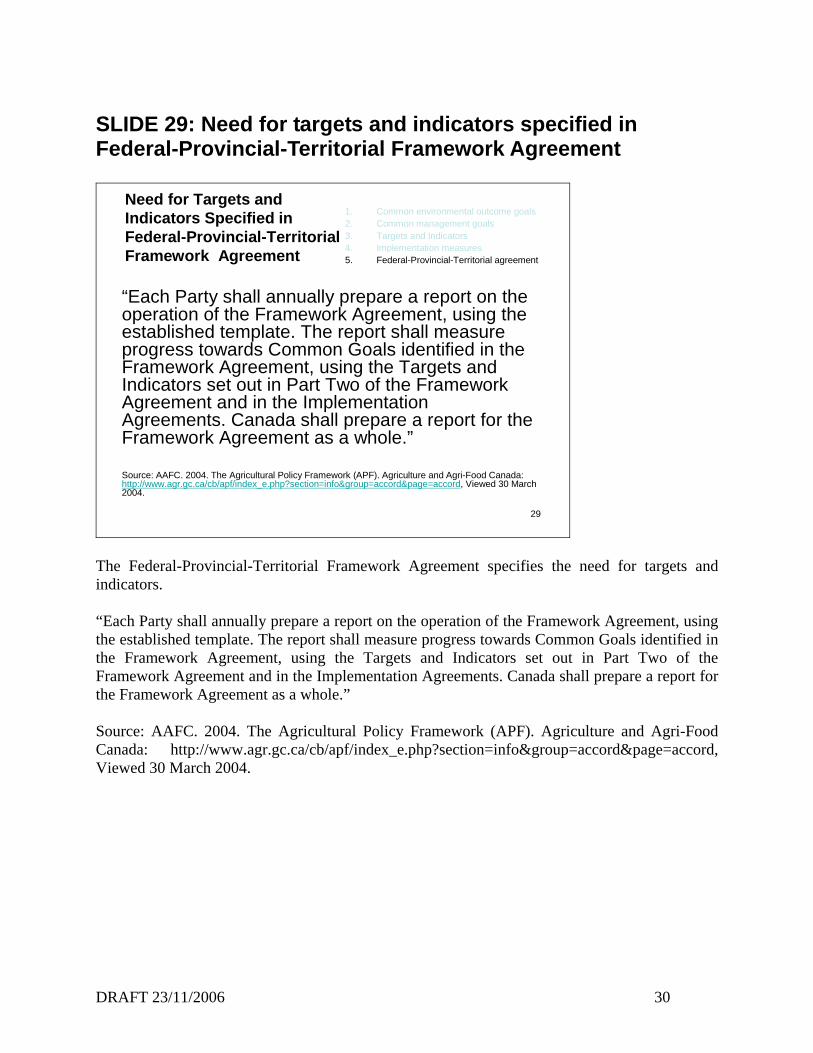
Need for Targets and Indicators Specified in Federal-Provincial-TerritorialFramework Agreement
“Each Party shall annually prepare a report on the operation of the Framework Agreement, using the established template. The report shall measure progress towards Common Goals identified in the Framework Agreement, using the Targets and Indicators set out in Part Two of the Framework Agreement and in the Implementation Agreements. Canada shall prepare a report for the Framework Agreement as a whole.”
Source: AAFC. 2004. The Agricultural Policy Framework (APF). Agriculture and Agri-Food Canada: http://www.agr.gc.ca/cb/apf/index_e.php?section=info&group=accord&page=accord, Viewed 30 March 2004.
1. Common environmental outcome goals2. Common management goals3. Targets and Indicators4. Implementation measures5. Federal-Provincial-Territorial agreement
The Federal-Provincial-Territorial Framework Agreement specifies the need for targets and indicators. “Each Party shall annually prepare a report on the operation of the Framework Agreement, using the established template. The report shall measure progress towards Common Goals identified in the Framework Agreement, using the Targets and Indicators set out in Part Two of the Framework Agreement and in the Implementation Agreements. Canada shall prepare a report for the Framework Agreement as a whole.” Source: AAFC. 2004. The Agricultural Policy Framework (APF). Agriculture and Agri-Food Canada: http://www.agr.gc.ca/cb/apf/index_e.php?section=info&group=accord&page=accord, Viewed 30 March 2004.
DRAFT 23/11/2006 30

SLIDE 30: Canadian Regional Agricultural Model (CRAM)
30
Canadian Regional Agricultural Model (CRAM)
• Estimate future changes in quantitative agri-environmental indicators developed in the context of the APF as a result of alternative management practices and policies
• Help identify targets by providing an indication of available outcomes
(AAFC 2003)
Indicators are linked to the policy process not only on the basis of retrospective reporting, but also through forward looking planning. Agriculture and Agri-Food Canada's Economic and Policy Analysis Directorate (EPAD) has linked several environmental indicators to economic models, including the Canadian Regional Agriculture Model (CRAM), to provide a more integrated economic - environmental analysis system. CRAM is a static, comprehensive, mathematical programming model that has the capability of providing detailed provincial and regional information on the crops and livestock sectors. It includes all aspects of agriculture such as land usage, grains and oilseeds production, livestock (including supply managed commodities) and meat production, trade, and demand. It also models the linkages among these sectors including feed requirements and commodity movements, which enable the evaluation of cross sector impacts induced by policy shocks. It is being used to
• Estimate future changes in quantitative agri-environmental indicators developed in the context of the APF as a result of alternative management practices and policies; and
• Help identify targets by providing an indication of available outcomes
DRAFT 23/11/2006 31

SLIDE 31: Diagram of AAFC’s CRAM model
31
AEIsAEIsEconomics & Markets
Economics & Markets ScienceScience Policy
ScenarioPolicy
Scenario
Integrated ModelsIntegrated Models
Economic OutcomesEconomic Outcomes
Environmental Outcomes
Environmental Outcomes
Economic Valuation
Economic Valuation
Trade-Off Analysis
Trade-Off Analysis
Input to Policy Evaluation and Development Process
Input to Policy Evaluation and Development Process
The diagram shows an outline of AAFC’s CRAM model. Agri-environmental indicators or AEIs serve as one of the key inputs into integrated sectoral models that are used to estimate future economic and environmental outcomes and analyze trade-offs. The process and outputs of these models feed directly into the policy options evaluation and development process.
DRAFT 23/11/2006 32

SLIDE 32: References
32
ReferencesAAFC. 2004. The Agricultural Policy Framework (APF). Agriculture and Agri-Food Canada:
http://www.agr.gc.ca/cb/apf/, Viewed 30 March 2004.AAFC. 2003. Agriculture and Agri-Food Canada, Research and Analysis Directorate Visions of Growth: Policy
Implications for the 2004/2005 Crop Year. Agriculture and Agri-Food Canada: http://www.agr.gc.ca/spb/rad-dra/publications/visions/visions_part2_e.php, Viewed 30 March 2004.
AAFC. n.d. National Agri-Environmental Health Analysis and Reporting Program (NAHARP). Agriculture and Agri-Food Canada: http://www.agr.gc.ca/policy/environment/pdfs/aei/summary.pdf.
Boyle, M., J.J. Kay, and B. Pond. 1996. State of the Landscape Reporting: The Development of Indicators for the Provincial Policy Statement Under the Land Use Planning and Protection Act: Prepared for the Ontario Ministry of Natural Resources.
Boyle, M., J.J. Kay, and B. Pond. 2001. Monitoring in Support of Policy: an Adaptive Ecosystem Approach. In Encyclopedia of Global Environmental Change, edited by T. Munn. London: John Wiley and Son.
Hezri, A.A. 2003. Sustainability Indicators and Policy Processes: Experience from Malaysia: Paper presented at the International Conference on Sustainabiity Indicators, Valetta, Malta. 6-9 November.
King, D.J., J.-M. Cossette, R.G. Eilers, B.A. Grant, D.A. Lobb, G.A. Padbury, H.W. Rees, I.J. Shelton, J. Tajek, L.J.P. van Vliet, and G.J. Wall. 2000. Indicator: Risk of Tillage Erosion. In Environmental Sustainability of Canadian Agriculture: Report of the Agri-Environmental Indicator Project. A Summary, edited by T. McRae, C. A. S. Smith and L. J. Gregorich. Ottawa: Research Branch, Policy Branch, Prairie Farm Rehabilitation Administration, Agriculture and Agri-Food Canada.
McRae, T., C.A.S. Smith, and L.J. Gregorich, eds. 2000. Environmental Sustainability of Canadian Agriculture: Report of the Agri-Environmental Indicator Project. A Summary. Ottawa: Research Branch, Policy Branch, Prairie Farm Rehabilitation Administration, Agriculture and Agri-Food Canada.
The Pastille Consortium. 2002. Indicators Into Action: Local Sustainability Indicator Sets in Their Context. Final Report. London: London School of Economics.
AAFC. 2004. The Agricultural Policy Framework (APF). Agriculture and Agri-Food Canada:
http://www.agr.gc.ca/cb/apf/, Viewed 30 March 2004. AAFC. 2003. Agriculture and Agri-Food Canada, Research and Analysis Directorate Visions of
Growth: Policy Implications for the 2004/2005 Crop Year. Agriculture and Agri-Food Canada: http://www.agr.gc.ca/spb/rad-dra/publications/visions/visions_part2_e.php, Viewed 30 March 2004.
AAFC. n.d. National Agri-Environmental Health Analysis and Reporting Program (NAHARP). Agriculture and Agri-Food Canada: http://www.agr.gc.ca/policy/environment/pdfs/aei/summary.pdf.
Boyle, M., J.J. Kay, and B. Pond. 1996. State of the Landscape Reporting: The Development of Indicators for the Provincial Policy Statement Under the Land Use Planning and Protection Act: Prepared for the Ontario Ministry of Natural Resources.
Boyle, M., J.J. Kay, and B. Pond. 2001. Monitoring in Support of Policy: an Adaptive Ecosystem Approach. In Encyclopedia of Global Environmental Change, edited by T. Munn. London: John Wiley and Son.
Hezri, A.A. 2003. Sustainability Indicators and Policy Processes: Experience from Malaysia: Paper presented at the International Conference on Sustainabiity Indicators, Valetta, Malta. 6-9 November.
King, D.J., J.-M. Cossette, R.G. Eilers, B.A. Grant, D.A. Lobb, G.A. Padbury, H.W. Rees, I.J. Shelton, J. Tajek, L.J.P. van Vliet, and G.J. Wall. 2000. Indicator: Risk of Tillage Erosion. In Environmental Sustainability of Canadian Agriculture: Report of the Agri-Environmental Indicator Project. A Summary, edited by T. McRae, C. A. S. Smith and L. J. Gregorich.
DRAFT 23/11/2006 33

Ottawa: Research Branch, Policy Branch, Prairie Farm Rehabilitation Administration, Agriculture and Agri-Food Canada.
McRae, T., C.A.S. Smith, and L.J. Gregorich, eds. 2000. Environmental Sustainability of Canadian Agriculture: Report of the Agri-Environmental Indicator Project. A Summary. Ottawa: Research Branch, Policy Branch, Prairie Farm Rehabilitation Administration, Agriculture and Agri-Food Canada.
The Pastille Consortium. 2002. Indicators Into Action: Local Sustainability Indicator Sets in Their Context. Final Report. London: London School of Economics.
DRAFT 23/11/2006 34
SLIDE 33: The Energy Sustainability Gauge
33
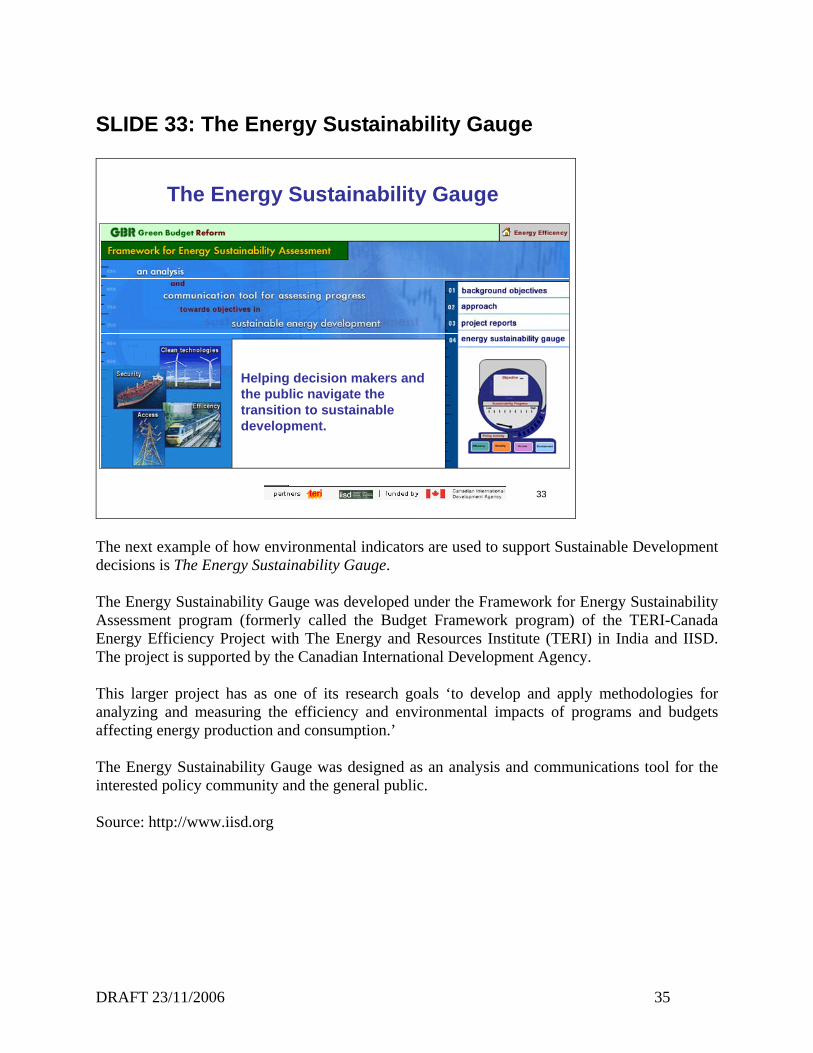
Helping decision makers and the public navigate the transition to sustainable development.
The Energy Sustainability Gauge
The next example of how environmental indicators are used to support Sustainable Development decisions is The Energy Sustainability Gauge. The Energy Sustainability Gauge was developed under the Framework for Energy Sustainability Assessment program (formerly called the Budget Framework program) of the TERI-Canada Energy Efficiency Project with The Energy and Resources Institute (TERI) in India and IISD. The project is supported by the Canadian International Development Agency. This larger project has as one of its research goals ‘to develop and apply methodologies for analyzing and measuring the efficiency and environmental impacts of programs and budgets affecting energy production and consumption.’ The Energy Sustainability Gauge was designed as an analysis and communications tool for the interested policy community and the general public. Source: http://www.iisd.org
DRAFT 23/11/2006 35

SLIDE 34: The framework
34
The Framework
1. Identify broadly shared objectives for sustainability in the energy sector and identify key issues;
2. Assess the progress toward sustainabilityfor the key issues based on quantitative benchmarks;
3. Assess the extent to which a mix of policy instruments has been implemented by national-level governments to address the key issues.
4. Communicate the results of the assessment.
• The Energy Sustainability Gauge draws attention to a few broadly shared sustainability
objectives in the energy sector and identifies key issues. • It helps to asses progress toward sustainability by comparing indicator trends for the key
issues to quantitative benchmarks. • It also assesses the extent to which a mix of policy instruments is being implemented by
national-level governments to address sustainability issues. • It communicates the results of the assessment in a visual and engaging manner, using the
metaphor of a vehicle dashboard and its associated gauges.
DRAFT 23/11/2006 36

SLIDE 35: The gauge
35
An analysis and communication tool for assessing progress toward objectives in sustainable energy development
To bridge gaps among society, policy makers, and our economic, social and environmental systems
Progress Graph
Energy Sustainability Gauge - components
Low HighSustainability Progress Rate
Time
Indi
cato
r
(-)
Sustainability Progress
Efficiency Security Access Clean Technology
Economic Social Environmental
Low High
Policy Implementation
The Gauge
The gauge is a web-based, interactive, analysis and communication tool for assessing progress toward objectives in sustainable energy development. The gauge is not an assessment of the effectiveness of policies, but rather a check to see if the key issues identified are on the policy-makers' radar screen and the extent to which a mix of policies is being implemented. Energy sustainability can be interpreted as efficient production, distribution, and use of energy resources and provision of equitable and affordable access to energy while ensuring security of supply and environmental sustainability. As a communication tool, the gauge helps to bridge gaps among society, policy makers, and economic, social, and environmental systems.
DRAFT 23/11/2006 37

SLIDE 36: 1. Identifying shared objectives and key issues
36
Progress Graph
Energy Sustainability Gauge - components
Low HighSustainability Progress Rate
Time
Indi
cato
r
(-)
Sustainability Progress
Efficiency Security Access
Economic Social Environmental
Low High
Policy Implementation
Clean Technology
1. Identifying shared Objectives and Key Issues
Sustainable Development Objectives
Energy Sector Specific Objectives• Efficient production, conversion, transmission and consumption of energy resources • Security of short and long-term energy supply ;• Access to adequate, affordable, reliable and good quality energy to all;• Clean Technologies for energy development.
Energy Sector Specific Issues• Energy efficeincy• On-road fuel efficiency• GHG emissions• Non-conventional renewable energy use
1. Identifying shared objectives and key issues
2. Assessing progress towards sustainability3. Assessing policy implementation4. Communicating the results
1. The first level of enquiry on the gauge is to identify the shared objectives and key issues:
a. What are the relevant objectives of sustainable development for a country? The approach for identifying key sustainability issues for the energy sector proceeds first from a broad understanding of sustainable development to a realization of broad objectives for energy sustainability. This information is contained in an interactive use menu situated at the base the Energy Sustainability Gauge as illustrated in the figure. At the base level, the framework involves the three pillars of sustainable development -- economic, social, and environmental. b. The gauge allows the user to choose sustainability indicators specific to the energy sector. Within this classification, energy sustainability objectives have been identified as • Efficient production, conversion, transmission, and consumption of energy resources
leading to a reduction in the need to produce energy (economic) • Security of short and long-term energy supply (economic) • Access to adequate, affordable, reliable, and good quality energy to all (social) • Use of clean technology and processes that mitigate the adverse environmental impacts
of energy development (environmental)
c. Energy sector specific indicators related to environmental performance include • Energy efficiency • On-road fuel efficiency • Greenhouse gas emissions • Non-conventional renewable energy (such as solar and wind)
DRAFT 23/11/2006 38

SLIDE 37: Guiding principles for assessment
37
Guiding Principles for Assessment
•Saliency – will anyone care?•Legitimacy – can people trust it?•Credibility – can people believe it?•Usability – can people understand it?
The criteria of saliency, credibility and legitimacy were put forth by Clark, W.C., and G. Majone. 1985. The critical appraisal of scientific inquiries with policy implications. Science, Technology, and Human Values 10 (3):121-147.
Four criteria are used to guide the assessment: • The saliency criterion poses the question – will anyone care? A measure of saliency is how
widely the notions are shared. The gauge uses broad sustainability objectives for the energy sector that are widely shared – efficiency, security, access, and clean technologies. Progress toward sustainability is assessed by identifying issues and indicators for these sustainability objectives and comparing the indicator trends to broadly shared quantitative reference levels.
• The legitimacy criterion is concerned with the question – can people trust it? For example, a global assessment of climate change could be produced by some of the top scientists in the world; if all the scientists were from one country, however, other nations may view the assessment as lacking legitimacy. The gauge builds legitimacy by assessing the level of policy implementation based on a wide array of policy instruments. In addition, the three-pillar sustainability framework allows for multiple perspectives in the analysis.
• Credibility addresses the question – can people believe it? This criterion deals with the technical accuracy of results, analyses, and conclusions. Data used must come from credible sources and data analysis and assessment should be reviewed for accuracy by credible procedures.
• The usability criterion – will people understand it? – The objective of this tool is to communicate with government decision-makers and the interested public. The indicators should be simple and intuitive to understand. Displaying only a small number of indicators and employing the metaphor of a vehicle dashboard makes the tool usable by the targeted audience because it is simple, intuitive, and attractive.
DRAFT 23/11/2006 39
SLIDE 38: 2. Assessing progress toward sustainability
38
Efficiency Security Access Clean Technology
Economic Social Environmental
Low High
Policy Implementation
Progress Graph
Energy Sustainability Gauge - components
Low HighSustainability Progress Rate
Time
Indi
cato
r
(-)
Sustainability Progress
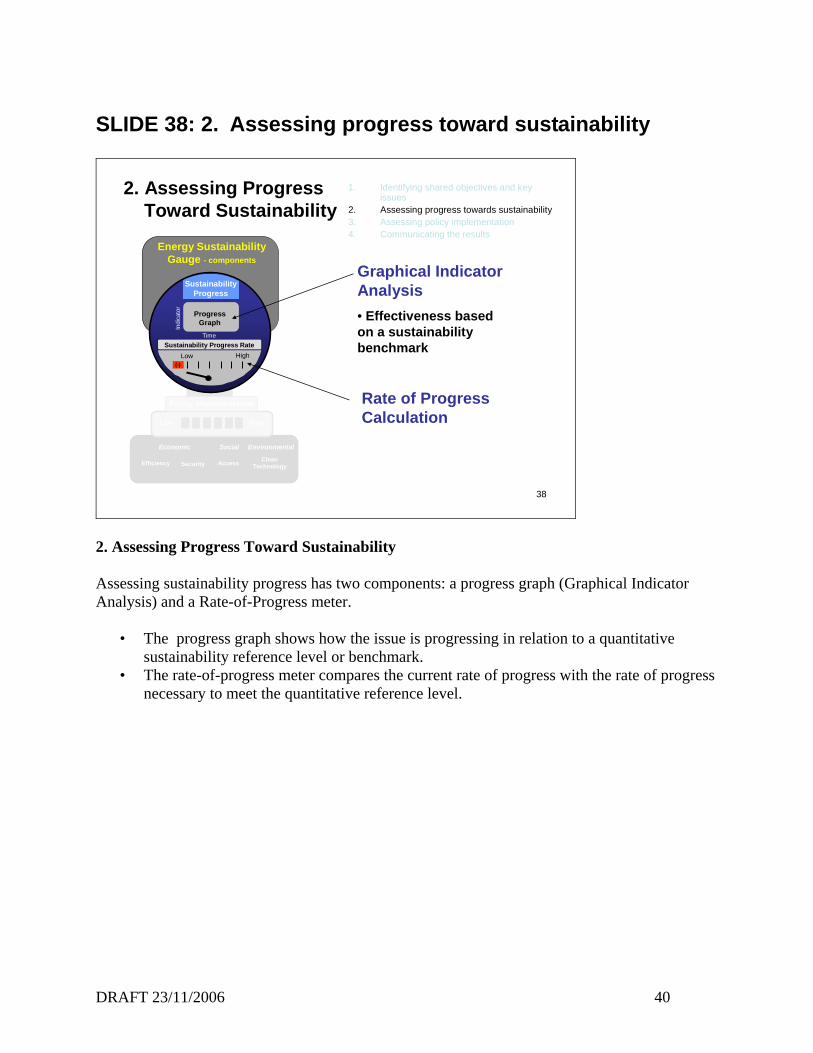
2. Assessing ProgressToward Sustainability
Graphical Indicator Analysis• Effectiveness based on a sustainability benchmark
Rate of Progress Calculation
1. Identifying shared objectives and key issues
2. Assessing progress towards sustainability3. Assessing policy implementation4. Communicating the results
2. Assessing Progress Toward Sustainability Assessing sustainability progress has two components: a progress graph (Graphical Indicator Analysis) and a Rate-of-Progress meter.
• The progress graph shows how the issue is progressing in relation to a quantitative sustainability reference level or benchmark.
• The rate-of-progress meter compares the current rate of progress with the rate of progress necessary to meet the quantitative reference level.
DRAFT 23/11/2006 40

SLIDE 39: 2. Assessing progress toward sustainability
39
5.00
7.00
9.00
11.00
13.00
1965 1975 1985 1995 2005 2015
On-
Roa
d Fu
el E
ffici
ency
(km
/l
Source: 1984-2000 data: Calculated from vehicle stock, average kilometrestravelled and average fuel efficiency data. Personal communication, Natural Resources Canada, Office of Energy Efficiency. 8 August, 2002.
1950-1982: EC. 2002. National Environmental Indicator Series: On-road Fuel Efficiency, 1950-1995. Environment Canada, State of the Environment Infobase: http://www.ec.gc.ca/soer-ree/English/Indicators/Issues/Transpo/Tables/pttb07_e.cfm, Viewed 31 March 2004.
Notes: Quantitative objective is 25% fuel efficiency improvement in the fleet of new vehicles as presented in Canada’s Climate Change Plan, 2002.
Aut
omob
ile F
uel E
ffici
ency
(k
ilom
etre
spe
r litr
e)
25% Improvement Benchmark
Progress Toward Objective: 14 %
Trend: Steady
Base year = 1990
2. Assessing Progress Toward Sustainability
1. Identifying shared objectives and key issues
2. Assessing progress towards sustainability3. Assessing policy implementation4. Communicating the results
2. Assessing Progress Toward Sustainability As an example of how these two meters work, here is a graph showing the trend in automobile fuel efficiency in Canada (measured by the number of kilometres per litre) between 1965 and 2000. The benchmark objective is shown by the red dot, which represents the target presented in Canada’s Climate Change Plan of 25 percent improvement over the 1990 level in fuel efficiency in the fleet of new vehicles by the year 2015. • The sustainability progress component displays the trend along with a reference level
(indicated by a red dot) to show how the indicator is progressing in relation to a shared – or relatively non-controversial – sustainability objective.
• The progress rate shows the current rate of growth of the indicator relative to that required to
meet the objective. This reading indicates how close the current rate of growth is to the desired rate. A 50% reading for instance will imply that the actual rate of growth is only half that required to reach the identified objective.
DRAFT 23/11/2006 41

SLIDE 40: 3. Assessing policy implementation
40
Efficiency Security Access
Economic Social Environmental
Progress Graph
Energy Sustainability Gauge - components
Low HighSustainability Progress Rate
Time
Indi
cato
r
(-)
Sustainability Progress
Low High
Policy Implementation
Clean Technology
3. Assessing PolicyImplementation
Policy Scan• What are the mix of policies directed at the issue?
Policy Analysis• What is the overall extent of implementation of a mix of policies
1. Identifying shared objectives and key issues
2. Assessing progress towards sustainability3. Assessing policy implementation4. Communicating the results
3. Assessing Policy Implementation Governments have at their disposal an increasingly diverse mix of policy instruments to influence the behavior of consumers, businesses, and governments themselves. The extent to which this diverse mix of instruments is used and directed at a specific issue is referred to as policy implementation. This figure shows the portion of the Energy Sustainability Gauge dedicated to assessing policy implementation. • An assessment of policy implementation requires information about the mix of policies
directed at the issue (a mix of four broad categories of policy instruments – economic, regulatory, expenditure, and institutional instruments)
• The assessment then measures the level of implementation for specific instruments within these categories (i.e., considered, proposed, implemented, etc.).
DRAFT 23/11/2006 42

SLIDE 41: 3. Assessing policy implementation
41
Column 1 Column 2 Column 3 Column 4 Column 5 Column 6
Economic:Tradeable Permits
Deposit RefundSubsidies
Tax - breaksPolicy Initiative #1 score from 0 to 6
Policy Initiative #2 score from 0 to 6
User FeesEarmark Taxes & Funds
Administered Prices
General Program OperationR&D
Education & AwarenessMoral Suasion
Legislative InstrumentsEnforcement Activity
LiabilityCompetition & Deregulation Policy
Internal Policies & ProceduresGreen Procurement
Moral Suasion
Institutional:
Instrument Description
Individual Instrument Implementation
Score
Overall Policy Implementation Score
Instrument Category Implementation
Score
Overall Instrument
Implementation Score
Weigthed average (India); best score
(Canada)Taxes
Policy Instrument Categories and Example Instruments
Direct Expenditure:
Regulatory
Weigthed average (India); best score
(Canada)
Weighted average of individual instrument
scores (India); Simple average of four
instrument categories (Canada)
Policy Implementation Scale
0 - not considered1 - considered2 - considered & proposed3 - proposed & implemented4 - ongoing implementation5 - ongoing implementation &
monitoring6 - monitoring & feedback with
improvement
3. Assessing Policy Implementation
Average or best scoreAverage or
best score
Average of four instrument categories
To assess the extent to which a mix of policy instruments is being implemented to address key issues, the gauge employs a Policy Implementation Card (PIC), illustrated in this table. The PIC does not assess the effectiveness of policies. It simply provides an overall scoring to reflect the level of implementation of a mix of policies directed at an issue. The PIC has six main components represented in each of the columns. Column 1 lists policy categories and instruments. The PIC lists the four broad policy instrument categories along the side of the card (Economic, Direct Expenditure, Regulatory, and Institutional) with a range of example instruments listed under each category. The list is not meant to be comprehensive. The rationale for considering a mix of the four policy instrument categories is based on the belief that a proactive policy strategy requires that policy makers take account of the full range of instruments that can be brought to bear on the challenges of sustainable development. Column 2 describes specific policy instrument initiatives. The descriptions are based on publicly and readily accessible information sources such as policy documents, press releases, and Internet sites. This makes analysis cost effective and transparent. More details can be included in an appended table. Column 3 shows the implementation score of each individual instrument. An implementation scale for this purpose is shown in superimposed box. The scale ranges from 0 to 6, with 0 indicating that this instrument was not considered and 6 indicating that the instrument has been implemented for more than three years, has been monitored, and the instrument improved based on this monitoring.
DRAFT 23/11/2006 43

Column 4 displays the overall instrument implementation score. Two methods can be used to determine the overall instrumentation score: one approach requires knowledge of the relative effects of the different policies and assigns weights to them in relation to their perceived importance in attaining the objective being considered. The average is carried forward to column 4. The other method assigns equal importance to individual policies and carries the best implementation score forward to column 4. The rationale for taking the best score is to not penalize attempts at a new initiative. For example, if an averaging method is used, the implementation of an individual instrument would be penalized if a new instrument were to be considered. Column 5: Instrument category implementation score. Following a similar dual approach, the weighted average of all individual policy instruments within a category or the best implementation score for the whole category can be used as the overall score for that policy instrument category. Column 6: Overall policy implementation score. The overall policy implementation score is calculated as the average of implementation scores across the four broad instrument categories.
DRAFT 23/11/2006 44

SLIDE 42: 4. Communicating the results
42
4. Communicatingthe Results
• Interactive Internet-based gauge• Canada Application
– GHG Emissions– Non-conventional Renewable Energy Use– Overall Energy Efficiency– On-road Automobile Fuel Efficiency
1. Identifying shared objectives and key issues
2. Assessing progress towards sustainability3. Assessing policy implementation4. Communicating the results
4. Communicating the Results The Energy Efficiency Gauge is an interactive Internet-based tool that communicates the results in a visual and engaging manner. Usability is a key criterion for the display – it must be simple and intuitive in highlighting issues and making judgments. Furthermore, it must be attractive enough to hold the attention of the audience. The TERI-Canada project was launched in 1999 with the objective of analyzing market-based, fiscal, and regulatory approaches to promote energy efficiency and conservation. Four issues are considered in the 2002 version of Canada’s Energy Sustainability Gauge: • greenhouse gas (GHG) emissions; • non-conventional renewable energy use; • overall energy efficiency; and • on-road automobile fuel efficiency. These issues and their corresponding Energy Sustainability Gauge readings are presented in the following document: TERI. n.d. A Framework for Energy Sustainability Assessment. The Energy and Resources Institute (TERI): http://www.teriin.org/ee/gbr/fesa.htm, Viewed 31 March 2004.
DRAFT 23/11/2006 45

SLIDE 43: References
43
References• Clark, W.C., and G. Majone. 1985. The critical appraisal of scientific
inquiries with policy implications. Science, Technology, and Human Values 10 (3):121-147.
• EC. 2002. National Environmental Indicator Series: On-road Fuel Efficiency, 1950-1995. Environment Canada, State of the Environment Infobase: http://www.ec.gc.ca/soer-ree/English/Indicators/Issues/Transpo/Tables/pttb07_e.cfm, Viewed 31 March 2004.
• IISD. n.d. Energy Sustainability Gauge. International Institute for Sustainble Development: http://www.iisd.org/energy/gauge.asp, Viewed 31 March 2004.
• TERI. n.d. A Framework for Energy Sustainability Assessment. The Energy and Resources Institute (TERI): http://www.teriin.org/ee/gbr/fesa.htm, Viewed 31 March 2004.
References Clark, W.C., and G. Majone. 1985. The critical appraisal of scientific inquiries with policy implications. Science, Technology, and Human Values 10 (3):121-147. EC. 2002. National Environmental Indicator Series: On-road Fuel Efficiency, 1950-1995. Environment Canada, State of the Environment Infobase: http://www.ec.gc.ca/soer-ree/English/Indicators/Issues/Transpo/Tables/pttb07_e.cfm, Viewed 31 March 2004. IISD. n.d. Energy Sustainability Gauge. International Institute for Sustainble Development: http://www.iisd.org/energy/gauge.asp, Viewed 31 March 2004. TERI. n.d. A Framework for Energy Sustainability Assessment. The Energy and Resources Institute (TERI): http://www.teriin.org/ee/gbr/fesa.htm, Viewed 31 March 2004.
DRAFT 23/11/2006 46