Embed Size (px)
Citation preview
Use of Indicator of Reduction in
Soils (IRIS) tubes as a
Performance Measure in
Wetland Restoration
David M. Mahnken, M.S.
E Sciences, Inc.

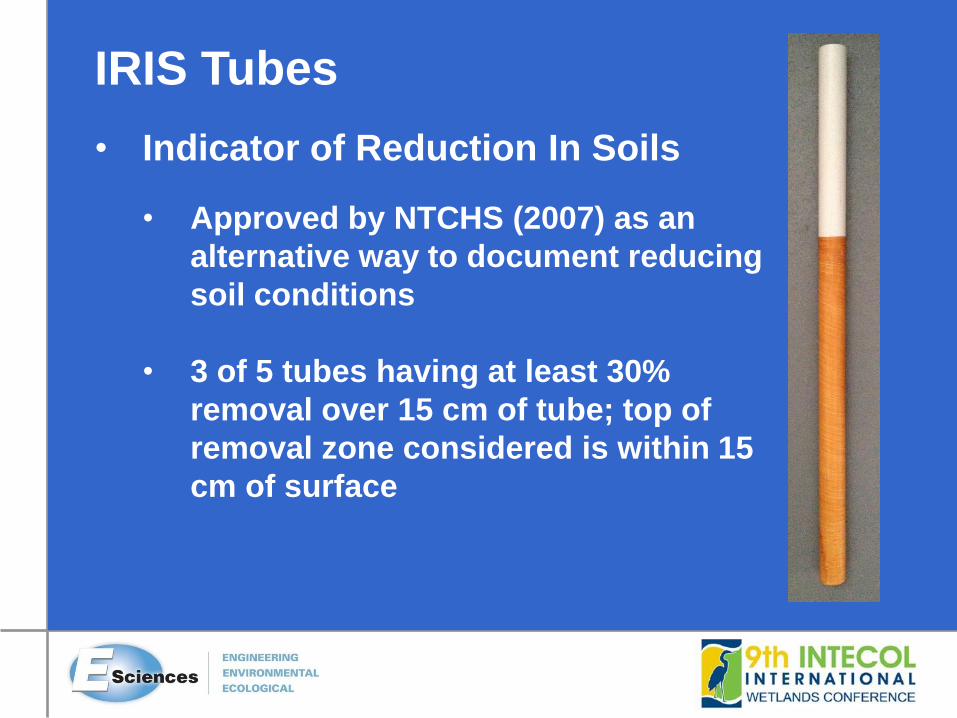
IRIS Tubes
• Indicator of Reduction In Soils
• Used to evaluate the presence of reducing soil
conditions
• Ferrihydrite coating on Polyvinyl Chloride (PVC)
pipe
• Developed by B.J. Jenkinson, Purdue
University and M. Rabenhorst, University of
Maryland
• Available commercially
IRIS Tubes
• Indicator of Reduction In Soils
• Approved by NTCHS (2007) as an
alternative way to document reducing
soil conditions
• 3 of 5 tubes having at least 30%
removal over 15 cm of tube; top of
removal zone considered is within 15
cm of surface
IRIS Tubes
• Indicator of Reduction In Soils
• Installation recommendations provided by US
Army Corps of Engineers Research and
Development Center, Wetland Regulatory
Assistance Program (ERDC TN-WRAP-09-1)
• Typically 5 tubes in multiple nests along
upland-wetland gradient depending upon
purpose of study
• Remain in place 2 to 4 weeks, or site specific
monitoring strategy

IRIS Tubes
• Indicator of Reduction In Soils
• Tubes can be used for evaluation outside of
NTCHS criteria
• For regulatory purposes follow NTCHS criteria
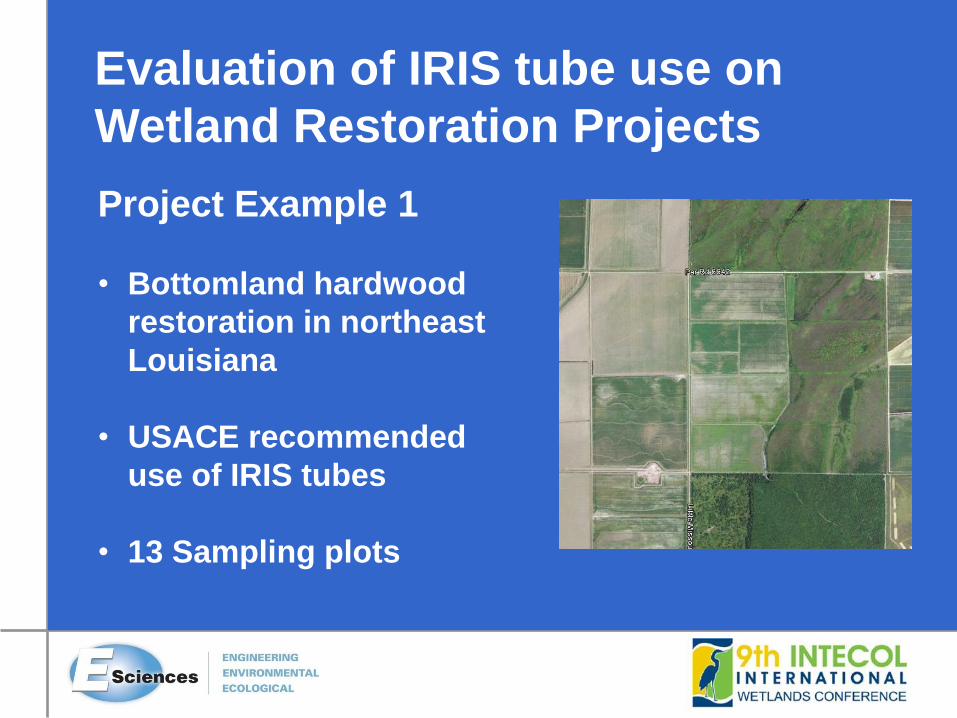
Evaluation of IRIS tube use on
Wetland Restoration Projects
Project Example 1
• Bottomland hardwood
restoration in northeast
Louisiana
• USACE recommended
use of IRIS tubes
• 13 Sampling plots
Evaluation of IRIS tube use on
Wetland Restoration Projects
• One 12 inch IRIS tube installed at center of sample
plots
• IRIS tubes were allowed to remain in place for one
year
• Documented percent removal after one year
• Compared removal with other vegetative
monitoring data
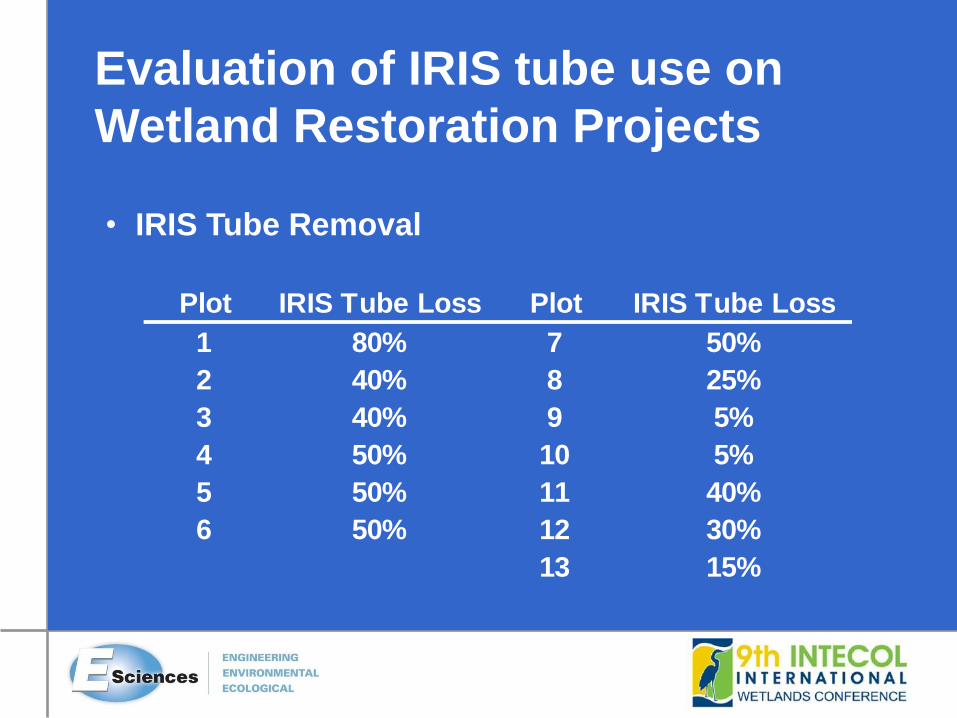
Evaluation of IRIS tube use on
Wetland Restoration Projects
• IRIS Tube Removal
Plot IRIS Tube Loss Plot IRIS Tube Loss
1 80% 7 50%
2 40% 8 25%
3 40% 9 5%
4 50% 10 5%
5 50% 11 40%
6 50% 12 30%
13 15%

0%
5%
10%
15%
20%
25%
30%
35%
40%
45%
0% 10% 20% 30% 40% 50% 60% 70% 80% 90%
% O
blig
ate
Sp
ecie
s
IRIS Tube Removal

0%
2%
4%
6%
8%
10%
12%
14%
0% 10% 20% 30% 40% 50% 60% 70% 80% 90%
% F
AC
W S
pec
ies
IRIS Tube Removal
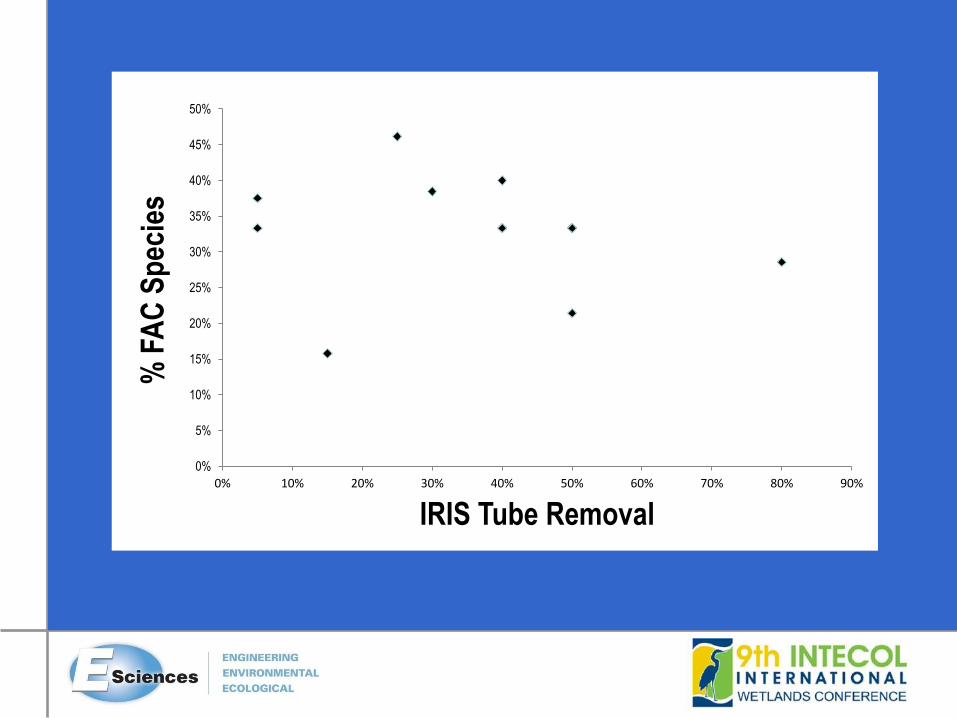
0%
5%
10%
15%
20%
25%
30%
35%
40%
45%
50%
0% 10% 20% 30% 40% 50% 60% 70% 80% 90%
% F
AC
Sp
ecie
s
IRIS Tube Removal
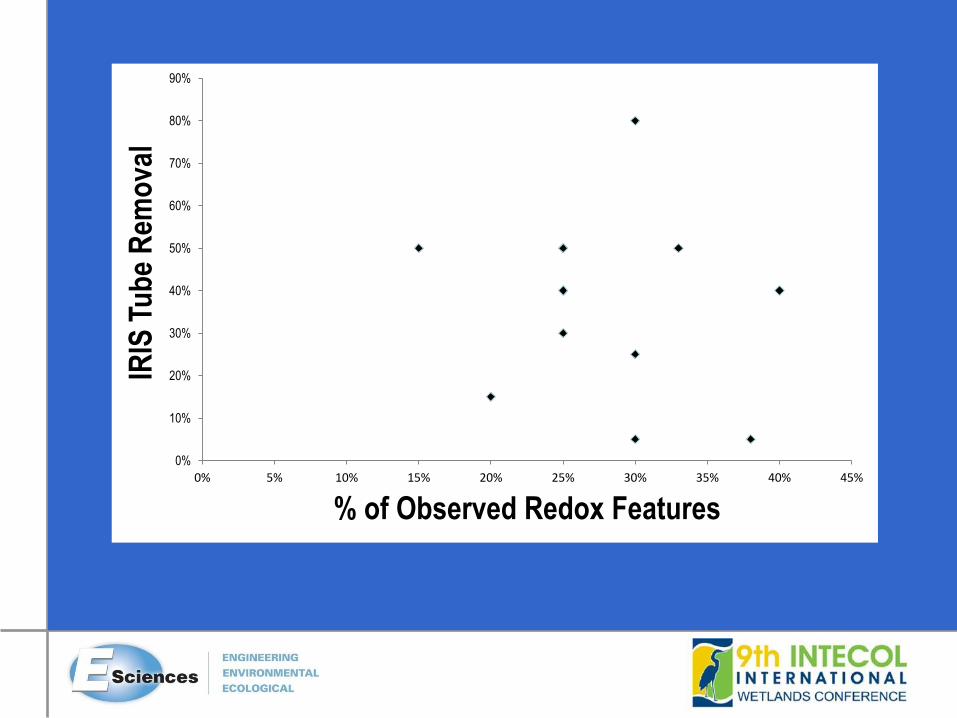
0%
10%
20%
30%
40%
50%
60%
70%
80%
90%
0% 5% 10% 15% 20% 25% 30% 35% 40% 45%
IRIS
Tu
be
Rem
ova
l
% of Observed Redox Features
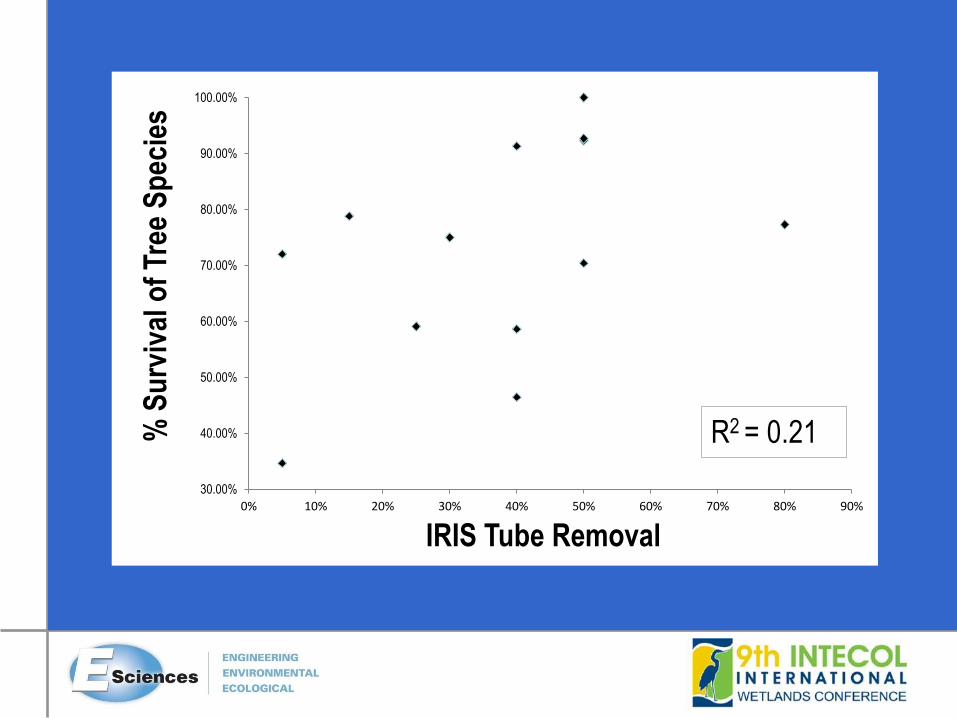
30.00%
40.00%
50.00%
60.00%
70.00%
80.00%
90.00%
100.00%
0% 10% 20% 30% 40% 50% 60% 70% 80% 90%
% S
urv
ival
of
Tree
Sp
ecie
s
IRIS Tube Removal
R2 = 0.21
Evaluation of IRIS tube use on
Wetland Restoration Projects
Lessons Learned
• Follow ERDC and NTCHS guidance
• Develop monitoring strategy that fits need
• NTCHS criteria vs. regulatory
requirements in wetland jurisdictional
determinations (e.g. hydrologic data)
Evaluation of IRIS tube use on
Wetland Restoration Projects
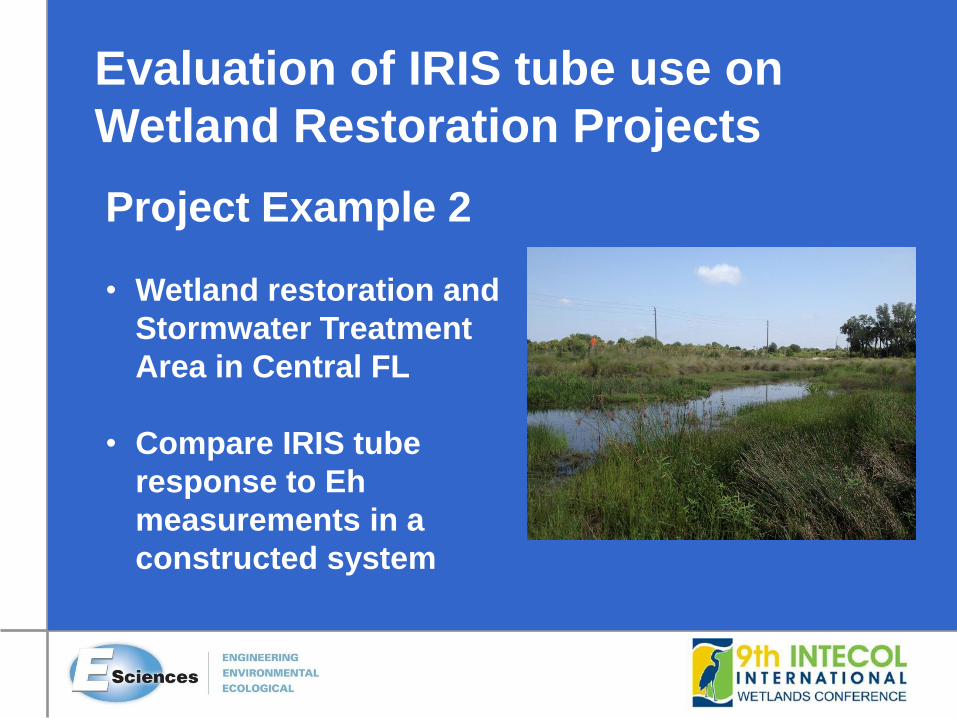
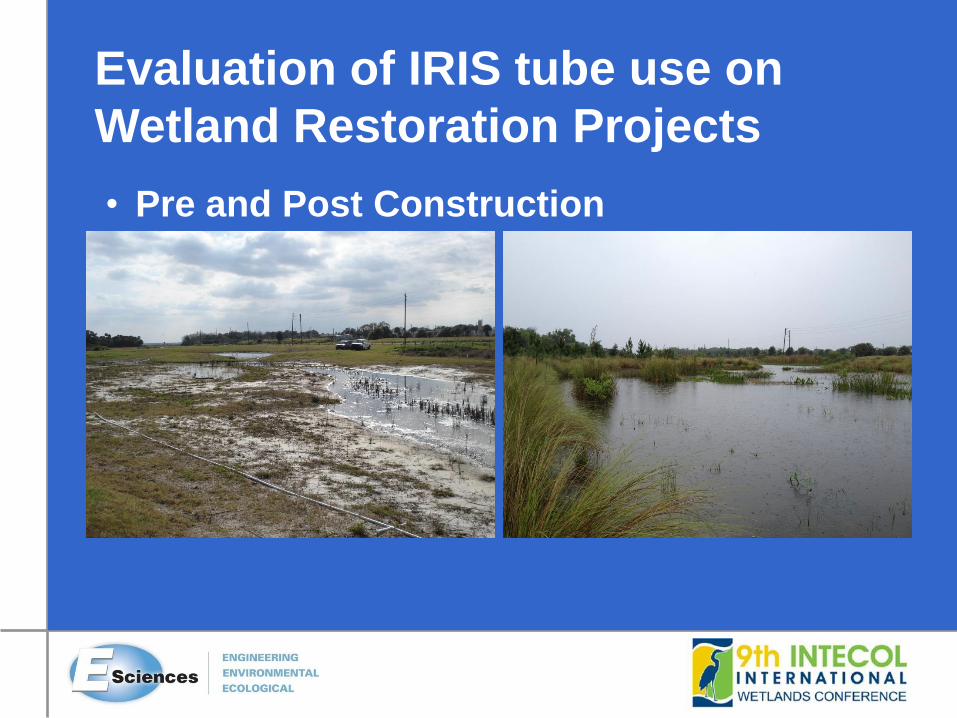
Project Example 2
• Wetland restoration and
Stormwater Treatment
Area in Central FL
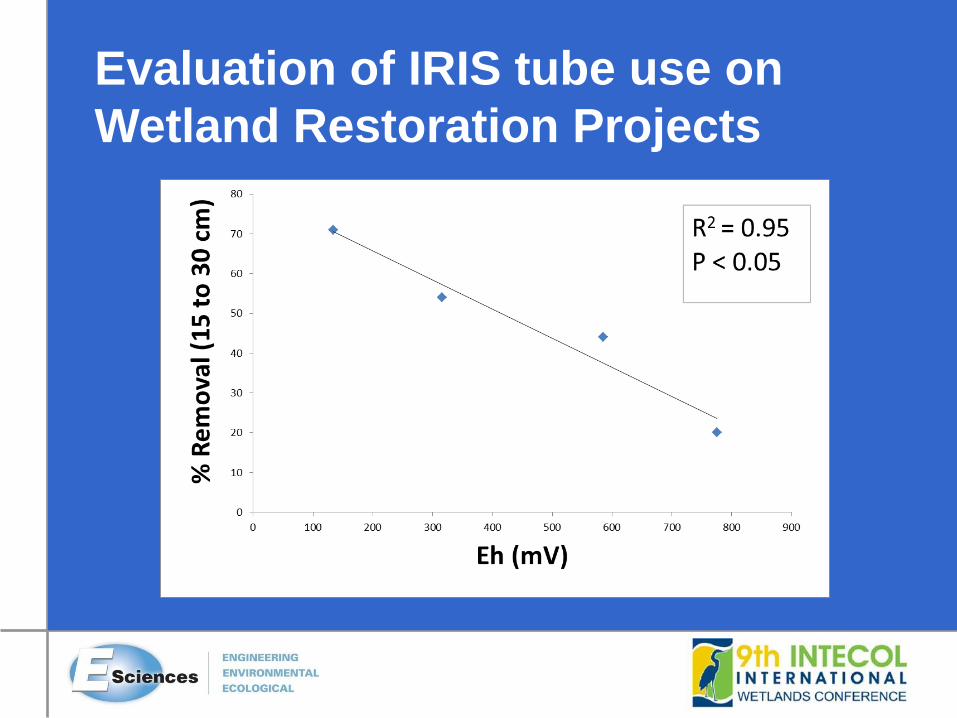
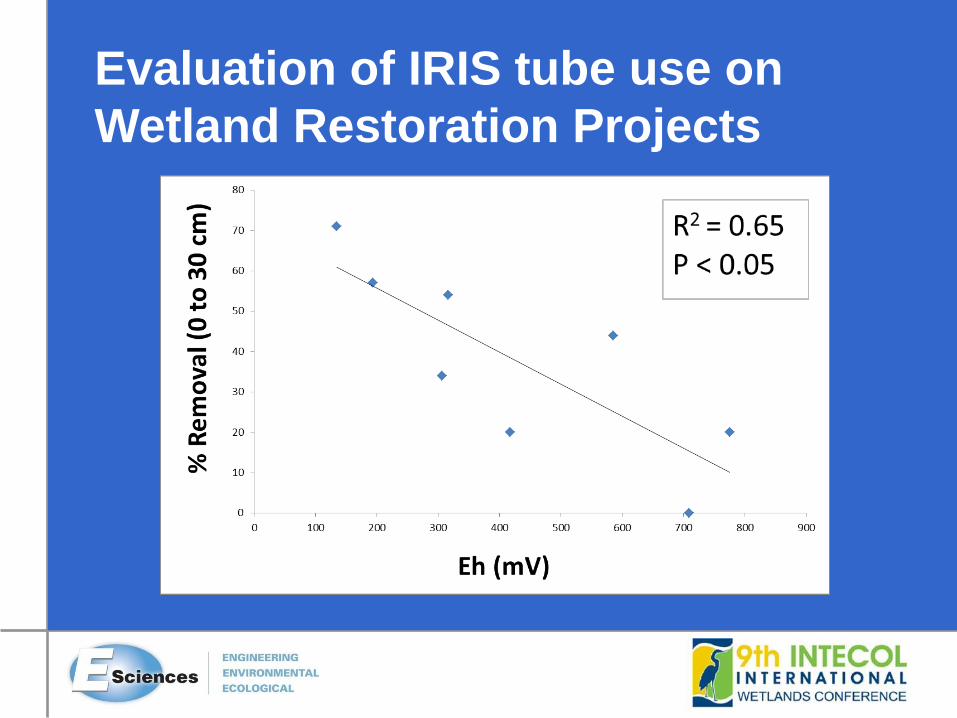
• Compare IRIS tube
response to Eh
measurements in a
constructed system
Evaluation of IRIS tube use on
Wetland Restoration Projects
• Pre and Post Construction
Evaluation of IRIS tube use on
Wetland Restoration Projects
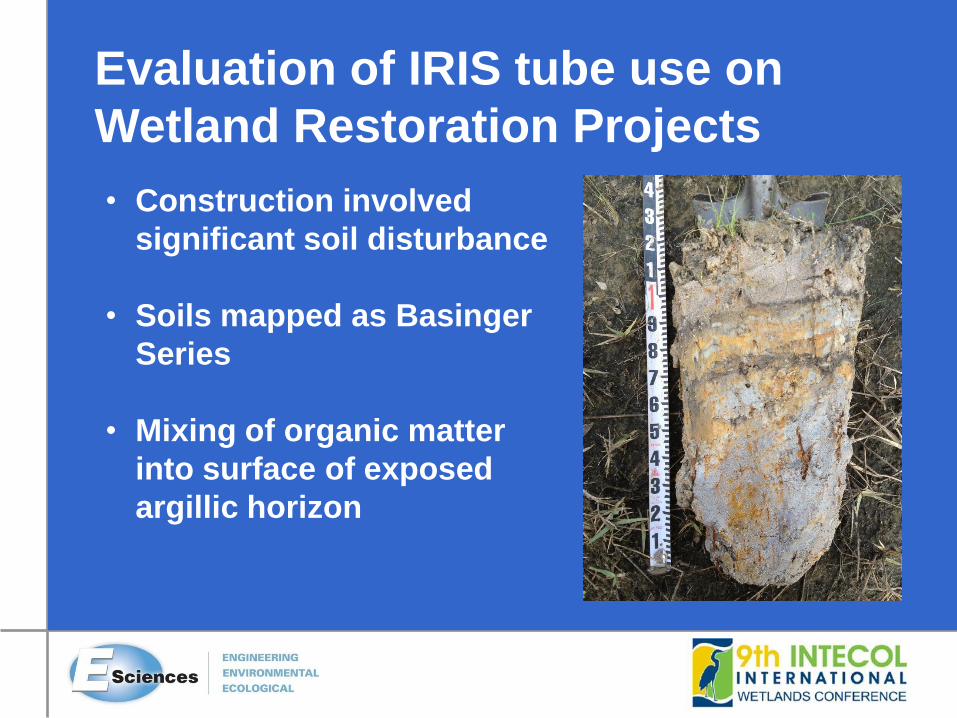
• Construction involved
significant soil disturbance
• Soils mapped as Basinger
Series
• Mixing of organic matter
into surface of exposed
argillic horizon
Evaluation of IRIS tube use on
Wetland Restoration Projects
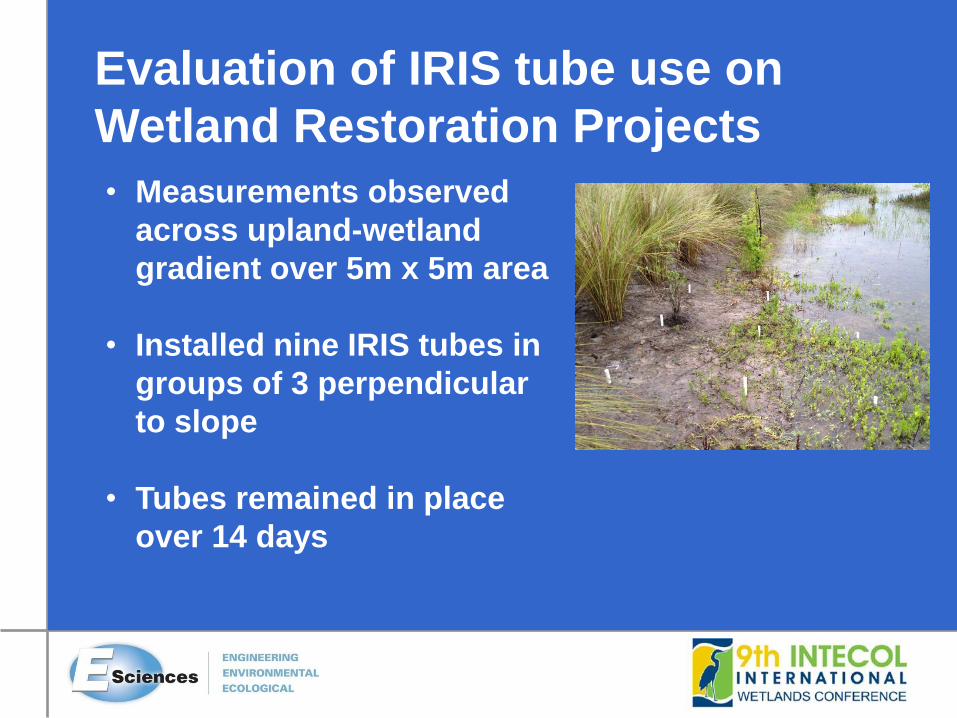
• Measurements observed
across upland-wetland
gradient over 5m x 5m area
• Installed nine IRIS tubes in
groups of 3 perpendicular
to slope
• Tubes remained in place
over 14 days
Evaluation of IRIS tube use on
Wetland Restoration Projects
• Eh and pH measurements were recorded parallel
to IRIS tubes and at 15 and 30 cm depths at each
location.
• Eh was measured using platinum electrodes and
Ag/AgCl reference electrode with commercial
grade digital multimeter
• Water level measurements also recorded along
gradient
Evaluation of IRIS tube use on
Wetland Restoration Projects
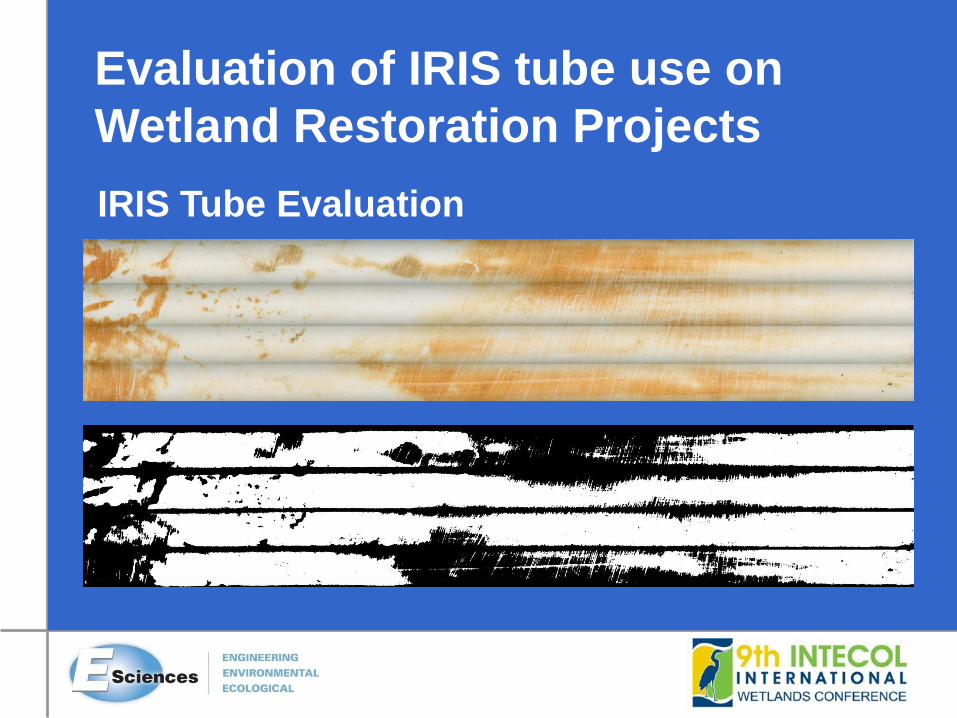
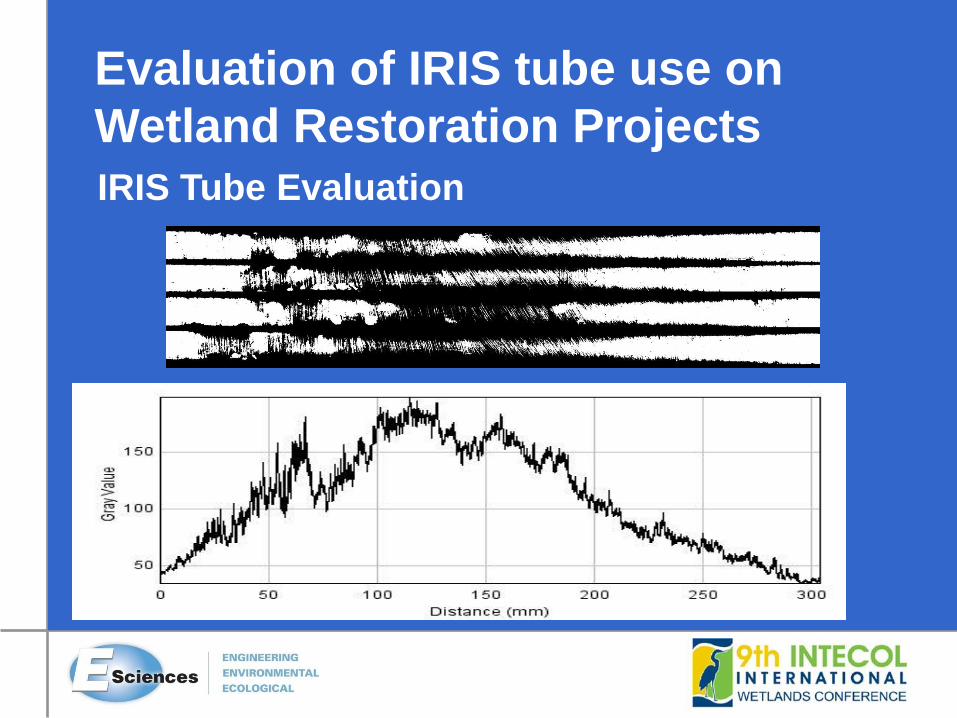
IRIS Tube Evaluation
• Tubes scanned on each 90º axis
• Scans stitched using Adobe Photoshop
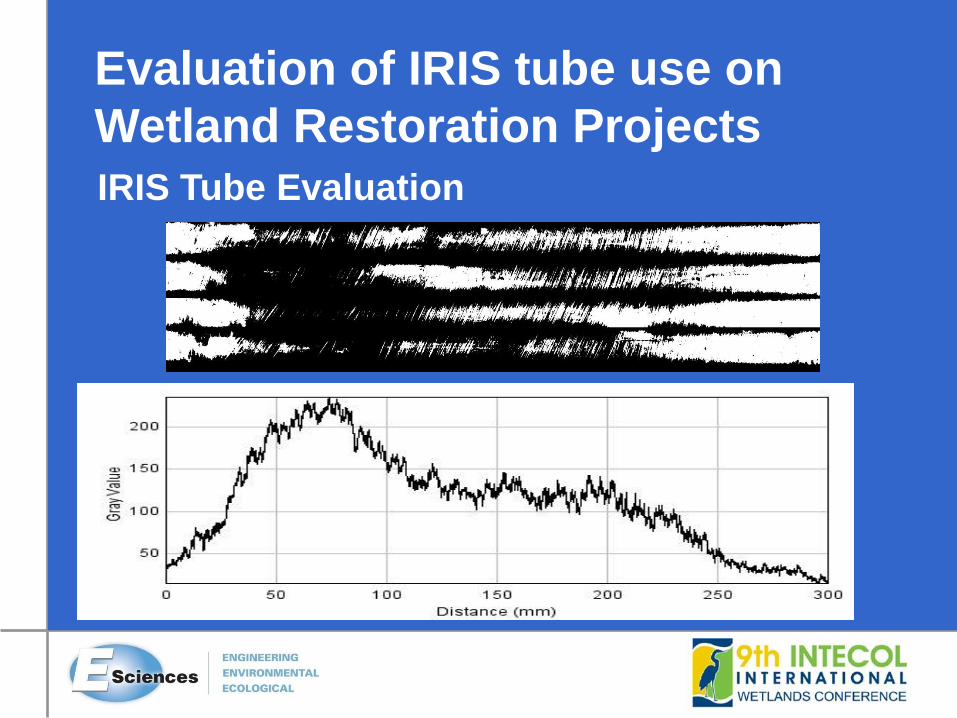
• Percent removal analyzed using ImageJ Software
(Wayne Rasband, NIH)
• Converted to binary images to isolate areas of
removal
Evaluation of IRIS tube use on
Wetland Restoration Projects
IRIS Tube Evaluation

Evaluation of IRIS tube use on
Wetland Restoration Projects
IRIS Tube Evaluation
Evaluation of IRIS tube use on
Wetland Restoration Projects
IRIS Tube Evaluation

Evaluation of IRIS tube use on
Wetland Restoration Projects
Evaluation of IRIS tube use on
Wetland Restoration Projects
Evaluation of IRIS tube use on
Wetland Restoration Projects

Evaluation of IRIS tube use on
Wetland Restoration Projects
Evaluation of IRIS tube use on
Wetland Restoration Projects
IRIS Tube Evaluation
Evaluation of IRIS tube use on
Wetland Restoration Projects
Lessons Learned
• Evaluate IRIS tubes in segments that correspond
to soil profile; consistent with NTCHS criteria
• Understand soil morphology effect on IRIS tube
response
• Understand effect of application of soil
amendments on ability to demonstrate
development of hydric soils

Evaluation of IRIS tube use on
Wetland Restoration Projects
Questions?
Special thanks to
Ecosystem Renewal and
ENCO Laboratory for their
help and support