Embed Size (px)
Citation preview
Full Terms & Conditions of access and use can be found athttp://www.tandfonline.com/action/journalInformation?journalCode=tidf20
Download by: [University of Waterloo] Date: 13 September 2016, At: 07:15
International Journal of Image and Data Fusion
ISSN: 1947-9832 (Print) 1947-9824 (Online) Journal homepage: http://www.tandfonline.com/loi/tidf20
Use of mobile LiDAR in road informationinventory: a review
Haiyan Guan, Jonathan Li, Shuang Cao & Yongtao Yu
To cite this article: Haiyan Guan, Jonathan Li, Shuang Cao & Yongtao Yu (2016) Use of mobileLiDAR in road information inventory: a review, International Journal of Image and Data Fusion,7:3, 219-242, DOI: 10.1080/19479832.2016.1188860
To link to this article: http://dx.doi.org/10.1080/19479832.2016.1188860
Published online: 17 Jun 2016.
Submit your article to this journal
Article views: 32
View related articles
View Crossmark data

REVIEW
Use of mobile LiDAR in road information inventory: a reviewHaiyan Guana, Jonathan Lib,c, Shuang Caoa and Yongtao Yud
aCollege of Geography and Remote Sensing, Nanjing University of Information Science & Technology,Nanjing, China; bKey Laboratory of Sensing and Computing for Smart City, School of Information Scienceand Engineering, Xiamen University, Xiamen, China; cDepartment of Geography and EnvironmentManagement, University of Waterloo, Waterloo, Canada; dFaculty of Computer and Software Engineering,Huaiyin Institute of Technology, Huaian, China
ABSTRACTMobile LiDAR technology is currently one of the attractive topicsin the fields of remote sensing and laser scanning. Mobile LiDARenables a rapid collection of enormous volumes of highly dense,irregularly distributed, accurate geo-referenced data, in the formof three-dimensional (3D) point clouds. This technology has beengaining popularity in the recognition of roads and road-sceneobjects. A thorough review of available literature is conducted toinform the advancements in mobile LiDAR technologies and theirapplications in road information inventory. The literature reviewstarts with a brief overview of mobile LiDAR technology, includingsystem components, direct geo-referencing, data error analysisand geometrical accuracy validation. Then, this review presents amore in-depth description of current mobile LiDAR studies onroad information inventory, including the detection and extractionof road surfaces, small structures on the road surfaces and pole-like objects. Finally, the challenges and future trends are discussed.Our review demonstrates the great potential of mobile LiDARtechnology in road information inventory.
ARTICLE HISTORYReceived 10 January 2016Accepted 8 May 2016
KEYWORDSMobile LiDAR; roadinformation inventory;pavement cracks; roads;road markings; pole-likeobjects
1. Introduction
Remote-sensing technologies for road information inventory are undergoing rapiddevelopments. The possibility of acquiring three-dimensional (3D) information oflarge-area roadways with survey-grade accuracy at traffic speeds is opening up newand efficient ways for road information inventory. Recent advances in sensor electronicsand data treatment make these technologies affordable. The two major remote-sensingtechnologies that are popularly used in road information inventory are image-based andlaser-based mobile mapping systems (Toth 2009). Mobile mapping systems collectstreet-level data more completely and efficiently than traditional surveying methods.Image-based mobile mapping systems have gained popularity in modelling and esti-mating road boundaries for road safety assistance (Dickmanns and Mysliwetz 1992,Pomerleau and Jochem 1996, Bertozzi et al. 1997) because the images contain richinformation, such as colour and texture, beneficial for road extraction. Commercial
CONTACT Haiyan Guan [email protected] College of Geography and Remote Sensing, NanjingUniversity of Information Science & Technology, Nanjing, Jiangsu 210044, China
INTERNATIONAL JOURNAL OF IMAGE AND DATA FUSION, 2016VOL. 7, NO. 3, 219–242http://dx.doi.org/10.1080/19479832.2016.1188860
© 2016 Informa UK Limited, trading as Taylor & Francis Group
image-based road extraction systems have been widely available (Liu et al. 2013).However, image-based mobile mapping systems are limited to illumination and weatherconditions, shadows cast by roadside buildings and trees, and occlusions caused bynearby moving vehicles and pedestrians (Tsogas et al. 2011). Moreover, the capturedimage data lack of accurate geospatial information and suffer greatly from distortions.
A laser-based mobile mapping system is flexibly mounted on any moving platforms,such as airplanes, cars/trucks, trains and boats. Future development continues to designa compact, lightweight and relatively inexpensive multipurpose mobile laser scanningsystem that should be quick and easy to deploy, and requires a minimum amount ofexisting equipment for operational support. An unmanned aerial vehicle (UAV, e.g.balloons and helicopters) or a small all-terrain vehicle based laser scanning platformwould be a promising development trend (Glennie et al. 2013). In this review, mobilelaser scanning implies that a laser scanning system is deployed on the top of a land-based vehicle (Lemmens 2011). In the field of laser scanning, more terms, such asterrestrial mobile laser scanning (TMLS), land-based MLS or mobile LiDAR, are inter-changeably used. Through this review, the term ‘mobile LiDAR’ is used.
Mobile LiDAR, a widely used technology since year 2003 when the first mobile LiDARsystem emerged (Glennie 2009), has attracted much attention for mainly transportation-related applications (Jacobs 2005, Toth 2009, Stauth and Olsen 2013). It is a datarevolution. With a mobile LiDAR system, mapping engineers can drive on a highway,rural road and railroad, or along the shoreline of a river or lake. Along the way, thesystem captures trees, bridges, streetlights, buildings, power lines and other street-scenesmall objects (e.g. cracks, road markings, etc.) in the form of 3D point clouds. In addition,the acquired 3D point clouds provide accurate 3D geospatial information of roadways.The collected data are a totally immersive 3D view of the objects and surroundings(Rybka 2011). Research achievements or application cases were demonstrated on var-ious sources, such as conference presentations, peer-reviewed journals, industry maga-zines and websites, and technical reports (Williams et al. 2013). Thus, this reviewpresents the results of an in-depth review of available literature to highlight theadvancements of mobile LiDAR technology in road information inventory.
This review is important for researchers who are considering the use of mobile LiDARtechnologies for road information inventory. The contents of this work include thefollowing sections. First, the literature review presents background on the basis ofmobile LiDAR technology, including in-depth descriptions of current mobile LiDARsystem components, geo-referencing, error analysis and geometric accuracy validation.Next, this review shares insights on current and emerging road inventory applications ofmobile LiDAR through academic research. Finally, a discussion of challenges and futureresearch is presented and concluding remarks are given.
2. Mobile LiDAR technology
LiDAR technologies have become well-established surveying techniques for acquiringgeospatial information because Global Navigation Satellite System (GNSS) technologieshave been widely commercially used since the early 1990s (Beraldin et al. 2010). Closelyfollowed by airborne LiDAR, terrestrial LiDAR (that is, the laser scanner is mounted on atripod) and mobile LiDAR technologies have been rapidly developed. Mobile LiDAR
220 H. GUAN ET AL.
technology is being used at an increasing rate for transportation-related applicationsdue to the following advantages. One of the crucial benefits of mobile LiDAR is itsgreater safety over other traditional surveying methods because mobile LiDAR performsroad survey inside a vehicle with the flow of traffic, sparing surveyors the exposure totraffic and environmental hazards. Furthermore, mobile LiDAR efficiently performs roadsurveys with fewer surveyors at traffic speeds, day and night. In addition, mobile LiDARcollects a very wide range of data sets at various accuracies, from geographical informa-tion system (GIS) grade to survey grade (Gordon 2010). Therefore, a growing number oftransportation agencies around the world have considered mobile LiDAR for roadinventory and outlined corresponding guidelines for transportation-related applications(Williams et al. 2013). To fully picture the feasibility of mobile LiDAR for road surveys, thisreview will detail (1) its system configuration, (2) geo-referencing, (3) error analysis, and(4) geometric accuracy validation.
2.1. System components
Puente et al. (2013a) presented and compared several commercially produced mobileLiDAR systems. Though there are many types of mobile LiDAR systems, most mobileLiDAR systems consist of five essential parts: (1) a mobile platform; (2) a navigationsolution system that integrates GNSS antenna(s), an Inertial Measurement Unit (IMU),and a wheel-mounted Distance Measurement Indicator (DMI); (3) laser scanner(s); (4)camera(s); and (5) a control system including data storages and integrating all sensors’function. In addition, a rigid platform firmly attaches laser scanners, digital cameras,GNSS and IMU, and other ancillary devices into a compact unit. The offsets betweeneach sensor have to be strictly measured to remain stable for mobile LiDAR systems.Usually, these offset parameters are provided by the manufacturers; thus, no concerns ofusers are needed.
2.1.1. Navigation sensorsAmong the navigation sensors, GNSS and IMU mainly provide accurate position andorientation measurements of a moving vehicle, and DMI provides supplementary posi-tioning information during GNSS outage. Rather than one of these navigation sensorsused alone, an integrated navigation system allows exploiting the complementarynature of these sensors. GNSS receivers provide three primary measurements: time,position and velocity (speed and direction). Position and velocity measurements areinputs to the logging computers and the IMU, respectively. Although GNSS receivers canprovide highly accurate position information in an open environment, it suffers whensatellite signals are blocked by high-rise buildings, vegetation, tunnels and other obsta-cles. On the other hand, IMU provides attitude information (e.g. roll, pitch and heading)of the moving vehicle, and requires no satellite signals to sense three-axis accelerationsand three-axis angular rotations; however, the accuracy of position and orientationdegrades with the time. An IMU sensor usually contains an embedded microcomputerunit and a module of accelerometers and gyroscopes. GNSS provides an initial IMUposition and attitude, and thereafter the updated positions and velocities are calculatedby integrating the measurements from the accelerometers and gyroscopes of IMU. OnceIMU is initialised, no external information is required to determine its positions, velocities
INTERNATIONAL JOURNAL OF IMAGE AND DATA FUSION 221
and orientations; therefore, it is autonomous, immune to jamming or deception. IMU hasalmost no high-frequency errors but gives time-growing errors; while GNSS, on the otherhand, has high-frequency noise but with good long-term accuracy. Thus, GNSS positionsare augmented by IMU in periods of poor satellite conditions, while GNSS providesupdated position information to IMU. Moreover, a wheel-mounted DMI constrains errordrifts, especially during vehicle stoppages in areas of intermittent GNSS coverage.Attached to one of the vehicle’s wheels, DMI measures wheel rotations, directly estimat-ing a travelled distance. DMI usually supplements GNSS and IMU with additionalpositioning information. Wheel rotation data constrain drift, especially during vehicle’smoving in areas of intermittent GNSS coverage. In addition, DMI assists in reducingduplicated LiDAR data while the vehicle is stopping.
2.1.2. Laser sensorsThe number and arrangement pattern of laser scanners vary greatly with differentmobile LiDAR systems. Laser scanners emit continuous laser beams at a fixed or user-defined angular increment to measure the distances to objects. In current mobile LiDARsystems, two techniques are mainly used for range measurements: pulse measurementand phase shift measurement (Beraldin et al. 2010, Lichti 2010). For pulse measurement(or time-of-flight (TOF)), a laser scanner emits pulse beams and records the round-triptime to and back from the measured objects to measure the range based on the lightpropagation velocity in a given medium.
Phase measurement in continuous wave modulation can be considered as an indirectform of TOF measurement. Continuous waves can be modulated in amplitude modula-tion (AM) or frequency modulation (FM) for measuring target ranges. Amplitude mod-ulation measures the range using phase difference between the emitted laser beam andthe returned laser light. Frequency modulation measures the range by exploiting beatfrequencies (Beraldin et al. 2010).
Generally, the phase shift mode tends to have very high data rates (up to 1,000,000points/s) and higher precision ranging from sub-millimetre to sub-centimetre, butshorter measuring ranges (<100 m) (Petrie and Toth 2008, Beraldin et al. 2010). On thecontrary, the TOF measurement has a much longer range (e.g. 800 m) but lower datarates (usually <500,000 points/s in TLS (terrestrial laser scanning) /mobile LiDAR and<20,000 points/s in ALS (airborne laser scanning)) and relatively lower precisions rangingfrom sub-centimetre to centimetre level. The TOF mode is commonly used for themajority of current commercially available mobile LiDAR systems, while the phasemode is mostly used for terrestrial LiDAR systems. Examples of TOF laser scanners includeVelodyne (2016), Optech Lynx (2016), RIEGL (2016), Sick (2016), Leica (2016), Trimble(2016), and DYNASCAN MDL (2016). Examples of phase shift laser scanners include Z+F(2016) and Faro (2016). FARO and Z+F scanners have also been operated in mobile LiDARsystems. Many types of TOF-based and phase-based laser scanners in mobile LiDARsystems are set to operate in a 2D scan line /planar mode, while the third dimensionof the acquired 2D scan data can be obtained by the forward movement of the vehicle.
The quality of a laser scanner is determined by the following factors: eye safety,accuracy, field-of-view, data rate, scan frequency and range (Iavarone 2007). Table 1 liststhe system parameters of several laser scanners popularly used in the market. Laserscanners use Class 1 eye safety rating, that is, the beam is invisible and safe to human
222 H. GUAN ET AL.

Table1.
System
parametersof
severalcurrentlypo
pularly
used
laserscanners.
Laserscanner
SICK
LMS291
MDLLM
S511
RIEG
LVQ
-450
OptechLynx
SG1
Z+F
PROFILE
9012
Faro
Focusx330
Velodyne
HD64
Datarate
(kHz)
4036
550
150–1200
1000
976
1333
Scan
rate
(Hz)
75–100
25–100
200
500
200
975–15
FOV(°)
180(H)/90(V)
190
360
360
360
360(H)/300(V)
360(H)/26.8(V)
Rang
e(m
)80
(10%
reflectivity)
40(10%
reflectivity)
800(80reflectivity)/
70(10reflectivity)
250(10reflectivity)
119
0.6–330
120(80reflectivity)/
50(10reflectivity)
Rang
eprecision(m
m)
10mm
@1-20
m5
51
110
Rang
eaccuracy
(mm)
±35
±10
@50
m8
±50
1±2
<50
Returns(#)
–5
Practicallyun
limited
41
11
Lasertype
TOF
TOF
TOF
TOF
Phase
Phase
TOF
INTERNATIONAL JOURNAL OF IMAGE AND DATA FUSION 223
eyes in both aided and unaided conditions. The accuracy of a mobile LiDAR systemdirectly determines the accuracy of the final deliverable products. A field-of-view dic-tates the extent of the area that can be covered in a single pass of the collection vehicle.The laser scan rate and data rate determine mobile LiDAR data collection rate. As shownin Table 1, RIEGL VQ-450, one of the most advanced commercially available laserscanners, has a scan rate of up to 500 Hz, which allows the users to collect highlyaccurate data of required ground point density within a very short period of time. Thepoint resolution of the collected data depends on several factors, including vehiclespeed, laser mirror scanning speed and system measurement rate.
2.1.3. Camera/video recordingMost mobile LiDAR systems incorporate camera(s) to provide ancillary information. Forexample, for visualisation, the points collected by laser scanners can be colourised bytrue-colour information in the real world. Similarly to laser scanners, the number andarrangement pattern of digital cameras vary with different mobile LiDAR systems.Different mobile LiDAR systems configure different numbers of digital cameras inmany deployed patterns. For example, a typical Trimble MX-8 system is deployedwith four Grasshopper ® GRAS-50S5C CCD cameras with a maximum resolution of2448 × 2048 pixels and a maximum frames per second of 15. The VMX-450 mobileLiDAR system is typically configured with four digital cameras, each of which is sealedwith a protective housing for operating under different environmental conditions. Thespecific deployment of cameras is customised by users and projects. This additionalcolour information contributes to road feature extraction because it provides a greatlevel of features details.
2.2. Direct geo-referencing
Calculating ground coordinates for illuminated objects, termed ‘geo-referencing’, from amobile LiDAR system can be found in the literature (Glennie 2007). The laser scanner isreferenced when its position and orientation relative to the mapping coordinate systemis known by a set of navigation systems. The navigation data must be precisely timestamped for sensor integration and determination of the exact coordinates of mappingpoints (Barber et al. 2008). The coordinates of a target P shown as Figure 1 can becalculated by
XPYPZP
24
35M
¼XGNSSYGNSSZGNSS
24
35M
þ RMIMU ω;φ;κð Þ � RIMUS Δω;Δφ;Δκð Þ � rSP αdð Þ þ
LXLYLZ
24
35IMU
S
�LGIX
LGIY
LGIZ
2664
3775
IMU
GNSS
0BB@
1CCA
(1)
where the parameters in Equation (1) are listed in Table 2. Equation (1) defines therelationship among all observation parameters for producing geo-referenced pointclouds.
224 H. GUAN ET AL.

2.3. Error analysis for mobile LiDAR systems
Equation (1) defines the relationship among all observation parameters for producinggeo-referenced point clouds. To examine the final point accuracy, we discuss thefollowing typical errors of these observations.
Laser scanner errors: According to Equation (1), the factors that influence the coordinatesof point P include distance error (Δd) and scanning angle error (Δα). The error in distance iscaused by the internal accuracy of the clock that measures the time of flight and the widthof the output laser pulse; the error in scanning angle is due to the angular resolution of thelaser scanner angle encoder and the uncertainty of beam divergence (Olsen et al. 2013).
Figure 1. An illustration of coordinates between mapping frame, target and mobile LiDAR system.
Table 2. Parameters used in geo-referencing.XP; YP; ZP Location of the target P in the mapping frame.XGNSS; YGNSS; ZGNSS Location of GNSS antenna in the mapping frame.RMIMUðω;φ; κÞ Rotation matrix between IMU and mapping frame, ω;φ; κð Þare the roll, pitch and yaw of the
sensor with respect to the local mapping frame. These values are provided by the IMU system.RIMUS ðΔω;Δφ;ΔκÞ Rotation matrix between the laser scanner and IMU, ðΔω;Δφ;ΔκÞ are the boresight angles which
align the scanner frame with IMU’s body frame. Those values are determined by the systemcalibration.
rSPðαdÞ Relative position vector of Point P in the laser scanner coordinate system, α and d for scan angleand range measured and returned by the laser scanner.
LX ; LYLZ Lever-arm offsets from the navigation and IMU origin to the laser scanner origin. These values aredetermined by system calibration or measurement.
LðG=IÞX ; LðG=IÞY ; LG=IZLever-arm offsets from the IMU origin to the GNSS origin. These values are determined by system
calibration or measurement.
INTERNATIONAL JOURNAL OF IMAGE AND DATA FUSION 225

IMU attitude errors: The IMU component of a mobile LiDAR system provides roll,pitch and heading angles that represent the rotation relationship between the IMUand the mapping frames. An IMU consists of two main parts: (1) three orthogonalaccelerometers, each of which measures the acceleration along a specific axis, and (2)three orthogonal gyroscopes, each of which measures and maintains the orientation,based on the principles of conservation of angular momentum. Accordingly, systema-tic errors of the sensor include accelerometer biases and gyro drifts. Typically, as IMUcomponents are supplied by two or three different system manufacturers, theiraccuracies can be examined from the manufactures’ technical specifications. Forexample, RIEGL VMX-450 is configured with a set of Applanix® POS LV 510, whosetypical accuracy can be found on the manufacturer’s technical specification (http://www.applanix.com). Applanix® POS LV 510 can deliver 0.005° in roll and pitch, and0.015° in heading (at 1σ).
Positioning errors: The positioning accuracy of a GNSS subsystem is influenced by thefollowing factors: multipath, atmospheric errors, baseline length, poor satellite geometryand loss of lock (Haala et al. 2008); therefore, the absolute level of the positioningaccuracy for mobile LiDAR survey is difficult to quantify. Ideally, the positioning accuracyis expected to be 1 cm +1 ppm horizontally and 2 cm +1 ppm vertically within arelatively short kinematic baseline (<30 km) (Bruton 2000).
Lever-arm offset errors: Usually, the origins of laser scanners and IMU cannot becollocated; the lever-arm offsets thus must be known in order to obtain accurately geo-referenced mobile LiDAR point clouds. There are two methods to measure the lever-armoffsets: calibration and physical measurement. Compared with the first method, thesecond one is widely used because it is simple to implement. Accordingly, the measure-ment errors are also introduced because of the assumption of the alignment of twosensors’ axes (Glennie 2007, Olsen et al. 2013).
Boresight errors: The boresight errors result from the misalignments between the IMUand laser scanner measurement axes, as shown in Figure 1. To process laser scanningdata, the location of the scanner and its orientation in relation to the IMU must beprecisely known because alignment errors will be propagated over the distancebetween the sensor and the object being scanned. Boresighting is a very precisemeasurement process that attempts to correct any mounting misalignments betweenthe IMU and laser scanners (Rieger et al. 2010, Lim et al. 2013).
The above discussion of error sources for a mobile LiDAR system demonstratesthat the accuracy of mobile LiDAR point clouds depends on the underlying accuracyof GNSS/IMU and laser scanners. Among those errors, two possible error sources(boresight and lever-arm) can be recovered by system calibration. In fact, the overallaccuracy of mobile LiDAR point clouds is mainly affected by the navigation solutionbecause of multi-path effects and signal shading that are caused by high-rise build-ings and trees along the street deteriorate GNSS conditions in a moving vehicle(Barber et al. 2008, Haala et al. 2008). Compared to a long distance from an aircraft tothe ground in ALS, GNSS positioning errors of a mobile LiDAR system have a muchgreater impact on the overall error budget, owing to a short distance between alaser scanner and a scanned object, even about several to 10 metres. To improvemobile LiDAR data accuracy, a post-processing procedure of navigation trajectory isindispensable.
226 H. GUAN ET AL.
2.4. Geometric accuracy validation
As mentioned above, mobile LiDAR systems must operate different sensors (i.e. GNSS,IMU, DMI and laser scanner) to provide geometric quantities, and synthesise thesequantities to detail point cloud data. To ensure that engineers and decision-makerstake full advantage of using mobile LiDAR technology, accuracy verification must beconducted because mobile LiDAR systems have their own set of limitations and theirperformance vary with some factors, such as range distance, object reflectivity, incidentangle of laser pulse to the reflective object, and the accuracy of navigating system. Aliterature review is presented to report such geometric validation work.
Goulette et al. (2008) reported that the laser-based LARA-3D system produced anestimated measurement precision of 5 cm. Barber et al. (2008) conducted geometricvalidation of a Streetmapper system (integrated with the TERRA control GPS/IMU systemand three Riegl laser profilers). The experiments assessed the precision and accuracy ofdelivered data across two test sites: a peri-urban residential housing estate with low-density housing and wide streets, and a former industrial area containing narrow streetsand tall warehouses. The study showed that a measurement precision (95%) of between2.9 and 3.1 cm was achieved in elevation; RMS errors in elevation were in the order of3 cm; the planimetric accuracy of approximately 10 cm was achieved. The experimentalresults demonstrated that the system can be successfully used in the survey of urbanareas. Puente et al. (2013b) assessed the performance of a Lynx Mobile Mapping systemfrom Optech Inc. The system was operated at a maximum scan frequency of 200 Hz,pulse repetition frequency of 500 kHz per sensor, and a scanning field of view of 360°.Absolute accuracy levels around 1–5 cm and a relative accuracy level of 10 mm wereachieved, which made the system suitable for very accurate applications.
Lim et al. (2013) assessed the vertical and horizontal accuracies of data collected bythe mobile LiDAR system, including an Optech ILRIS 3DMC laser scanner, and thenavigation instruments (an IMU and two GPS antennas). The final point cloud accuracywas 6.0 cm (east), 9.5 cm (north) and 5.3 cm (height). The study also demonstrated thatthe point-to-point spacing in a single scan line varied from 2 to 5 cm at the rangingdistance of <30 m and the minimum scan line spacing of 10 cm was observed at avehicle speed of 8 km hour−1, a scan angle of 10° and a scan count of 80.
Guan et al. (2013) assessed the performance of Trimble MX-8. The system configura-tion is detailed in Figure 2. Two survey areas were within Fengtai District, northwest ofBeijing, China. The first test site was a two-side, four-lane road with a greenbelt in themiddle. Many residential buildings (about 5 or 6 storeys) and large industrial manufac-tories and warehouses were interspaced along the sides of the road. The sky view acrossthe street was considered as a good case for capturing more GPS signals although asmall amount of overhanging vegetation that restricted visibility was located along thestreet. The second test site was relatively narrow and approximately 26.9 km long. Morehigh-rise commercial buildings and apartments were located along the survey route. Thecity canyon was created by narrow streets and high-rise buildings, which limited the skyview for capturing satellite signals. In addition, there was a high bridge crossing thepass, further blocking the satellite signals.
To validate the performance of the system in Guan et al. (2013), around 30 controlpoints (corner points of objects on the streets and white road markings) for validation
INTERNATIONAL JOURNAL OF IMAGE AND DATA FUSION 227
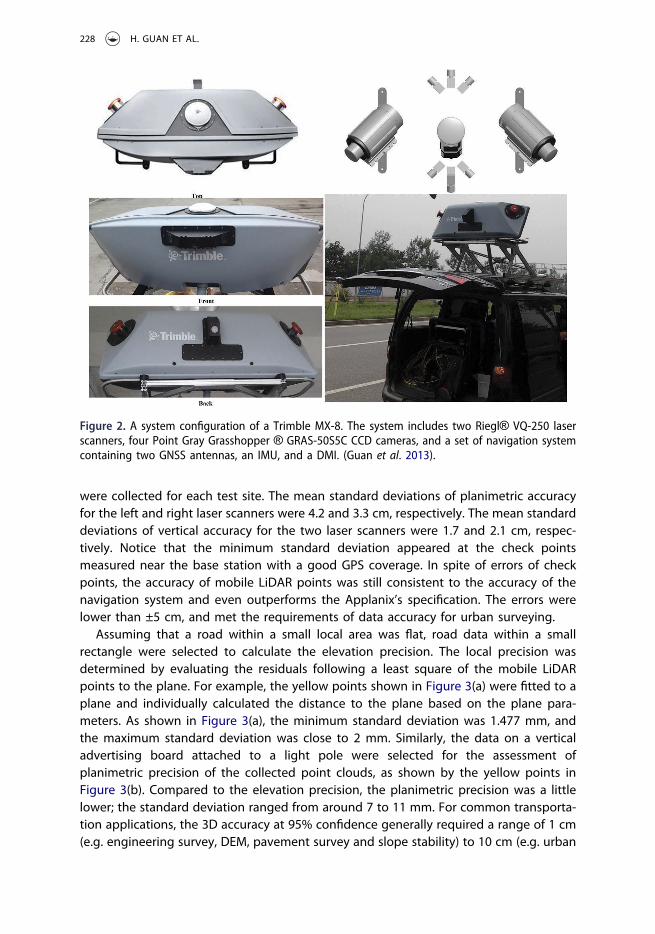
were collected for each test site. The mean standard deviations of planimetric accuracyfor the left and right laser scanners were 4.2 and 3.3 cm, respectively. The mean standarddeviations of vertical accuracy for the two laser scanners were 1.7 and 2.1 cm, respec-tively. Notice that the minimum standard deviation appeared at the check pointsmeasured near the base station with a good GPS coverage. In spite of errors of checkpoints, the accuracy of mobile LiDAR points was still consistent to the accuracy of thenavigation system and even outperforms the Applanix’s specification. The errors werelower than ±5 cm, and met the requirements of data accuracy for urban surveying.
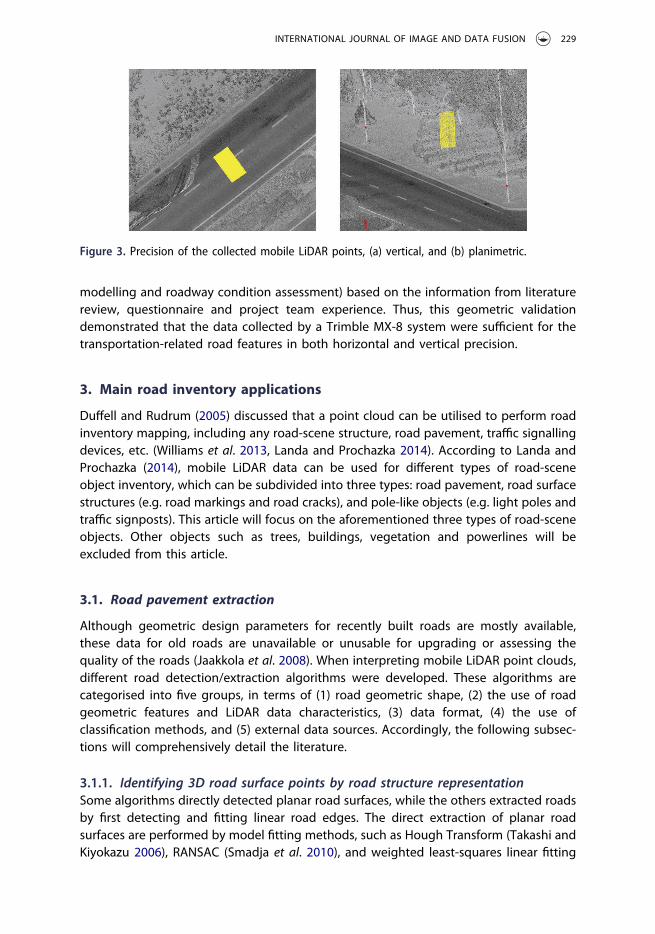
Assuming that a road within a small local area was flat, road data within a smallrectangle were selected to calculate the elevation precision. The local precision wasdetermined by evaluating the residuals following a least square of the mobile LiDARpoints to the plane. For example, the yellow points shown in Figure 3(a) were fitted to aplane and individually calculated the distance to the plane based on the plane para-meters. As shown in Figure 3(a), the minimum standard deviation was 1.477 mm, andthe maximum standard deviation was close to 2 mm. Similarly, the data on a verticaladvertising board attached to a light pole were selected for the assessment ofplanimetric precision of the collected point clouds, as shown by the yellow points inFigure 3(b). Compared to the elevation precision, the planimetric precision was a littlelower; the standard deviation ranged from around 7 to 11 mm. For common transporta-tion applications, the 3D accuracy at 95% confidence generally required a range of 1 cm(e.g. engineering survey, DEM, pavement survey and slope stability) to 10 cm (e.g. urban
Figure 2. A system configuration of a Trimble MX-8. The system includes two Riegl® VQ-250 laserscanners, four Point Gray Grasshopper ® GRAS-50S5C CCD cameras, and a set of navigation systemcontaining two GNSS antennas, an IMU, and a DMI. (Guan et al. 2013).
228 H. GUAN ET AL.
modelling and roadway condition assessment) based on the information from literaturereview, questionnaire and project team experience. Thus, this geometric validationdemonstrated that the data collected by a Trimble MX-8 system were sufficient for thetransportation-related road features in both horizontal and vertical precision.
3. Main road inventory applications
Duffell and Rudrum (2005) discussed that a point cloud can be utilised to perform roadinventory mapping, including any road-scene structure, road pavement, traffic signallingdevices, etc. (Williams et al. 2013, Landa and Prochazka 2014). According to Landa andProchazka (2014), mobile LiDAR data can be used for different types of road-sceneobject inventory, which can be subdivided into three types: road pavement, road surfacestructures (e.g. road markings and road cracks), and pole-like objects (e.g. light poles andtraffic signposts). This article will focus on the aforementioned three types of road-sceneobjects. Other objects such as trees, buildings, vegetation and powerlines will beexcluded from this article.
3.1. Road pavement extraction
Although geometric design parameters for recently built roads are mostly available,these data for old roads are unavailable or unusable for upgrading or assessing thequality of the roads (Jaakkola et al. 2008). When interpreting mobile LiDAR point clouds,different road detection/extraction algorithms were developed. These algorithms arecategorised into five groups, in terms of (1) road geometric shape, (2) the use of roadgeometric features and LiDAR data characteristics, (3) data format, (4) the use ofclassification methods, and (5) external data sources. Accordingly, the following subsec-tions will comprehensively detail the literature.
3.1.1. Identifying 3D road surface points by road structure representationSome algorithms directly detected planar road surfaces, while the others extracted roadsby first detecting and fitting linear road edges. The direct extraction of planar roadsurfaces are performed by model fitting methods, such as Hough Transform (Takashi andKiyokazu 2006), RANSAC (Smadja et al. 2010), and weighted least-squares linear fitting
Figure 3. Precision of the collected mobile LiDAR points, (a) vertical, and (b) planimetric.
INTERNATIONAL JOURNAL OF IMAGE AND DATA FUSION 229

(Yuan et al. 2010). By using Hough Transform, Takashi and Kiyokazu (2006) directlyidentified road lanes with curvature, yaw angles and offsets derived from point clouds.However, applying Hough Transform to large volumes of mobile LiDAR data is quitetime consuming and computationally intensive. Yuan et al. (2010) employed a fuzzyclustering method based on maximum entropy theory to segment points, followed by amulti-time weight least-squares linear fitting algorithm to differentiate linearly andnonlinearly distributed point segments. Similarly, these methods, which require inten-sive computations to extract roads from mobile LiDAR data, are time consuming. Smadjaet al. (2010) suggested a two-step road-surface extraction algorithm based on local roadshape. RANSAC was first applied to each scan line individually for roughly estimatingroad sides. Then, the curb candidates were picked out by a multi-frame accumulatedmap for road extraction.
To improve computational efficiency, many studies extract roads by detecting andextracting road edges (Goulette et al. 2008, Yoon and Crane 2009, McElhinney et al.2010, Ibrahim and Lichti 2012, Kumar et al. 2013, Yang et al. 2013). Yoon and Crane(2009) estimated road edges by using two criteria: slope and standard deviationcalculated from mobile LiDAR points. McElhinney et al. (2010) proposed a two-stepstrategy: (1) generation of a set of lines from points, and (2) extraction of road edgesaccording to slope, intensity, pulse width and proximity to vehicle information. Ibrahimand Lichti (2012) extracted curb edges by applying the derivatives of the Gaussianfunction to mobile LiDAR points. Based on elevation difference, point density andslope changes, Yang et al. (2013) modelled three types of curbs with a moving windowoperator.
3.1.2. Identifying 3D road surface points or point clusters using data characteristicsand road propertiesIn this category, some road detection and extraction algorithms are developed byusing different LiDAR data characteristics (e.g. point density and intensity), roadproperties (e.g. curb, minimal road width and elevation), and their combinations.Given the mobile LiDAR scanning mechanism, point density is inversely propor-tional to the scanning distance from the mobile vehicle’s trajectory. By analysingvarying point densities, Ibrahim and Lichti (2012) separated ground points fromnon-ground points. Other data characteristics include local point patterns, intensityand pulse return information (e.g. pulse width and scanning angular coordinates),height, and height-derived information (e.g. slope, height variance, mean value andheight differences). In most cases, several characteristics of a LiDAR point cloudwere combined to segment road points from the entire scanned LiDAR data(Jaakkola et al. 2008, Munoz et al. 2008, Yoon and Crane 2009, McElhinney et al.2010, Pu et al. 2011, Wang et al. 2012, Kumar et al. 2013, Fan et al. 2014, Hata et al.2014). In addition, a prior knowledge of the road of interest was widely used in theliterature. Road features include curb, minimal road width and elevation informa-tion. Guo et al. (2015) combined road width with the elevation data of point cloudsto filter out non-road surface points. Curbs are a critical feature for road extractionbecause curbs represent boundaries of roads in an urban environment. As men-tioned, some studies extracted road edges by identifying curbs (Yang et al. 2013,Guan et al. 2014a).
230 H. GUAN ET AL.

3.1.3. Identifying road surfaces from 3D raw point clouds or 2D feature imagesRoad extraction can be performed on either 3D LiDAR points (including 2D scan profiles)or 2D feature images interpreted from 3D points. Along every direction and orthogonaldirection of the scan line segment between two adjacent trajectory points, Wang et al.(2012) iteratively detected road surfaces and boundaries based on a height threshold,altitude variance and altitude mean value. Hata et al. (2014) extracted roads by applyingdifferential, distance and regression filters to 3D raw LiDAR points. To decrease compu-tational cost, trajectory data were intuitively used (Ibrahim and Lichti 2012, Wang et al.2012, Guan et al. 2014a). As reviewed, mobile LiDAR systems acquire data scan line byscan line. The spatial configuration of the scan lines depends on the setting parametersof a system, i.e. speed of the vehicle, sensor trajectory, scanner orientation, and sensormeasurement and rotation rates. The greater point density of road surface pointspermits a computational improvement in road extraction by processing scan lines(Manandhar and Shibasaki 2001, 2002, Zhao and Shibasaki 2002, Yang et al. 2013,Guan et al. 2014a). Manandhar and Shibasaki (2001) relied on the information fromindividual scan lines to classify points into roads and buildings. Based on scan lines,Zhao and Shibasaki (2002) first classified range points into the groups of vertical buildingsurface, road surface, other surface, window, tree and unknown objects. Then, anerroneous measurement was implemented to record irregular data in the windowareas. Volumetric modelling and marching cube method were exploited to modelboth surface-structured objects, e.g. building and road surfaces, and volume-structuredobjects, e.g. trees.
Several studies first segmented 3D points into line sections, on which laser datafeatures and road properties were analysed to obtain road information (Abuhadrouset al. 2004, McElhinney et al. 2010, Cabo et al. 2015, Riveiro et al. 2015). Abuhadrous et al.(2004) classified points into buildings, roads and trees by analysing two histograms inthe Z- and Y-directions in one profile to reflect the horizontal or vertical nature of urbantargets.
Converting 3D points into 2D feature images is an effective way to extract roadsurfaces from large volumes of mobile LiDAR data (Hernandez and Marcotegui 2009). Byusing the established image processing algorithms, road edges or road surfaces can bedetected and extracted efficiently. Kumar et al. (2013) applied a combination of twomodified versions of the parametric active contour or snake model to 2D elevation,reflectance and pulse width raster data, which were interpreted from the first-levelterrain pyramids using natural neighbourhood interpolation.
3.1.4. Identifying road surfaces by using road-scene classification approachesSome algorithms focus on a specific road-scene object, while others prefer to classify thewhole scene into different types of objects of interest at one time. With a mobile LiDARsystem, the collected data are a totally immersive 3D view of the objects and surroundings(Rybka 2011). Different authors proposed a plenty of automated or semi-automated algo-rithms to recognise different road features within a point cloud at one time, such as trafficsignposts, trees, building facades, road surfaces and road markings (Jaakkola et al. 2008,Munoz et al. 2008, Shen et al. 2008, Pu et al. 2011, Fan et al. 2014, Díaz-Vilariño et al. 2016).
Considering geometrical characteristics (e.g. linear structures, planar structures, freeshapes whose projections onto the ground have a specific width), Goulette et al. (2008)
INTERNATIONAL JOURNAL OF IMAGE AND DATA FUSION 231

segmented point clouds into two groups: one group containing grounds and roads,while the other group including facades and trees. Munoz et al. (2008) described anAssociative Markov Network (AMN) to roughly classify point clouds of urban roadenvironments. Then, local point distribution was proposed to label points as linear,planar or scatter structures. Finally, the post-processing step using height histogramand surface fitting was performed to obtain five classes (e.g. vegetation, wires, poles,load bearings and façades). The overall classification rate was around 90%. Fan et al.(2014) classified a point cloud into six classes (e.g. buildings, roads, vehicles, trees, polesand traffic signs) based on height histogram, point density and regular geometricfeatures. Pu et al. (2011), by using size, shape, orientation and topological relationships,automatically extracted ground surface, objects on ground and objects off ground (e.g.traffic signs, trees, building walls and barriers) within a point cloud. The authors men-tioned an 86% accuracy of pole detection and pointed out that images were required forextraction.
3.1.5. Extracting road surfaces by fusing with other data sourcesSuch as video cameras (Yu et al. 2007) and airborne laser scanning data (Boyko andFunkhouser 2011). Yu et al. (2007) created 3D surface geometric models from mobileLiDAR data with fine geometric details of cracks that are only a few centimetres widealong with the depth information. The authors claimed that the entire process requiredminimal human intervention in tuning parameters. With higher resolution 2D textureinformation, road objects, such as road distresses, were archived and analysed. Toovercome the challenges that the points from different scanners may be captured atdifferent times, in different weather conditions, under different illuminations and withdifferent sampling densities, Boyko and Funkhouser (2011) proposed a method forextracting roads from a large-scale dense point cloud merged from multiple aerial andterrestrial source scans of an urban environment. Registered the given 2D map of a roadnetwork with the input 3D point clouds, a map spline was first created and then splitinto independent parts, road patches. Accordingly, a sub-cloud of relevant points foreach road patch was calculated to a ribbon snake by optimising an active contour thataims to maintain the smoothness of its boundary while fitting its boundary to likelypredictions in the attractor map. Finally, for each individual sub-cloud, the points thatfall inside the active contour were labelled road points.
3.2. Road surface structures
Recently, mobile LiDAR intensity data have been explored to detect other road-surfacefeatures, such as highly reflective road markings (Jaakkola et al. 2008, Toth et al. 2008;Vosselman 2009, Smadja et al. 2010, Yang et al. 2012a, Guan et al. 2014a) and evenilluminated structures (e.g. manholes and sewer wells (Yu et al. 2014a, 2015c), tunnelsand culverts (Puente et al. 2014, Lin and Hyyppä 2010).
Road markings on paved roadways, as critical features in traffic management systems,have important functions in providing guidance and information to drivers and pedes-trians. For example, driver-assistance systems require reliable environmental perception toimprove traffic safety by informing motorists and preventing accidents. Along with pave-ment condition and road topography, the visibility of road markings is a key element in
232 H. GUAN ET AL.

accidents where the road itself is the cause. Especially, in highly populated urban envir-onments, high accident rates are caused by the absence of clearly presented road signals(Carnaby 2005). Road markings are highly retro-reflective surfaces painted on roads;reflectance of the target in the form of intensity can be used to identify road markings(Chen et al. 2009, Mancini et al. 2012, Guo et al. 2015, Riveiro et al. 2015).
Most researchers segmented road markings from 2D feature images converted from3D points. Based on semantic knowledge (e.g. shape and size) of road markings (Yanget al. 2012b), the established image processing algorithms were applied, such as thresh-olding-based segmentation, Hough Transform, morphology and Multi-Scale TensorVoting (MSTV) (Jaakkola et al. 2008, Chen et al. 2009, Vosselman 2009, Smadja et al.2010, Mancini et al. 2012, Guo et al. 2015, Riveiro et al. 2015, Guan et al. 2015b). The useof Hough transformation for road marking extraction is weakened by specifying thenumber of road markings to be detected, which is a limiting factor for complex types ofroad markings such as hatchings and words. To overcome intensity inconsistency causedby scanning pattern, multiple thresholding methods were researched by defining therelationship between scanning distances with intensity values (Vosselman 2009, Guanet al. 2014a). Guan et al. (2014a) dynamically extracted road markings with multiplethresholds that corresponded to different ranges determined by appropriate point-density normality, followed by a morphological closing operation with a linear structur-ing element. The extracted road markings are shown in Figure 4. Guan et al. (2015b)achieved a further improvement in road marking extraction by using multi-scale tensorvoting (MSTV). The MSTV algorithm had an advanced capability to efficiently suppresshigh-level noise and infer perceptual structures from noisy or corrupted data. Yu et al.(2015a) emphasised an automated road marking extraction from 3D mobile LiDAR pointclouds rather than the derived feature images. After road marking segmentation, the
Figure 4. The extracted road markings overlaid on the geo-referenced intensity images: (a) Huandaoand (b) ICEC data sets (Guan et al. 2014a).
INTERNATIONAL JOURNAL OF IMAGE AND DATA FUSION 233
authors dealt with large-size markings based on trajectory and curb-lines, and small-sizemarkings based on deep learning and principal component analysis (PCA). Within pointclouds, the authors finally classified road markings into boundary lines, stop lines,rectangular markings, pedestrian markings, arrow markings, zebra crossing lines andcentrelines.
Pavement manholes provide access to conduits that are used to conduct rainwater,drainage, steam, natural gas and other utility networks including telecommunicationwires and power cables. It is one of the key elements in urban environment thatensures quality of life, economic prosperity and national security (Pikus 2006).Manholes are usually covered with metal or concrete covers, resulting in the retro-reflective differences between manhole covers and road surfaces in the near-infraredspectrum. Due to manhole covers being located on road surfaces, several manholecover extraction algorithms were performed on 2D raster data interpolated from 3Dmobile LiDAR points. Guan et al. (2014b) extracted manhole covers by applyingdistance-dependent thresholding, multi-scale tensor voting and morphological opera-tions to the interpolated feature images. Similarly, Yu et al. (2015c) developed asupervised deep learning model to depict high-order features of local image patches,and a random forest model to locate urban road manhole covers. In Yu et al. (2014a),marked point processes were proposed to detect circular-shaped and rectangular-shaped manhole covers from mobile LiDAR point clouds. To further precisely locatemanhole covers, Ji et al. (2012) developed a new method combined with multi-viewmatching and feature extraction techniques by using close-range images and mobileLiDAR data.
In addition to providing a high promising solution to the extraction of road markingsand manhole covers, mobile LiDAR data might be a valuable data source for estimatingpavement distresses, which can be caused by fractures due to excessive loading, fatigue,thermal changes, moisture damage, slippage or contraction. Based on the visual appear-ance of cracks in the near-infrared range usually darker than that of the normal roadsurface, Guan et al. (2015a), developed a multi-scale tensor voting (MSTV) strategy toextract curvilinear pavement cracks. The authors indicated that pavement cracks wererecognised with the average scoring measure (SM) value of 91.5.
3.3. Pole-like objects
Utility poles, traffic signs and lamp posts can be considered as an important part of roadinfrastructure. Mobile LiDAR technology has been widely used to detect these pole-likeobjects and tree trunks (Manandhar and Shibasaki 2001, Chen et al. 2007, Hofmann andBrenner 2009, Jaakkola et al. 2010, Lehtomäki et al. 2010, Yokoyama et al. 2013).
Based on eigenvalue analysis, principal component analysis (PCA) was a widely usedmethod for detecting pole-like objects from irregular point clouds (Yokoyama et al.2011, 2013). These PCA-based methods detect linear pole-like structures by first con-structing a covariance matrix for each point with its neighbours and then analysingeigenvalues decomposed from the covariance matrix (El-Halawany and Lichti 2011).Eigenvalue-based PCA methods show high computational efficiency. However, otherobjects (particularly tree trunks) in a road scene might cause a considerable number offalse alarms.
234 H. GUAN ET AL.
Traffic signs in point clouds are shown by retro-reflectively painted planar objects.Chen et al. (2009) explored intensity information of mobile LiDAR data to detect trafficsigns and lane markings. The intensity is a measure of the retro-reflectivity property ofthe scanned surfaces (Riveiro et al. 2016).
Shape and context features were also widely used in pole-like object detectionmethods (Teo and Chie 2016). Shape features were characterised based on height,number and types of attached part segments (Yang and Dong 2013); whereas contextfeatures were computed based on surrounding distributions (Yokoyama et al. 2013, Yuet al. 2014b). For example, in Yu et al. (2015b), a pairwise 3D shape context descriptor,which considered both local and global similarity measures, was proposed to detect lightpoles. Pole-like objects in 3D mobile LiDAR point clouds show circular-shaped structuresat the top-down view. Therefore, point clouds are horizontally sectioned into a numberof profiles, on each of which approximate circles or eclipses are detected as pole-likecandidates. Kukko et al. (2009) and Lehtomäki et al. (2010) clustered scan lines in a localneighbourhood to detect pole-like objects profile by profile. Brenner (2009a, 2009b)investigated local upright patterns and Z-directional extension of a pole, and thenextracted the pole structures in stacks of hollow cylinders. Pu et al. (2011) developed apercentile-based method with respect to shape, height and size of light poles. Puttonenet al. (2013) integrated a different distance sensitive sampling method into the methodproposed by Lehtomäki et al. (2010). With the prior knowledge of pole-like objects inshape and size, by using grammar rules, a voxel structure (that is a volumetric cubic unit)was applied to mobile LiDAR data (Cabo et al. 2014). For each voxel, Cabo et al. (2014)considered only the coordinates of the centroids and the number of points to reduce theoriginal point cloud. After voxelisation, 2D analysis was performed by the following threestages: (1) segmentation of the connected horizontal elements, (2) selection of elementsby a maximum area criterion and (3) selection of elements by an isolation criterion.Finally, a 3D neighbourhood analysis was used to detect pole-like street furnitureobjects. Pole-like objects were extracted by analysing scan lines, rather than raw pointclouds (Chen et al. 2007, Kukko et al. 2009, Lehtomäki et al. 2010, Hu et al. 2011).Manandhar and Shibasaki (2001) detected vertical poles by extracting vertical linesegments from individual scan lines. To improve computational efficiency, some studieswere performed on 2D feature images (El-Halawany and Lichti 2013). Point density in 2Dfeature images was also exploited to detect light poles (Chen et al. 2007).
Moreover, mobile LiDAR systems can provide high-density point clouds at a normalvehicle speed. In the vertical direction, pole-like objects contain more points than otherobjects such as road surfaces (Yan et al. 2016). Golovinskiy et al. (2009) presented a step-wise urban feature (including poles) recognition method. First, point density wasexplored to select potential objects. Next, the candidate objects were separated fromthe background, and they were characterised according to their spatial context andconfiguration. Finally, the features were classified by comparing their characterisationwith the labelled data from a training data set.
4. Current challenges and future trend
The literature review reveals that Mobile LiDAR offers a huge potential for road informa-tion inventory, mainly due to its improved safety, efficiency, flexibility and data
INTERNATIONAL JOURNAL OF IMAGE AND DATA FUSION 235
reusability. More importantly, mobile LiDAR, as an active remote-sensing technology,provides highly accurate point clouds with high point density. However, several chal-lenges exist when implementing mobile LiDAR data in road-related applications. Futuretrends will emerge accordingly.
Although mobile LiDAR has been commercially available for one decade, few stan-dards have been developed when using mobile LiDAR for carrying out road inspectionsalong the route corridor. Thus, in the foreseeable future, a consistent guideline isurgently required to standardise the adoption of mobile LiDAR by transportation agen-cies. Standards and best practices, such as control requirements, accuracy standards,data interoperability and management, and data quality needs of specific applications,will be established and developed for various road inventory-related applications. As aresult, experienced geomatics personnel can be involved throughout the entire processwhen using mobile LiDAR technology for road inventory.
Note that mobile LiDAR technology will certainly not replace current conventionalmethods of topographic data collection. The mobile LiDAR data, in most cases, mayneed to be supplemented by data collected from conventional surveying, GNSS, aerial/UAV photogrammetry and airborne LiDAR (Gordon 2010). Accordingly, integration ofmobile LiDAR data with other data sources for road inventory is greatly needed to usethe complementary characteristics of these data sets.
The data set size and data complexity are considered as significant challenges. Hardwaremanufactures continue to build advanced mobile LiDAR systems. For example, the RIEGLVMX-250 system, which can collect 0.5 million points per second, was developed into thecurrent RIEGL VMX-450 system that collects 1.1 million points per second. A RIEGL VMX-250system collects data up to a total of 120 Gigabytes (including 40 Gigabytes image files and80 Gigabytes LiDAR point clouds) in one hour at the speed of 40–45 km/h. The size andcomplexity of mobile LiDAR data require upgrading not only the entire computing infra-structure (software, workstations, servers, data storage and network backbone) but alsodata post-processing packages for road-information extraction. Data post-processing is thekey to a complete solution for the end-users (e.g. transportation engineers/agencies)because they are less interested in the actual point cloud data than in the computer-aided model (CAD) formatted geometric road information. Manually processing largevolumes of mobile LiDAR data for road-information extraction is very time consuming.To process the entire data set efficiently, most current software packages adopt thecommon strategy, where the data are subsampled or segmented into small tiles/sections.In addition, the majority of existing methods developed for performing road inventory areof high computational complexity. Effective object recognition methods will be required toperform road geometry and road physical data in a timely manner. Furthermore, consider-ing the object recognition in mobile LiDAR data, multiple attributes including elevation,intensity pulse width, range, incident angle and multiple echo information can be exploredfor extracting road features.
Currently, the advanced third-party point-cloud post-processing software includesLeica Cyclone®, InnovMetric PolyWorks®, GeoCue software suite, TerraSolid softwaresuite, PHOCAD PHIDIAS®, Bentley Pointools, and Virtual Geomatics software suite (Yenet al. 2011). Most third-party software packages deal with small volumes of 3D points orinvolve one or several steps when processing mobile LiDAR data. Multiple softwarepackages have to work together to obtain the CAD-formatted deliverables, such as road
236 H. GUAN ET AL.

centrelines and road markings. To avoid the loss of essential information when inter-polating mobile LiDAR data, seamless integration of the third-party software packages isurgently needed. Furthermore, a common data exchange platform should be consideredfor transportation agencies to improve data interoperability.
5. Conclusions
Roads play a vital role in people’s daily lives in all countries because it brings peopletogether for business or pleasure by connecting small and large cities, urban and ruralcommunities, as well as connecting a country with its neighbours to enable the safemovement of goods, people and services. To safely keep people on the move, transporta-tion departments in cities or countries have to periodically perform road surveys. Thedocumentation of road features includes both road surface geometry (e.g. lane width,number of lanes, longitudinal slopes and transverse slopes) and road environment (e.g.road markings, pavement cracks, street signs, trees, vegetation and traffic light poles). Thesurveyed data are used not only for transportation departments to maintain, rehabilitateand reconstruct the current roadways and bridges, and to manage traffic and parkinginfrastructure, but also for administration to assess policies and practices affecting roadways.A mobile LiDAR system, mounted on the top of a vehicle, captures virtually anything visibleto the eyes in the form of 3D point clouds with real-world coordinates, thereby providingaccurate 3D geospatial information of roadways. To date, the feasibility of mobile LiDARtechnology for road surveys has been proven for safety, cost, efficiency and data confidence.Given these mobile LiDAR systems’ advantages, as mentioned in most reports, researcharticles, presentations at conferences or short web articles, a growing number of transporta-tion agencies have been considering mobile LiDAR for road information inventory.
In this work, a review of the ability of mobile LiDAR systems to road informationinventory was described. This review includes a discussion of system configuration,direct geo-referencing and the analysis of data quality, and current road-scene applica-tions. The main distinction produced by the review identifies that the systems are idealfor road information inventory and transportation-related applications.
Mobile LiDAR systems are gaining widespread acceptance with time. With the contin-uous advancement of mobile LiDAR technology, as well as the reduced costs of systemdevelopment, it can be expected that both mobile LiDAR technologies and data processingtechniques will be further explored in road information inventory. The literature reviewreveals that studies on mobile LiDAR technology as a reliable and cost-effective alternativeis worthwhile for carrying out road inspections along the route corridor.
Disclosure statement
No potential conflict of interest was reported by the authors.
Funding
This work was supported by the National Natural Science Foundation of China [grant number41501501]; Natural Science Foundation of Jiangsu Province [grant number BK20151524].
INTERNATIONAL JOURNAL OF IMAGE AND DATA FUSION 237

References
Abuhadrous, A., et al., 2004. Digitizing and 3D modeling of urban environments and roads usingvehicle borne laser scanner system. In: 2004 IEEE/RSJ international conference on intelligentrobots and systems, 28 September–2 October 2004, Sendai. IEEE, 76–81.
Aijazi, A., Checchin, P., and Trassoudaine, L., 2013. Segmentation based classification of 3d urbanpoint clouds: a super-voxel based approach with evaluation. Remote Sensing, 5, 1624–1650.doi:10.3390/rs5041624
Barber, D., Mills, J., and Smith-Voysey, S., 2008. Geometric validation of a ground-based mobilelaser scanning system. ISPRS Journal of Photogrammetry and Remote Sensing, 63, 128–141.doi:10.1016/j.isprsjprs.2007.07.005.
Beraldin, J., Blais, F., and Lohr, U., 2010. Laser scanning technology. In: G. Vosselman and H. Mass,eds. Airborne and terrestrial laser scanning. Caithness: Whittles Publishing, 1–42.
Bertozzi, M., et al., 1997. Obstacle and lane detection on the ARGO autonomous vehicle. In:Proceedings of IEEE intelligent transportation systems conference, 10–13 November, Boston, MA.IEEE, 1010–1015.
Boyko, A. and Funkhouser, T., 2011. Extracting roads from dense point clouds in large scale urbanenvironment. ISPRS Journal of Photogrammetry Remote Sensing, 66, S2–S12. doi:10.1016/j.isprsjprs.2011.09.009
Brenner, 2009a. Global localization of vehicles using local pole patterns. In: Proceedings of theDAGM 2009, 31st annual symposium of the German association for pattern recognition, SpringerLNCS 5748. Berlin: Springer, 61–70.
Brenner, 2009b. Extraction of features from mobile laser scanning data for future driver assistancesystems. In: M. Sester, et al., eds. Advances in GIScience. Lecture Notes in Geoinformation andCartography. Berlin: Springer, 25–42.
Bruton, A.M., 2000. Improving the accuracy and resolution of SINS/DGPS airborne gravimetry. Thesis(PhD). University of Calgary, UCGE Report #20145.
Cabo, C., García Cortés, S., and Ordoñez, C., 2015. Mobile Laser Scanner data for automatic surfacedetection based on line arrangement. Automation in Construction, 58 (2015), 28–37. doi:10.1016/j.autcon.2015.07.005
Cabo, C., et al., 2014. An algorithm for automatic detection of pole-like street furniture objectsfrom mobile laser scanning point clouds. ISPRS Journals of Photogrammetry and Remote Sensing,87, 47–56. doi:10.1016/j.isprsjprs.2013.10.008
Carnaby, B., 2005. Poor road markings contribute to crash rates. In: Australasian road safetyresearch policing education conference, 14–16 November 2005 Wellington, CD-ROM (CD401).
Chen, X., Stroila, M., and Wang, R., 2009. Next generation map marking: geo-referenced ground-level LiDAR point clouds for automatic retro-reflective road feature extraction. In: 17th ACMSIGSPATIAL international conference on advances in geographic information system, 4–6November 2009 Seattle, WA, (on CD-ROM).
Chen, Y., Zhao, H., and Shibasaki, R., 2007. A mobile system combining laser scanners and camerasfor urban spatial objects extraction. In: Proceedings of IEEE conference on machine learning andcybernetics, 19–22 August, Hong Kong, 3. IEEE, 1729–1733.
Díaz-Vilariño, L., et al., 2016. Automatic classification of urban pavements using mobile LiDAR dataand roughness descriptors. Construction and Building Materials, 102 (2016), 208–215.doi:10.1016/j.conbuildmat.2015.10.199
Dickmanns, E. and Mysliwetz, B., 1992. Recursive 3-D road and relative ego-state recognition. IEEETransactions on Pattern Analysis and Machine Intelligence, 14 (2), 199–213. doi:10.1109/34.121789
Duffell, C.G. and Rudrum, D.M., 2005. Remote sensing techniques for highway earthworks assess-ment. In: Proceedings of GeoFrontiers 2005, 24–26 January, Austin, TX. American Society of CivilEngineers (ASCE), 1–13.
DYNASCAN MDL, 2016. Homepage of the company MDL laser systems [online]. Available from:http://www.mdl.co.uk [Accessed 4 January 2016].
238 H. GUAN ET AL.
El-Halawany, S.I. and Lichti, D.D., 2011. Detection of road poles from mobile terrestrial laserscanner point cloud. In: Proceedings of international workshop multi-platform/multi-sensor remotesensing mapping, 10–12 January, Xiamen. IEEE, 1–6.
El-Halawany, S.I. and Lichti, D.D., 2013. Detecting road poles from mobile terrestrial laser scanningdata. Geosciences & Remote Sensing, 50 (6), 704–722.
Fan, H., Yao, W., and Tang, L., 2014. Identifying man-made objects along urban road corridors frommobile lidar data. IEEE Geoscience and Remote Sensing Letters, 11 (5), 950–954. doi:10.1109/LGRS.2013.2283090
Faro, 2016. Homepage of the company FARO laser scanner focus3D [online]. Available from: http://www.faroasia.com/home/CN/ [Accessed 4 January 2016].
Glennie, C., 2007. Rigorous 3D error analysis of kinematic scanning LIDAR systems. Journal ofApplied Geodesy, 1 (2007), 147–157. doi:10.1515/jag.2007.017
Glennie, C., 2009. Kinematic terrestrial light-detection and ranging system for scanning.Transportation Research Record, 2105, 135–141. doi:10.3141/2105-17
Glennie, C., et al., 2013. Compact multipurpose mobile laser scanning system-initial tests andresults. Remote Sensing, 5, 521–538. doi:10.3390/rs5020521
Golovinskiy, V.K. and Funkhouser, T., 2009. Shape-based recognition of 3d point clouds in urbanenvironments. In: Proceedings of IEEE 12th international conference on computer vision, 27September–4 October, Kyoto. IEEE, 2154–2161.
Gordon, P., 2010. 3D scanning: high-definition mobile mapping. Professional Surveyor Magazine.[Accessed 4 March 2016].
Goulette, F., et al., 2008. An integrated on-board laser range sensing system for on-the-way cityand road modelling [Unformatted CD-ROM]. In: International archives of the photogrammetry,remote sensing and spatial information sciences, ISPRS, 34 (Part XXX). Göttingen: CopernicusPublications.
Guan, H., Li, J., and Yu, Y., 2013. 3D urban mapping using a Trimble MX8 mobile laser scanningsystem: a validation study. In: MMT 2013, 1–3 May 2013 Taiwan
Guan, H., et al., 2014a. Using mobile laser scanning data for automated extraction of roadmarkings. ISPRS Journal of Photogrammetry & Remote Sensing, 87, 93–107. doi:10.1016/j.isprsjprs.2013.11.005
Guan, H., et al., 2014b. Automated extraction of manhole covers using mobile LiDAR data. RemoteSensing Letters, 5 (12), 1042–1050. doi:10.1080/2150704X.2014.994716
Guan, H., et al., 2015a. Iterative tensor voting method for crack detection using mobile laserscanning data. IEEE Transactions on Geoscience & Remote Sensing, 53 (3), 1527–1537.doi:10.1109/TGRS.2014.2344714
Guan, H., et al., 2015b. Using mobile LiDAR data for rapidly updating road markings. IEEETransactions on Intelligence Transportation Systems, 16 (5), 2457–2465. doi:10.1109/TITS.2015.2409192
Guo, J., Tsai, M., and Han, J., 2015. Automatic reconstruction of road surface features by usingterrestrial mobile lidar. Automation in Construction, 58 (2015), 165–175. doi:10.1016/j.autcon.2015.07.017
Haala, N., et al., 2008. Mobile lidar mapping for urban data capture. In: M. Loannides, et al., eds.14th international conference on virtual systems and multimedia, 20–26 October, Limassol. VirtualSystems and Multimedia Society, 95–100.
Hata, A.Y., Osorio, F.S., and Wolf, D.F., 2014. Robust curb detection and vehicle localization in urbanenvironments. In: 2014 IEEE intelligent vehicles symposium (IV), 8–11 June 2014 Dearborn, MI.
Hernandez, J. and Marcotegui, B., 2009. Filtering artifacts and pavement segmentation frommobile LiDAR data. In: Bretar, et al., eds. Laserscanning – IAPRS 2009, 1–2 September, Paris.ISPRS, XXXVIII (Part3/W8), 329–333.
Hofmann, S. and Brenner, C., 2009. Quality assessment of automatically generated feature maps forfuture driver assistance systems. In: Proceedings of the 17th ACM SIGSPATIAL international conferenceon advances in geographic information systems, 4–6 November 2009 Seattle, WA. ACM, 500–503.
Hu, Y., et al., 2011. A novel approach to extracting street lamps from vehicle-borne laser data. In:Proceedings of IEEE conference on geoinformatics, 24–26 June, Shanghai. IEEE, 1–6.
INTERNATIONAL JOURNAL OF IMAGE AND DATA FUSION 239
Iavarone, A., 2007. Feature: terrestrial LiDAR goes mobile. Professional Surveyor Magazine.[Accessed 4 January 2016].
Ibrahim, S. and Lichti, D., 2012. Curb-based street floor extraction from mobile terrestrial LiDARpoint cloud. ISPRS Archives, 39 (Part B5), 193–198.
Jaakkola, A., et al., 2008. Retrieval algorithms for road surface modelling using laser-based mobilemapping. Sensors, 8, 5238–5249. doi:10.3390/s8095238
Jaakkola, A., et al., 2010. A low-cost multi-sensoral mobile mapping system and its feasibility fortree measurements. ISPRS Journal of Photogrammetry and Remote Sensing, 65, 514–522.doi:10.1016/j.isprsjprs.2010.08.002
Jacobs, G., 2005. Uses in transportation in high-definition surveying: 3D laser scanning. ProfessionalSurveyor Magazine, vol. April.
Ji, S., Shi, Y., and Shi, Z., 2012. Manhole cover detection using vehicle-based multi-sensor data.ISPRS Archives, 25 August–1 September 2012 Melbourne, Australia, 39 (B3), 281–284.
Kukko, A., et al., 2009. Mobile mapping system and computing methods for modeling ofroad environment. In: Proceedings of urban remote sensing event, 20–22 May, Shanghai.IEEE, 1–6.
Kumar, P., et al., 2013. An automated algorithm for extracting road edges from terrestrial mobileLiDAR data. ISPRS Journal of Photogrammetry and Remote Sensing, 85 (2013), 44–55. doi:10.1016/j.isprsjprs.2013.08.003
Landa, J. and Prochazka, D., 2014. Automatic road inventory using LiDAR. Procedia Economics andFinance, 12, 363–370. doi:10.1016/S2212-5671(14)00356-6
Lehtomäki, M., et al., 2010. Detection of vertical pole-like objects in a road environment usingvehicle-based laser scanning data. Remote Sensing, 2, 641–664. doi:10.3390/rs2030641
Leica, 2016. Homepage of the company [online]. Available from: http://hds.leica-geosystems.com/en/HDS-Laser-Scanners-SW_5570.htm [Accessed 4 January 2016].
Lemmens, M., 2011. Geo-information: technology, applications and the environment.Geotechnologies and the Environment Series, 5, 101–121.
Lichti, D., 2010. Terrestrial laser scanner self-calibration: correlation sources and their mitigation.ISPRS Journal of Photogrammetric and Remote Sensing, 65, 93–102. doi:10.1016/j.isprsjprs.2009.09.002
Lim, S., et al., 2013. Accuracy assessment of a mobile terrestrial lidar survey at Padre IslandNational Seashore. International Journal of Remote Sensing, 34 (18), 6355–6366. doi:10.1080/01431161.2013.800658
Lin, Y. and Hyyppä, J., 2010. Geometry and intensity based culvert detection in mobile laserscanning point clouds. Journal of Applied Remote Sensing, 4, 043553. doi:10.1117/1.3518442
Liu, Z., Wang, J., and Liu, D., 2013. A new curb detection method for unmanned ground vehiclesusing 2d sequential laser data. Sensors, 13, 1102–1120. doi:10.3390/s130101102
Manandhar, D. and Shibasaki, R., 2002. Auto-extraction of urban features from vehicle-borne laserdata. ISPRS Archives, 34 (Part 4), 650–655.
Manandhar, D. and Shibasaki, R., 2001. Feature extraction from range data. In: Proceedings of the22nd Asian conference on remote sensing, 5–9 November 2001, Singapore.
Mancini, A., Frontoni, E., and Zingaretti, P., 2012. Automatic road object extraction from mobilemapping systems. In: Conference: Proceedings of 2012 8th IEEE/ASME International Conference onMechatronic and Embedded Systems and Applications, 8–10 July 2012 Suzhou.
McElhinney, C.P., et al., 2010. Initial results from European road safety inspection (EURSI) mobilemapping project. ISPRS Archives, 38 (Part 5), 440–445.
Munoz, D., Vandapel, N., and Hebert, M., 2008. Directional associative Markov network for 3-dpoint cloud classification. In: 4th international symposium on 3D data processing, visualizationand transmission, 18–20 June 2008 Atlanta, GA.
Olsen, M.J., et al., 2013. Guidelines for the use of mobile LIDAR in transportation applications.Washington, DC: TRB, p. 250 (TRB NCHRP Final Report 748).
Optech Lynx, 2016. Homepage of the company Optech. Available from: http://www.teledyneoptech.com/index.php/products/mobile-survey/ [Accessed 4 January 2016].
240 H. GUAN ET AL.
Petrie, G. and Toth, C., 2008. Introduction to laser ranging, profiling, and scanning. In: J. Shan andC.K. Toth, eds. Topographic laser ranging and scanning: principles and processing. Boca Raton, FL:CRC Press, Taylor & Francis Group, 1–27.
Pikus, I.M., 2006. Manhole security: protecting America’s critical underground infrastructure. WhitePaper, 2006. Washington, DC: National Strategies, Inc.
Pomerleau, D. and Jochem, T., 1996. Rapidly adapting machine vision for automated vehiclesteering. IEEE Expert, 11, 19–27. doi:10.1109/64.491277.
Pu, S., et al., 2011. Recognizing basic structures from mobile laser scanning data for road inventorystudies. ISPRS Journal of Photogrammetry and Remote Sensing, 66 (6), S28–S39. doi:10.1016/j.isprsjprs.2011.08.006
Puente, I., et al., 2013a. Review of mobile mapping and surveying technologies. Measurement, 46,2127–2145. doi:10.1016/j.measurement.2013.03.006
Puente, I., et al., 2013b. Accuracy verification of the Lynx Mobile Mapper system. Optics & LaserTechnology, 45, 578–586. doi:10.1016/j.optlastec.2012.05.029
Puente, I., et al., 2014. Automatic detection of road tunnel luminaires using a mobile LiDAR system.Measurement, 47 (1), 569–575. doi:10.1016/j.measurement.2013.09.044
Puttonen, I., et al., 2013. Improved sampling for terrestrial and Mobile Laser Scanner point clouddata. Remote Sensing, 5 (4), 1754–1773. doi:10.3390/rs5041754
Rieger, P., et al., 2010. Boresight alignment method for mobile laser scanning systems. Journal ofApplied Geodesy, 4 (1), 13–21. doi:10.1515/jag.2010.002
RIEGL, 2016. Homepage of the company RIEGL laser measurement systems GmbH. Available from:http://www.riegl.com/ [Accessed 4 January 2016].
Riveiro, B., et al., 2016. Automatic segmentation and shape-based classification of retro-reflectivetraffic signs from mobile lidar data. IEEE Journal of Selected Topics in Applied Earth Observationsand Remote Sensing. doi:10.1109/JSTARS.2015.2461680.
Riveiro, B., et al., 2015. Automatic detection of zebra crossings from mobile LiDAR data. Optical &Laser Technology, 70 (2015), 63–70. doi:10.1016/j.optlastec.2015.01.011
Rybka, R., 2011. Autodesk and Bentley systems talk about mobile LiDAR. LiDAR, 1 (2), 41–44.Shen, Y., et al., 2008. Feature extraction from vehicle-borne laser scanning data [Unformatted CD-
ROM]. In: International conference on earth observation data processing and analysis (ICEODPA),30 December 2008 Wuhan. SPIE, 7285.
Sick, 2016. Homepage of the Company SICK laser scanners. Available from: http://www.sick.com/group/EN/home/products/product_portfolio/optoelectronic_protective_devices/Pages/safetylaserscanners_s3000.aspx [Accessed 4 January 2016].
Smadja, L., Ninot, J., and Gavrilovic, T., 2010. Road extraction and environment interpretation fromLidar sensors. ISPRS Achieves, 38, 281–286.
Stauth, D. and Olsen, M., 2013. Mobile LiDAR technology expanding rapidly [online]. Available from:http://oregonstate.edu/ua/ncs/archives/2013/mar/mobile-lidar-technology-expanding-rapidly[Accessed 4 January 2016].
Takashi, O. and Kiyokazu, T., 2006. Lane recognition using on-vehicle LIDAR. In: IEEE intelligentvehicle symposium, 13–15 June, Tokyo. IEEE, 540–545.
Teo, T. and Chiu, C., 2016. Pole-Like road object detection from mobile lidar system using a coarse-to-fine approach. IEEE Journal of Selected Topics in Applied Earth Observations and RemoteSensing, doi:10.1109/JSTARS.2015.2467160.
Toth, C., 2009. R&D of mobile lidar mapping and future trends [Unformatted CD-ROM]. In: ASPRSannual conference, 9–13 March, Baltimore, MD. ASPRS.
Toth, C., Paska, E., and Brzezinska, D., 2008. Using road pavement markings as good control forlidar data. ISPRS Archives, 37 (B1), 189–196.
Trimble, 2016. Homepage of the company trimble 3D laser scanning. Available from: http://www.trimble.com/3d-laser-scanning/index.aspx [Accessed 4 January 2016].
Tsogas, M., et al., 2011. Combined lane and road attributes extraction by fusing data from digitalmap, laser scanner and camera. Information Fusion, 12, 28–36. doi:10.1016/j.inffus.2010.01.005
Velodyne, 2016. Homepage of the Company Velodyne LiDAR systems. Available from: http://velodynelidar.com/ [Accessed 4 January 2016].
INTERNATIONAL JOURNAL OF IMAGE AND DATA FUSION 241

Vosselman, G., 2009. Advanced point cloud processing. In: Photogrammetric Week’09, 3 July,Heidelberg. ISPRS, 137–146.
Wang, H., et al., 2012. Automatic road extraction from mobile laser scanning data. In: Internationalconference on computer vision in remote sensing (CVRS), 16–18 December 2012 Xiamen, China.
Williams, K., et al., 2013. Synthesis of transportation applications of mobile LiDAR. Remote Sensing,5, 4652–4692. doi:10.3390/rs5094652
Yan, W., et al., 2016. Automatic extraction of highway light poles and towers from mobile LiDARdata. Optics & Laser Technology, 77, 162–168.
Yang, B. and Dong, Z., 2013. A shape-based segmentation method for mobile laser scanning pointclouds. ISPRS Journal of Photogrammetry and Remote Sensing, 81, 19–30. doi:10.1016/j.isprsjprs.2013.04.002
Yang, B., Fang, L., and Li, J., 2013. Semi-automated extraction and delineation of 3D roads of streetscene from mobile laser scanning point clouds. ISPRS Journal of Photogrammetry and RemoteSensing, 79 (2013), 80–93. doi:10.1016/j.isprsjprs.2013.01.016
Yang, B., et al., 2012a. Automated extraction of road markings from mobile lidar point clouds.Photogrammetric Engineering & Remote Sensing, 78 (4), 331–338. doi:10.14358/PERS.78.4.331
Yang, B., et al., 2012b. Automated extraction of street-scene objects from mobile lidar point clouds.International Journal of Remote Sensing, 33 (18), 5839–5861. doi:10.1080/01431161.2012.674229
Yen, K.S., Ravani, B., and Lasky, T.A., 2011. LiDAR for data efficiency, Washington State Department ofTransportation [online]. Available from: http://www.wsdot.wa.gov/research/reports/fullreports/778.1.pdf [Accessed 4 January 2016].
Yokoyama, H., et al., 2011. Pole-like objects recognition from mobile laser scanning data usingsmoothing and principal component analysis. ISPRS Archives, 38 (Part 5/W12), 115–120.
Yokoyama, H., et al., 2013. Detection and classification of pole-like objects from mobile laserscanning data of urban environments. International Journal of CAD/CAM, 13 (2), 31–40.
Yoon, J. and Crane, C.D., 2009. Evaluation of terrain using LADAR data in urban environment forautonomous vehicles and its application in the DARPA urban challenge. In: Proceedings ofICROS-SICE international joint conference, 18–21 August, Fukuoka. SICE, 641–646.
Yu, S., et al., 2007. 3D reconstruction of road surfaces using an integrated multi-sensory approach.Optics and Lasers in Engineering, 45, 808–818. doi:10.1016/j.optlaseng.2006.12.007
Yu, Y., et al., 2014a. Automated detection of road manhole and sewer well covers from mobile lidarpoint clouds. IEEE Geoscience and Remote Sensing Letters, 11 (9), 1549–1553. doi:10.1109/LGRS.2014.2301195
Yu, Y., et al., 2014b. Pairwise three-dimensional shape context for partial object matching andretrieval on mobile laser scanning data. IEEE Geoscience and Remote Sensing Letters, 11 (5),1019–1023. doi:10.1109/LGRS.2013.2285237
Yu, Y., et al., 2015a. Learning hierarchical features for automated extraction of road markings from3d mobile lidar point clouds. IEEE Journal of Selected Topics on Applied Earth Observations andRemote Sensing, 8 (2), 709–726. doi:10.1109/JSTARS.2014.2347276
Yu, Y., et al., 2015b. Semiautomated extraction of street light poles from mobile LiDAR point-clouds. IEEE Transactions on Geosciences & Remote Sensing, 53 (3), 1374–1386. doi:10.1109/TGRS.2014.2338915
Yu, Y., Guan, H., and Ji, Z., 2015c. Automated detection of urban road manhole covers usingmobile laser scanning data. IEEE Transactions on Intelligence Transportation Systems. doi:10.1109/TITS.2015.2413812.
Yuan, X., Zhao, C., and Zhang, H., 2010. Road detection and corner extraction using high definitionLidar. Information Technology Journal, 9, 1022–1030. doi:10.3923/itj.2010.1022.1030
Z+F, 2016. Homepage of the Company Z+F laser scanner systems. Available from: http://www.zf-laser.com/Home.91.0.html [Accessed 4 January 2016].
Zhao, H. and Shibasaki, R., 2002. Surface modelling of urban 3d objects from vehicle-borne laserrange data. ISPRS Archives, 34 (3/ A), 412–417.
242 H. GUAN ET AL.