Embed Size (px)
Citation preview

HYDROLOGY PROJECTTechnical Assistance
Use of regression analysis
• Regression analysis:– relation between dependent variable Y and one or more
independent variables Xi
• Use of regression model in general:– making forecasts/predictions/estimates for Y– investigation of functional relationship between Y and Xi– filling-in missing data in Y-series– validation of Y-series
• Use of regression model in data processing:– validation and in-filling of missing data using a relation
curve and of discharges using RR-relation– transformation of water levels to discharges using a
power type regression equation– estimation of rainfall/climatic variable on a catchment
grid like in kriging OHS - 1

HYDROLOGY PROJECTTechnical Assistance
Linear and non-linear regression equations
• Linear regression
– simple linear regression (i = 1)– multiple and stepwise regression (i > 1) in stepwise-
regression the independent variables enter model one by one based on largest reduction of unexplained variance (free variables); forced variables always enter model
• Non-linear regression
ii2211 X........XXY
ii
22
11 X.....XXY
OHS - 2

HYDROLOGY PROJECTTechnical Assistance
Suitable regression model
• Model depends on:– variables considered– physics of the processes – range of the data of interest
• A non-linear relation may well be described by a linear regression equation within a particular range of the variables in regression– annual rainfall-runoff relation is in principle non-linear,
but: * for low rainfall abstractions vary strongly due to
evaporation
* for very high rainfall evaporation has reached its potential and is almost constant
* within a limited range relation assumption of linearity is often suitable OHS - 3

HYDROLOGY PROJECTTechnical Assistance
0
200
400
600
800
1000
1200
1400
1600
0 200 400 600 800 1000 1200 1400 1600 1800
Rainfall (mm)
Ru
no
ff (
mm
)
EvaporationEvaporation
Runoff = R
ainfall
Runoff = R
ainfall
General form of relation between annual rainfall and runoff
General form of relation between annual rainfall and runoff
OHS - 4

HYDROLOGY PROJECTTechnical Assistance
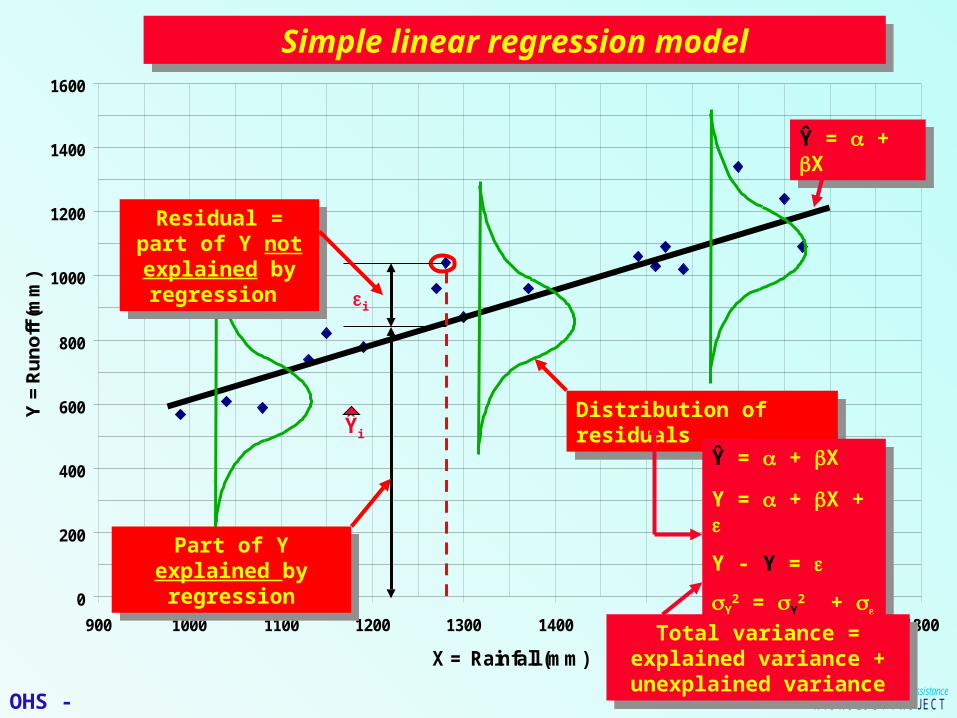
Use of regression model for discharge validation
• Steps– develop regression model where runoff/discharge is
regressed on rainfall:
Qt = f(Pt, Pt-1,…..)
– by investigating the time-wise behaviour of the residuals stationarity of the relationship is tested
– if rainfall is error free deviations from stationarity may be due to:
* change in drainage characteristics* incorrect runoff data due to errors in the water level
data and/or in the stage-discharge relation
– visualisation of non-stationarity by double mass analysis of observed discharge and via regression computed discharge
OHS - 5
HYDROLOGY PROJECTTechnical Assistance
0
200
400
600
800
1000
1200
1400
1600
900 1000 1100 1200 1300 1400 1500 1600 1700 1800
X = Rainfall (mm)
Y =
Ru
no
ff (m
m)
i
Ŷi
Residual = part of Y not explained by regression
Residual = part of Y not explained by regression
Part of Y explained by regression
Part of Y explained by regression
Distribution of residualsDistribution of residuals
Simple linear regression modelSimple linear regression model
Ŷ = + X
Y = + X +
Y - Y =
Y2 = Y
2 + 2
Ŷ = + X
Y = + X +
Y - Y =
Y2 = Y
2 + 2
Total variance = explained variance + unexplained
variance
Total variance = explained variance + unexplained
variance
Ŷ = + XŶ = + X
OHS - 6

HYDROLOGY PROJECTTechnical Assistance
YearsYears
MonthsMonths
Direction for parameter estimation
Direction for parameter estimation
3-D plot of monthly rainfall3-D plot of monthly rainfall
DIRECTION OF DATA VECTOR FOR REGRESSION ANALYSISDIRECTION OF DATA VECTOR FOR REGRESSION ANALYSIS
OHS - 7

HYDROLOGY PROJECTTechnical Assistance
Estimation of regression coefficients
• Minimising the sum of squared errors to obtain Least Squares Estimators:
• First derivatives of M to a and b set to zero: normal equations:
• Solutions for b and a
2ii
2ii
2i )bxay()yy(M
0)bxay(2a
Mii
0)bxay(x2b
Miii
xbya:andS
S
)xx)(xx(
)yy)(xx(
bXX
XYn
1iii
n
1iii
OHS - 8

HYDROLOGY PROJECTTechnical Assistance
Measure for goodness of fit
• Other forms of regression equation
(Y - Y) = b(X - X)
• Or with correlation coefficient r = SXY/X.Y:
(Y - Y) = r Y/X(X - X)
• By squaring previous equation and averaging
2 = Y
2 (1 - r2)
• r2 = coefficient determination • r2 is a measure for the quality of the regression fit
• NOTE: A high r2 is not sufficient; behaviour of residual about regression line and development with time also extremely important
OHS - 9

HYDROLOGY PROJECTTechnical Assistance
Confidence limits
• Error variance
• Confidence limits regression line
• Confidence limits prediction
XX
2XY
YY
n
1i
2ii
n
1ii
2
S
SS
2n
1))bxa(y(
2n
1
2n
1ˆ
XX
20
2/1,2n0 S
)xx(
n
1ˆtbxaCL
XX
20
2/1,2n0 S
)xx(
n
11ˆtbxaCL
MIND THE DIFFERENCE
MIND THE DIFFERENCE
OHS - 10

HYDROLOGY PROJECTTechnical Assistance
Application of regression analysis for data validation
• 17 years of annual rainfall and runoff data
• Procedure:– Plotting of time series– Fitting of regression equation R = f(P)– Plot of residual versus P– Plot of residual versus time– Plot of accumulated residual with time– Double mass analysis of observed versus regression
based runoff– Adjustment of runoff data– Repetition of above procedure and compare with above– Compare coefficients of determination– Compute confidence limits about regression and for
predictionOHS - 11

HYDROLOGY PROJECTTechnical Assistance
Rainfall-runoff record 1961-1977Rainfall-runoff record 1961-1977
0
200
400
600
800
1000
1200
1400
1600
1800
1960 1961 1962 1963 1964 1965 1966 1967 1968 1969 1970 1971 1972 1973 1974 1975 1976 1977 1978
Year
Ra
infa
ll, R
un
off
(m
m)
Rainfall
Runoff
OHS - 12

HYDROLOGY PROJECTTechnical Assistance
Regression fit rainfall-runoffRegression fit rainfall-runoff
400
500
600
700
800
900
1000
1100
1200
1300
1400
900 1000 1100 1200 1300 1400 1500 1600 1700
Rainfall (mm)
Ru
no
ff (
mm
)
OHS - 13

HYDROLOGY PROJECTTechnical Assistance
Plot of residual versus rainfallPlot of residual versus rainfall
-400
-300
-200
-100
0
100
200
300
800 900 1000 1100 1200 1300 1400 1500 1600 1700 1800
Rainfall (mm)
Re
sid
ua
l (m
m)
residual
Linear (residual)
OHS - 14

HYDROLOGY PROJECTTechnical Assistance
Plot of residual versus timePlot of residual versus time
-400
-300
-200
-100
0
100
200
300
1960 1962 1964 1966 1968 1970 1972 1974 1976 1978
Year
Re
sid
ua
l (m
m)
OHS - 15

HYDROLOGY PROJECTTechnical Assistance
Plot of accumulated residualPlot of accumulated residual
-800
-600
-400
-200
0
200
400
1960 1962 1964 1966 1968 1970 1972 1974 1976 1978
Year
Re
sid
ua
l, A
cc
. re
sid
ua
l (m
m)
Residual
Accumulated residual
OHS - 16

HYDROLOGY PROJECTTechnical Assistance
Double mass analysis of observed versus computed runoff
Double mass analysis of observed versus computed runoff
0
2000
4000
6000
8000
10000
12000
14000
0 2000 4000 6000 8000 10000 12000 14000
Acc. measurement
Ac
c. e
sti
ma
te
Break in measured runoff
Break in measured runoff
OHS - 17

HYDROLOGY PROJECTTechnical Assistance
Plot of rainfall versus corrected runoffPlot of rainfall versus corrected runoff
0
200
400
600
800
1000
1200
1400
1600
1800
1960 1962 1964 1966 1968 1970 1972 1974 1976 1978
Year
Ra
infa
ll, R
un
off
(m
m)
Rainfall
Corrected runoff
OHS - 18

HYDROLOGY PROJECTTechnical Assistance
Plot of rainfall-corrected runoff regressionPlot of rainfall-corrected runoff regression
400
500
600
700
800
900
1000
1100
1200
1300
1400
800 900 1000 1100 1200 1300 1400 1500 1600 1700 1800
Rainfall (mm)
Ru
no
ff (
mm
)
Corrected Runoff
Regression line
OHS - 19

HYDROLOGY PROJECTTechnical Assistance
Plot of residual (corrected) versus rainfallPlot of residual (corrected) versus rainfall
-400
-300
-200
-100
0
100
200
300
800 900 1000 1100 1200 1300 1400 1500 1600 1700 1800
Rainfall (mm)
Re
sid
ua
ls (
mm
)
Residual
Linear (Residual)
OHS - 20

HYDROLOGY PROJECTTechnical Assistance
Plot of residual (corrected) versus timePlot of residual (corrected) versus time
-200
-150
-100
-50
0
50
100
150
200
1960 1961 1962 1963 1964 1965 1966 1967 1968 1969 1970 1971 1972 1973 1974 1975 1976 1977 1978
Year
Re
sid
ua
l (m
m)
OHS - 21
HYDROLOGY PROJECTTechnical Assistance
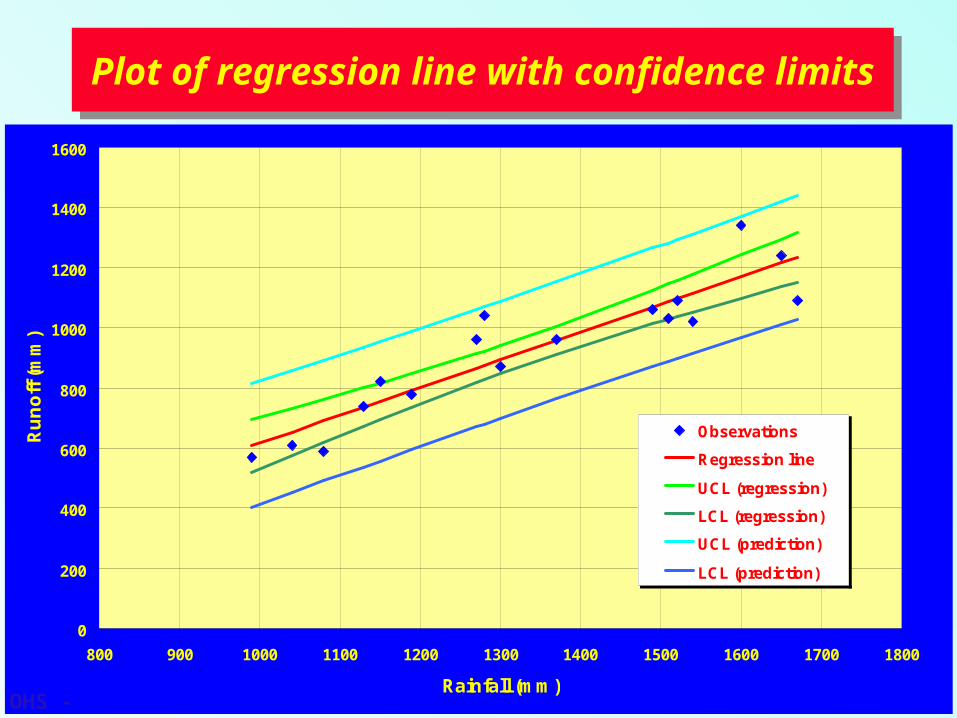
Plot of regression line with confidence limitsPlot of regression line with confidence limits
0
200
400
600
800
1000
1200
1400
1600
800 900 1000 1100 1200 1300 1400 1500 1600 1700 1800
Rainfall (mm)
Ru
no
ff (
mm
)
Observations
Regression line
UCL (regression)
LCL (regression)
UCL (prediction)
LCL (prediction)
OHS - 22
HYDROLOGY PROJECTTechnical Assistance
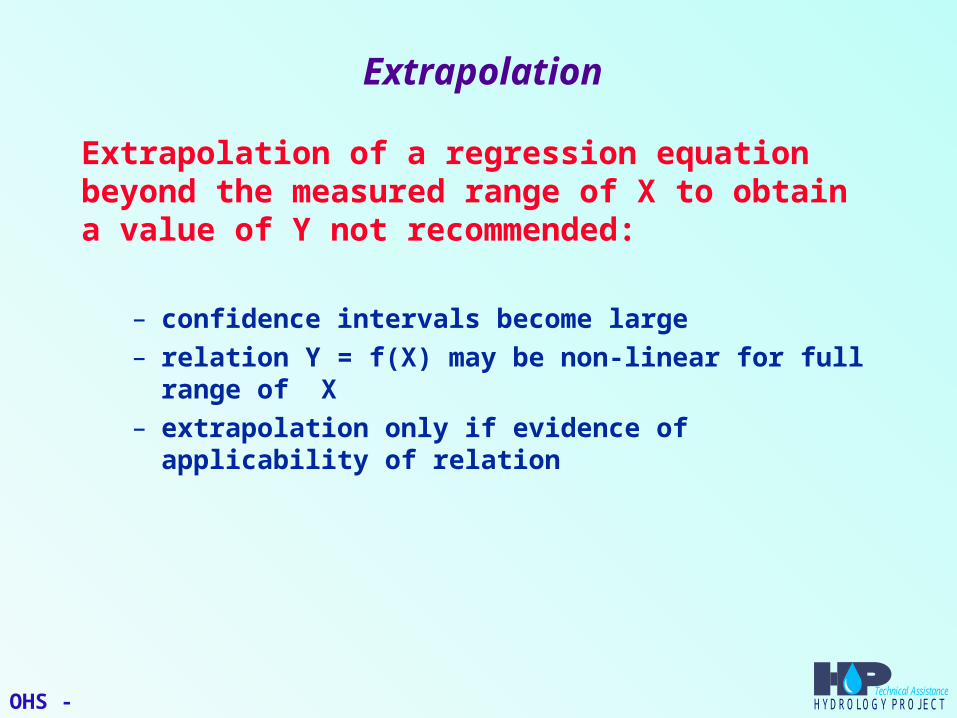
Extrapolation
Extrapolation of a regression equation beyond the measured range of X to obtain a value of Y not recommended:
– confidence intervals become large– relation Y = f(X) may be non-linear for full range of X– extrapolation only if evidence of applicability of relation
OHS - 23
HYDROLOGY PROJECTTechnical Assistance
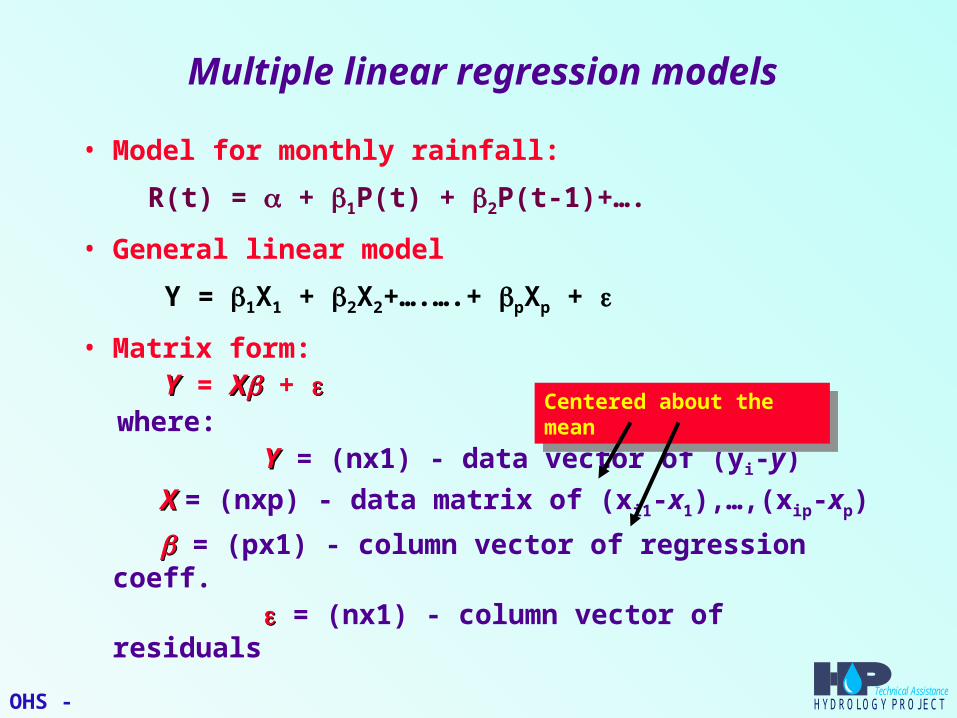
Multiple linear regression models
• Model for monthly rainfall:
R(t) = + 1P(t) + 2P(t-1)+….
• General linear model
Y = 1X1 + 2X2+….….+ pXp +
• Matrix form: YY = XX + where: YY = (nx1) - data vector of (yi-y)
XX = (nxp) - data matrix of (xi1-x1),…,(xip-xp)
= (px1) - column vector of regression coeff. = (nx1) - column vector of residuals
Centered about the meanCentered about the mean
OHS - 24

HYDROLOGY PROJECTTechnical Assistance
Estimation of regression coefficients
• Minimisation of residual sum of squares T:
T = (YY - XX)T(YY - XX)
• Differentiating with respect to and replacing by its estimate b b normal equations:
XXTXbXb = XXTYY
• For b b it follows:
bb = (XXTXX)-1 XXTYY
with: E[bb] =
Cov(bb) = = 22(X(XTX)X)-1
OHS - 25

HYDROLOGY PROJECTTechnical Assistance
Analysis of variance table (ANOVA)
Source Sum of squares Degrees offreedom
Mean squares
Regression (b1, …., bp)
Residual (e1, …., en)
SR = bTX
TY
Se = eTe = Y
TY - b
TX
TY
p
n-1-p
MSR = bTX
TY/p
MSe = se2 = e
Te/(n-1-p)
Total (adjusted fory) SY =YTY n-1 MSY = sY
2 = Y
TY/(n-1)
Total sum of squares about the mean =
regression sum of squares +
+ residual sum of squares
Total sum of squares about the mean =
regression sum of squares +
+ residual sum of squares
Coefficient of determination =
Rm2 = SR/SY = 1 - Se/SY
Coefficient of determination =
Rm2 = SR/SY = 1 - Se/SY
OHS - 26

HYDROLOGY PROJECTTechnical Assistance
Coefficient of determination
From ANOVA table
• Coefficient of determination Rm2
Rm2 = SR/SY = 1 - Se/SY
• Coefficient of determination adjusted for number of independent variables in regression Rma
2
Rma2 = 1 - MSe/MSY = 1 - (1 - Rm
2).(n - 1)/(n - p - 1)
OHS - 27

HYDROLOGY PROJECTTechnical Assistance
Comments
• Points of concern in using multiple regression:– can a linear model be used– what independent variables should be included
• Independent variables may be mutually correlated– investigate through the correlation matrix
• Retaining variables in regression that are highly correlated complicate interpretation of regression coefficients, with physically nonsense values
• Apply stepwise regression to select the “best” regression equation
• In stepwise regression a distinction can be made between “free” and “forced” variables;
MayMay enter regression dependent on correlation
MayMay enter regression dependent on correlation
WillWill enter regression irrespective of correlation
WillWill enter regression irrespective of correlation
OHS - 28

HYDROLOGY PROJECTTechnical Assistance
Non-linear models
• By transformation non-linear models can be transformed to linear models, e.g.
Y = X to: ln Y = ln + ln X or: YT = T + T XT
where: YT = ln Y
XT = ln X
T = ln T = • Remarks:
– The transformed residual sum of squares is minimised rather than the residual sum of squares
– Error term is additive in the transformed state, i.e. multiplicative in the power model: T = ln
OHS - 29

HYDROLOGY PROJECTTechnical Assistance
Filling-in missing data• Filling-in of missing water level and rainfall data in
previous modules
• Filling in of discharge data using regression relation with rainfall often suitable for monthly, seasonal or annual data
• Monthly regression model e.g.:
QQk,mk,m = a = akk + b + b1k1kPPk,mk,m + b + b2k2kPPk-1,mk-1,m + s + se,ke,k e e
• Addition of random component yes or no
– Note: E[e] = 0, hence for single value no random component
– For longer in-filling: could be considered dependent on use as no addition reduces the variance of series
Regression model for month k, computing
values for Q in year m
Regression model for month k, computing
values for Q in year m
OHS - 30

HYDROLOGY PROJECTTechnical Assistance
Type of regression model for filling-in missing flows
• Previously the following rainfall-discharge relation was proposed:
• Often regression coefficients do not vary much from month to month, but rather with wetness of month. Two sets of parameters are used in a regression model for all or a number of months:
– one set for dry conditions– another set for wet conditions
• In the latter approach the non-linear relationship is fitted by two linear models
QQk,mk,m = a = akk + b + b1k1kPPk,mk,m + b + b2k2kPPk-1,mk-1,m + s + se,ke,k e e
OHS - 31