Embed Size (px)
Citation preview
Use of survey (LFS) to evaluate the quality of census final data
Expert Group Meeting on Censuses Using Registers
Geneva, 22-23 May 2012
Jari Nieminen and Kaija Ruotsalainen, Statistics Finland
Jari Nieminen 23.5.2012 B 2
Content
Criteria for evaluating quality Case studies in Finland: data quality
data on persons data on main type of activity
Jari Nieminen 23.5.2012 B 3
Criteria for evaluating quality
Relevance the degree to which statistics meet the needs of current and
potential users Accuracy
the closeness of statistical estimates to true values Timeliness
this reflects the length of time between data being made available and the event or phenomen they desscribe
Punctuality the time lag between the date that data were actually released and
the target release date
Jari Nieminen 23.5.2012 B 4
Criteria for evaluating quality
Accessibility the phycical contitions in which users can obtain data
Clarity / interpretability metadata, information on data quality
Coherence / consistency data from different sources
Comparability comparability over time comparability through space comparability between domains
Jari Nieminen 23.5.2012 B 5
Quality measurements in practice
The quality of incoming datacan be judged against the criteria listed abovee.g. data sets coming to Stat Finland are checked:
to be in readable format to have correct keys (identifications) to have asked variables to have right values to be compared with external source to be compared with previous year/month data
if something unclear or there are big changes => contact to the data owner

Jari Nieminen 23.5.2012 B 6
Quality measurements in practice
The quality of data processingquality can be affected by different processes:data matching and linkingdata editing and imputation to keep a copy of the raw data to refer back if
necessary
Jari Nieminen 23.5.2012 B 7
Quality measurements in practice
The quality of statistical outputsmoving from survey to administrative sources will have
an impact on output qualitypositive for some quality criteria and negative for others

Jari Nieminen 23.5.2012 B 8
Case studies in Finland
Data quality data on persons data on main type of activity
Jari Nieminen 23.5.2012 B 9
Reliability (1)
Studies to research and monitor the reliability of register-based data were carried out well ahead of the decision to adopt a register-based census system in Finland.
A major reliability survey was carried out in conjunction with the first entirely register-based population census in 1990.
These register sources were compared with the results of a sample questionnaire survey which comprised around two percent of all buildings, dwellings and persons in the country.
The results indicated the proportion of responses where the questionnaire data deviated from the register data, but not which of these two sources provided the correct information.
Jari Nieminen 23.5.2012 B 10
Reliability (2)
Respondents may give a different figure a person who has more than one job may well opt for a different choice than
the register keeper a student who has a job will always be defined as gainfully employed on the
basis of register data, yet that student might well not report having a job at
all. It has been shown that the difference between register-based
and questionnaire-based data is no greater than the difference between data from two questionnaire surveys.
Jari Nieminen 23.5.2012 B 11
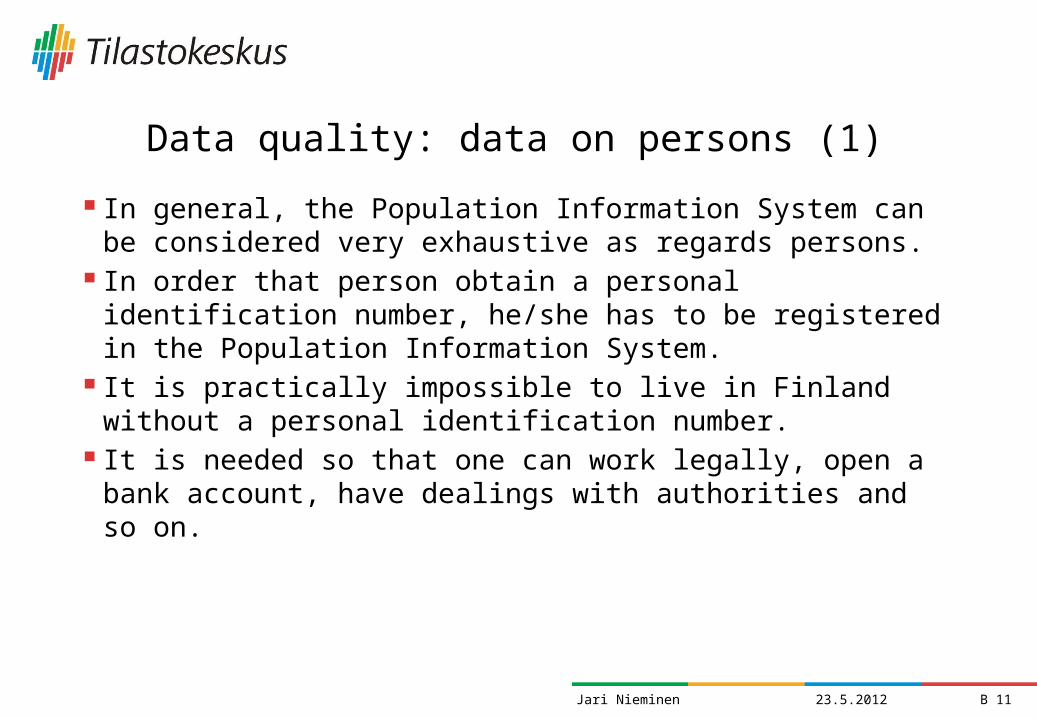
Data quality: data on persons (1)
In general, the Population Information System can be considered very exhaustive as regards persons.
In order that person obtain a personal identification number, he/she has to be registered in the Population Information System.
It is practically impossible to live in Finland without a personal identification number.
It is needed so that one can work legally, open a bank account, have dealings with authorities and so on.

Jari Nieminen 23.5.2012 B 12
Data quality: data on persons (2)
Annual quality checks are carried out to monitor the reliability of address data, for instance, by the Population Register Centre.
Each year the Population Register Centre commissions a survey to establish the accuracy of address data recorded in the population information system.
In the connection of Labour Force Survey some data are checked in Population Information System. Part of data ( e.g. place of residence) is checked annually, others less frequently e.g. mother tongue, occupation and tenure status.
Jari Nieminen 23.5.2012 B 13
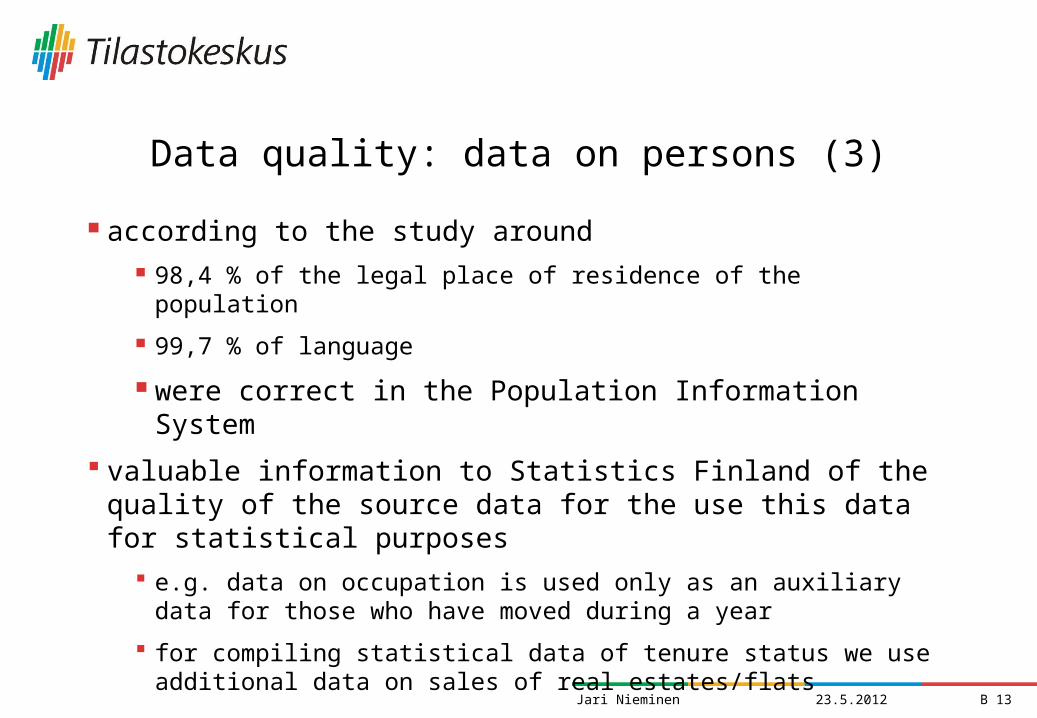
Data quality: data on persons (3)
according to the study around 98,4 % of the legal place of residence of the population
99,7 % of language
were correct in the Population Information System
valuable information to Statistics Finland of the quality of the source data for the use this data for statistical purposes
e.g. data on occupation is used only as an auxiliary data for those who have moved during a year
for compiling statistical data of tenure status we use additional data on sales of real estates/flats
Jari Nieminen 23.5.2012 B 14
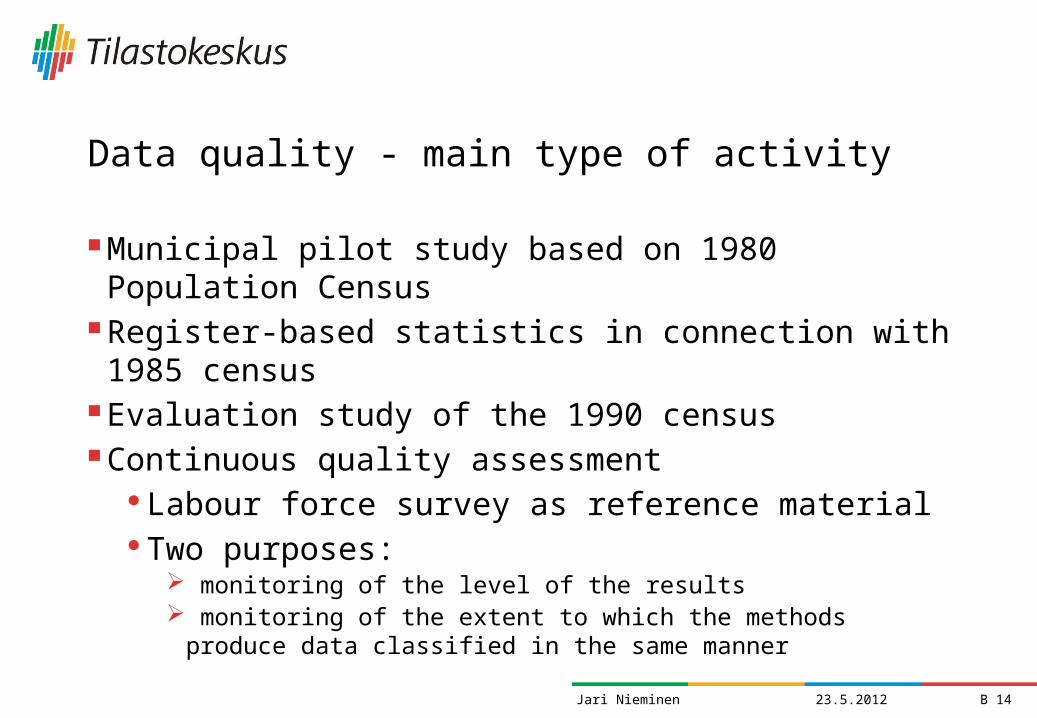
Data quality - main type of activity
Municipal pilot study based on 1980 Population Census Register-based statistics in connection with 1985 census Evaluation study of the 1990 census Continuous quality assessment
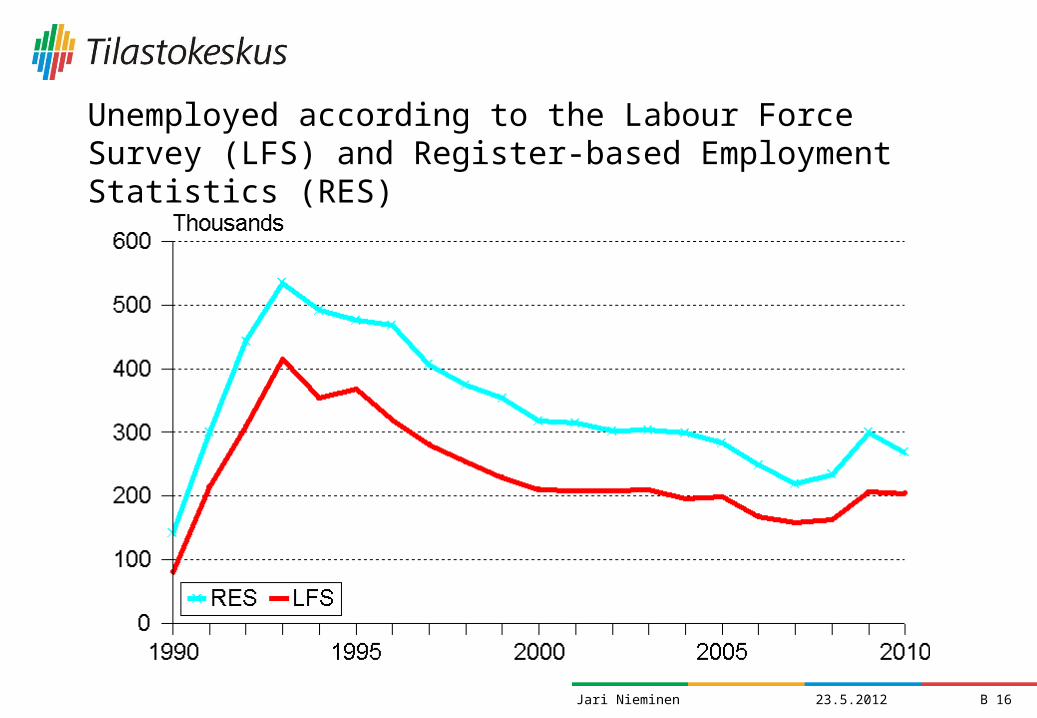
Labour force survey as reference materialTwo purposes:
monitoring of the level of the results monitoring of the extent to which the methods produce data classified
in the same manner
Jari Nieminen
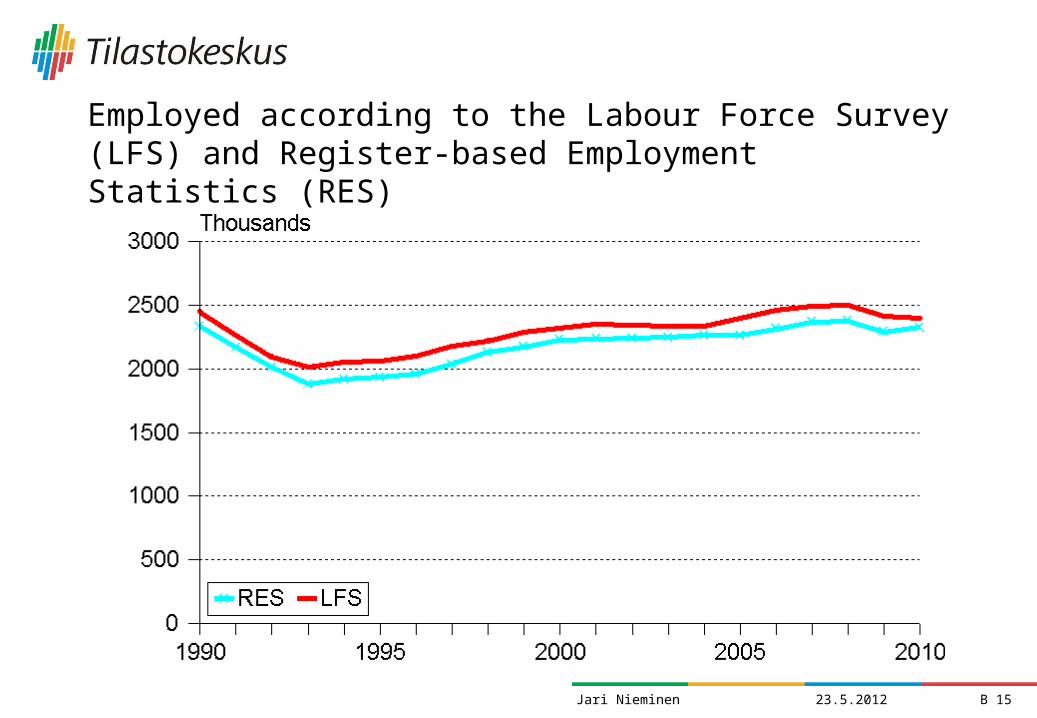
Employed according to the Labour Force Survey (LFS) and Register-based Employment Statistics (RES)
23.5.2012 B 15
Jari Nieminen
Unemployed according to the Labour Force Survey (LFS) and Register-based Employment Statistics (RES)
23.5.2012 B 16
Jari Nieminen 23.5.2012 B 17
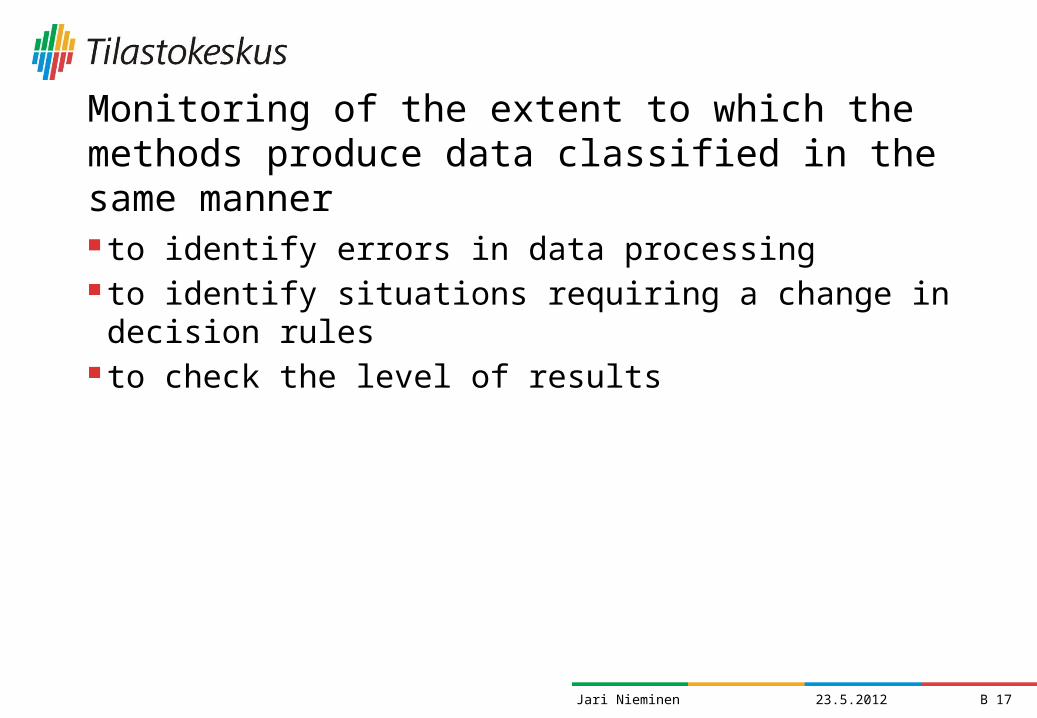
Monitoring of the extent to which the methods produce data classified in the same manner
to identify errors in data processing to identify situations requiring a change in decision rules to check the level of results
Jari Nieminen 23.5.2012 B 18
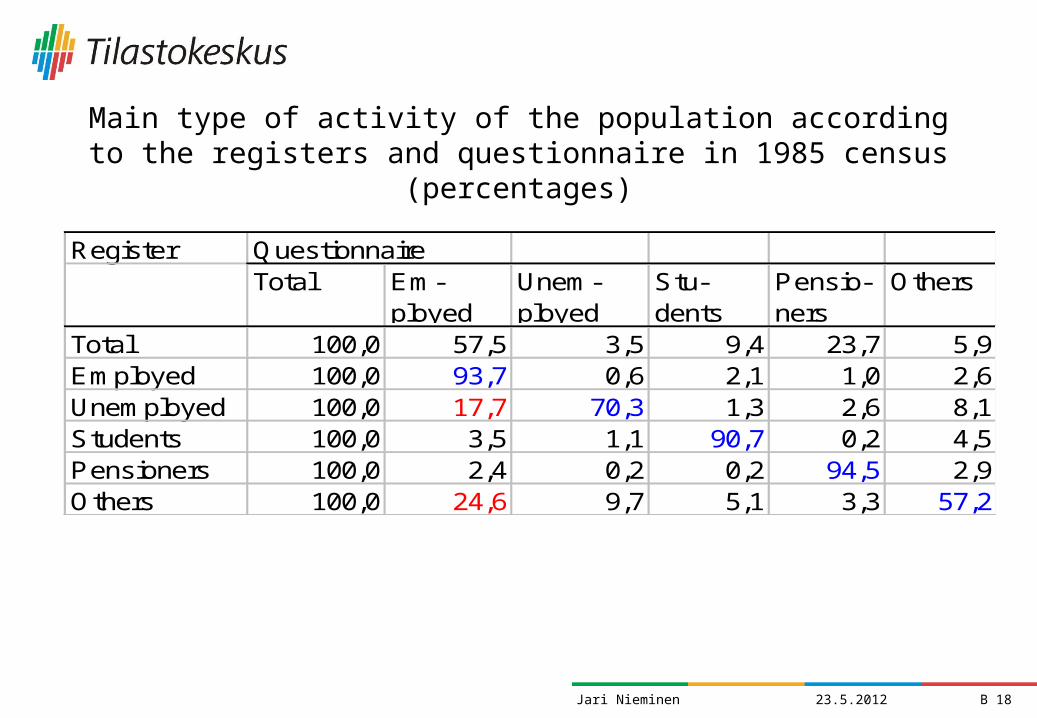
Main type of activity of the population according to the registers and questionnaire in 1985 census (percentages)
Register QuestionnaireTotal Em-
ployedUnem-ployed
Stu-dents
Pensio-ners
Others
Total 100,0 57,5 3,5 9,4 23,7 5,9Employed 100,0 93,7 0,6 2,1 1,0 2,6Unemployed 100,0 17,7 70,3 1,3 2,6 8,1Students 100,0 3,5 1,1 90,7 0,2 4,5Pensioners 100,0 2,4 0,2 0,2 94,5 2,9Others 100,0 24,6 9,7 5,1 3,3 57,2
Jari Nieminen 23.5.2012 B 19
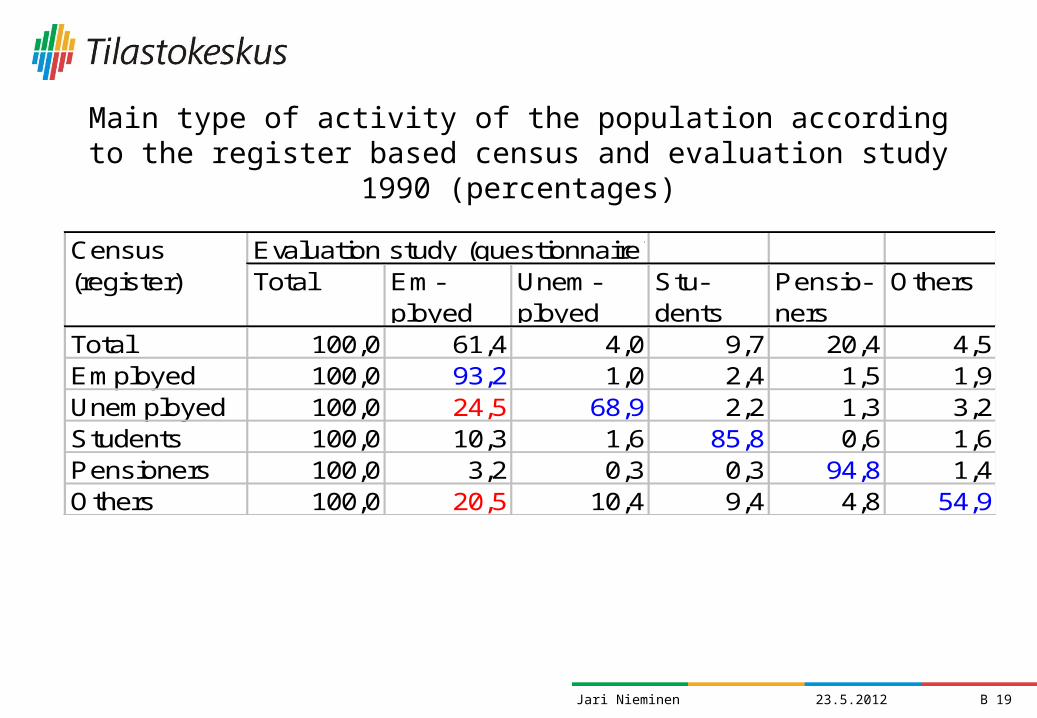
Main type of activity of the population according to the register based census and evaluation study 1990 (percentages)
Evaluation study (questionnaire)Total Em-
ployedUnem-ployed
Stu-dents
Pensio-ners
Others
Total 100,0 61,4 4,0 9,7 20,4 4,5Employed 100,0 93,2 1,0 2,4 1,5 1,9Unemployed 100,0 24,5 68,9 2,2 1,3 3,2Students 100,0 10,3 1,6 85,8 0,6 1,6Pensioners 100,0 3,2 0,3 0,3 94,8 1,4Others 100,0 20,5 10,4 9,4 4,8 54,9
Census (register)
Jari Nieminen 23.5.2012 B 20
Main type of activity by questionnaire and by register 1985
Employed Unemployed Students Pensioners Others0
500
1000
1500
2000
2500
3000Thousands
Questionnaire -85 Register -85 Evaluation study -85
Jari Nieminen 23.5.2012 B 21
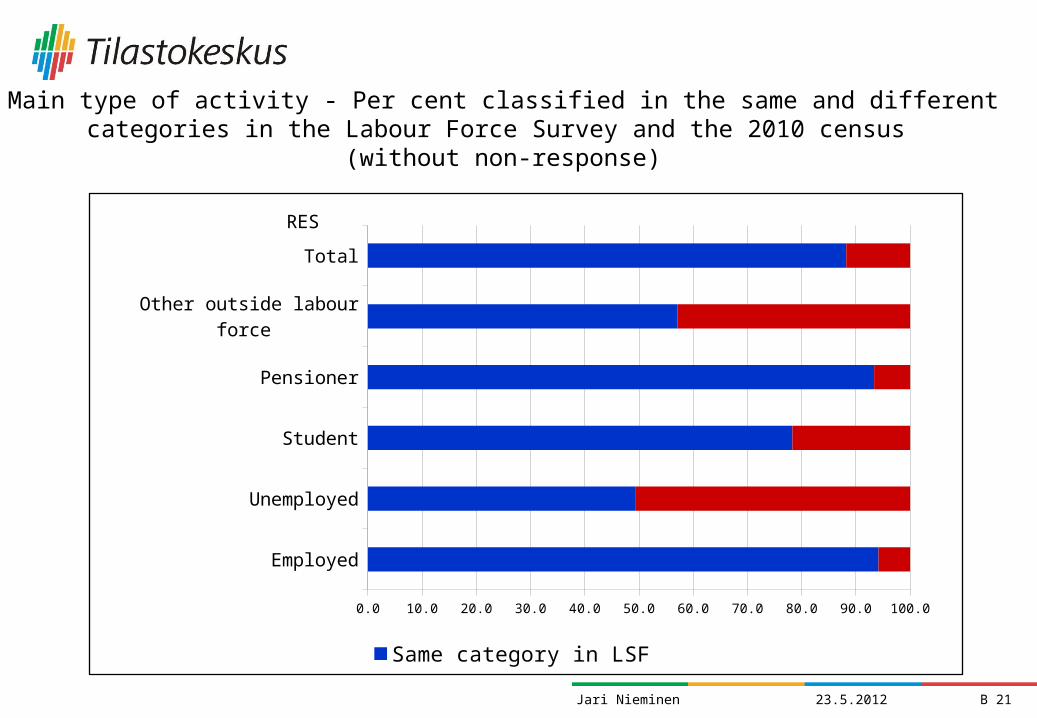
Employed
Unemployed
Student
Pensioner
Other outside labour force
Total
0.0 10.0 20.0 30.0 40.0 50.0 60.0 70.0 80.0 90.0 100.0
Same category in LSF Different category in LSF
RES
Main type of activity - Per cent classified in the same and differentcategories in the Labour Force Survey and the 2010 census
(without non-response)
Jari Nieminen 23.5.2012 B 22
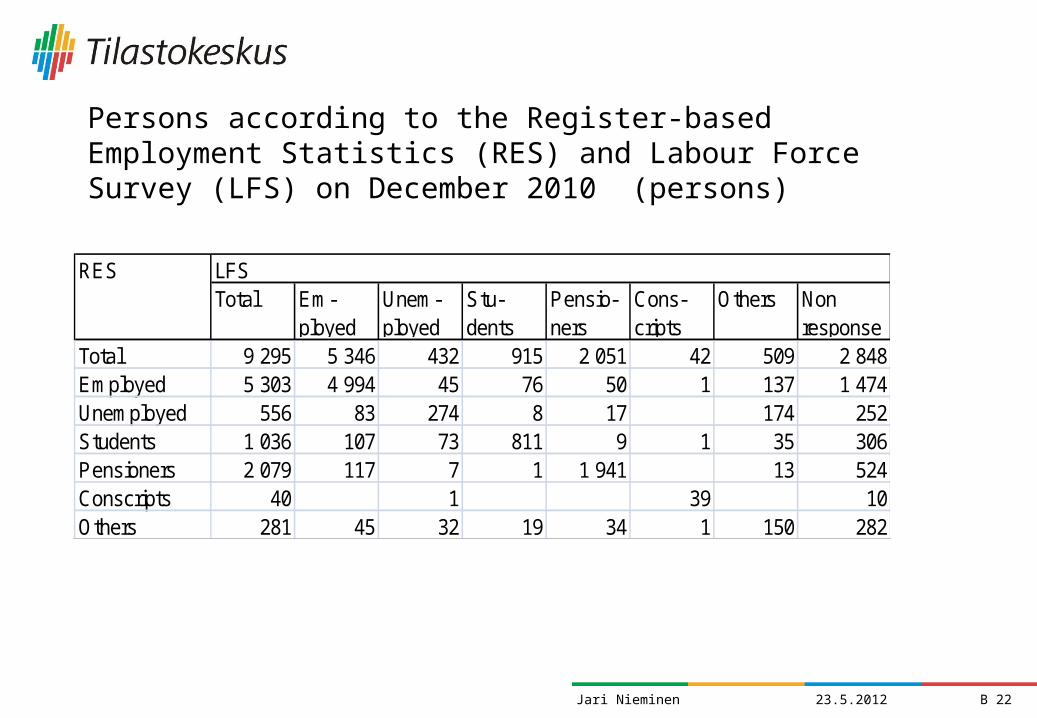
Persons according to the Register-based Employment Statistics (RES) and Labour Force Survey (LFS) on December 2010 (persons)
Total Em-ployed
Unem-ployed
Stu-dents
Pensio-ners
Cons-cripts
Others Non response
Total 9 295 5 346 432 915 2 051 42 509 2 848Employed 5 303 4 994 45 76 50 1 137 1 474Unemployed 556 83 274 8 17 174 252Students 1 036 107 73 811 9 1 35 306Pensioners 2 079 117 7 1 1 941 13 524Conscripts 40 1 39 10Others 281 45 32 19 34 1 150 282
LFSRES
Jari Nieminen 23.5.2012 B 23
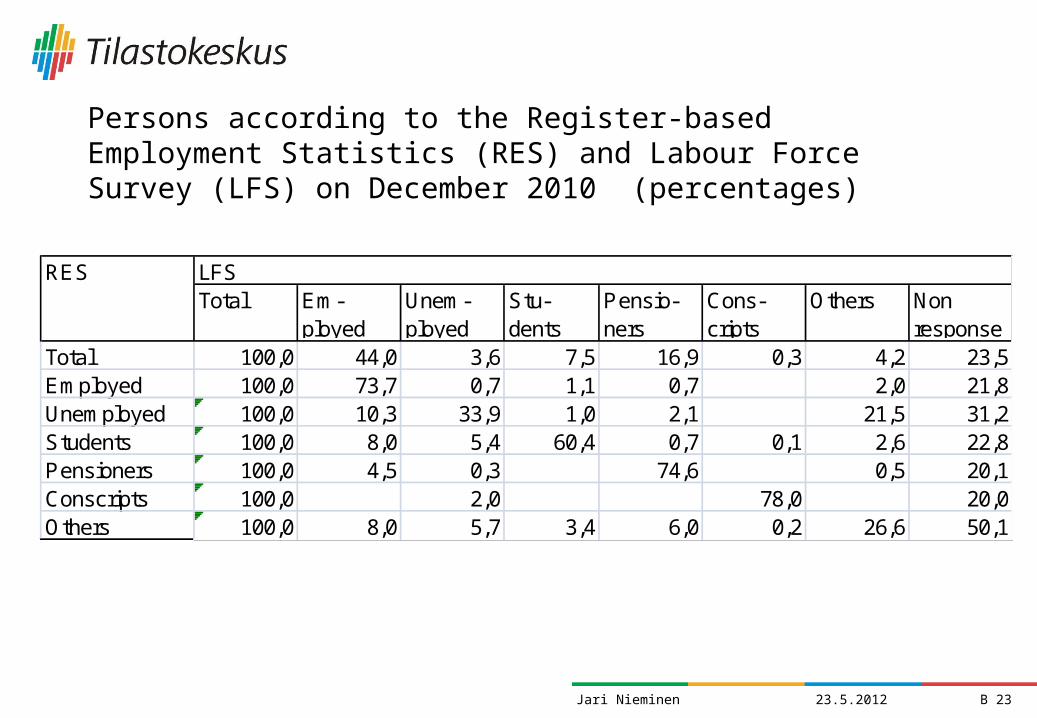
Persons according to the Register-based Employment Statistics (RES) and Labour Force Survey (LFS) on December 2010 (percentages)
Total Em-ployed
Unem-ployed
Stu-dents
Pensio-ners
Cons-cripts
Others Non response
Total 100,0 44,0 3,6 7,5 16,9 0,3 4,2 23,5Employed 100,0 73,7 0,7 1,1 0,7 2,0 21,8Unemployed 100,0 10,3 33,9 1,0 2,1 21,5 31,2Students 100,0 8,0 5,4 60,4 0,7 0,1 2,6 22,8Pensioners 100,0 4,5 0,3 74,6 0,5 20,1Conscripts 100,0 2,0 78,0 20,0Others 100,0 8,0 5,7 3,4 6,0 0,2 26,6 50,1
LFSRES
24Jari Nieminen 23.5.2012
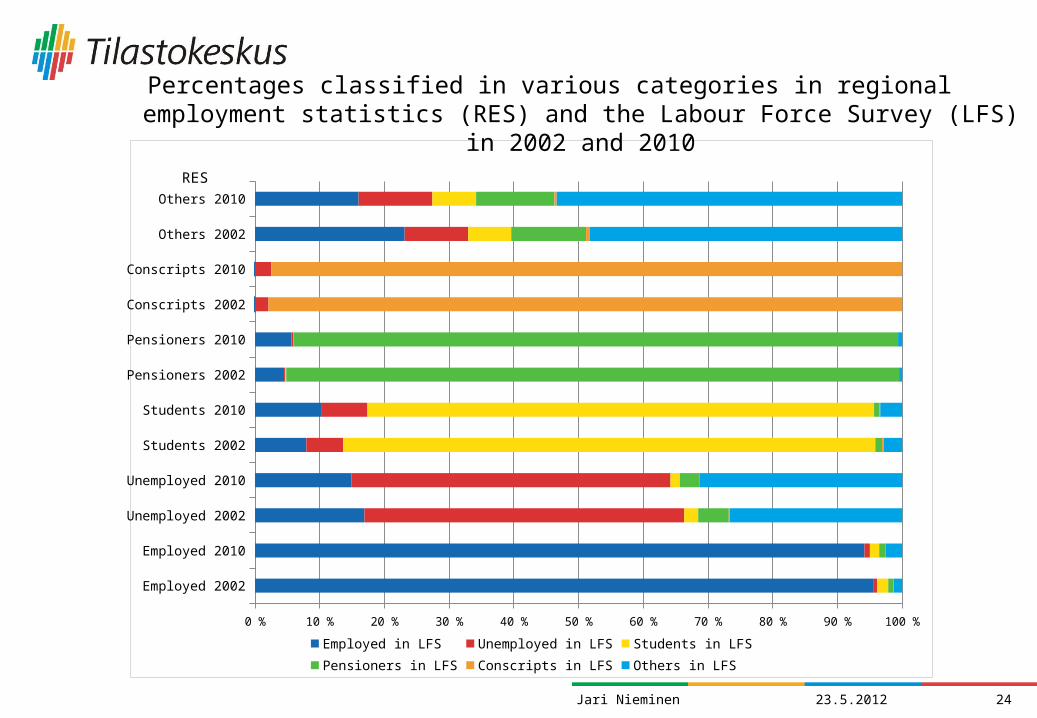
Employed 2002
Employed 2010
Unemployed 2002
Unemployed 2010
Students 2002
Students 2010
Pensioners 2002
Pensioners 2010
Conscripts 2002
Conscripts 2010
Others 2002
Others 2010
0 % 10 % 20 % 30 % 40 % 50 % 60 % 70 % 80 % 90 % 100 %
Employed in LFS Unemployed in LFS Students in LFS
Pensioners in LFS Conscripts in LFS Others in LFS
RES
Percentages classified in various categories in regional employment statistics (RES) and the Labour Force Survey (LFS)
in 2002 and 2010