Embed Size (px)
Citation preview

Gardner-Webb UniversityDigital Commons @ Gardner-Webb University
Education Dissertations and Projects School of Education
2017
Use of Technology and Perceived Level ofEngagement with 1:1 TechnologyWilliam Blake Tucker
Follow this and additional works at: https://digitalcommons.gardner-webb.edu/education_etd
Part of the Educational Technology Commons
This Dissertation is brought to you for free and open access by the School of Education at Digital Commons @ Gardner-Webb University. It has beenaccepted for inclusion in Education Dissertations and Projects by an authorized administrator of Digital Commons @ Gardner-Webb University. Formore information, please see Copyright and Publishing Info.
Recommended CitationTucker, William Blake, "Use of Technology and Perceived Level of Engagement with 1:1 Technology" (2017). Education Dissertationsand Projects. 274.https://digitalcommons.gardner-webb.edu/education_etd/274

Use of Technology and Perceived Level of Engagement with 1:1 Technology
By
William Blake Tucker
A Dissertation Submitted to the
Gardner-Webb University School of Education
in Partial Fulfillment of the Requirements
for the Degree of Doctor of Education
Gardner-Webb University
2017

ii
Approval Page
This dissertation was submitted by William Blake Tucker under the direction of the
persons listed below. It was submitted to the Gardner-Webb University School of
Education and approved in partial fulfillment of the requirements for the degree of
Doctor of Education at Gardner-Webb University.
________________________________________ ________________________
Kathi Gibson, Ph.D. Date
Committee Chair
________________________________________ ________________________
Gerald Neal, Ed.D. Date
Committee Member
________________________________________ ________________________
Denise E. Hedrick, Ed.D. Date
Committee Member
________________________________________ ________________________
Doug Eury, Ed.D. Date
Committee Member
________________________________________ ________________________
Jeffrey Rogers, Ph.D. Date
Dean of the Gayle Bolt Price School
of Graduate Studies
iii
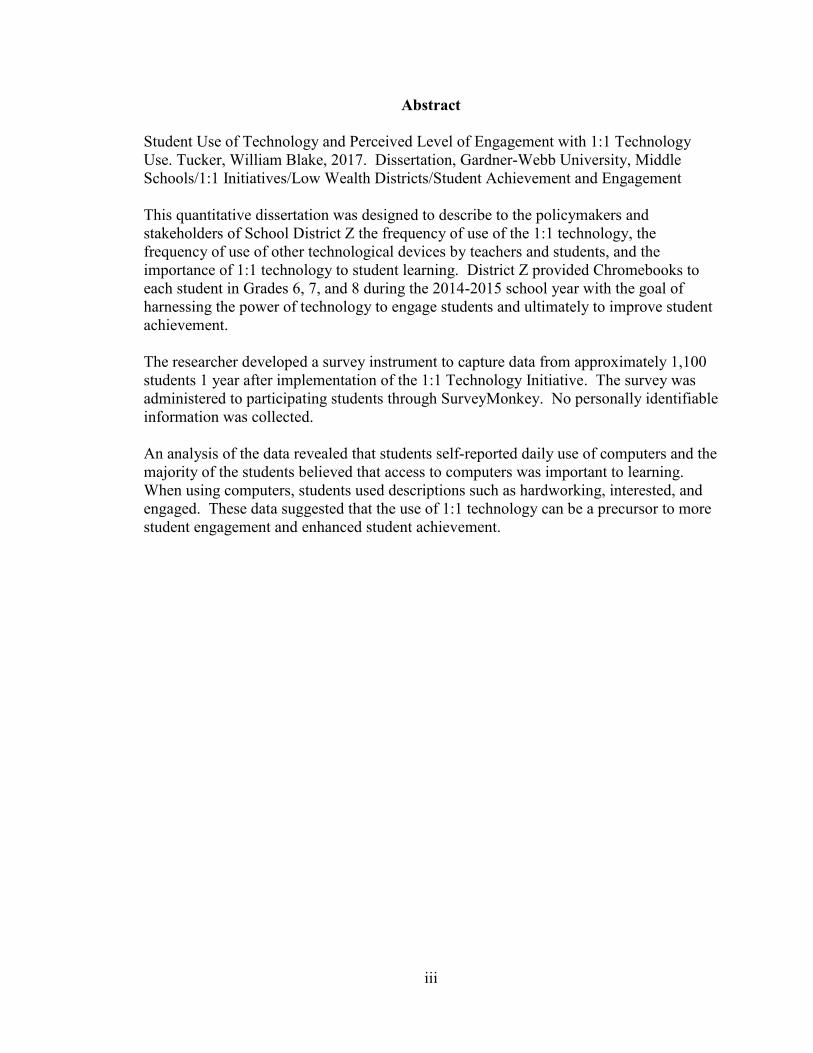
Abstract
Student Use of Technology and Perceived Level of Engagement with 1:1 Technology
Use. Tucker, William Blake, 2017. Dissertation, Gardner-Webb University, Middle
Schools/1:1 Initiatives/Low Wealth Districts/Student Achievement and Engagement
This quantitative dissertation was designed to describe to the policymakers and
stakeholders of School District Z the frequency of use of the 1:1 technology, the
frequency of use of other technological devices by teachers and students, and the
importance of 1:1 technology to student learning. District Z provided Chromebooks to
each student in Grades 6, 7, and 8 during the 2014-2015 school year with the goal of
harnessing the power of technology to engage students and ultimately to improve student
achievement.
The researcher developed a survey instrument to capture data from approximately 1,100
students 1 year after implementation of the 1:1 Technology Initiative. The survey was
administered to participating students through SurveyMonkey. No personally identifiable
information was collected.
An analysis of the data revealed that students self-reported daily use of computers and the
majority of the students believed that access to computers was important to learning.
When using computers, students used descriptions such as hardworking, interested, and
engaged. These data suggested that the use of 1:1 technology can be a precursor to more
student engagement and enhanced student achievement.
iv
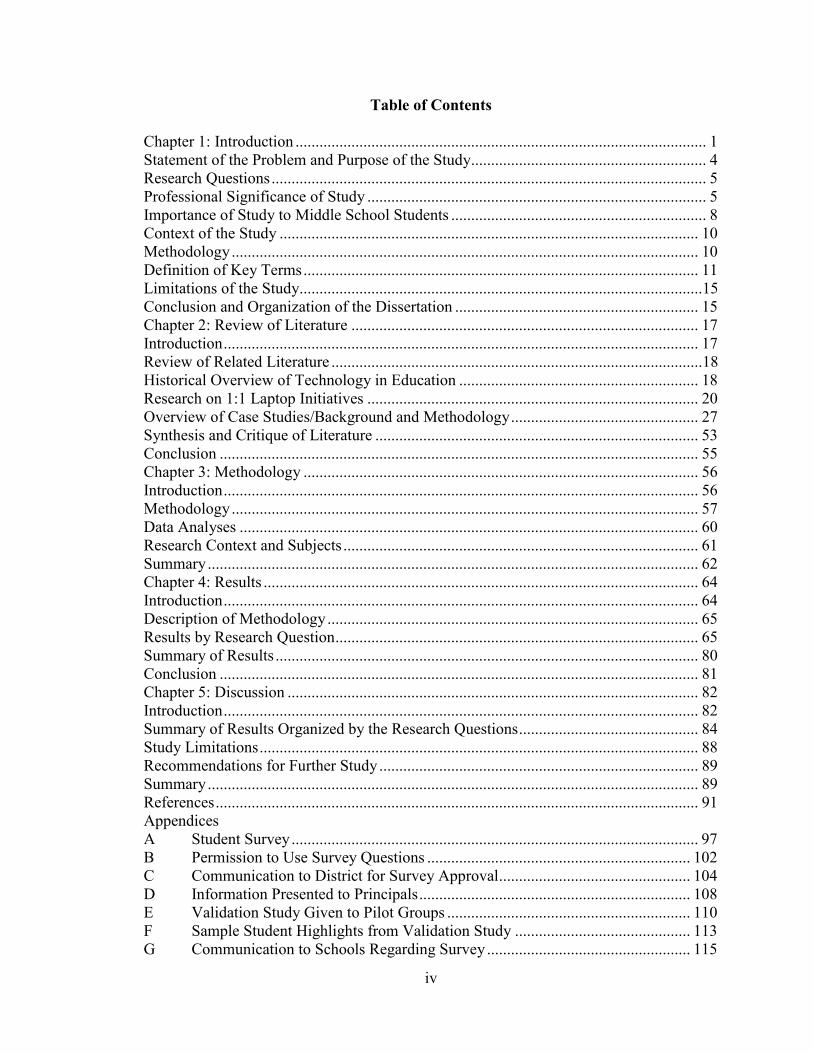
Table of Contents
Chapter 1: Introduction ....................................................................................................... 1 Statement of the Problem and Purpose of the Study........................................................... 4
Research Questions ............................................................................................................. 5 Professional Significance of Study ..................................................................................... 5 Importance of Study to Middle School Students ................................................................ 8 Context of the Study ......................................................................................................... 10 Methodology ..................................................................................................................... 10
Definition of Key Terms ................................................................................................... 11
Limitations of the Study.....................................................................................................15
Conclusion and Organization of the Dissertation ............................................................. 15 Chapter 2: Review of Literature ....................................................................................... 17
Introduction ....................................................................................................................... 17
Review of Related Literature .............................................................................................18
Historical Overview of Technology in Education ............................................................ 18 Research on 1:1 Laptop Initiatives ................................................................................... 20
Overview of Case Studies/Background and Methodology ............................................... 27 Synthesis and Critique of Literature ................................................................................. 53 Conclusion ........................................................................................................................ 55
Chapter 3: Methodology ................................................................................................... 56 Introduction ....................................................................................................................... 56
Methodology ..................................................................................................................... 57 Data Analyses ................................................................................................................... 60 Research Context and Subjects ......................................................................................... 61
Summary ........................................................................................................................... 62
Chapter 4: Results ............................................................................................................. 64 Introduction ....................................................................................................................... 64 Description of Methodology ............................................................................................. 65
Results by Research Question ........................................................................................... 65 Summary of Results .......................................................................................................... 80
Conclusion ........................................................................................................................ 81 Chapter 5: Discussion ....................................................................................................... 82
Introduction ....................................................................................................................... 82 Summary of Results Organized by the Research Questions ............................................. 84 Study Limitations .............................................................................................................. 88 Recommendations for Further Study ................................................................................ 89
Summary ........................................................................................................................... 89 References ......................................................................................................................... 91 Appendices
A Student Survey ...................................................................................................... 97
B Permission to Use Survey Questions .................................................................. 102
C Communication to District for Survey Approval................................................ 104
D Information Presented to Principals .................................................................... 108
E Validation Study Given to Pilot Groups ............................................................. 110
F Sample Student Highlights from Validation Study ............................................ 113
G Communication to Schools Regarding Survey ................................................... 115

v
Tables
1 Combined Responses to Survey Question 6 ......................................................... 66
2 Combined Responses to Survey Question 7 ......................................................... 67
3 Combined Responses to Survey Question 8 ......................................................... 68
4 Combined Responses to Survey Question 4 ......................................................... 69
5 Combined Responses to Survey Question 9 ......................................................... 70
6 Combined Responses to Survey Question 11 ....................................................... 71
7 Combined Responses to Survey Question 12 ....................................................... 72
8 Combined Responses to Survey Question 13 ....................................................... 73
9 Combined Responses to Survey Question 2 ......................................................... 74
10 Combined Responses to Survey Question 3 ......................................................... 75
11 Combined Responses to Survey Question 5 ......................................................... 76
12 Combined Responses to Survey Question 10 ....................................................... 77
13 Combined Responses to Survey Question 14 ....................................................... 79
14 Combined Responses to Survey Question 15 ....................................................... 80
1
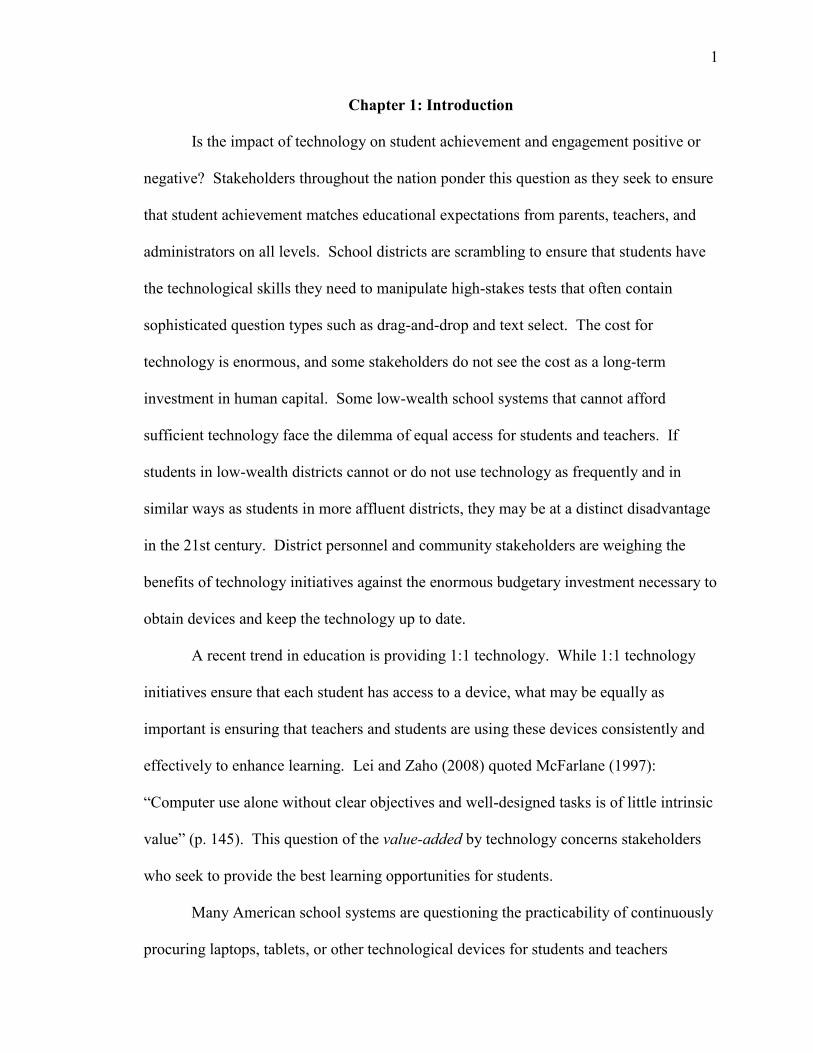
Chapter 1: Introduction
Is the impact of technology on student achievement and engagement positive or
negative? Stakeholders throughout the nation ponder this question as they seek to ensure
that student achievement matches educational expectations from parents, teachers, and
administrators on all levels. School districts are scrambling to ensure that students have
the technological skills they need to manipulate high-stakes tests that often contain
sophisticated question types such as drag-and-drop and text select. The cost for
technology is enormous, and some stakeholders do not see the cost as a long-term
investment in human capital. Some low-wealth school systems that cannot afford
sufficient technology face the dilemma of equal access for students and teachers. If
students in low-wealth districts cannot or do not use technology as frequently and in
similar ways as students in more affluent districts, they may be at a distinct disadvantage
in the 21st century. District personnel and community stakeholders are weighing the
benefits of technology initiatives against the enormous budgetary investment necessary to
obtain devices and keep the technology up to date.
A recent trend in education is providing 1:1 technology. While 1:1 technology
initiatives ensure that each student has access to a device, what may be equally as
important is ensuring that teachers and students are using these devices consistently and
effectively to enhance learning. Lei and Zaho (2008) quoted McFarlane (1997):
“Computer use alone without clear objectives and well-designed tasks is of little intrinsic
value” (p. 145). This question of the value-added by technology concerns stakeholders
who seek to provide the best learning opportunities for students.
Many American school systems are questioning the practicability of continuously
procuring laptops, tablets, or other technological devices for students and teachers
2
without definitive answers to several questions. How often must students use the
technology for it to make a difference in achievement? Will students be actively engaged
in educational activities when using the devices? Do students feel the devices are
important to learning? These questions are relevant as school districts, large and small,
weigh the benefits of the huge investment necessary to keep up with technological
advances and provide devices for students and teachers.
In addition to previously purchased technology, District Z, the school system
designated for this study, introduced a 1:1 technology initiative in the 2014-2015 school
year. According to 1:1 Computing, a Guidebook to Help You Make the Right Decisions,
1:1 technology can be defined as “an environment in which students use computing
devices such as wireless laptops or tablet PC computers in order to learn anytime and
anywhere” (Microsoft, 2005, para. 3). For education purposes, 1:1 means that the school
provides each student with a laptop or other device that the student can take home, thus
giving students access to technology both during the school day and at home (McLeod &
Sauers, 2012). Prior to this writing, no substantive evaluation system was in place to
assess the frequency of use of technology in District Z, nor were there means to
determine if students felt the technological devices were important to their learning.
In addition to testing and technology, today’s educators must determine how best
to engage the students of the digital age. According to Marks (2000), “student
engagement declines as students move through upper elementary grades to middle school
and further into high school” (p. 156). Once students enter high school, an estimated
40% to 60% of them reportedly are disengaged (Marks, 2000). Stakeholders both for and
against 1:1 technology and other sources of technology concur that student engagement
yields student achievement, yet student engagement looks different for today’s students

3
who use technology at a rate and in a manner never before seen. According to research
conducted by Madden, Lenhart, Duggan, Cortesi, and Gasser (2013) with Harvard’s Pew
Internet Project, 95% of adolescents are online and use numerous devices including
laptops, tablets, and smartphones. Educators want to know how to harness the power of
technology to motivate the digital-age student to peak achievement. Conversely,
educators must consider the risks of off-task behaviors on the part of students who are
using devices for everything but learning. Thus, the age-old question emerges front and
center: Do the benefits of regularly infusing technology into instructional plans outweigh
the risks?
Technology is here to stay; and to determine its impact on education achievement,
teachers and students must integrate technological devices into the classroom consistently
and effectively.
Technology integration is the use of technology resources – computers, mobile
devices like smartphones and tablets, digital cameras, social media platforms and
networks, software applications, the Internet, etc. – in daily classroom practices,
and in the management of a school. Successful technology integration is achieved
when the use of technology is (1) Routine and transparent, (2) Accessible and
readily available for the task at hand, (3) Supporting the curricular goals, and
helping the students to effectively reach their goals. (Edutopia, 2007, para. 1)
Because many of today’s students in low-wealth communities are not “tech savvy,” their
teachers must be comfortable and proficient in the use of technological devices and
impart that knowledge to the students. Teachers must teach certain basic skills that
students can apply to many different technology tools. One myth of the digital divide is
that all young people know how to use digital devices. Just as low-wealth districts cannot

4
afford to fully fund the schools, many who live in those districts or counties usually
cannot afford to purchase technology devices.
Statement of the Problem and Purpose of the Study
Technology is an integral part of today’s society; thus, educators must employ the
influence of technology in helping students become critical thinkers, communicators, and
collaborators. Given the stress that high-stakes testing imposes on our current
educational system, many schools are desperate to improve the academic scores of
students who must not only be proficient in core areas such as language arts, math, social
studies, and science but also must be prepared to be productive citizens in a globally
connected 21st century economy. Toward that end, school systems throughout the
country are spending millions of dollars to purchase technological devices. Politicians
and stakeholders, including those in District Z, deserve to know the frequency of use and
the benefits of such colossal spending, yet determining the returns on such investments is
impossible if no system exists to capture the data necessary to communicate the benefits.
District Z, like many low wealth school districts in the United States, operates on
a meager budget. Embarking on a 1:1 technology initiative was a major budgetary
commitment. At this writing, no system was in place to evaluate and describe the
benefits of the investment. Politicians, policymakers, and other stakeholders who expect
efficient and effective spending of district dollars deserved to know if the huge
technology expenditures were producing the desired results; therefore, this study was
appropriate and necessary for the stakeholders of District Z. This quantitative study was
designed to clarify and describe to the policymakers and stakeholders of School District
Z how frequently students use the 1:1 technology; how frequently teachers and students

5
use technological devices in general; and finally, whether the district’s middle school
students felt that access to and use of the 1:1 technology was important to their learning.
Research Questions
The following three questions guided this research study.
1. How frequently do middle school students in District Z use 1:1 technology?
2. Do the middle school students in District Z believe that technology access is
important to their learning?
3. How frequently do middle school teachers and students in District Z use other
technological devices?
Professional Significance of Study
The 1:1 initiative was central to this study. Current research is limited in
providing a connection between 1:1 technological devices, instructional attentiveness,
and student success (Silvernail & Lane, 2004). Nonetheless, this study’s results may
illuminate the educational value of student access to 1:1 technology. Educators can ill
afford to leave the importance of technology use to conjecture. To sustain funding for
future technology, decision makers must have significant and convincing data. In the
case of District Z, convincing data must prove that the frequency of use was substantial
and that the students believed that the technology was important to learning.
Research conducted by the Stanford Center for Opportunity Policy in Education
suggested that access to 1:1 technology can be transformational for at-risk students
(Darling-Hammond, Zielezinski, & Godman, 2014). Darling-Hammond et al. (2014)
provided numerous examples that indicate the positive affect 1:1 devices have in terms of
engagement and achievement for at-risk students:

6
Significant gains in achievement and engagement can occur for underserved
students in learning environments characterized by computer use that engages
students in interactive learning that offers multiple representations of ideas and
real-time digital feedback, as well as opportunities to apply learning as they create
content. (p. 145)
While the aforementioned research demonstrates promise for advocates of 1:1 devices, is
it enough to convince taxpayers to invest significant money into the devices with no
proof that the investment yields suitable returns? In some school districts throughout the
nation, the taxpayers were not convinced. For example, constituents in the Kyrene
School District in Arizona narrowly voted against extending a $33 million dollar
technology initiative instituted in 2005 (Richtel, 2011). Why? They did not see the
returns they expected on the investment in 1:1 devices and were dismayed by the cuts to
other areas that resulted from the technology purchases.
The big business of high-stakes testing in education still remains at the forefront
of the minds of public school administrators, if not those of taxpayers. Accordingly, the
digital age has resulted in more cost-effective digital assessments that yield data more
quickly. These evaluations pose a significant problem for impoverished school districts
that lack the funding to buy the technology necessary to support these assessments, thus
creating a digital divide between low wealth and more affluent school districts. Is this
lack of funding fostering even more of an achievement gap? At the federal level, it
appears that President Obama and his cabinet understand the importance of technology
integration in school systems. The Obama administration’s ConnectEd Initiative was
designed to redirect $2 billion in federal funding to put high-speed broadband in all U.S.
schools by 2017 (Garland, 2014). Schools, however, must spend money for devices to

7
utilize this perk. Today, the federal government provides only about 14% of the money
for school districts from elementary through high school; more than half of the funding
comes from local sources, especially property taxes (Porter, 2013).
This is where the digital divide deepens. The nationwide average per pupil
spending is $10,608 (Frohlich, 2014); however, the gap between the states spending the
most and the least is significant. New York, for example, spends over $19,000 per pupil
on average, whereas North Carolina, which is toward the bottom of the list, spends
$8,200 per pupil on average (Frohlich, 2014). This statistic is especially distressing for
rural school districts in eastern North Carolina where income from property taxes is
significantly lower than that in other counties in the state and nation. According to the
2014 National Report Card by the Education Law Center, in the five most regressive
states (North Carolina is a regressive state), the poorest districts receive at least 20% less
funding than wealthier districts (Baker, Sciarra, & Farrie, 2014). Thus, low-wealth
districts like District Z must ensure that technology, when available, is used consistently
throughout the core curriculum to produce positive results.
In addition to the issue of needing devices to even the playing field for high-
stakes testing, there is the student engagement aspect of 1:1 devices. To actively engage
students, educators across the country have recognized electronic devices as instrumental
tools in meeting student needs (Fredricks et al., 2011). A study cited by Darling-
Hammond et al. (2014) included several ninth-grade English classrooms that included a
large number of at-risk students, including some who previously had failed English and
others who were predicted to fail the state’s ninth-grade reading test. The teacher used
1:1 technology to have the students create blogs, research-based websites, presentations,
etc. to help prepare them for the state test. The results were impressive. The 1:1

8
technology classrooms with at-risk students outperformed their higher-track counterparts
(some including AP students) who did not use technology before the state test (Darling-
Hammond et al., 2014).
Importance of Study to Middle School Students
A plethora of published research highlights the critical nature of the middle school
years; it is the time when students’ future academic fate is most at risk. The Maryland
Middle School Steering Committee (2008) report indicated that in both Maryland and
nationwide, the middle school years are when “students’ progress slows, performance
declines, and gaps persist” (p. 1). Quoting statistics from the 2007 National Assessment
of Educational Progress (NAEP) (Lee, Grigg, & Dion, 2007), the report highlighted
significant declines in academic achievement for middle school students versus their
elementary school years. For example, in 2007, NAEP statistics indicated that only 34%
of eighth graders were proficient or better in reading, 7% lower than the fourth-grade
reading average; and 39% of eighth graders were proficient or better in math, 6% lower
than the fourth-grade math average. The 2007 NAEP statistics for poor and minority
students were even more dismal with a mere 13% of African-American students
proficient or better in reading and 12% of African-American students proficient or better
in math. Regarding students categorized as socioeconomically disadvantaged, only 16%
were proficient or better in reading, and only 17% were proficient or better in math
(Maryland Middle School Steering Committee, 2008, p. 1). The 2015 NAEP statistics
regarding the nation’s eighth graders show results similar to the 2007 statistics
highlighted in The Critical Middle with a slight increase in reading scores for African-
American students to 16% as well as math scores to 13%. On average, students eligible

9
for the National School Lunch Program (NSLP) scored 28% lower than their peers who
did not qualify for the NSLP (NAEP, 2016).
According to the Maryland Middle School Steering Committee (2008), a sixth
grader who exhibits just one of the following signs had only a 10% chance of graduating
on time and a 20% chance of graduating a year later: poor attendance, poor behavior, or a
failing grade in math or English. Despite this alarming outlook, middle school students
were still optimistic about their futures. A 2007 poll of middle school students reported
that 93% said there was no chance they would drop out of high school; 92% said they
either definitely or probably would go to college (Maryland Middle School Steering
Committee, 2008, p. 2).
Adolescent learners desire meaningful connections to their learning and relevance
between what they are learning and their future lives. When adolescents are excited
about what they are learning, they are more likely to be engaged in learning, which in
turn means they are more likely to achieve (Maryland Middle School Steering
Committee, 2008, p. 4). Personal technology devices allow students to apply their
learning to real-world problem solving; connect them with positive role models
worldwide to whom they would usually not have access; and foster participation in
projects that make a difference in their community, nation, and world (Maryland Middle
School Steering Committee, 2008). So how do the Maryland Middle School Steering
Committee’s findings relate to the researcher’s study? For this study, the researcher
analyzed and described the responses of middle school students regarding the frequency
of use of technology and their perceptions of the importance of 1:1 technology to
learning. Hopefully, the findings will encourage educators to enhance student learning
by channeling the power of 1:1 technology into daily instructional practices. The 1:1

10
devices might be the means to make learning relevant for middle school students and
keep them from becoming statistics.
Context of the Study
The setting of the study, a rural, low wealth eastern North Carolina public school
district with five middle schools, is comprised of 1,200 students from diverse racial and
socioeconomic backgrounds. District Z implemented a 1:1 initiative in the five schools
during the 2014-2015 school year. At this study’s onset, the researcher was an assistant
principal at one of the district’s middle schools.
Methodology
Descriptive research, the methodology used in this study, is “aimed at finding out
‘what is’, so . . . survey methods are frequently used to collect descriptive data” (Spector,
Merrill, Elen, & Bishop, 2008, p. 41). Studies of this type are “aimed at casting light on
current issues or problems through a process of data collection that enables them to
describe the situation more completely than was possible without employing this
method” (Fox & Bayat, 2007, p. 45). Descriptive studies can involve a one-time
interaction with the subjects. To collect the data necessary to answer the research
questions, the researcher adapted items from two online surveys, one university survey,
and a published book. The researcher then developed other items essential to answering
the questions that guided the study. Notations on the bottom of the actual survey identify
the source of specific questions and permissions granted to use questions from sources
other than the researcher (see Appendices A and B). Because the study involved
students, the researcher requested and was granted permission from the Institutional
Review Board. Next, using student volunteers from two schools, the researcher

11
conducted a pilot study to validate the survey instrument. Students who participated in
the pilot study took the online survey. Afterwards, the students were given a hard copy
of the survey and instructed to highlight survey terms they found difficult to understand
or felt needed clarification. The researcher used student feedback to revise and validate
the survey before administering it to other students in the five schools who volunteered to
complete the survey. The pilot study participants were not included in the administration
of the final survey.
The researcher administered the 15-question survey through Survey Monkey to
1,122 middle school students in the five schools located in District Z. Those who
participated in the pilot study, were absent on the day of administration, or opted out of
completing the survey were excluded. Because the survey was online, the results were
available quickly. Survey Monkey provided the percentages, central tendency (mean),
and standard deviation to display data and assign meaning.
To select participants, the researcher used convenience sampling. Convenience
sampling simply means that the study subjects were convenient. At the time of the study,
the researcher served as assistant principal in one of the district’s middle schools.
Definition of Key Terms
The researcher provided the following definitions to clarify the language
throughout this dissertation.
1:1 computing.
An environment in which students use computing devices, such as wireless
laptops or tablet PC computers in order to learn anytime and anywhere. Yet, the
focus is not on the technology. It is about the paradigm shift in how instruction is

12
delivered, and the spark that is created in students which provides a new sense of
enthusiasm and ownership in their learning. (“How to Best Define the 1:1
Classroom,” 2014, para. 7)
1:1 technology. Programs that provide all students in a school, district, or state
with their own laptops, netbooks, tablet computers, or other mobile-computing devices
(McLeod & Sauers, 2012).
Adequate yearly progress (AYP). “AYP is an individual state’s measure of
yearly progress toward achieving state academic standards . . . the minimum level of
improvement that states, school districts and schools must achieve each year” (“Glossary
of Terms: Adequate Yearly Progress,” 2004, para. 3).
Convenience sampling. According to Suen, Huang, and Lee (2014),
Convenience sampling is a non-probabilistic sampling technique applicable to
qualitative or quantitative studies, although it is most frequently used in
quantitative studies. In convenience samples, subjects more readily accessible to
the researcher are more likely to be included. (p. 105)
Descriptive research. Research characterized by the deliberate and systematic
articulation and analysis of issues lacking clarity (Butin, 2010). Descriptive research is
“aimed at casting light on current issues or problems through a process of data collection
that enables them to describe the situation more completely than was possible without
employing this method” (Fox & Bayat, 2007, pp. 69-70).
Descriptive statistics.
Statistics that constitute the basic features of the data in a study, simple
summaries about the sample and the measures, that provide a way to present
quantitative descriptions in a manageable form, to simplify large amounts of data

13
in a sensible way. (Trochim, 2000, p. 15)
Digital divide. A term that refers to the growing gap between the underprivileged
members of society, especially the poor, rural, elderly, and handicapped portion of the
population who do not have access to computers or the internet; and the wealthy, middle-
class, and young Americans living in urban and suburban areas who have access
(Roberts, 2004, p. 233).
District Z. This district, a low wealth school system located in rural eastern
North Carolina, has five middle schools and a diverse student population.
Infrastructure. The basic underlying framework or features of a system or
organization (Flexner & Hauck, 1987).
Low wealth. A term that refers to counties that do not have the ability to
generate local revenue to support public schools (Cook, Fowler, & Harris, 2008).
Methodology. “Methodology is the philosophical framework within which the
research is conducted or the foundation upon which it is based” (Brown, 2006, p. 12).
Middle school student. A student enrolled in sixth, seventh, or eighth grade in
school District Z.
NSLP. NSLP is “a federally assisted meal program operating in over 100,000
public and non‐profit private schools and residential child care institutions. It provided
nutritionally balanced, low-cost or free lunches to more than 31 million children each
school day in 2012” (Food and Nutrition Services, 2013, para. 1).
Quantitative research. The use of standardized measures to separate statistical
data that incorporates testing scores, classroom climate reports, and other archival data in
addition to classroom climate and student achievement variables (Leedy & Ormrod,
2009).

14
Student achievement.
The most common indicator of achievement generally refers to a student’s
performance in academic areas such as reading, language arts, National
Assessment of Educational Progress (NAEP) scores . . . student achievement has
three dimensions: Mastery of Academic Skills and Content, High Quality Work,
and Character. (National Conference of State Legislatures, 2012, p. 1)
Standard deviation. A term that means the values in the statistical data set are
either close to the mean or farther from the mean on average (Rumsey, 2016).
Statistical Package for Social Sciences (SPSS). Developed by SPSS, Inc. and
acquired by IBM in 2009, SPSS is “The Statistical Package for the Social Sciences
(SPSS), . . . a software package used in statistical analysis of data in a number of fields”
(“Statistical Package for the Social Sciences,” 2016, para. 1).
Student engagement. In education, student engagement refers to the level of
attention, curiosity, interest, optimism, and passion that a learner shows during
instruction (Kezar & Kinzie, 2006).
Technology devices. In the context of computer technology, a device is a unit of
hardware, outside or inside the case or housing for the essential computer (processor,
memory, and data paths) that is capable of providing input to the essential computer or of
receiving output or of both (Rouse, 2005).
Technology integration. Integration is a term that refers to the use of technology
in schools where the lines between cognitive tools, teaching, learning, and technology are
more than blurred. In other words, they are so well integrated that they are inseparable
(Weston & Bain, 2010).
15
Limitations of the Study
The study focused on 1,200 middle school students (Grades 6, 7, and 8) in a rural,
low wealth North Carolina school district who were chosen for their accessibility.
Therefore, the findings of this study may not be generalizable to other environments (i.e.,
other middle schools or urban or suburban populations). It also may not be applicable to
larger or smaller populations or other sample groups such as elementary or high school
students.
Requesting middle school students to report their behaviors may be subject to
participant bias. The participants may have been susceptible to responding in ways that
they perceived favorable to teachers or administrators rather than being honest. At the
time of this study, the researcher was an assistant principal in one of the middle schools
in this study. Implementing anonymity was intended to eliminate these limitations.
Conclusion and Organization of the Dissertation
Many schools desire a structured and innovative way to address the lack of
student engagement and academic performance. According to Akyürek and Afacan,
(2012), 1:1 technological initiatives can significantly affect test scores and other student
achievement data. District Z, a low wealth school district in eastern North Carolina,
allocated funding to implement a 1:1 initiative in all five of the middle schools in the
district with the anticipation of positively affecting student achievement. At the time of
this writing, no data were available to the stakeholders and policymakers that described
the frequency of use of the devices or clarified the importance of the technological
devices to the learning of the middle school students.
This study was designed to clarify and describe to the policymakers and

16
stakeholders of School District Z how frequently students use the 1:1 technology, how
frequently teachers and students use technological devices, and finally whether the
students believe that technology access was important to their learning. The chapters of
this study are organized as follows. Chapter 1 presented the introduction to this study.
Chapter 2 presents the related literature. Chapter 3 describes the collection and analysis
of the data. Chapter 4 presents the findings from the data analyses, and Chapter 5
summarizes the descriptive data and the researcher’s professional perspective.

17
Chapter 2: Review of Literature
Introduction
District Z, a rural, low wealth school district in North Carolina, funded a 1:1
technology initiative in its five middle schools during the 2014-2015 school year. Each
student was given a Chromebook that could be taken home in order for the District to
determine if the technology would engage students in the pursuit of academic
achievement. As with most school districts, the school system had already spent
thousands of dollars providing basic technology such as computers for classrooms or
labs, but this 1:1 initiative was a major innovation for the county. In the process of
structuring this initiative, the district failed to develop a system to provide evaluative data
to the stakeholders and policymakers. Among the data needed for evaluation and
decision making was the frequency of use of the 1:1technology, the frequency that
previously purchased technological devices were being used, and the importance to
learning that middle school students placed on access to technology. This study sought to
provide the missing data and was guided by the following three questions.
1. How frequently do middle school students in District Z use 1:1 technology?
2. Do the middle school students in District Z believe that technology access is
important to their learning?
3. How frequently do middle school teachers and students in District Z use other
technological devices?
In this chapter, the researcher developed a conceptual framework for 1:1 laptop
initiatives that examined student engagement and student achievement. This framework
is grounded in literature on the history of technology in education, the related research on
1:1 laptops in school districts, case studies of 1:1 laptop initiatives, and what experts

18
determined as successes and failures of 1:1 laptop initiatives that focused on student
engagement and student achievement. As stated in Chapter 1, 1:1 laptop initiatives are
huge investments that many school districts are exploring with the hope of harnessing the
power of technology to increase student engagement and, ultimately, increase student
achievement, yet school districts considering 1:1 initiatives are still faced with questions.
Are students using the existing technology frequently enough? Do students perceive
technology access as being important to learning? Will the benefits to student
achievement of a 1:1 technology initiative justify the cost?
Although 1:1 laptop programs have been implemented for over a decade, many
scholars describe the research regarding their effectiveness as limited. The research
related to 1:1 laptop effectiveness presents a dilemma for underfunded school districts
that are financially strapped, yet these schools must equip students with the tools needed
to bridge the digital divide between economically advantaged and disadvantaged
students. While current research may suggest that 1:1 laptops increase student
engagement, measuring student engagement is somewhat subjective. Additionally, the
literature on the impact engagement has on achievement is not clear. The literature
reviewed in this chapter examined the instructional approaches in traditional settings
versus 1:1 settings and how these approaches positively or negatively affected
engagement and achievement.
Review of Related Literature
Historical Overview of Technology in Education
Over the past 3 decades, school districts throughout the nation have made
considerable progress toward the implementation and integration of new technology.

19
By 2009, 97% of classrooms had one or more computers, and 93% of classroom
computers had Internet access. For every 5 students, there was one computer.
Instructors stated that 40% of students used computers often in their educational
methods, in addition to interactive whiteboards and digital cameras. College
students nowadays are rarely without some form of computer technology: 83%
own a laptop, and over 50% have a Smartphone. (“The Evolution of Technology
in the Classroom,” 2016, para. 13)
The most substantial growth in technology integration within schools has transpired over
the past 15 years, fueled in part by the federal initiative entitled Technology Literacy
Challenge Fund. In 1996, former President Bill Clinton “launched a national mission to
make all children technologically literate by the dawn of the 21st century, equipped with
communication, math, science, and critical thinking skills essential to prepare them for
the Information Age” (Technology Literacy Challenge, 1996, p. 1). Over the past
decade, changes in infrastructure, the parallel growth of home computing and the
Internet, and continuous educational technology plans by the U.S. Department of
Education have affected teachers and classrooms (McLeod & Richardson, 2013).
The substantial growth of technology in education can best be highlighted by the
statistics below. In 1994, only 3% of public classrooms, computer labs, and libraries had
Internet access (McLeod & Richardson, 2013). By 2008, 97% of public classrooms had
Internet access. The student-to-computer ratio had also decreased drastically. In 1996,
the average ratio was 11:1; and by 2009, the ratio was 7:1 (McLeod & Richardson, 2013).
However, with bring your own device ( BYOD) and 1:1 initiatives spreading rapidly
throughout American public education, the ratio of students to devices is trending in a

20
pattern that one may soon see a 3:1 or even a 2:1 ratio (McLeod & Richardson, 2013). In
2002, .5% of students were enrolled in an online course; while today, 5% take at least one
online course (McLeod & Richardson, 2013). Finally, teachers are using technology at a
vastly increased rate as well. In 1999, less than 10% of teachers used the Internet to
access research and best practices. Ten years later, a staggering 94% of teachers used
computers often or sometimes for classroom, instructional, or administrative tasks
(McLeod & Richardson, 2013). With this drastic change in access to technology, the
shift is moving from whether schools should have technology to how the technology is
being used (McLeod & Richardson, 2013).
With the recognition that our students live in a digital world, the current trend in
educational technology is 1:1 laptops or other devices. Basically defined, 1:1 means that
each student is provided a laptop or other device by the school that he or she can take
home, thus giving the student access to technology both during and after the school day
(McLeod & Sauers, 2012). Both proponents and opponents of educational technology
agreed that the full impact of computers in education will not be realized until computers
are not a shared resource, thus the 1:1 initiative is a current and growing trend in
education (Bebell & Kay, 2010).
Research on 1:1 Laptop Initiatives
According to Spies, Kjos, Miesner, Chestnut, and Fink (2010), there are three
tenets regarding integrating technology into the classroom. First, the millennials were
born during the computer age, and these students have grown up with an awareness of
technological advances. Second, research suggested that if technology is promised,
student commitment levels increased. Finally, researchers suggested that classrooms

21
should simulate real-life application as much as possible. Using the 1:1 technology and
simulating realistic situations caused learners to believe that learning was relevant and
was pertinent to real-life situations (Spies et al., 2010).
The data results of this descriptive study may suggest to decision makers the
advantages of middle school students accessing technology as a powerful learning tool.
Nevertheless, a gap in the literature revealed that conclusive data do not exist.
Supplemental studies suggest that the implementation of 1:1 technological initiatives may
produce academic gains in writing and mathematics. In addition, data suggested that
policymakers, researchers, and practitioners, especially those who are interesting in
filling the digital divide, might investigate 1:1 initiatives (Roschelle, Pea, Hoadley,
Gordin, & Means, 2000; Wells & Lewis, 2006).
There have been many educational initiatives designed to reform education and
increase student achievement, yet, “few modern educational initiatives have been as
widespread, dramatic, and costly as the integration of computer technologies into
American classrooms” (Bebell & Kay, 2010, p. 5). Proponents of educational technology
believe that the increased use of computers will ultimately result in better teaching and
learning, improved efficiency, and the development of important skills in students
(Bebell & Kay, 2010). Consequently, 1:1 laptop initiatives have exploded over the past
decade with school districts investing countless dollars into what they hoped to be the
bridge over the digital divide in learning between economically advantaged and
disadvantaged students. While research on 1:1 effectiveness is relatively new, the results
of 1:1 laptop effectiveness were diverse and inconsistent (Goodwin, 2011).
When 364 leaders of large school districts with 1:1 initiatives were surveyed in
2008, 33% believed the laptops were having a significant effect on student achievement,

22
while 45% believed the laptops were only having a moderate effect on student
achievement (Goodwin, 2011). These statistics mirror achievement results from several
of the largest 1:1 laptop initiatives over the past decade. For example, after 5 years of
laptop implementation, Maine found little to no effect on student achievement except in
one area, writing (Goodwin, 2011). In Texas, researchers noted slightly higher growth in
math but no growth in reading and a slight decline in writing achievement (Goodwin,
2011). In Michigan, four laptop immersion schools showed gains in achievement, while
three posted declines in achievement (Goodwin, 2011). What does this data mean? The
most precise conclusion that can be reached was that the laptops were only as effective as
the school personnel and students who implemented them. Bebell and Kay aptly
summarized, “It is impossible to overstate the power of individual teachers in the success
or failure of one-to-one computing” (Goodwin, 2011, p. 78).
With this in mind, it is critical to note the findings of a 10-year study by Rockman
(2003) on 1:1 laptop initiatives. Rockman’s research indicated that teachers in 1:1
classrooms spent less time in large or whole group work, lectured less, implemented
more small group and individual project work, and collaborated more with other teachers
(McLeod & Sauers, 2012). Could the inconsistencies in achievement be more of a
reflection of instructional practices and less about laptops and effectiveness? Many
experts in education agree that the answer is yes, that 1:1 laptop effectiveness hinges on a
plethora of factors. A 2010 study of 997 schools across the United States identified nine
factors that, if present, appear to contribute to higher levels of achievement. The top
three factors included ensuring uniform technology integration in every class, providing
time (at least monthly) for teachers to collaborate and learn, and using technology daily
for online student collaboration and cooperative learning (Goodwin, 2011). These factors
23
align with the conclusion regarding technology and business that author Jim Collins
wrote in his book Good to Great, “Technology alone never holds the key to success.
However, when used right, technology is an essential driver in accelerating forward
momentum” (Goodwin, 2011, p. 78). In summary, educational leaders must change the
way they look at laptops. Instead of seeing laptops as the solution to all of their
achievement woes, they must view them as a tool that enhances research-based
instructional practices that have been proven to increase student achievement.
Although early research studies on 1:1 laptop initiatives portray mixed results
regarding student achievement, many other positive outcomes have been noted.
Increased student engagement was recorded in virtually all research studies. Other
positive outcomes included decreased disciplinary problems; a movement towards
student-centered classrooms; increased use of laptops for research, analysis, and writing;
and a change in student behaviors at home, most notably more time spent doing
homework and less time spent watching television (Goodwin, 2011).
Despite many documented positive outcomes, 1:1 laptop initiatives have many
critics. In fact, the term techno-critics has been coined to describe those who have
questions, concerns, and issues regarding 1:1 laptop immersion in classrooms. One well-
respected techno-critic, education reformer Larry Cuban (2006), openly admonished 1:1
advocates who claim that laptops led to improved learning, better teaching, and students
getting better jobs. In his article, Cuban argued that any gains in student achievement in
1:1 settings were likely the result of innovative teaching and individualized problem-
based instruction. Might this explain the inconsistent gaps in achievement between
schools, subjects, and teachers with seemingly similar demographics and settings?
Cuban and other techno-critics agreed, comparing 1:1 laptop initiatives to other

24
educational reform initiatives with equally lackluster results (Weston & Bain, 2010).
In order to make educational reforms such as 1:1 laptop initiatives affect teaching,
learning, and achievement, Cuban (2006) argued that more research should be conducted
and published on proven methods that actually do significantly impact student learning
and achievement. This research could serve as a model to change what Cuban coined
“uninspired” use of technology by both teachers and students in school (Weston & Bain,
2010). Fortunately, techno-critics viewed 1:1 laptops as the most promising chance for
much needed educational reform. However, this reform requires a new vision and way of
thinking. Instead of seeing the laptops as the final or only solution, educators must view
technology as a tool or vehicle to drive the change. According to research conducted by
David Jonassen, Professor of Education at the University of Missouri, “When technology
enables, empowers, and accelerates a profession’s core transactions, the distinctions
between computers and professional practice evaporate” (Weston & Bain, 2010, p. 10).
Jonassen compared laptops to education with Computer Assisted Design (CAD) to
engineers or scalpels to surgeons, just tools used in their practice. However, for the most
part, educators are not currently using laptops as a cognitive tool but as a substitute tool
to automate processes (Weston & Bain, 2010).
How can 1:1 laptop initiatives be the tool that drives change? First, the
technology device must be viewed as a cognitive tool. These tools should be used to
accelerate, differentiate, deepen, and maximize learning experiences for all students.
Teachers would use these tools to design, deliver, and manage research-based practices
that have been proven to significantly impact student achievement such as cooperative
learning, differentiated instruction, and problem or project-based learning. The cognitive
tools would be holistically integrated into the learning processes of the entire school, not

25
just pockets of teachers here and there in isolation, and used daily by students, parents,
and teachers to collaborate regarding the next steps in their “collective pursuit” of
learning. These collective decisions would be driven by real-time data mined daily with
ease because of the transformative use of the cognitive tools (Weston & Bain, 2010).
The big question now is how to shift the paradigm from laptops as the reform to laptops
as cognitive tools that can be employed to drive change that results in significant gains in
learning and achievement.
According to Weston and Bain (2010), the shift begins from the bottom up when
the school community comprised of students, teachers, school leaders, and parents
develop an explicit set of simple rules that define what they believe about teaching and
learning. These rules are not a mission statement but drivers for the design of the school
and all learning that occurs within the school. These drivers could include how they feel
about cooperation, feedback, etc. The entire school community then “deliberately and
systematically uses its rules to embed its big ideas, values, aspirations, and commitments
in the day-to-day actions and processes of the school” (Weston & Bain, 2010, p. 12) from
how desks are arranged in classrooms to what technology is integrated to what
professional development is offered. Each member of the school community, including
students, would be actively involved in creating, adapting, and sustaining the embedded
school design with clearly articulated roles and responsibilities, thus creating buy-in, a
key component missing from many educational reforms that are done to educators, not by
them (Weston & Bain, 2010).
Consistent and continuous feedback is another essential element of the new
paradigm. The feedback is generated from all members of the learning community and
either reinforces what works or helps drive decision making to sustain continuous

26
learning. The feedback is the catalyst for bottom-up change, not top-down change which
is the unfortunate norm in education. Consequently, the school’s framework for learning
is dynamic, ever-evolving, and improving from feedback given by all stakeholders
(Weston & Bain, 2010).
Finally, and most relevant to the role that 1:1 laptops play in achieving this
paradigm, is that the school demands “systemic and ubiquitous” use of technology, not
the spotty and inconsistent use highlighted in many of the case studies of 1:1 laptop
implementation cited by the researcher (Weston & Bain, 2010). The laptops, functioning
as cognitive tools, helped the school community design and deliver the curriculum, gather
and share feedback, create portfolios, enable research for depth of understanding, engage
parents, and so much more. Since cognitive tools (laptops in this case) were part of the
embedded culture of the school; there is never the issue of “getting teachers to use them”
(Weston & Bain, 2010). Technology use was an explicit aspect of the school’s culture
that was demanded, not suggested. To sum it up, “in schools with cognitive tools,
teaching, learning, and technology are more than blurred” (Weston & Bain, 2010, p. 13).
In other words, they are so integrated that they are inseparable (Weston & Bain, 2010).
To conclude, research on the effectiveness of 1:1 laptop initiatives appeared
promising in some areas but contradictory and inconclusive regarding student
achievement, which is generally the end goal for the laptop initiatives. However, techno-
critics did not see the 1:1 initiatives as a failure but as “fertile ground” for the educational
reform districts are so passionately seeking. Instead of scrapping 1:1 technology, as often
happens in the swinging pendulum of educational reform, it must be viewed as an agent
of change that can be used as a tool to achieve the Holy Grail all educators seek, dramatic
and sustaining student learning achievement. Current research on 1:1 initiatives missed

27
the mark but presented opportunity for relevant future research that measures the impact
of laptops as a cognitive tool in a “new vision” learning community (Weston & Bain,
2010).
Overview of Case Studies/Background and Methodology
While research on the effectiveness of 1:1 laptop initiatives is fairly new,
keyword searches produced many similarities in a variety of formats such as journal
articles, published reports, books, and articles. While several case studies were
referenced, a few were explored in greater detail: the Berkshire Wireless Learning
Initiative in Massachusetts (BWL Initiative), the Texas Immersion Program (TIP), and
the Maine Learning Technology Initiative (MLT Initiative). All of these case studies
featured 1:1 laptop immersion in middle school settings and measured both student
engagement and student achievement, thus making the studies relevant to questions posed
by the researcher.
BWL Initiative. The BWL Initiative was a 3-year pilot program in which every
student and teacher in five middle schools in western Massachusetts were provided
laptops beginning in 2005. In addition to the laptops, all classrooms were equipped with
wireless networks, select classrooms were given LCD projectors, and teachers were
provided both technical and curricular support to help integrate technology in the
classrooms. The BWL Initiative was launched midway through the 2005-2006 academic
year and lasted through the end of the 2007-2008 academic year. The $5.3 million
program was funded through a combination of district and state funds combined with
local business investments. The project was designed to “determine the efficacy of a
one-to-one laptop initiative in transforming teaching and learning in a traditional middle

28
school setting” and included explicit targeted outcomes (Bebell & Kay, 2010, p. 7).
These outcomes included enhanced student achievement, improved student engagement,
improved classroom management, enhanced student capability for research and
collaboration, and fundamentally transformed teaching strategies and curriculum delivery
(Bebell & Kay, 2010).
In the BWL Initiative, a mixed-methods research study was employed,
incorporating both qualitative and quantitative data from the five experimental schools
along with two control schools from neighboring public middle schools with similar
demographics. Three cohorts of students were followed for 3 years, beginning in early
January 2006, when all seventh-grade students in the experimental schools received
Apple laptops to use for the duration of the school year. In the first months of the second
and third years of study, each student in Grades 6, 7, and 8 in participating schools was
provided a laptop for the majority of the school year. In order to track the impact of 1:1
laptops on teaching and learning, researchers conducted teacher and student surveys (pre
and post), teacher interviews, classroom observations, and analysis of student drawings,
records, and test scores (Bebell & Kay, 2010).
Student surveys were web-based and given to both BWL Initiative and control
group students both before and after the 1:1 laptop implementation. Survey questions
revolved around the frequency and variance of technology use both in and outside of the
classroom and across the curriculum. The survey also included demographic items and a
brief inventory of attitudes and beliefs. During the first year of implementation, only
seventh-grade students were administered the survey, with 574 students across the
schools completing the presurvey and 524 students completing the postsurvey. After
1,839 of 1,898 students in Grades 6 through 8 were provided laptops in year 2 (2007), the

29
students completed the online survey. In the final year of the case study, all students in
both the BWL Initiatives and the two control schools were administered the survey, with
98.7% of BWL Initiative students and 74.6% of control school students actually
completing it (Bebell & Kay, 2010).
Web-based surveys were also given to both BWL Initiative and control school
teachers before (pre) and after (post) using 1:1 laptops in the classroom. The teacher
survey was designed to capture the variety and extent of technology use; the teacher’s
attitude towards technology, teaching, and learning; and the teacher’s beliefs regarding
the effect of the 1:1 pilot program. Each teacher was surveyed both pre and post 1:1
laptops in all BWL Initiative and control schools with a response rate of 97.6% in BWL
Initiative schools and 57.6% in control schools (Bebell & Kay, 2010).
Other forms of qualitative data utilized included classroom observations
conducted by the research and evaluation team over the 3 years of implementation,
informal interviews of teachers, formal and informal interviews of principals and other
building and district leadership, and student drawing activities. Students were asked to
draw themselves “writing in school” both before and after 1:1 laptop implementation.
Over 3,500 student drawings were analyzed using an emergent analytic coding process
established through previous student drawing and research studies (Bebell & Kay, 2010).
Quantitative achievement data were pulled from the Massachusetts Department of
Education from 1998-2008. The methodology is explained later in the student
achievement section. Additionally, students were given an experimental writing
assessment that is outlined in the achievement section (Bebell & Kay, 2010).
TIP. With the goal of immersing schools in technology by providing tools,
training, and support for teachers to fully integrate technology in their classrooms, TIP

30
was initiated in 2003 by the Texas legislature (Argueta, Corn, Huff, & Tingen, 2011).
The legislative mandate was funded with over $20 million in federal money, and schools
applied for money through a competitive grant process. Research was conducted on 42
middle schools from rural, suburban, and urban settings in Texas. Three student cohorts
were followed over 3 years and were comprised of predominantly minority (65%) and
economically disadvantaged (67%) students. The overarching purpose of the study was
to scientifically examine the effects of 1:1 laptop immersion in regards to increasing
middle school student achievement in core academic subjects (math, science, language
arts, social studies) as measured by the Texas Assessment of Knowledge and Skills,
henceforth referred to as TAKS (Garner, 2012).
Prior to laptop distribution, researchers conducted site visits at each of the TIP
schools to gather data on existing conditions in order to establish comparability between
treatment (TIP) and control schools. Then the researchers documented technology
access, technical and pedagogical support, professional development practices, and
teacher and student technology use. During the site visits, educators, both teachers and
administrators, expressed dismay over the lack of involvement in the decision-making
process for TIP, thus indicating a lack of buy-in. A plethora of issues that might possibly
jeopardize the success of the pilot were noted as well, including internet access problems,
limited technical support, ineffective professional development that centered on computer
literacy rather than effective, research-based technology integration, and minimal and
low-quality technology use by teachers and students (Texas Center for Educational
Research, 2006).
Researchers used the compiled data to carefully match immersion and
nonimmersion schools, 22 of each, based on size, regional location, demographics, and
31
student achievement. The selected TIP schools employed approximately 1,300 teachers
with 18,000 students in Grades 6 through 8 with a large minority and economically
disadvantaged presence. Researchers collected data in a variety of ways such as building
walkthroughs; campus inventories; and interviews with principals, technology
coordinators, central office administrators, teachers, and students. They also used TAKS
data to measure achievement (Texas Center for Educational Research, 2006).
All TIP participants, educators and students, were provided with “immersion
components,” including a wireless mobile computer that ensured on-demand access to
technology. In addition, they were given productivity, communication, and presentation
software; online instructional resources that supported the Texas curriculum for core area
subjects; online assessment tools for diagnosis of student strengths and weaknesses;
professional development for technology integration; and ongoing technical support
(Texas Center for Educational Research, 2006).
At the end of year 1 of implementation, researchers discovered that none of the
TIP schools had fully implemented the immersion components provided to them. Rollout
delays; varied access to technology; and a plethora of hardware, software, and Internet
maintenance issues resulted in some students only having access to laptops for 72 days.
In addition, some schools would not let students take the laptops home, while other
schools did. The level of tech support varied widely from school to school as well, often
leaving teachers to support each other with ideas for technology integration. While
professional development on technology integration was provided by vendors the first
year, many teachers had difficulty retaining the content and reported being exposed to
“too much in a short period of time,” leaving them overwhelmed (Texas Center for
Educational Research, 2006, p. 4).

32
Despite the shortcomings of year 1 of immersion, researchers continued to follow
the three cohorts of students for the 3 years of the pilot. A quasi-experimental research
design was to address a number of questions. What are the characteristics of
participating schools? How is technology immersion implemented? What is the effect of
technology immersion on schools? What is the effect of technology immersion on
teachers and teaching? What is the effect of technology immersion on students and
learning? Does technology immersion impact student achievement? (Texas Center for
Educational Research, 2006). The first two questions were addressed in the 2005
academic year, while the remaining questions were addressed in subsequent years (Texas
Center for Educational Research, 2006). The findings from this study are discussed later
in this chapter.
MLT Initiative. The MLT Initiative was the vision of Angus King, the state’s
former governor, who believed that “if Maine wanted to prepare Maine’s students for a
rapidly changing world, and wanted to gain a competitive edge over other states, it would
require a sharp departure in action from what Maine had done in the past” (MLT
Initiative Research and Evaluation Team, 2011, p. 2). In late 1999, a one-time state
surplus provided the opportunity to make the vision a reality. A task force was convened
to research issues and recommend a course of action. The task force concluded “in order
to move all students to a high level of learning and technological literacy, all students will
need access to technology when and where it can be most effectively incorporated into
learning” (MLT Initiative Research and Evaluation Team, 2011, p. 3). Phase one of
implementation began in the fall of 2002 with over 17,000 seventh graders and their
teachers in over 240 middle schools across the state of Maine receiving laptop computers
(MLT Initiative Research and Evaluation Team, 2011). Phase 2, implemented the

33
following year, consisted of all eighth graders and their teachers receiving laptops (MLT
Initiative Research and Evaluation Team, 2011). Each subsequent year thereafter, all
seventh- and eighth-grade students and their teachers received laptop computers (MLT
Initiative Research and Evaluation Team, 2011).
Shortly after the first rollout of laptops, the Maine Department of Education
implemented a professional development program to help teachers integrate technology
into the curriculum. Teacher training was of utmost importance to the success of the
MLT Initiative. As a result, each middle school selected and trained a teacher leader and
a technology coordinator to serve as building-level contacts and support for teachers. To
promote transformative technology integration, positions were also created for
curriculum and technology integration specialists (MLT Initiative Research and
Evaluation Team, 2011).
In order to conduct unbiased research on the effectiveness of the 1:1 laptop
initiative, the Maine Education Policy Research Institute (MEPRI), a nonpartisan agency,
was hired by the Maine Department of Education to conduct ongoing evaluation of the
MLT Initiative. The evaluation team utilized a mixed-methods approach that consisted
of both qualitative and quantitative techniques to collect and analyze research and
evaluation data and other evidence. Evidence was collected through online surveys, site
visits and observations, and research studies designed to assess the impact of the MLT
Initiative on student achievement in math, science, and writing (MLT Initiative Research
and Evaluation Team, 2011). A more detailed description of the achievement studies is
conveyed in the student achievement section.
1:1 laptops and student engagement. “Student engagement” has been a
buzzword in education for several decades. As defined by The Glossary of Education
34
Reform (2014), “student engagement is predicated on the belief that learning improves
when students are inquisitive, interested, or inspired, and that learning tends to suffer
when students are bored, dispassionate, disaffected, or otherwise disengaged” (para. 1).
As multiple research studies on learning revealed, a significant connection between
cognitive results such as test scores and noncognitive skills or factors such as
responsibility, curiosity, determination, and more, the term “student engagement” became
more relevant to educators; however, what defines “student engagement” is subjective
and varies from school to school, or even educator to educator. While one school might
acknowledge behaviors such as attending class or turning in work on time as engaged,
another school might observe more intangible behaviors such as curiosity, engagement,
or motivation as indicators of student engagement (The Glossary of Education Reform,
2014).
Over the past 30 years, the concept of student engagement has continued to gain
the interest of educational psychologists, researchers, and practitioners (Kezar & Kinzie,
2006). Student engagement is considered a relevant topic with regard to all students,
despite diversity (McGlynn, 2008). To some extent, the existing research literature
exhibits difficulties and limitations. So how do we define student engagement
collectively (Vibert & Shields, 2003)?
In education, student engagement refers to the level of attention, curiosity,
interest, optimism, and passion a learner shows while the instruction is being delivered
(Kezar & Kinzie, 2006). Some researchers believe that student engagement is dependent
upon the culture that surrounds the body of people in question (Kezar & Kinzie, 2006).
According to Vibert and Shields (2003), student engagement is a misnomer, suggesting
that engagement is located within the student. Students, like educators and other
35
stakeholders, are engaged in schools when schools are engaging places to be (Smith,
Donahue, & Viber, 1998).
This brief overview seeks to further identify key concepts within student
engagement as described by Dolan (2006): academic rigor that challenges the intellectual
and creative work central to student success; student participation in active and
collaborative educational opportunities; student interaction with educators in all
capacities; enrichment educational opportunities held both in and outside of the
classroom that augment the academic curriculum; and student perception of the learning
institution’s commitment to everyone’s success and whether the working environment is
positive (Dolan, 2006).
Massachusetts and student engagement. Among the targeted outcomes of the
BWL Initiative was increased student engagement. When Bebell and Kay (2010)
analyzed the impact of 1:1 laptop immersion in five Massachusetts middle schools,
teacher surveys revealed that they believed student engagement and motivation increased
during the laptop program (McLeod & Sauers, 2012). The results of the final survey
administered to teachers in the BWL Initiative pilot in June 2008 presented strong
evidence of increased student engagement across various student groups. Eighty-three
percent of teachers reported increased student engagement in traditional students; 84%
reported increased student engagement in low-achieving and at-risk students; and 71%
reported increased student engagement in high-achieving students. Principal feedback
mirrored the positive reports made by teachers; nearly all BWL Initiative principals
reported increased engagement, attentiveness, and motivation when students used the
laptops. During classroom observations, the BWL Initiative research and evaluation
team members observed behaviors that indicated increased student engagement. For

36
example, students would walk in and ask the teacher if the laptops were available. When
teachers responded yes, the students cheered and smiled. Student engagement was so
evident that it became a frequent practice at BWL Initiative schools to invite
policymakers, including Senator John Kerry, to observe the students (Bebell & Kay,
2010). Students also reported increased engagement when teachers used “cool”
technology presentations to present curriculum (Bebell & Kay, 2010).
Texas and student engagement. Although the TIP goal was to increase student
achievement, reports of increased student engagement were widespread. Administrators,
teachers, and students in every single immersion school stated that the 1:1 laptops
increased student engagement. Principals stated that “students sought every free minute
that they get in class” to use the laptops (Texas Center for Educational Research, 2006, p.
93). Teachers said that students were more interested and engaged when activities
involved the laptops, even citing specific indicators of engagement such as being on task
more, complaining less, and participating more, especially in the case of shy students,
English Language Learners, and “troublemakers.” Students also echoed the opinions of
administrators and teachers, stating increased enjoyment, interest, and self-esteem when
learning with the laptops (Texas Center for Educational Research, 2006).
Maine and student engagement. MLT Initiative evaluators reported more
engaged students who were more actively involved in their own learning. Furthermore,
higher levels of engagement were witnessed in critical student groups such as special
needs students, students with disabilities, and at-risk, and low-achieving students. Maine
students echoed the sentiments of the teachers, expressing “an increase in interest in their
school work and an increase in the amount of work they were doing both in and outside
of school” (Argueta et al., 2011, p. 7). Maine students even commented that, despite the

37
additional work and time required on technology-rich projects, the projects were more
engaging (Argueta et al., 2011).
In summary, the case studies reviewed in this chapter seem to show positive
outcomes for student engagement and was a constant positive outcome in multiple case
studies of 1:1 laptop initiatives in public middle schools throughout America. To be
clear, however, what student engagement “looks like” is very subjective and often differs
from school to school or teacher to teacher, thus making it difficult to adequately and
accurately measure this phenomenon. While some schools use indicators such as
attendance or turning work in on time as student engagement, others look for more
intangible indicators such as motivation and curiosity. Nonetheless, the widespread
belief that 1:1 laptops increase student engagement serves as a promising indication that
they can be tools that drive meaningful academic gains in students. Case studies of some
of America’s largest 1:1 laptop initiatives from Texas to Massachusetts may indicate that
support of student engagement was “one of the most substantial benefits” of 1:1 laptops
(McLeod & Sauers, 2012, p. 4).
1:1 laptops and student achievement. Quoting W.E.B. Du Bois in Unfit to Be a
Slave: A Guide to Adult Education for Liberation, Greene (2014) wrote, “Of all the civil
rights for which the world has struggled and fought for over 5,000 years, the right to learn
is undoubtedly the most fundamental” (p. 145). Despite decades of innovation and
improvement, student achievement levels remain at intolerable levels (Kuh, 2009). In
particular, a large number of students of color, students with limited English proficiency,
and students with disabilities continue to perform below grade level (Mickelson, 1990).
Researchers note that current strategies will not suffice as stakeholders work to achieve a
lengthy set of ambitious goals for America’s students (Swidler, 1986); however, using

38
substantial longitudinal evidence, a comprehensive set of school practices, and positive
school and community conditions can encourage improvement (Bryk, Sebring,
Allensworth, Luppescu, & Easton, 2010). Schools that adequately implemented
instructional initiatives into their classrooms or schools noticed a significant positive
impact on student achievement rates (Brown, Jones, LaRusso, & Aber, 2010).
According to Goodwin (2011), when 1:1 laptop immersion initiatives emerged
over a decade ago, increased student achievement was consistently cited as a goal of the
programs. Unfortunately, case studies of some of the largest 1:1 middle school initiatives
do not reveal positive data regarding increased student achievement. Despite the data
presented, a 2008 survey of 364 principals and leaders in large districts with 1:1
initiatives still believed laptops affected student achievement. Thirty-three percent of the
principals surveyed felt the laptops had a significant effect on student achievement, while
45% believed the laptops had a moderate effect on student achievement (Goodwin,
2011), yet some school districts have gone so far as to cancel their 1:1 initiatives because
of the lack of evidence of achievement gains, unconvinced that the costliness of the
laptop initiatives are worth the investment (McLeod & Sauers, 2012).
Stakeholders on both sides of the 1:1 debate revealed the ambiguity of the impact
of 1:1 devices on student achievement. For every statistic revealed about the
ineffectiveness of 1:1 laptop initiatives in terms of increased student achievement,
another statistic was available to reveal the academic benefits of 1:1 computing.
Academic gains in writing, literacy, science, exam scores, and grade point averages have
been noted in multiple research studies of 1:1 initiatives. One consistent area of
academic gains associated with 1:1 computing is student writing, with writing growth
indicated in several case studies, particularly the Maine case study. Despite the varying

39
gains or losses incurred by a variety of 1:1 immersion schools, case studies revealed
some commonalities that surfaced repeatedly when studying the effect of 1:1 computing
on student achievement. First, student home use of the laptops was a strong indicator of
growth in reading and math scores. Secondly, access to technology use was positively
associated with academic growth; the more access students had to and the more often
students used the laptops, the greater the achievement gains. Lastly, the majority of
studies revealed that academic gains occurred after 3 years of laptop immersion (McLeod
& Sauers, 2012). Detailed research regarding the effectiveness of 1:1 laptop initiatives
and student achievement was conducted and published on three of the largest middle
school initiatives: the BWL Initiative in Massachusetts, the TIP in Texas, and the MLT
Initiative in Maine.
Massachusetts and student achievement. As stated previously, one of the
targeted outcomes of the BWL Initiative pilot was to enhance student achievement.
Researchers followed three pilot middle schools and two control schools with similar
demographics from 2005 to 2008. Methods employed to measure the effectiveness of the
1:1 pilot in relation to increased student achievement included a nonequivalent
comparison group design study of Massachusetts Comprehensive Assessment System
(MCAS) test data for the three pilot schools and two control schools as well as an
additional student writing assessment given to seventh graders in the spring of 2008
(Bebell & Kay, 2010).
In order to explore the impact of 1:1 computing on student achievement,
researchers analyzed the trends in overall MCAS scores for pilot schools over time and
compared the results to the control schools and state trends during the same time period.
In addition, researchers examined which, if any, student technology use at home or at
40
school related to performance on various MCAS measures while statistically controlling
for students’ pre-BWL Initiative MCAS performance. MCAS results and performance
indicators for all schools for 1998-2008 were retrieved from the Massachusetts
Department of Education. Participating schools provided students’ individual MCAS
data for 2005-2008. The research team used the MCAS data, demographic information,
and information from the BWL Initiative student survey on technology use and practices
to create a new data set. The team then analyzed the data to determine the relationship
between various technology uses and practices and student achievement outcomes for all
students in Grades 7 and 8 who completed the survey and the MCAS (Bebell & Kay,
2010).
In spring of 2008, the final year of the BWL Initiative, eighth-grade students
completed MCAS testing in language arts, math, and science. These tests were
administered after most students had been in the laptop program nearly 2 full years.
Using a linear regression model, the research team chose the students’ spring 2008
MCAS scores as the dependent variable and students’ sixth-grade MCAS scores (pre-
BWL Initiative) as the independent or controlled variable for students’ prior achievement
levels (Bebell & Kay, 2010).
A writing test was another previously referenced measure employed by the
research team to study the effect of 1:1 computing on the achievement. Students in
Massachusetts took the open-ended writing assessment in Grade 7 with paper and pencil.
Since research suggests that the paper and pencil test modality may actually hinder the
writing ability of students who are accustomed to composing and editing text digitally,
the research team developed a mock MCAS open-ended writing assessment to gather
data. In the spring of 2008, students in Grade 7 in all of the participating schools were
41
randomly assigned either by classroom or by student, dependent upon the school, to
complete the mock writing assessment using either the BWL Initiative laptops or the
traditional state method of paper and pencil. Students were given a publicly released
MCAS prompt from 2006. Since all of the students would soon be taking the real MCAS
writing assessment with paper and pencil in the near future, all factors remained the same
for every student except that two thirds of the students used laptops. All spell checking,
grammar checking, and other automated features of Microsoft Word were turned off, and
laptop and paper-pencil students were held to the same time, scoring criteria, directions,
and resource standards (Bebell & Kay, 2010).
In an effort to eliminate scorer bias in the study, the research team recruited,
trained, and employed six undergraduate students in the field of education to
electronically input the 141 paper essays, typos and spelling errors included, into
Microsoft Word. After all of the papers were converted into an electronic format, a
second team of eight education undergraduate students were formally trained and
completed reliability testing utilizing the state’s coding rubric to prepare for scoring the
student essays. Each member of the scoring team was assigned a random sample of
student essays to score on two dimensions, topic development and standard English
conventions. Additionally, two other scorers evaluated each student essay on both
dimensions (Bebell & Kay, 2010).
What were the results of these carefully planned and executed achievement
studies? After 3 years of 1:1 laptop implementation, there was evidence of positive affect
on student achievement based upon a variety of approaches. One indicator was teacher
and school leadership beliefs that the laptops had a positive effect on student
achievement. Overall, 71% of BWL Initiative teachers felt that the students “benefitted

42
greatly” from the laptops, while only 4% disagreed with the statement. Furthermore,
when teachers were surveyed in June of 2008 on specific student groups regarding 14
types of student behaviors, attitudes, and activities, the majority of teachers reported an
improvement in the quality of student work during the pilot. Seventy-one percent of
teachers reported improved work quality for traditional students; 69% reported improved
work quality for low-achieving or at-risk students; and 61% reported improved work
quality for high-achieving students. When questioned specifically on improved writing
quality for 1:1 laptop students, almost 60% of surveyed teachers reported improved
writing quality for all student groups, traditional, low/at-risk, and high performing
(Bebell & Kay, 2010).
Principal responses to the surrey about student behaviors and activities were
similar to the teachers. One hundred percent of principals completing the survey reported
that students were more willing to write second drafts when using the laptop. One
hundred percent of the principals also concurred that the laptops helped students grasp
difficult concepts and create more attractive presentations. The principals unanimously
agreed that the laptops would be utilized more in the absence of pressure to perform on
high stakes standardized tests (Bebell & Kay, 2010).
In an analysis of school MCAS achievement trends, both seventh- and eighth-
grade student pass rates on the MCAS were weighted and averaged for the three 1:1 pilot
schools and compared to the combined MCAS performance of the two control schools
and statewide student MCAS performance trends. MCAS pass rates in Grade 8 math
were compared to the pilot, control schools, and state average of students for each year
from 1998 to 2008. In 1998, the average pass rate was 50% for both pilot and control
schools, 8% below the state average that year. This performance gap was eliminated by

43
the control schools during the next 7 testing years which were still prior to the
implementation of the BWL Initiative; however, during this same time period, the scores
of BWL Initiative schools increased so slowly that they were lagging considerably behind
the average pass rates of the control schools and the state by 2005-2006. For example, in
2006, the overall math MCAS pass rate for BWL Initiative schools was 59% as compared
to 74% for the control schools and 71% for the state. In the spring of 2007, the math
MCAS assessment was administered to the Grade 8 cohort. At that time, the BWL
Initiative students had utilized the laptops for the entire eighth-grade year in addition to at
least half of the seventh-grade year. This cohort of BWL Initiative students demonstrated
improved pass rates of 5% each year. This unprecedented growth brought the BWL
Initiative math MCAS average up to 70% by 2008 (Bebell & Kay, 2010).
Other positive achievement gains were noted in 2007 for seventh-grade math and
language arts MCAS pass rates, the first full year of laptop implementation. This was the
year that both students and teachers self-reported the most frequent and widespread use
of the laptops. According to teacher and student survey results, “Grade 7 student
performance in the BWL Initiative settings reached its highest historical levels on record
for both the ELA (since 2001) and MCAS math (since 2006) during the year when BWLI
implementation and use was at its peak” (Bebell & Kay, 2010, p. 33). Examination of
eighth-grade MCAS results in science, math, and language arts for 2007 and 2008
revealed that the highest levels of student achievement occurred after 2 years of laptop
implementation, again when students and teachers self-reported the most widespread
implementation and use of the BWL Initiative laptops (Bebell & Kay, 2010).
What was the root cause of these dramatic achievement gains? Was it the mere
implementation of 1:1 computing or a combination of factors? Researchers believe one

44
possible explanation could be that during this time period, 1:1 participation and use was
complementary to instructional practices that promoted performance improvements in
testing; however, this explanation is purely hypothetical in the absence of a randomized
experimental study. The research team could only examine individual student
performance prior to and after 2 years of 1:1 computing. Individual student sixth-grade
MCAS scores available before the BWL Initiative were compared to the eighth-grade
scores 2 years after participation in the BWL Initiative. Researchers broke down
performance data for each student who took the BWL Initiative instructional survey and
the MCAS assessment by demographics, including students who received free or reduced
lunch, non-White students, and special education students (Bebell & Kay, 2010).
Furthermore, the research team conducted exploratory data analysis to see if the
frequency of various teacher and student uses of technology as reported by the student
survey compared with the historical 2008 achievement results. The researchers employed
a principle component analysis that yielded six scales representative of various
technology uses such as writing and research, solving problems, presenting information,
class-related activities, communicating, and teacher use of technology. Four additional
scales were then created based on student survey results of home computer use including
writing and research, multimedia, communication and social use, and recreational use.
Finally, two additional scales were created from a summary of student attitudes and
beliefs toward 1:1 computing from student survey results. These two scales were student
beliefs toward 1:1 computing and student self-perception of technological abilities
(Bebell & Kay, 2010).
While this research design was not intended to nor capable of measuring the
effectiveness of 1:1 computing, it provided an opportunity for the researchers to measure

45
whether specific teacher and/or student technology use related to positive, neutral, or
negative effects on test scores. In addition, students in the control settings who were not
included among those who had been given 1:1 devices were included in the design. The
research results revealed some positive and some negative indicators of test achievement,
with some related and some unrelated to 1:1 computing. Frequency of technology use in
core area classes was statistically related to higher achievement scores on the 2007-2008
math and science Grade 8 MCAS tests. However, student use of computers in science
and social studies BWL Initiative classes negatively related to MCAS language arts
scores (Bebell & Kay, 2010).
In the control schools, the relationship between student computer use in core
classes and MCAS scores in all content areas was negative, suggesting that computer use
in non-1:1 settings did not increase student achievement. To further blur the lines
between 1:1 computing and student achievement, significant positive student
achievement gains in 2008 math and science MCAS scores were related to students’ in-
school use of technology for communication. On the other hand, student use of
technology in school to present information or to complete in-class activities in science
showed a negative relationship to 2008 language arts and math scores. The data were not
consistent when the researcher tried to establish the value of 1:1 computing to increased
student achievement (Bebell & Kay, 2010).
Upon analysis of the relationship between student home use of technology and
student achievement in both 1:1 and control settings, more challenges surfaced. For
BWL Initiative students, the frequency of home computer use for “recreational purposes”
was a positive indicator for language arts and math MCAS scores. In the control schools,
student home use of computers for multimedia purposes was a negative predictor for

46
language arts and math MCAS scores. In the 1:1 settings, the students’ perceived
technological abilities yielded a significantly positive relationship to MCAS performance
in all tested areas, leading the researchers to believe that personal perception is important
(Bebell & Kay, 2010).
Where does this myriad of inconsistencies in student achievement data lead in
determining the effect of 1:1 computing on student achievement, the primary outcome
desired by most districts? Given that prior student achievement on MCAS assessments
was the single most powerful indicator for future student achievement, what were the
achievement results for BWL Initiative students after taking prior achievement out of the
equation? When researchers compared the sixth-grade MCAS scores of BWL Initiative
students to their eighth-grade MCAS scores, they averaged an increase of 2.7 points.
When the same scores were compared for the control school students, they too showed
improvement but to a lesser degree with an average 1.3 point increase; but the control
students still outscored BWL Initiative students on both assessments. In addition, more
BWL Initiative students passed the MCAS math assessment in 2008 than in 2006; 11%
more to be exact. However, the mean average score of the students decreased 1.7 points
in 2008. Important to note, however, is that the average for all students, both BWL
Initiative and control, on the 2008 math MCAS test was 1.4 points lower than the average
for the same students on the sixth-grade MCAS test. Statistics regarding test scores with
the exclusion of special education student scores revealed larger gains in both 2006 and
2008 test scores in both language arts and math in the 1:1 settings. While this may lead
one to believe that a relationship exists between 1:1 computing and achievement gains for
special education students, the fact that 2006 scores were also higher with the scores of
these students included does not lend credibility to that hypothesis (Bebell & Kay, 2010).
47
In an effort to statistically assess the net change in 2008 MCAS scores that were
negative for math in control and 1:1 settings and positive for language arts in both
settings, the research team created student-level regression models for 2008 language arts
and math scores using nearly all eighth grade 1:1 and control school students. The ELA
regression model used the raw 2008 ELA MCAS score as the dependent variable, BWL
Initiative status as an independent variable, and the 2006 ELA MCAS score as a control
variable. The BWL Initiative status independent variable was one for 1:1 Initiative
students and zero for control school students. The results revealed that, in addition to
prior achievement, the increase in language arts scores was statistically significant for 1:1
students as compared to control school students. When the research team further
explored relationships, if any, between BWL Initiative students’ computer use and 2008
language arts scores, they found two student technology use predictors to be statistically
significant. Student computer use in science class related negatively to the 2008 MCAS
language arts scores for BWL Initiative students, while BWL Initiative students’
recreational use of computers at home to search the Internet for fun, download music, or
shop online positively related to 2008 MCAS language arts scores (Bebell & Kay, 2010).
BWL Initiative researchers also created regression models for math scores in
2008. The only indicator that was found to be statistically relevant to math scores for
BWL Initiative students was prior achievement. While the student level regression
model analysis revealed some positive associations between MCAS performance and 1:1
computing, the results were not conclusive, suggesting that the MCAS might not be the
most appropriate measure of true student achievement in 1:1 settings. Accordingly, the
BWL Initiative research team created, administered, and analyzed the results of the
realistic extended MCAS mock-writing assessment in the spring of 2008 (Bebell & Kay,

48
2010).
Researchers administered the mock writing assessment to all seventh-grade
students in the BWL Initiative schools in two 45-minute sessions after randomly
assigning students to complete the assessment with the laptops or paper and pencil.
Three hundred eighty-eight students wrote essays on the computers, and the remaining
141 paper essays were transcribed and converted into Microsoft Word as described
previously. After being independently rated by two different scorers, the results indicated
that seventh-grade students in the pilot schools wrote longer and more highly scored
essays using the laptops than students addressing the same prompt but using paper and
pencil. In an additional effort to eliminate any idiosyncrasies between the students who
took the mock writing assessment via laptop versus paper and pencil, the researchers used
the scores from the official open-response writing assessment that all students had to take
via paper and pencil in the spring as a covariate. The results of the study were
encouraging regarding 1:1 computing and improved writing. The BWL Initiative
students had significantly higher scores on topic development when they used their
laptops to write versus when they used pencil and paper. Standard English convention
scores as well as the word count increased when students used the digital format. Not
only did students write better using the laptops, they also wrote more. While the BWL
Initiative study revealed varying outcomes across schools and content areas, it revealed
the potential 1:1 computing has for achievement outcomes. In addition, it also exposed
what appears to be some key indicators for 1:1 computer use and gains in student
achievement, primarily frequency of computer use and rich learning experiences that
foster increased learning (Bebell & Kay, 2010).
Texas and student achievement. Upon being employed by the Texas Immersion

49
Pilot Program as an unbiased evaluation team, the Texas Center for Educational Research
(2006) outlined its purpose:
The overarching purpose of the study is to conduct a scientifically based
evaluation at the state level to test the effectiveness of technology immersion in
increasing middle school students’ achievement in core academic subjects as
measured by the Texas Assessment of Knowledge and Skills. (p. 2)
Clearly, this statement articulated that the primary goal of the TIP program was to
increase student achievement as a result of implementing a 1:1 laptop initiative.
The primary indicator used by the research team to determine the relationship of
1:1 computing with core area achievement gains was the TAKS, an assessment that
measured student mastery of the state’s content standards known as the TAKS. Texas
students take TAKS each year while in middle school for reading and math, writing
during the seventh grade, and science and social studies during eighth grade. When
researchers evaluated TAKS scores of pilot school students, they utilized the following
scores: met standard, which meant satisfactory academic performance; commended
performance, which meant high academic achievement well above state expectations; and
below standard, which meant achievement below state expectations (Texas Center for
Educational Research, 2009).
In addition to TAKS scale scores provided by the Texas Education Agency,
researchers generated z scores for each student, testing situation, and content area. These
scores could be used to compare student progress on TAKS across grade levels. To make
the scores easier to comprehend, they were normalized into what is known as a t score,
which indicates that they have a mean of 50 and a standard deviation of 10. For example,
a student who met standards or scored average on the TAKS would have a t score of 50,

50
while a score of 40 would be below state average (Texas Center for Educational
Research, 2009).
When researchers controlled for both student and school poverty, there were no
statistically significant effects of one-to-one laptop immersion on TAKS reading scores
for student cohorts 2 and 3. However, positive mean growth trajectories indicated that
students who were economically disadvantaged and students in schools with above
average poverty levels grew in reading achievement at faster rates than their “wealthier”
peers. On the surface, this appears that 1:1 laptop immersion might have been a catalyst
in closing the achievement gap between economically advantaged and disadvantaged
students. The math scores of students immersed in the 1:1 technology showed even more
promise; the math scores increased while control school math scores decreased. In
regards to science, social studies, and writing, immersion students did not experience any
significant gains or losses when compared to control students (Texas Center for
Educational Research, 2009).
When students and teachers in the TIP program were surveyed and interviewed
regarding perceptions of the impact of 1:1 laptop immersion on learning, the answers
varied. While teachers overwhelmingly agreed that the laptops increased student
engagement, most teachers were reluctant to connect the laptops with increased student
achievement. However, most students self-reported being better learners and showing
improvement in academic performance using the laptops. As two thirds of sixth-grade
students in TIP schools reported the academic benefits of laptop immersion, teachers
reported that the distractions enabled by laptops such as playing games and messaging
actually hindered learning (Texas Center for Educational Research, 2009).
While these data present a recurring theme, no clear picture of the effect of 1:1

51
computing on student achievement emerged: Some Texas schools that were part of the
immersion pilot reported astounding results. Brady Middle School was a low-performing
middle school in a small rural community in central Texas at the onset of the immersion
pilot. They had failed to make AYP and were testing below the state average in 2004
before the pilot commenced. By 2006, they were testing above the state average and
were a “recognized” campus that met AYP. Across the board gains were made in math,
reading, writing, and social studies. Outstanding achievement gains were recorded in the
sixth and seventh grades, with the percentage of seventh-grade students passing the
TAKS for language arts increasing 17 points in 2 years and the percentage of seventh-
grade students passing the math TAKS increasing 13 points in 2 years. School
administrators and teachers credit 1:1 laptops as a key factor in these achievement gains.
Notice, they did not credit the laptops as the reason for the gains but as a key factor, thus
tying into earlier arguments about changing the way 1:1 laptops are perceived and used
by teachers and students. Brady administrators noted that curriculum alignment was the
key to tapping into the power of the resources 1:1 technology offered. After this
epiphany, teachers started planning together and collaborating to address the specific
needs of each student, thus differentiating and being purposeful with instruction and
technology integration (Givens, 2007).
Maine and student achievement. The MLT Initiative was the first statewide 1:1
laptop initiative and one of the highest profile ones (Weston & Bain, 2010). Fully
implemented initially in the 2002-2003 academic year, every seventh- and eighth-grade
student and teacher in Maine had access to a laptop and other necessary supports such as
wireless access and professional development. MEPRI was contracted to conduct the
ongoing evaluation of the wireless initiative. For over 8 years, MEPRI employed a

52
mixed-methods approach to collect and analyze research and evaluation evidence on the
effectiveness of the MLT Initiative. Researchers collected evidence with online surveys,
site visits, and research studies (MLT Initiative Research and Evaluation Team, 2011).
In terms of measuring the effect of 1:1 laptops on student achievement, MEPRI
conducted a variety of small- and large-scale studies. The first study, the Maine Affect
Study of Technology in Mathematics Achievement, was designed to determine the effect
of sustained technology-infused professional development on student math achievement.
The study’s basic foundation was that ongoing and robust professional development
would result in increased content knowledge and pedagogical skills that effectively
integrated technology. Consequently, these teacher transformations would positively
affect student math achievement. In this randomized control study, 56 schools were
randomly assigned to either an experimental or control group. Professional development
was designed to increase teacher content knowledge of numbers and operations and
patterns. Teachers completed blended learning professional development, both face to
face and virtual, and participated in peer coaching, mentoring, and site visits. In addition,
they were assessed on content and pedagogy. The results revealed that the students of
teachers who fully participated in all aspects of the robust professional development for
20 months outscored their peers in control groups, especially on the two content focuses
of numbers and patterns (MLT Initiative Research and Evaluation Team, 2011).
An analysis of student writing scores also revealed promise. Researchers focused
on student test scores on the Maine Educational Assessment (MEA), the annual statewide
test, in the year 2000 before 1:1 computing and 2005 after the program had been
implemented for a few years. The average writing score increased by 3.44 points during
that time period; furthermore, key findings were discovered regarding the relationship

53
between how the laptops were used for writing and the increased achievement. Students
who reported never using their laptops for writing had the lowest scores on the scale;
students who used their laptops for all aspects of the writing process had the highest
scores. Researchers analyzed if the students just became better writers while using the
laptops or if they became better writers in general and noted a finding that was
unanticipated. During a random writing assessment, some students used a computer,
while others used pencil and paper. Researchers found that the scale scores from the
earlier writing assessment were almost identical. The students who used the laptops
frequently and consistently in all aspects of writing had better scores, regardless of how
they took the test, digitally or traditionally (MLT Initiative Research and Evaluation
Team, 2011).
The myriad of results, both positive and negative, in terms of the effectiveness of
1:1 laptops and student engagement were inconsistent, but the results provided clues and
guidance for utilizing laptops as cognitive tools that can indeed drive systemic and
sustaining academic growth. All of these case studies revealed pertinent information that
educators could use to implement 1:1 computer initiatives that are well designed,
purposeful, and research-driven to promote student academic gains.
Synthesis and Critique of Literature
The data varied on the affect that 1:1 laptop initiatives have on student
engagement and achievement. However, certain similarities surfaced among the
successes and failures documented in the case studies of three major 1:1 programs: the
BWL Initiative, the TIP, and the MLT Initiative. These similarities provided an
opportunity to design an effective and systemic educational reform initiative that

54
employed laptops as tools to promote meaningful change, not the magic bullet that will
erase all educational woes.
These case studies indicated that meaningful educational reform occurs when
“change” is accepted and implemented “by educators, not to them” (Weston & Bain,
2010, p. 9). In other words, the change must be bottoms-up, not top-down so all
stakeholders in the community have buy-in to a shared vision with clear drivers
developed by the community in pursuit of a common goal. Furthermore, the laptops must
be viewed as a cognitive tool that teachers and students use in conjunction with teaching
and learning practices that are proven to yield high-achievement gains such as
cooperative learning, differentiation, and problem-based learning. Additionally, the
students must have true ubiquitous access to the laptops, meaning they can take them
home daily and should use them daily in all classes and at home to deepen knowledge
and engage in meaningful student-centered learning activities.
Finally, teachers must be supported at all levels when implementing a 1:1 laptop
program. They must be provided clear expectations for the seamless integration of
technology use daily in all classes. They must be supported by ongoing and robust
professional development that provides them with critical knowledge of how to integrate
technology into their lessons. The reform must have a shared purpose and go beyond
substituting an online quiz for a paper worksheet. Classroom teachers must be taught
how to develop transformational educational opportunities that utilize technology to
create, collaborate, communicate, and think critically. They must have building-level
support that creates a cocoon that encourages them to take risks with technology,
knowing that someone will always be there to help them when things do not go as
planned. Finally, the case studies highlighted the importance of school administrators in

55
the success of a 1:1 initiative. Principals should model effective technology integration
and praise teachers who use the laptops as cognitive tools that drive student achievement.
The review of related literature provided knowledge on a variety of perspectives and
theories on best practices for the use of technology, especially 1:1 technology. The
varied findings from the case studies served as a backdrop for the researcher who sought
to describe the use of technology and perceptions of the importance of the 1:1 technology
to learning for the students in District Z. The frequency of use in this rural eastern North
Carolina school district was the unknown and the priority of this study. Without
consistent, effective, and efficient use of technology, improved student engagement and
achievement becomes a moot point.
Conclusion
This chapter reviewed three major case studies of three large 1:1 technology
initiatives: the BWL Initiative in Massachusetts, the TIP, and the MLT Initiative.
Context from the research on student engagement and student achievement was provided,
and the findings varied. This chapter was organized with an overview of the background
and methodology for each of the three studies, findings on student engagement for each
of the three studies, and findings on student achievement for each of the three studies.
Chapter 4 presents the descriptive data from the survey according to the three research
questions. Chapter 5 summarizes the findings and the professional perspective of the
researcher.

56
Chapter 3: Methodology
Introduction
Some school systems in this country spend thousands of dollars each year
purchasing new and innovative technology. Low wealth school districts, however, can ill
afford to continue investing large sums of money without solid proof of positive returns
for the dollars spent. By definition, these districts reside in counties that cannot generate
enough local revenue to adequately support public schools. In 2014-2015, District Z, the
school system designated for this study, embarked on a 1:1 technology initiative that
provided each middle school student with a Chromebook. According to Microsoft’s 1:1
guidebook, 1:1 technology can be defined as “an environment in which students use
computing devices such as wireless laptops or tablet PC computers in order to learn
anytime and anywhere” (Microsoft, 2005, para. 3). The intent of the 1:1 initiative in
District Z was to harness the power of technology for student engagement and ultimately
effect student achievement. Nonetheless, in order to reap the benefits of technology, not
only does it have to be used consistently and with educational legitimacy by both the
teachers and students, technology must be perceived as an important educational tool.
The purpose of this quantitative study was to clarify and describe to the
policymakers and stakeholders of School District Z the frequency of use of the 1:1
technology, the frequency of use of other technological devices on the part of the teachers
and students, and finally the middle school students’ perceptions of the importance of
technology access to their learning. Politicians, policymakers, and other educational
stakeholders expect efficient and effective spending of district dollars. They deserve to
know if these huge technological expenditures are producing the desired academic

57
results.
Thus, the following three questions guided this research study.
1. How frequently do middle school students in District Z use 1:1 technology?
2. Do the middle school students in District Z believe that technology access is
important to learning?
3. How frequently do middle school teachers and students in District Z use other
technological devices?
Methodology
Descriptive research, the method used in this study, is characterized by the
deliberate and systematic articulation and analysis of issues lacking clarity (Butin, 2010).
Survey research was chosen because it is one of main methods used in descriptive
studies. Upon answering survey questions, the researcher used descriptive statistics to
describe the responses given. It is important to note that descriptive research can only
describe the data collected (Hale, 2011). Bickman and Rog (1998) believed that
descriptive studies can answer questions such as what is and what was. To obtain the
frequency of use data, the researcher administered a survey comprised of 15 questions
that was adapted from other survey instruments or developed by the researcher based on
the themes of the literature review in Chapter 2 (see Appendix A). In accordance with
copyright law, the researcher contacted the owners of the original survey for permission
to use survey questions (see Appendix B).
Since students were involved, permission from the Institutional Review Board
was requested and granted. The researcher obtained permission to conduct the study
from the superintendent and the Board of Education. Next, the middle school director

58
and the middle school principals granted permission (see Appendix C). On April 18,
2016, the Director of Middle Schools presented the proposed research study to all middle
school principals in order to garner support. To facilitate the process, the researcher
provided a packet of materials that included the purpose of the study, the manner in
which the survey would be administered, and the data anticipated from the survey
instrument. The researcher also explained to the middle school principals how the
anticipated data might benefit teachers and students (see Appendix D). The writer
included in the packet of materials a copy of the debriefing statement and the survey.
Next, the researcher conducted a pilot study to gain insight into the possible
weaknesses of the study instrument. In 2001, Van Teijlingen and Hundley noted that
pilot studies are essential to a well-designed study and may increase the success of the
actual study. In this research, the pilot study included approximately 120 students in
District Z’s five middle schools. The students in the pilot study represented only two
schools. The pilot study was designed to assist the writer in validating the research
instrument prior to administering the survey at multiple sites (see Appendix E). The
school provided Chromebooks to each student who was then instructed to proceed to the
Google Classroom in order to access the link to the validation survey. The researcher
explained to the subjects that the survey should take approximately 15 minutes. Further,
the researcher emphasized to the subjects that their participation was voluntary and that
they could choose to stop participating in the study at any time. In addition, the
researcher stressed the confidentiality of the survey results and stated that all responses
would be compiled and analyzed as a group. The researcher explained that the 1:1
initiative meant that a technological device was available to each student before, during,
and after class. After being instructed to select the identifier (i.e., “School A”) for the
59
school attended (a system devised to protect confidentiality of participant results), the
students took approximately 15 minutes to complete the survey. After completion of the
online survey, the students were given a hard copy of the survey and instructed to
highlight words that they did not understand or that they felt needed further clarification
(see Appendix F). After all students finished the survey and highlighted items needing
further clarification, the researcher thanked them for completing the survey. The
researcher also instructed the participants to use the e-mail provided if they had further
questions about the research study.
Participant feedback was used to revise the survey before it was administered to
the other middle school students. The researcher analyzed the collective highlights from
the pilot groups and discovered considerable trouble with the terms 1:1, Elmo, and
Promethean. The analysis of the data revealed sporadic confusion over terms such as
Edmodo, incorporate technology, and the confidential school identifier. Using feedback
from the pilot participants, the researcher made revisions and modifications to the
instrument and clarified the directions.
Administrators at each of the participating schools chose the dates and location of
the formal survey administration. The researcher emailed administrators the day before
the administration of the survey as well as the morning and afternoon of the survey (see
Appendix G) to ensure that the Technology Coordinator put the link up just prior to
survey administration and took the link down immediately after the survey was
administered. This communication was necessary to ensure that students involved in the
pilot did not take the survey and skew the results. Students were given the choice to opt
out of participating in the survey per board policy. Parents or guardians had to return a
signed form provided by the researcher (see Appendix B). Upon being provided

60
technological devices and reading directions to the survey, students accessed the secure
survey powered by Survey Monkey via a provided link. Students with unresolved
questions regarding the survey were encouraged to email the researcher.
Data Analyses
Because the survey was online, the results were available quickly. Survey
Monkey provided the tables, graphs, and/or charts needed for data analysis for each
survey question. In order to report the meaning of the survey results and draw
conclusions, the researcher analyzed percentages, mean, and ordinal rankings per survey
question to determine meaning and if common or recurring themes could be extracted
from the numbers. Frequency and percentages helped tell the story of the survey data.
Descriptive analysis was used to describe opinions, characteristics, and population
(Creswell, 2014). Tabulated descriptions (tables), graphical descriptions (graphs and
charts), and statistical commentary (discussion of the results) helped to summarize data
from the research study. For questions 2, 4, 5, and 6, the researcher calculated the
standard deviation. The standard deviation provided a more detailed estimate of the
dispersion or the spread of numbers from the mean. In order to compute the standard
deviation from the mean, Survey Monkey data files were opened in Excel. Next, the data
were reformatted and coded by giving numeric values to the answer choices for each
survey question. The Excel files were uploaded in SPSS 24, a popular statistical software
package used by many statisticians that is capable of performing highly complex data
manipulation and analysis. In SPSS 24, values were assigned to numeric codes before
the descriptive statistics were run. The output from SPSS 24 revealed mean and standard
deviation. The output added additional clarity to the response data. The researcher

61
describes the SPSS 24 output in Chapter 4.
Research Context and Subjects
The setting of the study was a rural, eastern North Carolina public school system
comprised of 1,200 students from diverse racial and socioeconomic backgrounds who
attended the five middle schools in the county. The researcher worked with school
administrators in order to collect the quantitative data necessary to answer the research
questions. At the time of the study, the researcher was an assistant principal at one of the
middle schools included in this study.
Creswell (2005) suggested that the general statute regarding the size of a sample
population for a research study “is to select as large a sample as possible for the
population” (p. 149) to counterweigh for potential error or prejudice. The researcher
utilized convenience sampling in the selection of participants. According to Suen et al.
(2014),
Convenience sampling is a non-probabilistic sampling technique applicable to
qualitative or quantitative studies, although it is most frequently used in
quantitative studies. In convenience samples, subjects more readily accessible to
the researcher are more likely to be included. Thus, in quantitative studies, the
opportunity to participate is not equal for all qualified individuals in the target
population and study results are not necessarily generalizable. (p. 105)
Convenience sampling was used because the researcher was a member of the community
in which the study was conducted and the subjects were readily accessible.
A dedicated portal ensured participant confidentiality; students signed on to their
assessment portals using a school/classroom identifier. Neither names nor personal

62
identification numbers were required to sign on and complete the survey. To ensure
confidentiality of the selected classrooms and the participants, the assigned code that
indicated the location of the classrooms was placed in a secure location for researcher use
only. To encourage honest responses on the survey instrument, the researcher guaranteed
anonymity to participants. The research posed no risk to student subjects at any time and
did not involve deception of any kind.
Summary
This descriptive, quantitative study was designed to clarify and describe to the
policymakers and stakeholders of School District Z, the frequency of use of the 1:1
technology, the frequency of use of other technological devices by teachers and students,
and finally the middle school students’ perceptions of the importance of technology
access to their learning. District Z, like many schools in North Carolina and the nation,
operates on a limited budget; and the 1:1 technology implementation was a major
budgetary investment that had not been challenged by evaluating the return on that
investment. Politicians, policymakers, and other stakeholders deserve to know if massive
expenditures such as the 1:1 technology are producing the desired academic results. To
answer the research questions, the researcher collected data by surveying students from
the five middle schools in the county. Survey Monkey was used to administer the survey
and structure the raw data. Descriptive statistics, frequency, and percentages helped
clarify and add meaning to the survey data. Tabulated descriptions (tables), graphical
descriptions (graphs and charts), and statistical commentary (discussion of the results)
helped to summarize data from the research study. For questions 2, 4, 5, and 6, the
researcher computed the standard deviation from the mean using SPSS 24 software. The
standard deviation provided a more detailed estimate of the dispersion or the measure of

63
the spread of numbers from the mean. The findings of the data analyses are reported in
Chapter 4. The researcher presents the conclusion and the professional perspective in
Chapter 5.

64
Chapter 4: Results
Introduction
Low-wealth school districts such as District Z cannot afford to invest in expensive
initiatives without hard data to prove that the educational gains are worth the expenditure.
Technology has consistently been a high-dollar line item in many districts, but the
evaluative data to show the effects may neither exist nor align with the degree of
spending. Although some experts such as Akyürek and Afacan (2012) believe that 1:1
technological initiatives can significantly influence test scores and other student
achievement data, other experts disagree. In 2014-2015, District Z, a low-wealth school
district in North Carolina, allocated funding to implement a 1:1 technology initiative in
its five middle schools with the expectation of influencing student achievement. Prior to
this study, no empirical data were available to the stakeholders and policymakers that
described the frequency of use of all technological devices or clarified the importance of
technology access for the middle school students’ learning.
The purpose of this study was to clarify and describe to the policymakers and
stakeholders in School District Z the frequency of student use of the 1:1 technology,
whether students believe that technology access is important to learning, and the
frequency of use of all technological devices by teachers and students.
The following questions guided this research study.
1. How frequently do middle school students in District Z use 1:1 technology?
2. Do the middle school students in District Z believe that technology access is
important to their learning?
3. How frequently do middle school teachers and students in District Z use other

65
technological devices?
Description of Methodology
The middle school students took a 15-item electronic survey using SurveyMonkey
which provided the tables, graphs, and charts needed to analyze the data for each survey
question. To report the meaning of the survey results and draw conclusions, the
researcher analyzed percentages, means, and ordinal rankings per survey question to
determine whether common or recurring themes could be extracted from the numbers.
Frequency and percentages helped tell the story of the survey data. The researcher used
descriptive analysis to describe opinions, characteristics, and population (Creswell,
2014). Tabulated descriptions (tables) and statistical commentary (discussion of the
results) helped to summarize data from the research study. For questions 2, 4, 5, and 6,
questions that specifically answered the research questions, the researcher calculated the
standard deviation. The standard deviation provided a more detailed estimate of the
dispersion or the measure of the spread of numbers from the mean. To compute the
standard deviation from the mean, the researcher opened SurveyMonkey data files in
Excel and then reformatted and coded the data by giving numeric values to the answer
choices for each survey question. The researcher then uploaded the Excel files to SPSS
24, a popular statistical analysis software used by statisticians in many different fields
that is capable of performing highly complex data manipulation. In SPSS 24, the
researcher assigned values to numeric codes before computing the standard deviation.
Results by Research Question
Research Question 1. How frequently do middle school students use 1:1
technology in District Z? Exactly 1,108 participants responded to survey question 6, and

66
14 participants abstained. The students’ responses, shown in Table 1, were as follows:
9.57% of students responded that technological devices were used regularly in one class,
13.81% of students said the devices were used regularly in two classes, 23.56% of
students stated that technological devices were used regularly in three classes, 29.51% of
students responded that technological devices were used regularly in four classes, and
23.56% of students reported use of technological devices regularly in five or more
classes.
Table 1
Combined Responses to Survey Question 6
Note. N = 1,108 (14 nonrespondents).
As part of the methodology, the researcher chose to calculate the standard
deviation from the mean in question 6 using the SPSS 24 software to determine the
dispersion of the answers from the mean. The answer choices were coded as follows: 1
(coded in SPSS as 1), 2 (coded in SPSS as 2), 3 (coded in SPSS as 3), 4 (coded in SPSS
as 4) and 5 or more (coded in SPSS as 5). The SPSS output revealed that the average
value of the mean was 3.44 with a standard deviation of 1.3. The responses to question 6
predominately concentrated around answer choice 3 and a fragment beyond. The
standard deviation of 1.3 shows a small spread across the answers to question 6.
How many of your classes use the 1:1 devices regularly?
Number of classes using 1:1 devices % of Respondents
1
9.57
2 13.81
3 23.56
4 29.51
5 or more
23.56

67
Survey question 7 asked participants in which class they used the 1:1 devices
most often. Table 2 shows the responses of the 1,105 students who answered this
question. Participants responded as follows: 19.19% responded that the 1:1 devices were
used most often in language arts, 21.72% stated that the devices were used most often in
math, 37.19% reported using 1:1 devices most often in science, 17.65% responded that
1:1 devices were used most often in social studies, and 4.25% responded that the 1:1
devices were used most often in enhancements.
Table 2
Combined Responses to Survey Question 7
Which classes do you use the 1:1 devices for most often?
Classes using 1:1 devices % of Respondents
Language arts
19.19
Math 21.72
Science 37.19
Social studies 17.65
Enhancements 4.25
Note. N = 1,105 (17 nonrespondents).
When asked in survey question 8 whether they sought to use the 1:1 devices
during their free time, Table 3 shows 1,103 students responded, and 19 students skipped
it. The results were fairly evenly divided, with 51.04% of students noting that they used
the 1:1 devices after finishing their work, whereas 48.96% responded that they did not
seek to use the 1:1 devices during free time.
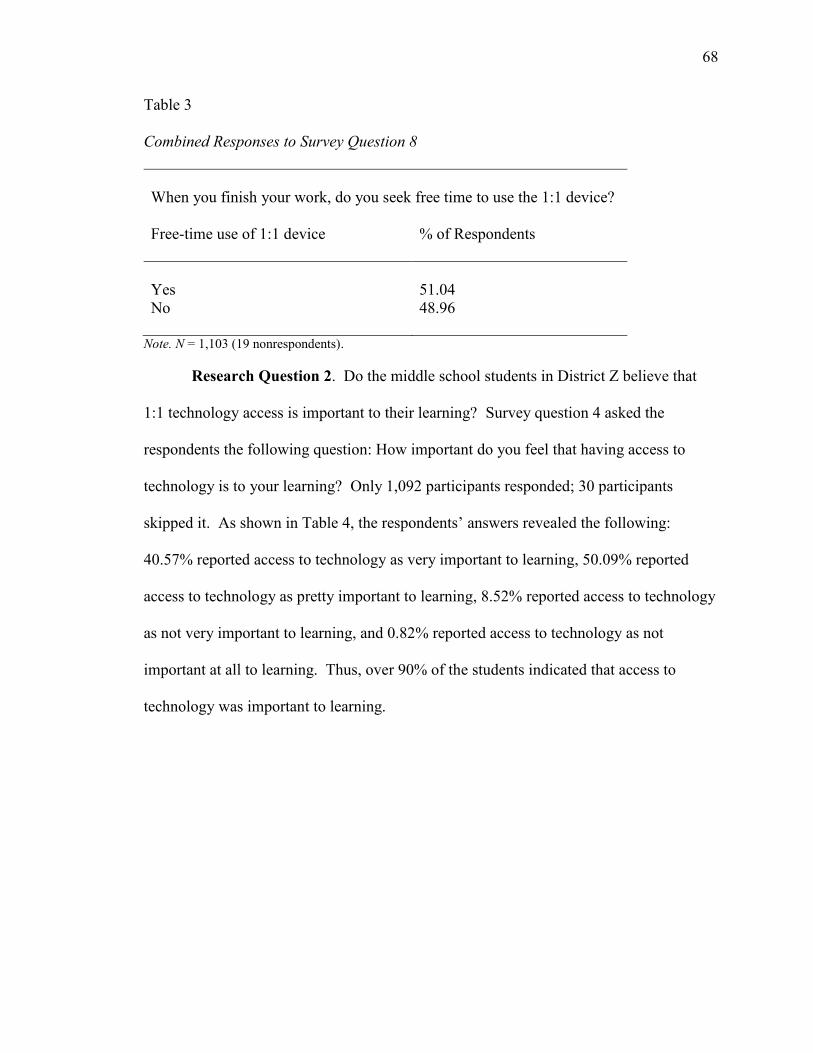
68
Table 3
Combined Responses to Survey Question 8
When you finish your work, do you seek free time to use the 1:1 device?
Free-time use of 1:1 device
% of Respondents
Yes
51.04
No
48.96
Note. N = 1,103 (19 nonrespondents).
Research Question 2. Do the middle school students in District Z believe that
1:1 technology access is important to their learning? Survey question 4 asked the
respondents the following question: How important do you feel that having access to
technology is to your learning? Only 1,092 participants responded; 30 participants
skipped it. As shown in Table 4, the respondents’ answers revealed the following:
40.57% reported access to technology as very important to learning, 50.09% reported
access to technology as pretty important to learning, 8.52% reported access to technology
as not very important to learning, and 0.82% reported access to technology as not
important at all to learning. Thus, over 90% of the students indicated that access to
technology was important to learning.

69
Table 4
Combined Responses for Survey Question 4
Note. N = 1,092 (30 nonrespondents).
Because the answers from survey question 4 (How important to your learning do
you feel having access to technology is?) explicitly supplied data for answering research
question 2, the researcher chose to calculate the standard deviation from the mean using
the SPSS 24 software to determine the dispersion from the mean. The answer choices to
survey question 4 were as follows: very important (coded in SPSS as 4), pretty important
(coded in SPSS as 3), not very important (coded in SPSS as 2), not important at all
(coded in SPSS as 1), and other (coded in SPSS as 0). The SPSS output revealed that the
average value of the mean was 3.30 with a standard deviation of 0.66. The responses to
survey question 4 predominately hovered over answer choice 3, pretty important (3);
therefore, the middle school students felt that having access to technology is pretty
important to learning. With the standard deviation of 0.66, there was less spread across
the respondents’ answers to survey question 4; therefore, it is safe to say that the answers
are closely aligned.
The results from survey question 9 as shown in Table 5, which asked participants
if they make better grades when using the 1:1 device, received positive responses from
How important to your learning do you feel having access to technology is (i.e., do you
learn better from the use of technology)?
Importance to learning of access to technology % of Respondents
Very important
40.57
Pretty important 50.09
Not very important 8.52
Not important at all 0.82

70
most of the students (1,101 students, or 84.29% of the respondents). These students
indicated that their grades improved using a 1:1 device. Twenty-one students skipped the
question. The remaining nine students, or 15.71% of the participants, indicated that using
the 1:1 device did not affect grades.
Table 5
Combined Responses for Question 9
Do you make better grades when using the 1:1 device?
Improved Grades % of Respondents
Yes
84.29
No
15.71
Note. N = 1,101 (21 nonrespondents).
Survey question 11 asked participants to describe experiences using the 1:1
device; they could select all answers that applied from the four given. Twenty-two
students skipped this question on the survey. The remaining 1,100 participants answered
this question as follows: 13.82% described their experience using the 1:1 device as
playtime or game time, 7.55% described their experience using the 1:1 device as
unstructured or were unsure of expected learning outcomes, 61.45% described the
experience using the 1:1 device as applicable to what was covered in class, and 68.55%
described the experience with the 1:1 device as appropriate for current classes and
important for required/anticipated future skills. Therefore, roughly two thirds of the
students described experiences while using the 1:1 devices as appropriate for material
covered in class and/or important for future skills. Table 6 displays the data findings.

71
Table 6
Combined Responses for Question 11
How do you describe your experience using your 1:1 device?
Experience using 1:1 device % of Respondents
Playtime or game time
13.82
Unstructured, not sure of expected learning outcomes
7.55
Applicable to what you are covering in class
61.45
Appropriate for current classes and important for
required/anticipated future skills
68.55
Note. N = 1,100 (22 nonrespondents).
Nineteen participants skipped survey question 12, which asked how they felt
about learning when using the 1:1 devices in class and instructed them to select all
applicable answers. The remaining 1,103 survey participants responded to question 12 as
follows: 59.75% reported feeling engaged in the activities, 35.63% reported feeling
inspired by the activities, 68.36% reported feeling interested in the activities, 9.79%
reported feeling bored by the activities, and 1.99% reported feeling disengaged from the
activities. The data indicated that almost 60% of the students felt engaged in activities
and that over one-third felt inspired. The interest level that the students using the 1:1
devices felt exceeded that of two thirds of the respondents to question 12. Table 7
displays the data findings.

72
Table 7
Combined Responses for Question 12
How do you feel about your learning when using the 1:1 device in class?
Reaction to use of 1:1 device
% of Respondents
Engaged in the activities
59.75
Inspired by the activities 35.63
Interested in the activities 68.36
Bored by the activities 09.79
Disengaged in the activities
1.99
Note. N = 1,103 (19 nonrespondents).
The survey results for question 13, in which participants were asked to select all
that apply regarding what best described them when using the 1:1 device in class, was
answered by 1,108 students, and 14 skipped it. Table 8 shows that the participants
responded as follows: 40.70% self-described as curious learners, 62.91% self-described
as hardworking learners, 11.91% self-described as bored learners (i.e., their minds were
on other things), 47.47% self-described as engaged learners, 60.38% self-described as
interested learners, and 1.9% self-described as disengaged learners. The number of
students who self-described as interested is exceeded only by the number who self-
described as hardworking. The interest level noted in question 13 supports that reported
in question 12, and respondents’ answers support the level of engagement.

73
Table 8
Combined Responses for Question 13
Which of the following best describes you when using the 1:1 device in class? (Select
all that apply.)
Learner Type
% of Respondents
Curious learner
40.70
Hardworking learner 62.91
Bored (my mind is on other things) 11.91
Engaged in learning 47.47
Interested in learning 60.38
Disengaged in learning 1.90
Note. N = 1,108 (14 nonrespondents).
Research Question 3. How frequently do middle school teachers and students in
District Z use technological devices? When asked in survey question 2 how often they
used computers (not solely 1:1 technology) in school, 1,077 survey participants
responded as follows: 78.18% reported daily computer use, 19.96% reported weekly
computer use, 0.74% reported using a computer twice monthly, 0.84% reported using a
computer once a month, and 0.28% reported never using a computer. Of the 1,122
participants, 45 skipped question 2. The majority, over three quarters of the students,
reported using computers daily. Another almost 20% reported weekly use of computers.
A negligible number of students, less than 1%, reported using computers weekly,
monthly, or never.

74
Table 9
Combined Responses for Survey Question 2
Note. N = 1,077 (45 nonrespondents).
Because the data from survey question 2 are key to answering Research Question
3, the researcher calculated the standard deviation for survey question 2 using SPSS 24 to
determine the dispersion of the responses from the mean. The answer choices to question
2 were as follows: daily (coded in SPSS as 180, depicting 180 days in an academic year),
weekly (coded in SPSS as 36, depicting 36 weeks in an academic year), twice a month
(coded in SPSS as 18, depicting 9 months in an academic year multiplied by 2), and once
a month (coded in SPSS as 9, depicting 9 months in a school year). The SPSS output was
a mean of 148.12, and the standard deviation was 0.61. The interpretation of the statistics
showed that, on average, most students selected daily as the answer to question 2.
Question 3 asked the respondents how often teachers use technology such as
computers, iPads, projectors, document cameras, and Smart Boards for classroom
instruction. As shown in Table 10, the findings from question 3 reveal that the majority
of students (82.75%) reported that their teachers use technology integration daily. Again,
a negligible number of participants (1.02%) reported that teachers never used technology
for classroom instruction.
How often do you use a computer in school?
Frequency of computer use in school
% of Respondents
Daily
78.18
Weekly 19.96
Twice monthly 0.74
Once monthly 0.84
Never 0.28

75
Table 10
Combined Responses for Question 3
How often does your teacher use technology for classroom instruction, such as a
computer/iPad and projector, Elmo (document camera), or Promethean (Smart Board)?
Frequency of technology use for classroom instruction
% of Respondents
Daily
82.75
Weekly 14.17
Twice monthly 1.30
Once monthly 0.65
Never 1.02
Note. N = 1,080 (42 nonrespondents).
Question 5 asked students about the extent to which they agreed or disagreed that
their teachers did a good job of incorporating technology into instruction. As shown in
Table 11, of the 1,105 participants who responded to question 5, the results were as
follows: 43.35% strongly agreed that the teachers do a good job of incorporating
technology into lessons, 51.49% agreed that the teachers do a good job of incorporating
technology into lessons, 3.8% disagreed that the teachers do a good job of incorporating
technology into lessons, and 1.36% strongly disagreed that the teachers do a good job of
incorporating technology into lessons. Seventeen survey participants skipped question 5.
Given four choices of agreement ranging from “strongly agree” to “strongly disagree,”
almost 95% of the students agreed that teachers do a good job of incorporating
technology into lessons.

76
Table 11
Combined Responses for Question 5
Overall, my teachers do a good job of incorporating technology into their lessons.
Level of agreement regarding teacher incorporation of
technology into lessons
% of Respondents
Strongly agree
43.35
Agree 51.49
Disagree 3.80
Strongly disagree 1.36
Note. N = 1,105 (17 nonrespondents).
Because the data from survey item 5 were fundamental to answering Research
Question 3, the researcher calculated the standard deviation from the mean using the
SPSS statistical software. As stated earlier, the answer choices were as follows: strongly
agree (coded as 4), agree (coded as 3), disagree (coded as 2), and strongly disagree
(coded as 1). SPSS 24 output revealed a mean of 3.37 and a standard deviation of 0.63.
Therefore, the answers predominately hovered over answer choice 3 (agree). On
average, most students agree that teachers do a good job of incorporating technology into
lessons. With a standard deviation of 0.63, it is safe to say that the answers align closely
with a small spread across the answers. The implication from the data is that the
incorporation of technology is standard for teachers. In other words, teachers routinely
incorporate technology into the lessons.
Survey question 10 asked respondents for what purpose they most often used
computers. As displayed in Table 12, the data showed that 1,122 survey participants
responded to question 10 with the following results: 52.14% of participants reported
Internet use, 85.20% of participants responded that they used computers for research,

77
49.73% of participants reported using computers at school for writing papers, 70.14% of
participants reported using computers at school for learning material, 29.86% of
participants used computers at school for watching videos, and 17.29% of participants
reported using computers at school for playing games.
Table 12
Combined Responses for Question 10
What do you use computers for the most?
Computer usage % of Respondents
Internet
52.14
Research 85.20
Writing papers 49.73
Learning material 70.14
Watching videos 29.86
Playing games 17.29
Note. N = 1,122.
In survey questions 14 and 15, the researcher specifically targeted frequency of
teacher and student use of technological devices, asking participants how frequently their
instructors used specific methods to communicate with them. The students selected from
the following options: face-to-face either before or after class, face-to-face using
teacher’s planning time, phone, personal/individual e-mail, mass e-mail or announcement
to the whole class, updates/announcements on course websites/Schoology
website/Edmodo, or instant messaging. Table 13 reveals that 24 students declined to
answer the question, leaving 1,098 participants who responded. Participants could also
select one of the following frequencies for each of the preceding communication
methods: daily, a couple of days per week, weekly, a few times per semester, or never.

78
Students responded as follows regarding the frequency of the communication method
face-to-face either before or after class: 40.99% replied daily, 22.50% replied a few times
per week, 7.47% replied weekly, 14.01% replied a few times per semester, and 15.03%
replied never. Students responded as follows regarding the frequency of face-to-face
communication during the teacher’s planning time: 18.18% replied daily, 13.83% replied
a few times per week, 11.99% replied weekly, 17.5% replied a few times per semester,
and 38.49% replied never. Students responded as follows regarding the frequency of
communication by phone: 8.41% replied daily, 6.48% replied a few times per week,
7.35% replied weekly, 19.05% replied a few times per semester, and 58.7% replied
never. Students responded as follows regarding the frequency of communication by
personal/individual e-mail: 15.72% replied daily, 15.12% replied a few times per week,
13.53% replied weekly, 20.60% replied a few times per semester, and 35.02% replied
never. Students responded as follows regarding the frequency of communicating with
mass e-mails or announcements to the whole class: 29.29% replied daily, 20.61% replied
a few times per week, 16.89% replied weekly, 16.22% replied a few times per semester,
and 16.98% replied never. Students responded as follows regarding the frequency of the
communication by updates/announcements on course websites/Schoology website/
Edmodo: 31.02% replied daily, 22.11% replied a few times per week, 15.28% replied
weekly, 13.57% replied a few times per semester, and 18.03% replied never. Finally,
students responded as follows regarding the frequency of the communication by instant
messaging: 8.74% replied daily, 8.74% replied a few times per week, 7.47% replied
weekly, 12.38% replied a few times per semester, and 62.67% replied never.

79
Table 13
Combined Responses for Question 14
Please tell us how frequently your instructors use each of the following methods to
communicate with you. (Select one per row.)
Communication
method
Daily A few
times
per week
Weekly A few
times per
semester
Never
Face-to-face either before or
after class
40.99%
22.50%
7.47%
14.01%
15.03%
Face-to-face using teacher’s
planning time
18.18% 13.83% 11.99% 17.50% 38.49%
Phone
8.45% 6.48% 7.35% 19.05% 58.70%
Personal/individual e-mail
15.72% 15.12% 13.53% 20.60% 35.02%
Mass e-mail or
announcement to the whole
class
29.29% 20.61% 16.89% 16.22% 16.98%
Update/announcement on
course website/Schoology
site/Edmodo
31.02% 22.11% 15.28% 13.57% 18.03%
Instant messages
8.74% 8.74% 7.47% 12.38% 62.67%
Note. N = 1,098 (24 nonrespondents).
Twenty-three students skipped survey question 15, which asked participants how
often they used the following communication methods when communicating with their
classmates about courses or coursework: face-to-face, phone/cell phone, e-mail, or instant
messaging. Students could select one of the following frequencies for each of the
preceding methods of communication: daily, a couple days per week, weekly, a few times
per semester, or never. Of the 1,099 participants who answered question 15 in response

80
to the face-to-face communication method, 66.76% responded daily, 14.26% a few times
per week, 6.67% weekly, 4.63% a few times per semester, and 7.69% never. In response
to using the phone or cell phone, the students responded thus: 25.58% daily, 16.02% a
few times per week, 11.29% weekly, 10.42% a few times per semester, and 36.68%
never. In response to the question of whether they communicated by e-mail, the students
responded thus: 18.29% daily, 14.92% a few times per week, 10.49% weekly, 18.67% a
few times per semester, and 37.63% never. In response to using instant messaging, the
students responded thus: 24.76% daily, 13.68% a few times per week, 9.63% weekly,
11.18% a few times per semester, and 40.75% never. Table 14 displays the findings.
Table 14
Combined Responses for Question 15
How often do you use the following when communicating with your classmates about
courses or coursework? (Select one per row.)
Communication
Method
Daily A few
times
per week
Weekly A few times
per semester
Never
Face-to-face
66.76%
14.26%
6.67%
4.63%
7.69%
Phone/cell phone 25.58% 16.02% 11.29% 10.42% 36.68%
E-mail 18.29% 14.92% 10.49% 18.67% 37.63%
Instant messages
24.76% 13.68% 9.63% 11.18% 40.75%
Note. N = 1,099 (23 nonrespondents).
Summary of Results
An analysis of the data revealed that although students self-reported using
computers daily, the responses regarding 1:1 technology did not reflect consistent daily
use of the devices. The majority of the students believed that access to computers was
important to learning. Additionally, when using 1:1 technology, students self-described

81
as hardworking, interested, and engaged. What the data suggest is that the use of 1:1
technology can be a precursor to more student engagement and enhanced student
achievement.
Conclusion
Chapter 4 presented the descriptive statistics used to answer the three research
questions. The survey data were presented by research question. In Chapter 5, the
researcher describes the meaning of the data and provides the result conclusions. Chapter
5 also provides the researcher’s professional perspective and recommendations for further
research.

82
Chapter 5: Discussion
Introduction
District Z, a low-wealth rural school system, does not have the resources to invest
large sums of money in technology initiatives without hard data to justify the expenditure
to stakeholders and politicians. Although some educators have confirmed the positive
results of integrating technology into the instructional day, many stakeholders, including
some taxpayers, still need convincing. Politicians’ campaign platforms often include the
call for better schools. If elected, the candidates promise to improve education as it is
defined at the moment, knowing that many Americans are dissatisfied with the
performance of public schools; yet sustained local funding for technology may depend on
the availability of data to verify positive results from the use of educational technology.
In 2014-2015, District Z allocated funding to implement a 1:1 initiative in all five of the
middle schools with the goal of affecting student achievement. Prior to this study, no
empirical data were available to the stakeholders and policymakers in District Z that
described the frequency of use of technological devices or clarified the importance of
technology access in the teaching of middle school students.
The purpose of this study was to describe to the policymakers and stakeholders in
School District Z the frequency of use of the 1:1 technology; whether students believed
that technology access in school was important to their learning; and finally, the
frequency of use of all technological devices by teachers and students. Descriptive
research, the method used in this study, allowed the researcher to focus on the current
state of 1:1 technology use through the eyes of students in District Z and to describe the
students’ perceptions of the importance of personal access to technology. The data

83
collection process involved surveying a convenience sample of approximately 1,100
middle school students from five middle schools in the district. The research instrument
was a 15-question survey developed and refined by the researcher. Prior to administering
the survey to the participants, the researcher conducted a pilot study using approximately
10% of the total population. Students who participated in the pilot study did not
participate in the final data collection phase. The researcher used the results from the
pilot study to revise the research instrument, thus creating a clearer, more comprehensible
instrument for use in the formal research study.
The researcher analyzed percentages, mean, and ordinal rankings of the survey
questions that specifically answered the three research questions stated below. This
analysis allowed the researcher to assign meaning to the data and to identify common or
recurring themes that could be extracted from the numbers. Frequency and percentages
helped tell the story of the survey data. A descriptive analysis illustrated the opinions and
characteristics of the population (Creswell, 2014). Tabulated descriptions (tables) and
statistical commentary (discussion of the results) helped to summarize the data from the
study. Descriptive data explained the state of affairs that existed at the time of the
research.
The following questions guided this research study.
1. How frequently do middle school students in District Z use 1:1 technology?
2. Do middle school students in District Z believe that technology access in
school is important to learning?
3. How frequently do middle school teachers and students in District Z use other
technological devices?
In this chapter, the researcher presents the descriptive data. The findings are

84
presented according to the research questions. Finally, the researcher offers implications
and recommendations for future research.
Summary of Results Organized by the Research Questions
The first research question considered by the researcher regarding how frequently
middle school students in District Z use 1:1 technology was integral to this study.
However, no clear answer surfaced. Several responses emerged when the respondents
described the frequency of use of the 1:1 technology, with approximately 10% of students
responding that they used 1:1 technology devices in only one class and approximately
24% of participants indicating that they used the 1:1 devices regularly in five or more
classes. This finding differed from responses to survey question 2, in which nearly 80%
of participants reported using computers daily at school.
Respondent descriptions of the frequency of use in core classes revealed that the
1:1 devices were used fairly evenly across core subjects, with the largest percentage of
students, 37.19%, self-reporting use of the 1:1 devices most often in science classes. The
data did not provide a clear picture of whether the respondents sought to use the 1:1
devices during their free time. Respondents were given a choice of yes or no, and the
statistical data for that particular question were about the same for each option. Overall,
the findings revealed inconsistency in usage by class period and by subject area, coupled
with a lack of clarity as to whether students sought to use the devices during their free
time. The review of related literature highlighted the significance of uniform technology
integration in all classes. According to Weston and Bain (2010), systemic and
ubiquitous—not spotty and inconsistent—use of technology is essential in creating a new
paradigm in which technology integration becomes embedded in the school culture.
85
In summary, while the findings of this study showed a lack of uniform, consistent
use and time application of the 1:1 devices, students seem to use the 1:1 devices to some
degree during the instructional day. Therefore, the researcher could not conclude that use
of the 1:1 devices was frequent enough to describe it as embedded in the school culture to
the point that teaching, learning, and technology are integrated and inseparable (Weston
& Bain, 2010).
The second research question asked whether the middle school students in District
Z believed that technology access was important to their learning. The descriptive data
showed that the students believed that access to technology, including 1:1 devices, was
important to learning. Approximately 91% of participants held a positive perception of
access to technology and learning. Almost 41% responded that access to technology was
very important, and 50.09% responded that technological access was pretty important to
learning. The findings parallel the findings of TIP, which revealed the significance of
student perception regarding access to 1:1 technology and academic achievement. Two
thirds of sixth graders surveyed in TIP schools reported academic benefits as a result of
laptop immersion (Texas Center for Educational Research, 2009).
Further, more than 90% of all students surveyed in District Z revealed a positive
perception of access to technology and learning. When asked whether they made better
grades using the 1:1 devices, the majority of survey participants, 84.29%, replied yes.
Overall, most of the students in District Z described the 1:1 devices as a cognitive tool
rather than a toy. A negligible percentage of the students described their use of the 1:1
devices as playtime or game time. Therefore, the majority of the student respondents
noted that experience with the devices was applicable and appropriate to current lessons
being learned in class.

86
Researchers who study the results of 1:1 technological initiatives have suggested
that classrooms should replicate real-life application as much as possible (Spies et al.,
2010). Through the utilization of 1:1 technological devices, respondents in District Z
believed that what was being learned was relevant and applicable to real-life situations.
The survey findings in this study revealed that almost 70% of students believed their
experiences using the 1:1 devices were important to skills they would need in their future
endeavors. Grinager (2006) believed that technology helps prepare students for a world
where they will compete with the best and the brightest individuals globally. Further,
based on the student responses in agreement with specific perceived advantages of access
to technology (better grades, appropriate learning experiences, skills needed for the
future), the researcher concluded that access to technology facilitates the learning process
for middle school students in District Z and helps prepare them to be globally
competitive. Therefore, in spite of the inconsistent data specifically regarding use of 1:1
devices, District Z is receiving a positive return on its investment in 1:1 technology.
When students were given six choices to self-describe and asked to select all that
applied to learning while using the 1:1 devices in class, most students responded with
positive self-identifiers, including almost 63% as hardworking; approximately 60% as
interested learners; almost 50% self-labeled as engaged learners; and about 40% as
curious learners. Of the 1,108 students who responded to question 13, only 1.9% self-
described as disengaged and about 12% self-labeled as bored. These findings are
comparable to the findings from one of the largest 1:1 technological initiatives studied:
the BWL Initiative in Massachusetts. The majority of teachers and principals in BWL
Initiative schools reported increased student engagement in all student groups. In
education, student engagement refers to the level of attention, curiosity, interest,

87
optimism, and passion that a learner shows while the instruction is being delivered (Kezar
& Kinzie, 2006). During classroom observations, the BWL Initiative research and
evaluation team (Bebell & Kay, 2010) observed behaviors that indicated increased
student engagement. For example, students frequently asked teachers whether they
would be using the laptops. When teachers responded affirmatively, the students cheered
and smiled (Bebell & Kay, 2010). Increased student engagement was widely noted in
both the TIP and the MLT Initiative. Maine students commented that despite the
additional work and time required on technology-rich projects, those projects were more
engaging (Argueta et al., 2011). Therefore, it appears that students are willing to work
smarter and longer when given the cognitive tools to accomplish the task at hand.
Results from case studies of some of America’s largest 1:1 laptop initiatives from
Texas to Massachusetts supported student engagement as “one of the most substantial
benefits” of 1:1 laptops (McLeod & Sauers, 2012, p. 4). Although the data from the
study of the 1:1 technology initiative in District Z failed to uncover consistent, everyday
use of 1:1 devices, students in District Z perceived themselves as more productive and
engaged when using the technology. Finally, it is important to note that in 2014-2015,
one goal of launching the 1:1 initiative in District Z was to improve student engagement
and achievement. Based on student perceptions, that and other goals were met for many
of the middle school students in the district.
The third research question sought to describe the frequency of use of all
technological devices (including 1:1 devices) by students and teachers in District Z. This
question was fundamental considering that prior to this study, District Z stakeholders and
decision makers lacked data to support decisions for future investments in technological
devices. The findings of this study on the frequency of use of both the previously

88
purchased technology and the recently acquired 1:1 devices were designed to enable
stakeholders and policymakers to formulate informed decisions in the future.
Respondents in this study reported everyday use of technological devices,
especially computers, by students and teachers in District Z. For example, nearly 80% of
the students reported daily computer use; however, the isolated data on the use of the 1:1
technological devices revealed less than everyday use, yet indications in response to other
survey questions suggested that the frequency of use of 1:1 technology devices should be
higher.
To support the quantitative data on computer use, the SPSS 24 output showed
that, on average, most students selected daily when describing the frequency of use of
computers in general. An additional finding is that 94.84% of students surveyed either
agreed or strongly agreed that their teachers did a good job incorporating technology into
lessons. The researcher’s interpretation of the data is that teachers are not only using the
technology (especially computers) but also effectively integrating it into daily lessons.
Although the frequency-of-use data on the 1:1 devices could not be described as regular
and customary, the data indicated that, when used, most students used the 1:1 devices for
conducting research, writing, and accessing learning material. Therefore, the frequent
and customary use of all technological devices by the teachers and students in District Z
warrants the high dollar expenditures for technology. Overall, the data provided evidence
that technology is an important component of the educational process in District Z.
Study Limitations
The researcher relied solely on descriptive statistics for data analyses. The
questions, as presented on the survey, may have led to inaccurate responses or responses

89
that captured extraneous information. Additionally, the researcher served as an assistant
principal in the school district. The middle school student participants at the researcher’s
school may have answered the survey items in a way they perceived to be acceptable to
the writer rather than by providing truthful answers.
Recommendations for Further Study
Findings from this study of approximately 1,100 middle school students
document perceptions of the use of technology in general and of the 1:1 devices in
particular. Some of the answers to the survey questions that specifically queried the use
of 1:1 devices differed from the answers given regarding the use of computers in school.
Students may have confused computers that were previously purchased by the school
district with the recently purchased 1:1 devices. Further exploration and research are
needed to isolate the use of 1:1 devices. One recommendation is to conduct a similar
study with a survey instrument designed to look specifically at the use of 1:1 devices.
Additionally, adding a qualitative component to such a study could corroborate the
findings of the quantitative section and add more reliability to the results.
Summary
District Z can state that the frequency of use of computers as reported by the
students was regular and customary because, on average, the middle school students
categorized the use of computers as a daily event. Students also perceived that the
teachers do a good job of incorporating technology into the lessons. Although the data
did not show consistent use of the 1:1 devices in all classes, it did show that, on average,
the majority of the students believed that access to the technology is very important or
pretty important to learning. When middle school students reported on the use of 1:1

90
devices, most of the respondents checked positive characteristics as related to interactions
with the devices. Some students also reported getting inspired as they worked with the
1:1 devices. Further, when using 1:1 technology, the students perceived that such
learning was appropriate and applicable to skills they would need for future endeavors.
Overall, based on the quantitative findings, District Z received a passing grade for
technology usage; however, to fully integrate the 1:1 technology and ensure that the 1:1
devices are embedded in the school culture, the devices must be used more consistently.
Weston and Bain (2010) stressed the significance of a school’s demand for systematic
and ubiquitous use of technology, not spotty and inconsistent use. For District Z to move
its grade on frequency of use from passing to a grade of A+, the use of 1:1 devices must
be consistently ingrained in and systemic to both teachers and students.
Students reported being both more studious and more engaged when using the 1:1
devices. Most educators would agree that those two descriptive behaviors are precursors
to improved student achievement. The main reason District Z embarked on the 1:1
initiative in 2014-2015 was to achieve positive results in teaching and learning; therefore,
District Z has taken a major step toward advancing academic improvement for middle
school students.

91
References
Akyürek, E., & Afacan, O. (2012). Determining the 8th grade students’ misconceptions
in the unit of “cell division” by using roundhouse diagramming. International
Journal of Curriculum and Instructional Studies, 2, 47-58.
Argueta, R., Corn, J., Huff, J., & Tingen, J. (2011). Laptop initiatives: Summary of
research across seven states. Raleigh, NC: The William and Ida Friday Institute
for Educational Innovation. Retrieved from https://www.fi.ncsu.edu/wp-
content/uploads/2013/05/laptop-initiatives-summary-of-research-across-seven-
states.pdf
Baker, B., Sciarra, D., & Farrie, D. (2014, January). Is school funding fair? A national
report card (3d ed.). Retrieved from
http://www.schoolfundingfairness.org/National_Report_Card_2014.pdf
Bebell, D., & Kay, R. (2010). One to one computing: a summary of the quantitative
results from the Berkshire wireless learning initiative. The Journal of Technology,
Learning, and Assessment, 9(2), 5-54. Retrieved from
http://napoleon.bc.edu/ojs/index.php/jtla/article/viewFile/1607/1462
Bickman, L., & Rog, D. J. (1998). Handbook of applied social research methods.
Thousand Oaks, CA: Sage Publications.
Brown, R. B. (2006). Doing your dissertation in business and management: The reality
of research and writing. Thousand Oaks, CA: Sage Publications.
Brown, J. L., Jones, S., LaRusso, M. D., & Aber, J. L. (2010). Improving classroom
quality: Teacher influences and experimental affects of the 4Rs program. Journal
of Educational Psychology, 102, 153–167. Retrieved from
http://dx.doi.org.ezproxy.apollolibrary.com/10.1037/a0018160
Bryk, A. S., Sebring, P. B., Allensworth, E., Luppescu, S., & Easton, J. Q. (2010).
Organizing schools for improvement: Lessons from Chicago. Chicago, IL:
University of Chicago Press.
Butin, D. W. (2010). The educational dissertation: A guide for practitioner scholars.
Thousand Oaks, CA: Corwin.
Cook, C., Fowler, H, & Harris, T. (2008, October). Has supplemental funding helped
North Carolina counties? Retrieved from http://www.documan.net/get/SjbIVL-
BeuJ3UNat4aoXRmUQdqBYFqA66hseV86kY44,/Has-Supplemental-Funding-
Helped-NC-Counties.pdf
Creswell, J. W. (2005). Educational research: Planning, conducting, and evaluating
quantitative and qualitative research. Upper Saddle River, NJ: Pearson.

92
Creswell, J. (2014). Educational research: Planning, conducting, and evaluating
quantitative and qualitative research. Boston, MA: Pearson.
Cuban, L. (2006, October 18). Commentary: The laptop revolution has no clothes.
Education Week. Retrieved from
http://www.edweek.org/ew/articles/2006/10/18/08cuban.h26.html
Darling-Hammond, L., Zielezinski, M. B., & Goldman, S. (2014, September). Using
technology to support at-risk students’ learning. Retrieved from
https://edpolicy.stanford.edu/sites/default/files/scope-pub-using-technology-
report.pdf
Dolan, T. G. (2006, May 08). Exploring student engagement and success. The Hispanic
Outlook in Higher Education, 16, 44–46. Retrieved from
http://search.proquest.com/docview/219291366?accountid=35812
Edutopia. (2007, November 5). What is successful technology integration? Retrieved
from http://www.edutopia.org/technology-integration-guide-description
The evolution of technology in the classroom. (2016). Retrieved from
http://online.purdue.edu/ldt/learning-design-technology/resources/evolution-
technology-classroom
Flexner, S. B., & Hauck, L. C. (1987). Infrastructure. In Random House dictionary of the
English language (2d ed.). New York, NY: Random House.
Food and Nutrition Services. (2013). National school lunch program fact sheet. Retrieved
from www.fns.usda.gov/sites/default/files/NSLPFactSheet.pdf
Fox, W., & Bayat, M.S. (2007). A guide to managing research. Cape Town, ZA: Juta
Publications.
Fredricks, J., McColskey, W., Meli, J., Montrosse, B., Mordica, J., & Mooney, K. (2011).
Measuring student engagement in upper elementary through high school: A
description of 21 instruments. Retrieved from
http://ies.ed.gov/ncee/edlabs/regions/southeast/pdf/rel_2011098.pdf
Frohlich, T. (2014, June 3). States spending the most (and least) on education. Retrieved
from http://247wallst.com/special-report/2014/06/03/states-spending-the-most-
and-least-on-education/2/
Garland, S. (2014, June 17). Can high-poverty urban districts like Philadelphia close the
digital divide? Retrieved from http://hechingerreport.org/can-high-poverty-urban-
districts-like-philadelphia-close-digital-divide-2/

93
Garner, D. (2012). Research: laptops do not increase academic achievement in reading
and writing. Education Views. Retrieved from
http://www.educationviews.org/research-laptops-do-not-increase-academic-
achievement-in-reading-and-writing/
Givens, A. (2007). Systemic school reform: Texas. The Journal. Retrieved from
http://thejournal.com/articles/2007/07/01/systemic-school-reform--texas.aspx
The Glossary of Education Reform. (2014). Student engagement. Retrieved from
http://edglossary.org/student-engagement/
Glossary of terms: Adequate yearly progress. (2004, July 22). Retrieved from
http://www2.ed.gov/nclb/index/az/glossary.html#3
Goodwin, B. (2011). Educational leadership: Teaching screenagers: One-to-one laptop
programs are no silver bullet. Retrieved from
http://www.ascd.org/publications/educational_leadership/feb11/vol68/num05/One
-to-One_Laptop_Programs_Are_No_Silver_Bullet.aspx
Greene, D. (2014). Unfit to be a slave: A guide to adult education for liberation.
Rotterdam, The Netherlands: Sense Publishers.
Grinager, H. (2006). How education technology leads to improved student achievement.
Washington, DC: National Conference of State Legislatures.
Hale, J. (2011). The 3 basic types of descriptive research methods. Psych Central.
Retrieved from http://psychcentral.com/blog/archives/2011/09/27/the-3-basic-
types-of-descriptive-research-methods/
How to best define the 1:1 classroom. (2014). Retrieved from http://incare-
k12.com/clearing-things-up-how-to-best-define-the-11-classroom/
Kezar, A., & Kinzie, J. (2006). Examining the ways institutions create student
engagement: The role of mission. Journal of College Student Development, 47(2),
149–172. Retrieved from
http://search.proquest.com/docview/195184814?accountid=35812
Kuh, G. D. (2009). The national survey of student engagement: Conceptual and empirical
foundations. New Directions for Institutional Research, 141, 5-20.
Lee, J., Grigg, W., & Dion, G. (2007). The nation’s report card: Mathematics 2007:
National assessment of educational progress at grades 4 and 8. Retrieved from
http://files.eric.ed.gov/fulltext/ED498380.pdf
Leedy, P. D., & Ormrod, J. E. (2009). Practical research: Planning and design (9th ed.).
Upper Saddle River, NJ: Prentice Hall.

94
Lei, J., & Zaho, Y. (2008). One-to-one computing: What does it bring to schools?
Journal of Educational Computing Research, 39(2), 97-122.
Madden, M., Lenhart, A., Duggan, M., Cortesi, S., & Gasser, U. (2013, March 13). Teens
and technology 2013. Retrieved from
http://www.pewinternet.org/2013/03/13/teens-and-technology-2013/
Maine Learning Technology Initiative Research and Evaluation Team. (2011). A middle
school one-to-one laptop program: The Maine experience. Gorham, ME: Maine
Education Policy Research Institute. Retrieved from
http://usm.maine.edu/sites/default/files/cepare/6MLTIBrief2011_MEExp.pdf
Marks, H. M. (2000). Student engagement in instructional activity: patterns in the
elementary, middle, and high school years. American Educational Research
Journal, 37(1), 153-184.
Maryland Middle School Steering Committee. (2008). The critical middle: A reason for
hope. Retrieved from
http://www.marylandpublicschools.org/NR/rdonlyres/20FBD612-415E-42D0-
9B35-886DB1A972AF/21944/Middle_School_Task_Force_Report_6_4_08.pdf
McFarlane, A. (1997). What are we and how did we get here? In A. McFarlane (Ed.),
Information technology and authentic learning: Realizing the potential of
computers in the primary classroom (pp. 1-12). London, UK, and New York, NY:
Routledge.
McGlynn, A. P. (2008, May 05). National survey of student engagement: Findings worth
noting. The Hispanic Outlook in Higher Education, 18, 52–54. Retrieved from
http://search.proquest.com/docview/219221679?accountid=35812
McLeod, S., & Richardson, J. (2013). Supporting effective technology integration and
implementation [PRE-PRINT]. Dangerouslyirrelevant.org. Retrieved from
http://dangerouslyirrelevant.org/resources/supporting-effective-%09technology-
integration-and-implementation
McLeod, S., & Sauers, N. (2012). What does the research say about school one-to-one
computing initiatives? CASTLE, 1, 1–6. Retrieved from
http://www.natickps.org/CASTLEBrief01_LaptopPrograms.pdf
Mickelson, R. A. (1990). The attitude-achievement paradox among black adolescents.
Sociology of Education, 63(1), 44-61.
Microsoft. (2005). 1:1 computing: A guidebook to help you make the right decisions.
Retrieved from http://www.organizeK12.nc.us/1to1/HP-
Intel_one_to_one_study.pdf
National Assessment of Educational Progress (NAEP). (2016, April 27). Nation’s report
card. Retrieved from http://nces.ed.gov/nationsreportcard/

95
National Conference of State Legislatures. (2012). Charter school student achievement.
Retrieved from
www.ncsl.org/documents/educ/CharterSchoolStudentAchievement.pdf
Porter, E. (2013, November 5). In public education, edge still goes to rich. The New York
Times. Retrieved from http://www.nytimes.com/2013/11/06/business/a-rich-
childs-edge-in-public-education.html
Richtel, M. (2011, September 3). In classroom of future, stagnant scores. The New York
Times. Retrieved from
http://www.nytimes.com/2011/09/04/technology/technology-in-schools-faces-
questions-on-value.html?_r=3&emc=eta1
Roberts, E. (2004, March). Resources to support the use of Java in introductory computer
science. ACM SIGCSE Bulletin, 36(1), 233-234.
Rockman, S. (2003). Benefits-educational technology clearinghouse. Educational
Technology Clearinghouse. Retrieved from http://etc.usf.edu/l4l/benefits.html
Roschelle, J., Pea, R. D., Hoadley, C. M., Gordin, D. G., & Means, B. (2000). Changing
how and what children learn in school with computer-based technologies. The
Future of Children, 10(2), 76–101.
Rouse, M. (2005, April). Device. WhatIs.com. Retrieved from
http://whatis.techtarget.com/definition/device
Rumsey, D. J. (2016). Statistics for dummies (2nd ed.). Indianapolis, IN: Wiley
Publishing, Inc.
Silvernail, D. L., & Lane, D. M. (2004). The impact of Maine’s one-to-one laptop
program on middle school teachers and students. Retrieved from
http://www.bryan.k12.oh.us/Forms/MLTIPhaseOne.pdf
Smith, W. J., Donahue, H. D., & Viber, A. B. (Eds.) (1998). Student engagement in
learning and school life: The national project report. Montreal, QC: Office of
Research on Educational Policy, McGill University.
Spector, J. M., Merrill, M. D., Elen, J., & Bishop, M. J. (Eds). (2008). Handbook of
research on educational communications and technology. New York, NY:
Routledge.
Spies, A. R., Kjos, A. L, Miesner, A., Chesnut, R., & Fink, J. L. (2010). Use of laptops
and other technology in the classroom. American Journal of Pharmaceutical
Education, 74(8), 1–4. Retrieved from
http://search.proquest.com/docview/791782406?accountid=35812http://search.pro
quest.com/docview/791782406?accountid=35812

96
Statistical package for the social sciences (SPSS). (2016). Retrieved from
https://www.techopedia.com/definition/12401/statistical-package-for-the-social-
sciences-spss
Suen, L. J., Huang, H. M., & Lee, H. H. (2014). A comparison of convenience sampling
and purposive sampling. Hu Li Za Zhi, 61(3), 105–11. doi:10.6224/JN.61.3.105
Swidler, A. (1986). Culture in action: Symbols and strategies. American Sociological
Review, 51(2), 273-286.
Technology Literacy Challenge. (1996). American’s technology literacy challenge.
Retrieved from https://clinton4.nara.gov/WH/New/edtech/2pager.html
Texas Center for Educational Research. (2006). Evaluation of the Texas technology
immersion pilot: An analysis of baseline conditions and first-year implementation
of technology immersion in middle schools. Austin, TX: Texas Center for
Educational Research. Retrieved from https://www.tasb.org/About-
TASB/Related-Sites-and-Affiliated-Entities/TCER-
Reports/documents/etxtip/y1_etxtip_qual_fulltechnology
Texas Center for Educational Research. (2009). Evaluation of the Texas technology
immersion pilot final outcomes for a four-year study. Austin, TX: Texas Center
for Educational Research. Retrieved from
http://www.shapleyresearch.com/docs/etxtip_Final%20Outcomes.pdf
Trochim, W. M. (2000). The research methods knowledge base (2d ed.). Retrieved from
http://www.socialresearchmethods.net/kb/citing.php
Van Teijlingen, E. R., & Hundley, V. (2001). The importance of pilot studies. Social
research update, 35. Retrieved from http://sru.soc.surrey.ac.uk/SRU35.html
Vibert, A. B., & Shields, C. (2003). Approaches to student engagement: Does ideology
matter? McGill Journal of Education, 38(2), 221–240. Retrieved from
http://search.proquest.com/docview/202694066?accountid=35812http://search.pro
quest.com/docview/202694066?accountid=35812
Wells, J., & Lewis, L. (2006). Internet access in U.S. public schools and classrooms:
1994-2005. Washington, DC: National Center for Education Statistics.
Weston, M. E., & Bain, A. (2010). The end of techno-critique: The naked truth about
one-to-one laptop initiatives and educational change. Journal of Technology,
Learning, and Assessment, 9(6). Retrieved from
http://ejournals.bc.edu/ojs/index.php/jtla/article/view/1611/1458

97
Appendix A
Student Survey

98
We appreciate your taking the time to complete the following survey. It should take about
15 minutes of your time. We are interested in how you use and need technology for your
education and learning.
Please help us by completing this survey. Your responses are voluntary and will be kept
confidential. Responses will not be identified by individual. All responses will be
compiled together and analyzed as a group.
A few important things to know: You can choose to stop the survey at any time. When
you see "1:1," it means having a device for each student, as with our Chromebook carts.
Students, when you arrive at question #1, your survey administrator will tell you which
school to select. You should answer "School ____."
If you have any questions or concerns, please contact Mr. Tucker, Assistant Principal
(email removed to protect anonymity of school system involved in research study).
Thank you.
1. Which school do you attend? (Select one.) *****
❏ School A(robers)
❏ School B
❏ School C
❏ School D
❏ School E
2. How often do you use a computer in school? (Select one.) *
❏ daily
❏ weekly
❏ twice a month
❏ once a month
❏ never
❏ Other (please specify)
3. How often does your teacher use technology for classroom instruction, such as a
computer/iPad and projector, Elmo (document camera) or Promethean (smart board)?
(Select one.) *
❏ daily
❏ weekly
❏ twice a month
❏ once a month
❏ never
❏ Other (please specify)
4. How important to your learning do you feel having access to technology is (Do you
learn better from the use of technology)? (Select one.) *
❏ Very important
❏ Pretty important
❏ Not very important

99
❏ Not important at all
❏ Other (please specify)
5. Overall, my teachers do a good job of incorporating technology into their lessons.
(Select one.) ***
❏ Strongly agree
❏ Agree
❏ Disagree
❏ Strongly disagree
6. How many of your classes use the 1:1 devices regularly? (Select one.) (1:1 means
having a device for each student) *****
❏ 1
❏ 2
❏ 3
❏ 4
❏ 5 or more
7. Which classes do you use the 1:1 devices for most often? (Select one.) *****
❏ Language Arts
❏ Math
❏ Science
❏ Social Studies
❏ Enhancements
8. When you finish your work, do you seek free time to use the 1:1 device? (Select one.)
*****
❏ Yes
❏ No
9. Do you make better grades when using the 1:1 device? (Select one.) *****
❏ Yes
❏ No
10. What do you use computers for the most? (Select all that apply.) *
❏ Internet
❏ Research
❏ Writing Papers
❏ Learning Material
❏ Watching Video
❏ Playing Games
11. How do you describe your experience using your 1:1 device? (Select all that apply.)
****
❏ Play time or game time
❏ Unstructured, not sure of expected learning outcomes
❏ Applicable to what you are covering in class

100
❏ Appropriate for current classes and important for required/anticipated future skills
12. How do you feel about your learning when using the 1:1 device in class? (Select all
that apply.) *****
❏ Engaged in the activities
❏ Inspired by the activities
❏ Interested in the activities
❏ Bored by the activities
❏ Disengaged in the activities
13. Which of the following best describes you when using the 1:1 device in class? (Select
all that apply.) *****
❏ Curious learner
❏ Hardworking learner
❏ Bored (my mind is on other things)
❏ Engaged in learning
❏ Interested in learning
❏ Disengaged in learning
14. Please tell us how frequently your instructors use each of the following methods to
communicate with you. (Select one per row.) **
Daily A few times Weekly A few times
Never
per week per semester
Face-to-face either
before or after class
Face-to-face using
teacher's planning time
Phone
Personal/individual
Mass email or

101
announcement to the
whole class
Updates/announcements
on course website/Schoology
site/Edmodo
Instant messaging
15. How often do you use the following when communicating with your CLASSMATES
about courses or coursework? (Select one per row.) **
Daily A few times Weekly A few times
Never
per week per semester
Face-to-face
Phone /Cell phone
Instant messaging
References:
* 201213 Student technology survey. [Found online: https://www.surveymonkey.com/r/?sm
LdSA%2FLH5%2FXdT5PEX06FWg%3D%3D]
** Kerry, Cathy. Educational Technology Use Student Survey. University of Colorado at Boulder. Fall
2005.
*** Student Technology Use Survey. Glenwood City School District. [Found online:
http://www.gcsd.k12.wi.us/cms_files/resources/Student%20Survey%20results.pdf]
**** Tamei, Lawrence (2001). The Technology Facade: Overcoming Barriers to Effective Instructional
Technology. Allyn and Bacon, Publishers.
***** Gibson, Dr. Kathi and Tucker, William B. Personal Communication, November 13, 2015.

102
Appendix B
Permission to Use Survey Questions

103

104
Appendix C
Communication to District for Survey Approval
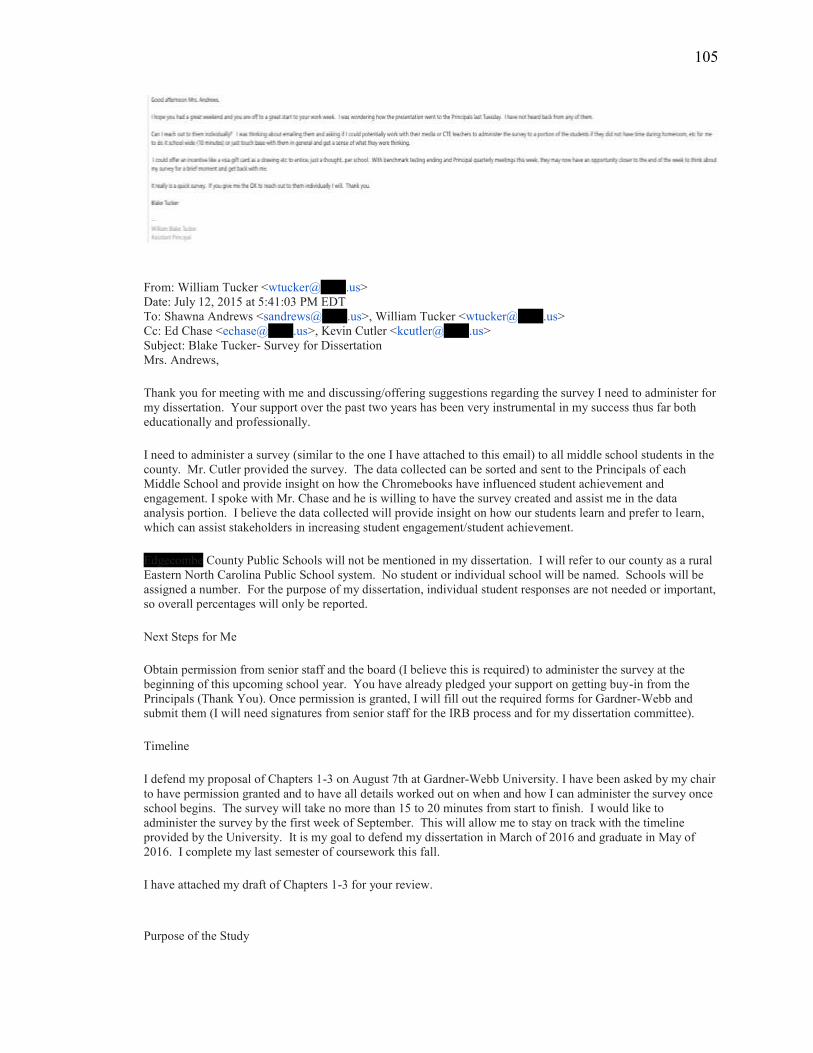
105
From: William Tucker <[email protected]> Date: July 12, 2015 at 5:41:03 PM EDT To: Shawna Andrews <[email protected]>, William Tucker <[email protected]> Cc: Ed Chase <[email protected]>, Kevin Cutler <[email protected]> Subject: Blake Tucker- Survey for Dissertation Mrs. Andrews, Thank you for meeting with me and discussing/offering suggestions regarding the survey I need to administer for
my dissertation. Your support over the past two years has been very instrumental in my success thus far both
educationally and professionally. I need to administer a survey (similar to the one I have attached to this email) to all middle school students in the
county. Mr. Cutler provided the survey. The data collected can be sorted and sent to the Principals of each
Middle School and provide insight on how the Chromebooks have influenced student achievement and
engagement. I spoke with Mr. Chase and he is willing to have the survey created and assist me in the data
analysis portion. I believe the data collected will provide insight on how our students learn and prefer to learn,
which can assist stakeholders in increasing student engagement/student achievement. Edgecombe County Public Schools will not be mentioned in my dissertation. I will refer to our county as a rural
Eastern North Carolina Public School system. No student or individual school will be named. Schools will be
assigned a number. For the purpose of my dissertation, individual student responses are not needed or important,
so overall percentages will only be reported. Next Steps for Me Obtain permission from senior staff and the board (I believe this is required) to administer the survey at the
beginning of this upcoming school year. You have already pledged your support on getting buy-in from the
Principals (Thank You). Once permission is granted, I will fill out the required forms for Gardner-Webb and
submit them (I will need signatures from senior staff for the IRB process and for my dissertation committee). Timeline I defend my proposal of Chapters 1-3 on August 7th at Gardner-Webb University. I have been asked by my chair
to have permission granted and to have all details worked out on when and how I can administer the survey once
school begins. The survey will take no more than 15 to 20 minutes from start to finish. I would like to
administer the survey by the first week of September. This will allow me to stay on track with the timeline
provided by the University. It is my goal to defend my dissertation in March of 2016 and graduate in May of
2016. I complete my last semester of coursework this fall. I have attached my draft of Chapters 1-3 for your review.
Purpose of the Study

106
The purpose of this quantitative methods study is to determine the correlation of one-to-one technological
devices on instructional student engagement and student achievement. Quantitative data will be utilized such as
standardized measures to separate statistical data that incorporates benchmark assessments, testing scores,
discipline reports, classroom climate reports, and other archival data relevant to this proposed study, and to
classroom climate and student achievement variables. This quantitative correlational study seeks to assess the
impact one-to-one technological initiatives on student achievement and student engagement levels in a public
school district within the eastern part of North Carolina. The researcher seeks to determine if the introduction of
one-to-one technological initiatives may positively influence achievement and engagement in students. By using
one-to-one technological initiatives, this research seeks to determine if the approach would significantly impact
test scores and other student achievement statistical findings. Thank you for your assistance!
On Sat, Jul 18, 2015 at 11:37 AM, William Tucker <[email protected]> wrote: Hey Mrs. Andrews. I hope you are doing well. I wanted to follow-up and see if there was anything else I need to send you regarding
my request? I am back from Las Vegas, so feel free to contact me via email or by phone if there are any questions, concerns,
or extra information needed from me. My cell is 919-264-0693. Thank you and have a great weekend. Blake Tucker
On Sat, Jul 18, 2015 at 11:37 AM, William Tucker <[email protected]> wrote: concerns, or extra information
needed from me. My cell is 919--0693264. Thank you and have a great weekend. Hey Mrs. Andrews. I hope you are doing well. I wanted to follow-up and see if there was anything else I need to send you regarding
my request? I am back from Las Vegas, so feel free to contact me via email or by phone if there are any questions, Blake Tucker
On Jul 20, 2015, at 7:33 AM, Shawna Andrews <[email protected]> wrote: Las Vegas??? I hope you had a wonderful time. Let me follow up with your request. I'll be back in touch. Shawna
On Thu, Jul 23, 2015 at 8:15 PM, Blake Tucker <[email protected]> wrote:

107
Were you able to find out anything? Thank you Blake Tucker Sent from my iPhone From: Shawna Andrews <[email protected]>xx Date: July 27, 2015 at 6:58:41 AM EDT To: Blake Tucker <[email protected]> Subject: Re: Blake Tucker- Survey for Dissertation Yes, I thought I emailed you back. I'm sorry. You are good to move forward. Let me know if you need anything.

108
Appendix D
Information Presented to Principals

109

110
Appendix E
Validation Study Given to Pilot Groups

111

112

113
Appendix F
Sample Student Highlights from Validation Study

114
115
Appendix G
Communication to Schools Regarding Survey

116

117
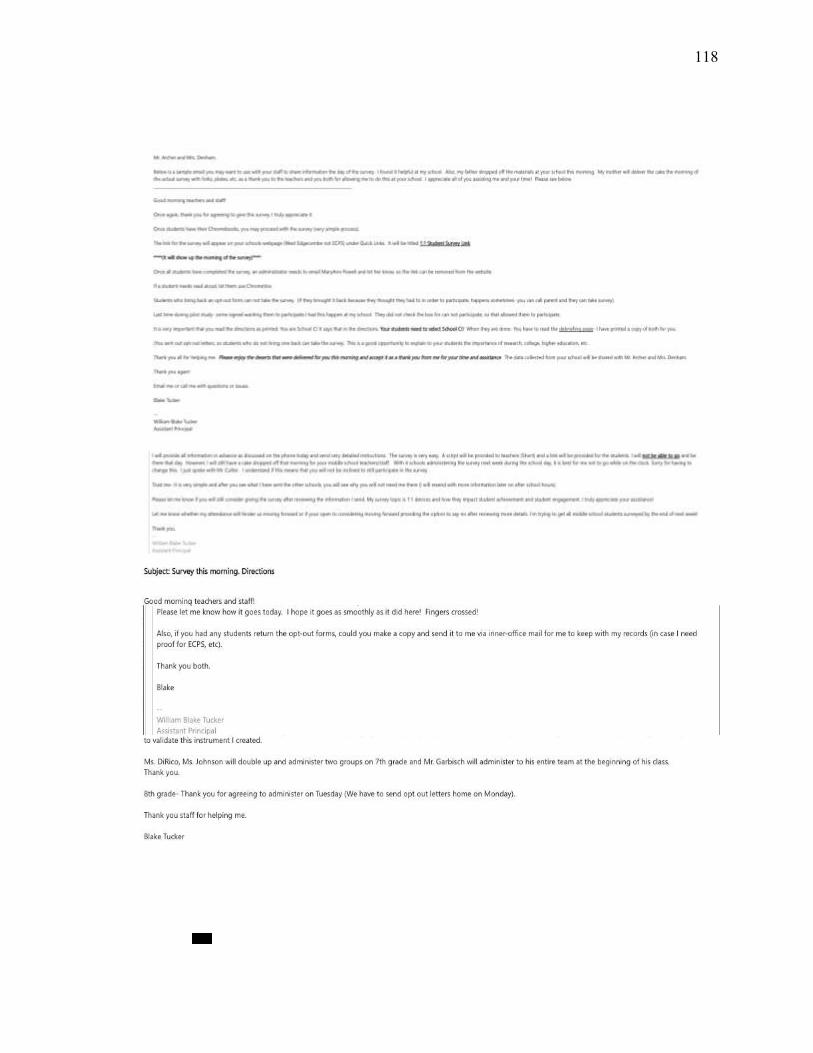
118