Embed Size (px)
Citation preview

Use of Ultra-High-Performance Concrete for Bridge Deck OverlaysFinal ReportMarch 2018
Sponsored byIowa Highway Research Board(IHRB Project TR-683)Iowa Department of Transportation(InTrans Projects 16-573 and 16-574)Federal Highway Administration

About the Bridge Engineering CenterThe mission of the Bridge Engineering Center (BEC) is to conduct research on bridge technologies to help bridge designers/owners design, build, and maintain long-lasting bridges.
About the Institute for Transportation The mission of the Institute for Transportation (InTrans) at Iowa State University is to develop and implement innovative methods, materials, and technologies for improving transportation efficiency, safety, reliability, and sustainability while improving the learning environment of stu-dents, faculty, and staff in transportation-related fields.
Disclaimer NoticeThe contents of this report reflect the views of the authors, who are responsible for the facts and the accuracy of the information presented herein. The opinions, findings and conclusions expressed in this publication are those of the authors and not necessarily those of the sponsors.
The sponsors assume no liability for the contents or use of the information contained in this document. This report does not constitute a standard, specification, or regulation.
The sponsors do not endorse products or manufacturers. Trademarks or manufacturers’ names appear in this report only because they are considered essential to the objective of the document.
Iowa State University Non-Discrimination Statement Iowa State University does not discriminate on the basis of race, color, age, ethnicity, religion, national origin, pregnancy, sexual orientation, gender identity, genetic information, sex, marital status, disability, or status as a U.S. veteran. Inquiries regarding non-discrimination policies may be directed to Office of Equal Opportunity, 3410 Beardshear Hall, 515 Morrill Road, Ames, Iowa 50011, Tel. 515-294-7612, Hotline: 515-294-1222, email [email protected].
Iowa Department of Transportation Statements Federal and state laws prohibit employment and/or public accommodation discrimination on the basis of age, color, creed, disability, gender identity, national origin, pregnancy, race, religion, sex, sexual orientation or veteran’s status. If you believe you have been discriminated against, please contact the Iowa Civil Rights Commission at 800-457-4416 or Iowa Department of Transportation’s affirmative action officer. If you need accommodations because of a disability to access the Iowa Department of Transportation’s services, contact the agency’s affirmative action officer at 800-262-0003.
The preparation of this report was financed in part through funds provided by the Iowa Department of Transportation through its “Second Revised Agreement for the Management of Research Conducted by Iowa State University for the Iowa Department of Transportation” and its amendments.
The opinions, findings, and conclusions expressed in this publication are those of the authors and not necessarily those of the Iowa Department of Transportation or the U.S. Department of Transportation Federal Highway Administration.

Technical Report Documentation Page
1. Report No. 2. Government Accession No. 3. Recipient’s Catalog No.
IHRB Project TR-683
4. Title and Subtitle 5. Report Date
Use of Ultra-High-Performance Concrete for Bridge Deck Overlays March 2018
6. Performing Organization Code
7. Author(s) 8. Performing Organization Report No.
Hartanto Wibowo (orcid.org/0000-0002-8658-7361) and Sri Sritharan
(orcid.org/0000-0001-9941-8156)
InTrans Projects 16-573 and 16-574
9. Performing Organization Name and Address 10. Work Unit No. (TRAIS)
Bridge Engineering Center
Iowa State University
2711 South Loop Drive, Suite 4700
Ames, IA 50010-8664
11. Contract or Grant No.
12. Sponsoring Organization Name and Address 13. Type of Report and Period Covered
Iowa Highway Research Board
Iowa Department of Transportation
800 Lincoln Way
Ames, IA 50010
Federal Highway Administration
U.S. Department of Transportation
1200 New Jersey Avenue SE
Washington, DC 20590
Final Report
14. Sponsoring Agency Code
SPR RB30-015
15. Supplementary Notes
Visit www.intrans.iastate.edu for color pdfs of this and other research reports.
16. Abstract
A large number of bridges in the nation are rated as structurally deficient and require immediate retrofits or replacements that will
impose a significant financial burden on bridge owners. A fast, cost-efficient, and reliable retrofit solution is needed to tackle this
problem. Typical bridge deck deterioration starts with shrinkage cracks, and additional cracks may occur due to traffic loads and time-
dependent effects, which are worsened by freeze-thaw cycles over time. These cracks then lead to water and chloride penetration into
the concrete deck, causing rebar corrosion and further damage to the superstructure.
A potential solution, suggested in a previous study, is to apply a thin layer of ultra-high-performance concrete (UHPC) on top of normal
concrete (NC) bridge decks. Because UHPC has a higher tensile strength and low permeability, cracking as well as water and chloride
ingression can be minimized, which in turn will extend the lifespan of the bridge. Moreover, UHPC is also deemed to have a higher
fatigue resistance than NC.
In this study, a new UHPC mix to accommodate surface crowning was developed by a material supplier and tested in the laboratory.
Using this new mix, the thin UHPC overlay concept was successfully implemented on a county bridge in Iowa. The implementation
involved state and county engineers, a local contractor, and a material supplier. The bridge overlay was periodically monitored, and thus
far there have been no concerns regarding the performance of the UHPC overlay or the bond at the interface between the UHPC and NC
layers. In addition to the field implementation, three concrete slabs with and without a UHPC overlay were tested in the laboratory.
The results showed that a UHPC overlay in the positive moment region increased the strength by 18% while showing a more ductile
response. In the negative moment region, although wire mesh was used, its effectiveness was not significant due to its small steel area.
The effectiveness of the wire mesh could be improved by increasing the amount of steel area within the overlay, but its impact on the
UHPC-NC interface bond needs to be evaluated.
17. Key Words 18. Distribution Statement
bridge deck overlays—concrete bridge decks—ultra-high-performance concrete No restriction.
19. Security Classification (of this
report)
20. Security Classification (of this
page)
21. No. of Pages 22. Price
Unclassified. Unclassified. 72 N/A
Form DOT F 1700.7 (8-72) Reproduction of completed page authorized


USE OF ULTRA-HIGH-PERFORMANCE
CONCRETE FOR BRIDGE DECK OVERLAYS
Final Report
March 2018
Principal Investigator
Sri Sritharan, Professor
Civil, Construction, and Environmental Engineering, Iowa State University
Research Associates
Hartanto Wibowo, Postdoctoral Research Associate
Civil, Construction, and Environmental Engineering, Iowa State University
Brian Keierleber, County Engineer
Buchanan County, Iowa Secondary Roads
Authors
Hartanto Wibowo and Sri Sritharan
Sponsored by
Iowa Highway Research Board,
Iowa Department of Transportation, and
Federal Highway Administration
(IHRB Project TR-683)
Preparation of this report was financed in part
through funds provided by Iowa Department of Transportation
through its Research Management Agreement with the
Institute for Transportation
(InTrans Projects 16-573 and 16-574)
A report from
Bridge Engineering Center
Institute for Transportation
Iowa State University
2711 South Loop Drive, Suite 4700
Ames, IA 50010-8664
Phone: 515-294-8103 / Fax: 515-294-0467
www.intrans.iastate.edu


v
TABLE OF CONTENTS
ACKNOWLEDGMENTS ............................................................................................................. ix
CHAPTER 1: INTRODUCTION .............................................................................................. 1
1.1 Introduction ..................................................................................................................... 1 1.2 Background ..................................................................................................................... 2 1.3 Research Statement ......................................................................................................... 3 1.4 Objectives ....................................................................................................................... 4 1.5 Report Layout ................................................................................................................. 4
CHAPTER 2: LITERATURE REVIEW ................................................................................... 5
2.1 Introduction ..................................................................................................................... 5
2.2 Overlay Practices and Materials ..................................................................................... 6
2.3 UHPC as an Overlay Material ........................................................................................ 7 2.4 Nondestructive Testing for Delamination Assessment ................................................. 12
CHAPTER 3: FIELD IMPLEMENTATION AND MONITORING ...................................... 14
3.1 Introduction ................................................................................................................... 14 3.2 Selected Bridge ............................................................................................................. 14 3.3 UHPC Mix .................................................................................................................... 15
3.4 UHPC Overlay Construction ........................................................................................ 15 3.5 Thermal Imaging Validation Study .............................................................................. 21
3.6 Concrete Slabs with UHPC Overlay ............................................................................. 23 3.7 Thermal Imaging on Concrete Slabs............................................................................. 24 3.8 Pull-Off Tests ................................................................................................................ 26
3.9 Thermal Imaging on Mud Creek Bridge Deck ............................................................. 28
CHAPTER 4: LABORATORY TESTING AND ANALYSIS ............................................... 31
4.1 Introduction ................................................................................................................... 31 4.2 Specimen Details .......................................................................................................... 31
4.3 Test Setup...................................................................................................................... 33 4.4 Instrumentation ............................................................................................................. 35
4.5 Experimental Observations, Results, and Analysis ...................................................... 37
CHAPTER 5: CONCLUSIONS .............................................................................................. 48
REFERENCES ............................................................................................................................. 49
APPENDIX A: UHPC FOR LOCAL BRIDGE APPLICATIONS WORKSHOPS .................... 55

vi
LIST OF FIGURES
Figure 1.1. Typical examples of bridge deck deterioration .............................................................1 Figure 1.2. UHPC overlay ...............................................................................................................2
Figure 1.3. Jakway Park Bridge with UHPC pi-girders in Buchanan County, Iowa .......................3 Figure 2.1. Common bridge deterioration........................................................................................5 Figure 2.2. Slant shear tests conducted at Iowa State University ....................................................8 Figure 2.3. Flexural tests conducted at Iowa State University ........................................................9 Figure 2.4. Casting of UHPC during bridge deck strengthening on the Chillon Viaducts ............10
Figure 2.5. Test setup for interface roughness tests .......................................................................11 Figure 2.6. Results from previous tests at Iowa State University ..................................................12 Figure 3.1. Mud Creek Bridge deck before UHPC overlay application ........................................14 Figure 3.2. UHPC overlay plan......................................................................................................16
Figure 3.3. Overlay construction: (a) roughened deck surface prior to placing the overlay,
(b) placing of the UHPC overlay with a screed, (c) UHPC overlay after casting
one lane, (d) grinding of the surface, (e) grooving of the surface, and (f) close-up
view of the finished surface ..........................................................................................20 Figure 3.4. Completed Mud Creek Bridge in February 2017 ........................................................21
Figure 3.5. Plan and section views of the concrete slab with known defects ................................22 Figure 3.6. Plan view of approximate delamination areas (left) and example infrared image
of delaminated zone 1 (right) ........................................................................................22 Figure 3.7. Plan and section views of the concrete slabs with UHPC overlay ..............................24 Figure 3.8. Test specimens placed outside of the laboratory: Slab A (left) and Slab B
(right).............................................................................................................................24 Figure 3.9. Stage One infrared imaging results for Slab A (left) and Slab B (right) .....................25
Figure 3.10. Stage Two infrared imaging results for Slab A (top) and Slab B (bottom) ...............26 Figure 3.11. Pull-off test on Mud Creek Bridge deck ....................................................................27
Figure 3.12. Typical failure mode from pull-off test on Mud Creek Bridge deck ........................27 Figure 3.13. Thermal image scanning of Mud Creek Bridge using thermal camera mounted
on a vehicle ...................................................................................................................28 Figure 3.14. Infrared imaging results for Mud Creek Bridge deck ...............................................29 Figure 4.1. Surface preparation on concrete deck used for slab specimens ..................................31
Figure 4.2. Pouring of UHPC overlay on the slab specimens .......................................................32 Figure 4.3. Test setup for Specimens NO (top), OT (center), and OB (bottom) ...........................33
Figure 4.4. Load Orientation 1 (left) and Load Orientation 2 (right) ............................................34 Figure 4.5. Load protocol for the tests ...........................................................................................35 Figure 4.6. Instrumentation layout for Specimen OT ....................................................................36 Figure 4.7. Slab specimens at failure for Specimens NO (top), OT (middle), and OB
(bottom) .........................................................................................................................37 Figure 4.8. Load histories used during test for all specimens ........................................................38 Figure 4.9. Load versus midspan displacement plots for all three specimens ...............................39
Figure 4.10. String potentiometer and Optotrak sensor comparisons for Specimen NO ..............39 Figure 4.11. Analytical moment versus curvature plots for cross-sectional sections of
Specimens NO, OT, and OB .........................................................................................41 Figure 4.12. Experimental and analytical load versus deflection plots for Specimens NO
(top), OT (middle), and OB (bottom)............................................................................42

vii
Figure 4.13. Analytical load versus displacement for NC deck with UHPC overlays ..................43 Figure 4.14. Analytical load versus displacement for various cases of slabs in negative
bending ..........................................................................................................................44
Figure 4.15. Deflection profiles for Specimens NO (top), OT (middle), and OB (bottom) ..........45 Figure 4.16. Load versus UHPC-NC interface slip for Specimen OT at a location near the
support ...........................................................................................................................46 Figure 4.17. Damage to UHPC-NC interface after specimen reached peak load and shear
failure ensued ................................................................................................................47
Figure 4.18. UHPC layer pried open after the test .........................................................................47 Figure A1. First workshop in Brandon, Iowa, during a presentation by County Engineer
Brian Moore ..................................................................................................................58 Figure A2. Group photo at the end of the first workshop ..............................................................58 Figure A3. Visit to Mud Creek Bridge after completing the overlay on the first lane ..................59
Figure A4. Inspecting a UHPC mixer on site at the Mud Creek Bridge .......................................59 Figure A5. Participants at the second workshop ............................................................................60
Figure A6. Presentation by President and CEO of Walo International during the workshop .......60 Figure A7. Demonstration of UHPC mixing .................................................................................61
Figure A8. Placing UHPC overlay at ISU for demonstration purposes ........................................61 Figure A9. Drilled UHPC-NC core samples..................................................................................62
Figure A10. Inspecting deck specimens completed with UHPC overlays ....................................62
LIST OF TABLES
Table 3.1. Basic chararteristic properties of the UHPC overlay mix.............................................15 Table 3.2. Summary of detected delaminated zones......................................................................23


ix
ACKNOWLEDGMENTS
The authors would like to thank the Iowa Highway Research Board and the Iowa Department of
Transportation for sponsoring this research, and the Federal Highway Administration (FHWA)
for both the state planning and research funds used toward this research and the Moving Ahead
for Progress in the 21st Century Act (MAP-21) funds allocated to it by the FHWA Office of
Research, Development, and Technology at the Turner-Fairbank Highway Research Center.
The authors acknowledge Dominique Corvez and Gaston Doiron of LafargeHolcim (North
America) as well as Sébastien Bernardi, Laurent Ferreira, and Julien Verne of LafargeHolcim
(France) for providing technical assistance with the mixing of the ultra-high-performance
concrete and the pouring of the overlay on the laboratory test specimens and demonstration
bridge. Thanks are also extended to Buchanan County engineers Brian Keierleber and Alex
Davis for coordinating the overlay construction on the demonstration bridge. In addition, the
authors thank Doug Wood and Owen Steffens of the Iowa State University Structural
Engineering Laboratory for their guidance and assistance in the laboratory.
The authors also appreciate the support of Terri Norton of the University of Nebraska-Lincoln
for loaning the equipment used for nondestructive evaluation (NDE) and Jeramy Ashlock of
Iowa State University for the mock concrete specimen used for validating the NDE technique.
The thermal image scanning of the demonstration bridge was carried out in collaboration with
Richard Wood and Zhigang Shen of the University of Nebraska-Lincoln.


1
CHAPTER 1: INTRODUCTION
1.1 Introduction
The average bridge in the United States is 43 years old (ASCE 2017); this means that a large
number of bridges in the US have reached or will reach their intended design service life of 50
years within the next decade. Along with the aging problem, approximately 10% of the bridges
in the US are listed as structurally deficient, and over 13% of these structurally deficient bridges
are rated as functionally obsolete (FHWA 2016). Moreover, the Federal Highway Administration
(FHWA) in 2015 estimated that nearly $200 to $300 billion dollars is needed to rehabilitate or
replace all structurally deficient bridges in the nation, and $123 billion dollars is required to
repair them.
The situation is not much different in Iowa. Iowa ranks fifth on the list of states with the largest
number of bridges. The state of Iowa and its counties and cities own a total of about 24,000
bridges, with the condition of these bridges earning a letter grade of D+ (ASCE 2015). This
rating is worse than the grade of C+ assigned to the condition of bridges nationwide (ASCE
2017). Iowa is listed in the top three states with the most deficient bridges, with approximately
20% of its bridges considered deficient and/or posted with weight restrictions. The coupled
problems of aging infrastructure, the growing number of structurally deficient or obsolete
bridges, and the continuous increase in both the traffic volume and heavier vehicles in the US
require rapid improvements to the nation’s bridge stock. Therefore, there is an urgent need to
develop technologies that are not only economical and durable but can also be safely and rapidly
implemented in practice. Such technologies will remedy the aforementioned problems and
extend the life of bridges, whose deterioration often starts with cracking on the top surface of
bridge decks, as shown in Figure 1.1.
©2017 The Constructor (https://theconstructor.org/)
Figure 1.1. Typical examples of bridge deck deterioration

2
Over time, this damage can lead to unrepairable deterioration of the deck and even some damage
to girders and substructures. In this study, an innovative solution for bridge deck overlay that can
potentially prolong the life of bridge decks utilizing ultra-high-performance concrete (UHPC) is
further investigated.
1.2 Background
The most common bridge deterioration begins with cracking in the deck, followed by water and
chloride infiltration into the concrete core and corrosion damage to the reinforcement of the
deck. Further damage to the bridge deck occurs due to the impact of freeze-thaw cycles,
exposure to deicing salts, and deterioration due to dynamic loads from vehicular traffic and plow
trucks. Cracking on bridge decks is a common sighting, and bridge deck deterioration is a
leading cause of the structurally obsolete or deficient inspection rating of bridges. This
deterioration is worsened by the exposure of the deck reinforcement to environmental conditions
such as moisture, temperature, and chloride. For typical concrete bridge decks with a 2 in. cover,
maintenance is required after approximately 7.5 years (Cady and Weyers 1984). A more recent
study on bridges in Virginia also showed that, on average, it only takes four to eight years for
corrosion to initiate in non-supplementary cementitious material concrete decks under regular
traffic and environmental conditions (Balakumaran et al. 2017).
To protect the concrete deck from water and chemical penetration, an overlay with a thickness of
1.5 to 2.0 in. is typically used in Iowa and other states; the overlay also serves as a wearing
surface. To achieve these desirable functions, the overlay is required to have sufficient strength
and durability. One innovative solution that has been developed to combat water and chemical
penetration is conceptually simple. It involves overlaying a thin layer of highly durable UHPC
integrally at the top of the concrete deck, as shown in Figure 1.2.
Figure 1.2. UHPC overlay
UHPC also has desirable properties such as low porosity, a water absorption factor, and a higher
post-cracking tensile capacity. Previous research was carried out to determine the minimum
interface roughness to achieve a desirable bond strength between the UHPC and normal concrete
(NC) layers (Aaleti and Sritharan 2017). UHPC has extremely desirable engineering and
UHPC Overlay
NC Deck

3
durability properties (Vande Voort et al. 2008, Sritharan 2015), which can give bridges a design
life of 75 years or longer. The combined engineering and durability properties help to control
deck cracking and penetration of chloride ions into the bridge deck, both of which are, as
previously noted, common problems in today’s bridge decks. However, UHPC is a relatively
costly material and may not be feasible for use in the entire bridge deck, as UHPC was used in
the Jakway Park Bridge shown in Figure 1.3, or the whole bridge.
Figure 1.3. Jakway Park Bridge with UHPC pi-girders in Buchanan County, Iowa
Also, placing any mechanical connection between the two layers of concrete further increases the
construction and material costs of the deck. Therefore, technology has been developed with
support from the Iowa Department of Transportation (DOT) to promote the use of UHPC as an
overlay material on top of bridge decks made from NC without any mechanical connection at the
interface. This research is part of an effort to evaluate the developed technology and demonstrate
that the deck acts as a composite section when subjected to flexural and shear loadings.
Thus far, UHPC has gained significant momentum in terms of its utilization in bridge
applications among several DOTs and the FHWA, particularly for deck closure joints. However,
the initial capital cost of a UHPC bridge deck is comparatively higher than the traditional normal
strength concrete decks. This high initial cost may hinder the wider usage of UHPC decks in
bridges. Minimizing the use of UHPC, in this case by using a thin layer of UHPC as an overlay,
can significantly reduce the initial cost while providing a reliable solution for bridge
deterioration problems that, in turn, will enhance the bridge’s service life.
1.3 Research Statement
This research is a continuation of previous research carried out at Iowa State University, which
investigated a suitable shear friction interface between UHPC and NC and evaluated the
performance of the overlay through flexure tests (Aaleti and Sritharan 2017). Although the
4
potential for utilizing UHPC as an overlay material was demonstrated, the nature of UHPC as a
self-compacting material made it difficult to place such material on sloped deck surfaces. A
collaboration with a material supplier was made to come up with a new UHPC mix as a solution
to this problem. The research presented in this report investigates the use of this new UHPC mix
as an overlay on concrete bridge decks, including its workability and its ability to be placed on
sloped surfaces. An assessment of the UHPC overlay through nondestructive evaluation and
laboratory testing is also provided.
1.4 Objectives
This study aimed at advancing the developed UHPC overlay technology through the following
objectives:
Evaluate the new UHPC mix design that is intended to allow the deck overlay to be
completed with appropriate crowning
Demonstrate the applicability of the new UHPC mix by performing a deck overlay on an
existing bridge
Conduct a performance evaluation of the UHPC overlay
Evaluate the benefits of using UHPC overlays through experimental testing
1.5 Report Layout
The first chapter of this report consists of the introduction, background, research statement, and
objectives. The second chapter provides a review of the literature related to UHPC overlays and
nondestructive testing. The third chapter discusses the demonstration of the overlay on an
existing bridge and the mock slab specimens. The fourth chapter describes the laboratory testing
of the slab specimens. Finally, the fifth chapter presents the conclusions and recommendations
stemming from this research.
5
CHAPTER 2: LITERATURE REVIEW
2.1 Introduction
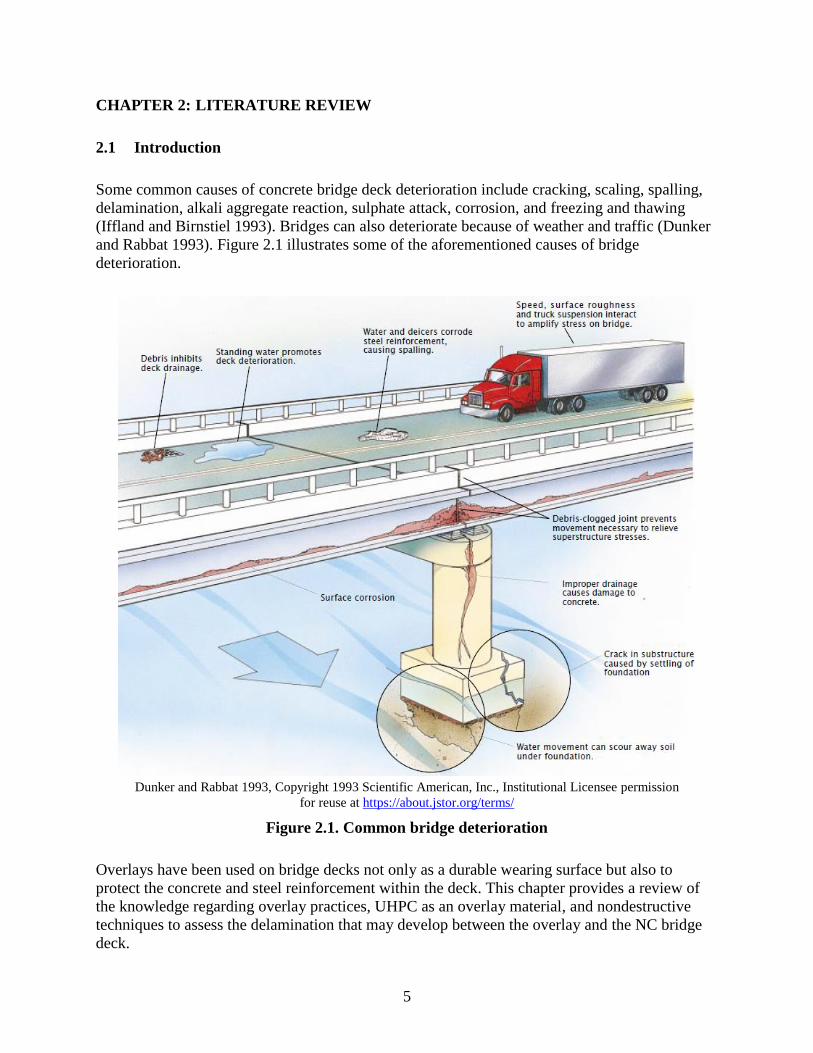
Some common causes of concrete bridge deck deterioration include cracking, scaling, spalling,
delamination, alkali aggregate reaction, sulphate attack, corrosion, and freezing and thawing
(Iffland and Birnstiel 1993). Bridges can also deteriorate because of weather and traffic (Dunker
and Rabbat 1993). Figure 2.1 illustrates some of the aforementioned causes of bridge
deterioration.
Dunker and Rabbat 1993, Copyright 1993 Scientific American, Inc., Institutional Licensee permission
for reuse at https://about.jstor.org/terms/
Figure 2.1. Common bridge deterioration
Overlays have been used on bridge decks not only as a durable wearing surface but also to
protect the concrete and steel reinforcement within the deck. This chapter provides a review of
the knowledge regarding overlay practices, UHPC as an overlay material, and nondestructive
techniques to assess the delamination that may develop between the overlay and the NC bridge
deck.

6
2.2 Overlay Practices and Materials
All DOTs across the US are concerned about the maintenance and rehabilitation of bridge decks.
However, the limited availability of funds forces bridge owners to extend the service life of
existing bridge decks with effective rehabilitation methods. Therefore, bridge design guidelines
by DOTs often specify material properties, mix designs, and construction methods in their efforts
to minimize distress in concrete bridge decks. Some of the most frequently used deck
rehabilitation procedures include overlays, membranes, sealers, and cathodic protection.
However, the focus in this study is limited to overlays.
An overlay layer creates a protective barrier on top of the concrete bridge deck to prevent or
minimize cracking and the penetration of water, oxygen, and especially chlorides from deicing
agents into the bridge deck. Crack propagation into the concrete deck, along with highly porous
overlay material, further provides access for salt and moisture to reach the steel reinforcement.
Some of the strategies utilized to improve deck performance include the use of increased
concrete cover, low-slump dense concrete overlays, latex-modified concrete overlays, polymer
concrete, interlayer membranes, asphaltic concrete systems, and epoxy-coated reinforcement to
prevent or delay chloride penetration into the reinforcement (Bergren and Brown 1975, Steele
and Judy 1977, Babaei and Hawkins 1988, Kepler et al. 2000). However, these strategies have
had mixed success in improving deck service life (Russell 2004). The use of asphalt material,
which is a very popular overlay material, can also increase gas emission and harm the
environment (Rubio et al. 2012). The main goal of these rehabilitation methods and materials is
to adequately protect the already distressed or damaged primary concrete and reinforcement of
the deck system from conditions that will continue the deterioration.
Installation of an overlay is often appropriate if the deck has little to moderate deterioration but
will likely experience deterioration in the future and if the deck is not in need of immediate
replacement. Bonded overlays provide a new wearing surface that allows deck surface
conditions, such as cross-slope and grade, joint transitions, drainage, abrasion resistance, skid
resistance, or scaling problems, to be improved. Overlays also provide good protection to decks
that have many cracks. Rarely do existing cracks in bridge decks reflect directly through a new
bonded overlay. Overlays are well suited for decks in very high traffic areas where it is
expensive and very disruptive to replace the deck using staged construction. For decks in rural
areas with low traffic volumes, the cost and disruption of deck replacement should be compared
to the value gained by installing an overlay. Bond strength between the overlay material and the
deck is important to ensure composite action between the two materials. Several problems that
may affect the bond strength of overlays include differential shrinkage, fatigue from traffic load,
and environmental loads such as freeze-thaw effects and corrosion (Silfwerbrand 2017).
Bonded overlays normally add structural capacity to the deck because the deck is thickened;
however, overlays add dead load to the supports and substructure. Conventional rigid overlays
are often placed at thicknesses of 3 in. or greater, resulting in a dead load increase of 36 lbs/ft2 or
more. Latex-modified concrete overlays are typically placed at a thickness of 1.25 to 3 in.,
resulting in a dead load increase of approximately 15 to 36 lbs/ft2. Polymer concrete overlays are
placed at thicknesses of 0.375 to 1.5 in., resulting in a dead load increase of approximately 5 to

7
18 lbs/ft2. Some polymer concrete systems are available that can be placed much thicker, if a
wide range of overlay thicknesses is needed. The amount of increased dead load can be reduced
by using thin overlays or by milling the concrete cover prior to placing the overlay. Milling is
used to remove deteriorated wearing surfaces as well as chloride-contaminated concrete.
Usually, it is recommended that at least 0.5 to 1 in. of the original concrete cover is left over the
reinforcing steel bars to maintain bar encapsulation. If the top portion of the steel is exposed in a
chloride-contaminated deck, rapid corrosion of the steel can result in premature bond failures.
Milling near the top reinforcing layer may make future overlays more difficult because little
concrete cover is left over the steel. If the reinforcing steel is exposed during milling, the
concrete should be removed to at least 0.75 in. below the steel, usually by using small pneumatic
hand tools. This is costlier and increases the time needed to install the overlay. In general, the
depth of milling should be kept to a minimum, but the depth should depend on the condition of
the deck surface, the chloride contamination profile within the deck, dead load and elevation
considerations, and possibly other factors.
It is important not to damage the bottom mat of reinforcement or the studs attached to the tops of
the steel girders within areas of deep concrete removal. These bars and studs provide structural
integrity and composite action between the deck and girders. Usually, deep removal areas are
patched independently prior to placing the overlay concrete. The allowable increase should be
assessed for dead load and to determine whether clearance or grade issues exist overhead or at
safety barriers, joints, or drains. Clearance issues at barriers, drains, and joints can sometimes be
accommodated by milling the concrete cover and tapering the overlay at these areas. However,
milling the deck at local areas reduces the integral concrete cover and could increase the risk of
corrosion if the overlay cracks or debonds at these often-critical areas near joints or overhangs.
The engineer has to determine whether increased dead load or clearance issues exist or there is a
need for drainage or slope corrections and select an overlay best suited for the site conditions.
Overlays can be either single layered or double layered. Single-layered overlay systems are
homogenous mixtures of chemicals and aggregates, while double-layered overlay systems have
two distinct layers, a lower layer that is effective at waterproofing and an upper layer that
provides skid resistance and protection for the lower layer from the damaging effects of traffic.
Thus far, the most commonly used overlays consist of asphalt, latex-modified concrete, silica
fume concrete, low-slump dense concrete, fly ash concrete, or polymer concrete. Some DOTs
also use thin and ultra-thin concrete overlays that have performed satisfactorily (Chen et al.
2016). NCHRP Synthesis 333 (Russell 2004) provides information on previous and current
designs and construction practices used to improve the performance of bridge decks.
2.3 UHPC as an Overlay Material
Given that deck deterioration occurs due to the formation of cracks on the top surface, a very
cost-effective yet highly durable bridge deck could be achieved through a composite bridge deck,
which is formed by overlaying a thin UHPC layer over a NC slab. This requires good bonding
between the UHPC and NC at the interface. Harris et al. (2011) stated that the bond strength at
the interface is proportional to the surface preparation, i.e., the roughness of the surface. A more
rigorous study to characterize the shear friction behavior between UHPC and NC surfaces was

8
previously carried out at Iowa State University. Through 60 slant shear tests (shown in Figure
2.2) and four flexural tests (shown in Figure 2.3) performed on concrete beams overlaid with
UHPC, it was found that the desired response for the composite action can be achieved when a
minimum interface roughness of about 1/8 in. (or 3 mm) is ensured by placing thin grooves on
top of a newly cast concrete deck or through hydro-demolition of the top layer of an existing
bridge deck (Aaleti et al. 2013).
Bridge Engineering Center at Iowa State University
Figure 2.2. Slant shear tests conducted at Iowa State University

9
Bridge Engineering Center at Iowa State University
Figure 2.3. Flexural tests conducted at Iowa State University
A more recent study by Li and Rangaraju (2016) using flexural bond testing also showed that for
specimens with a roughened surface, the failure occurred in the NC, but if the surface was not
roughened, the failure occurred at the bond between the UHPC and NC. Although heat treatment
might affect the bond strength between the NC and UHPC, this effect is still unquantifiable
(Zingaila et al. 2016), and thus far research at Iowa State University has not found heat treatment
to be an issue affecting bond strength.
UHPC has been used for bridge deck rehabilitation in some European countries, such as the
Netherlands (Buitelaar and Braam 2006) and Switzerland (Brühwiler and Denarié 2013, Denarié
and Brühwiler 2015, Brühwiler et al. 2015). In these cases, a thick UHPC layer with reinforcing
reinforcement bars were added to form a stronger NC-UHPC composite deck, as shown in
Figure 2.4, rather than using a thin layer of UHPC as an overlay.

10
Sri Sritharan
Figure 2.4. Casting of UHPC during bridge deck strengthening on the Chillon Viaducts
Although a composite deck increases the flexural and shear strength capacities, the
corresponding construction costs also increase. As a result, the widespread use of this technology
may be hindered. In the proposed method, the UHPC is used primarily as an overlay without any
reinforcement except, if required, over the piers in the negative moment region. Deck overlays
are typically used not to add strength but to function as a protective layer. Moreover, an
analytical study by Shann et al. (2012) and laboratory tests conducted by Aaleti et al. (2013) and
Khayat and Valipour (2014) have shown that a thin layer of UHPC overlay is adequate to protect
the top surface of a bridge deck.
Prior to this study, a similar set of flexural tests was carried out at Iowa State University to
evaluate the surface roughness of the interface. The tests were conducted on four slabs of the
same dimensions, 2 ft × 8 ft, with a 6 ft clear span, an NC layer thickness of 7.75 in., and a
UHPC layer thickness of 1.5 in., as shown in Figure 2.5.
European Patent EP 3 135 814 (Pending)

11
Bridge Engineering Center at Iowa State University
Figure 2.5. Test setup for interface roughness tests
There were four slabs tested with the following interfaces: (a) broom-finished roughness, (b) 6
mm roughness, (c) 3 mm roughness, and (d) standard overlay roughness. The results from these
tests showed that surface roughness affects the bond strength of the interface and that the 6 mm
surface roughness provided the highest strength among the four cases in both loading
arrangements, as seen in Figure 2.6. These two loading arrangements are further discussed in
Chapter 4.

12
Aaleti and Sritharan 2017, Bridge Engineering Center at Iowa State University
Figure 2.6. Results from previous tests at Iowa State University
2.4 Nondestructive Testing for Delamination Assessment
Applications of infrared imaging for damage detection in concrete structures have become
popular in recent years (Popovics 2003, Clark et al. 2003, Yehia et al. 2007, Bhalla et al. 2011,
Scott and Kruger 2014, Matsumoto et al. 2014, Bauer et al. 2015, Sultan and Washer 2017, Omar
et al. 2018). For concrete bridge decks, this method is most appropriate to provide rapid defect
(especially delamination) detection. A comparison of different nondestructive evaluation
techniques by Popovics (2003) found the infrared imaging and impact-echo methods to be the
most suitable techniques to evaluate delamination. However, infrared imaging has the advantage
of being fast enough that the results can be evaluated rapidly in real time (Yehia et al. 2007), and
the results are established objectively (Scott et al. 2003). In comparison, subjective data
interpretation associated with estimating wave velocities and the threshold value of attenuation
can influence the outcomes when using the impact-echo and ground penetrating radar
techniques, respectively.
As with any nondestructive technique, infrared imaging has its limitations. This technique
becomes less sensitive with increasing depth, where defects may nevertheless be present. While
a defect or delamination can be located near the surface, the actual depth of the defect remains
unknown. Studies have shown that this technique cannot capture smaller defects that are located

13
at greater depths (Cheng et al. 2008, Kee et al. 2012, Oh et al. 2013, Gucunski et al. 2013), with
a maximum depth of 3 in. able to be captured using typical thermal cameras (Abdel-Qader et al.
2008). This is because of the lateral diffusion of heat and the low temperature gradients that
exists when the defects are located deeper than the lateral dimension (Bhalla et al. 2011).
However, the continuous advancements of the technologies have produced more thermally
sensitive cameras that can identify temperature changes below 0.1°F. In addition, due to the
shallower depth of the UHPC-NC interface (overlay thickness of 1.5 in.), the limitation of
infrared imaging at greater depths is not a significant concern in the current project. The infrared
imaging detection is dependent on the camera and the associated field of view of the camera used
(Vaghefi et al. 2015), which can be improved by using a more sensitive camera.
The biggest challenges in conducting infrared imaging are mostly related to environmental
effects such as moisture, surface debris, and shadows that can affect the quality of data. One
strategy for improving data quality is to capture the image when the structure is not directly
exposed to solar radiant heating, which produces thermal gradients in concrete. However, a
recent study by Washer et al. (2013) showed that good results can still be obtained if there is a
change in ambient temperature of 8°C (approximately 15°F) or more during the time required for
data collection. Hiasa et al. (2014) proposed that imaging be conducted during the night because
the temperature differences are often more consistent than during the day. Moreover, Washer et
al. (2009) found that the optimum conditions for imaging are sustained solar heat and low wind
speeds. A more recent study by Hiasa et al. (2017) also showed promising results verifying that
infrared thermography can provide an estimation of the delamination depth.

14
CHAPTER 3: FIELD IMPLEMENTATION AND MONITORING
3.1 Introduction
As an effort to educate local stakeholders and test the newly developed technology in the field, a
county bridge was selected to be the demonstration bridge. This was the first implementation of
UHPC as a bridge deck overlay in North America. The county bridge continues to be in
operation without any concerns regarding the overlay, which was completed in May 2016. Given
the potential for this technology to be used more widely to help combat bridge deck deterioration
problems, two workshops were organized to educate state and county engineers, consultants, and
contractors. The UHPC workshops attracted multiple speakers, including materials suppliers, and
focused on the characteristics and benefits of UHPC, applications of UHPC in past projects, and
the use of the UHPC as an overlay material. The first workshop participants also had the benefit
of observing the field implementation of the UHPC overlay on the bridge described above.
Presented below are the details of the field implementation of the UHPC overlay and its
evaluation. Details of the workshops are summarized in Appendix A.
3.2 Selected Bridge
Mud Creek Bridge, built in the mid-1960s in Buchanan County, Iowa, was selected for the
UHPC overlay demonstration project. The bridge is located between the towns of La Porte and
Brandon. This is a three-span, two-lane, straight continuous concrete slab bridge. The bridge is
100 ft long and 28 ft wide. In addition, the bridge has a 5% superelevation. Prior to the UHPC
overlay retrofit, the deck of this bridge had some locally damaged regions, as shown in Figure
3.1.
Figure 3.1. Mud Creek Bridge deck before UHPC overlay application

15
3.3 UHPC Mix
To accommodate the crowning of the overlay, a special UHPC mix was developed by
LafargeHolcim. A key feature of the newly developed UHPC mix is that it has a lower slump to
accommodate surface crowning and material placement on bridge decks with superelevations
and sloping surfaces. The basic characteristics of this UHPC are presented in Table 3.1, and its
commercial name is Ductal NaG3 TX.
Table 3.1. Basic chararteristic properties of the UHPC overlay mix
Property Typical Value
Uniaxial tensile behavior type UA per MCS-EPFL (2016)
Total shrinkage at 90 days 500 µstrain
Elastic tensile strength at 28 days 1.2 ksi
Tensile strength at 28 days 1.3 ksi
Strain when the tensile strength is reached (hardening) 0.35%
Compressive strength on cube at 28 days 18 ksi
Modulus of elasticity at 28 days 6530 ksi
Water porosity at 90 days 6%
Diffusion coefficient of chloride ions at 90 days ≤ 1.1.10-12 ft2.s-1
Apparent gas permeability at 90 days ≤ 5.3x10⁻¹⁸ ft2
Source: Bernardi et al. 2016
3.4 UHPC Overlay Construction
For the demonstration project, both lanes of the bridge were overlaid by UHPC in two stages.
The plan for this overlay demonstration is presented in Figure 3.2, and a UHPC overlay
thickness of 1.5 in. was chosen for the entire bridge deck.

16
Buchanan County, Iowa Secondary Roads Department
Figure 3.2. UHPC overlay plan

17
Welded wire reinforcement (wire mesh) was placed in one lane at the pier locations to evaluate
the usefulness of such reinforcement in the negative moment region and the ease with which
such reinforcement could be used within the overlay of the bridge deck.
Construction began with removal of the old asphalt overlay and the damaged concrete from the
deck. Then, the surface of the deck was ground and grooved to expose the aggregate and create a
target surface roughness of about 1/8 in. or 3 mm. After that, water was sprayed on the deck
surface and rebars were placed at the pier locations. Then, the UHPC overlay was placed on top
of the deck along the entire length of one lane to avoid the formation of construction joints in the
transverse direction. A regular vibratory concrete screed was used for placing the material, and a
concrete curing compound was sprayed on top of the UHPC overlay immediately afterwards. A
few days later, UHPC overlay construction was performed on the other lane, with a construction
joint along the centerline of the bridge. No special detailing was adopted for the construction
joint. Once the UHPC hardened, the surface was ground and grooved to give the appropriate
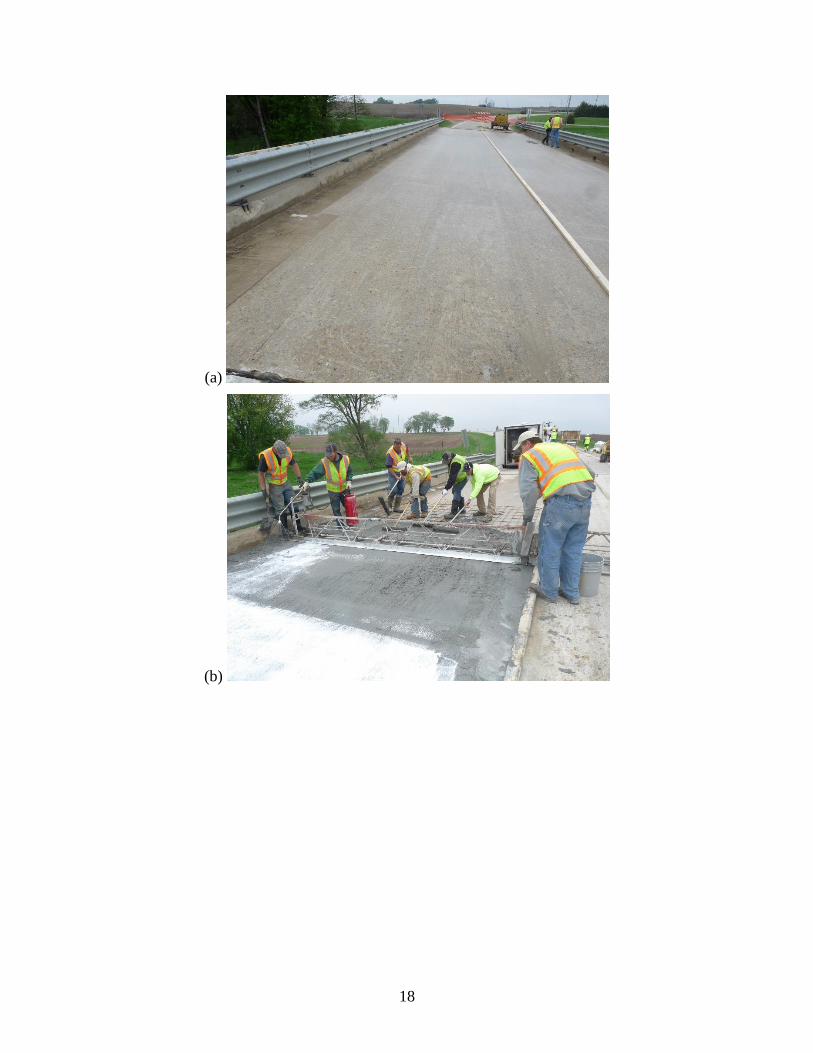
roughness for vehicular traffic. Some of the construction pictures are presented in Figure 3.3.
18
(a)
(b)

19
(c)
(d)

20
(e)
(f)
Figure 3.3. Overlay construction: (a) roughened deck surface prior to placing the overlay,
(b) placing of the UHPC overlay with a screed, (c) UHPC overlay after casting one lane, (d)
grinding of the surface, (e) grooving of the surface, and (f) close-up view of the finished
surface
Figure 3.4 shows the finished UHPC overlay on top of the bridge deck.

21
Figure 3.4. Completed Mud Creek Bridge in February 2017
Additional details of the construction experience are included in Sritharan et al. 2018.
3.5 Thermal Imaging Validation Study
Thermal imaging was used to examine the performance of the overlay, especially at the UHPC-
NC interface, and to identify any delamination. As the first step, infrared imaging of a bridge
deck mock-up with known delamination locations was conducted to validate the nondestructive
evaluation technique. This mock-up slab had dimensions of 8 ft (length) by 6 ft (width) by 8 in.
(depth). Within this slab, seven localized delaminated zones of various dimensions and depths
were placed at known locations, as shown in Figure 3.5.

22
After Lu 2015
Figure 3.5. Plan and section views of the concrete slab with known defects
Area 9 in Figure 3.5 is a solid reference zone. For this proof-of-concept test, a FLIR b50 series
thermal camera was utilized. This is an infrared camera that is specifically designed for building
inspections (i.e., insulation quality control, presence of moisture, etc.). However, its wide
temperature range of -4°F to 248°F (-20°C to 120°C) was sufficient for field evaluation of
concrete slabs. Detailed specifications of this camera include a field of view of 25° × 25°, a
spectral range of 7.5 to 13 nm, a thermal sensitivity of less than 90 mK, and an image resolution
of 140 × 140 pixels.
While this camera is particularly limited as to its image resolution compared to state-of-the-art
models, it was still adequate to identify six (out of the seven) areas of potential deck
delamination. These locations are detailed in Figure 3.6 (left) and in Table 3.2.
Figure 3.6. Plan view of approximate delamination areas (left) and example infrared image
of delaminated zone 1 (right)

23
Table 3.2. Summary of detected delaminated zones
Delaminated
Zone
(see Figure 3.6) Dimensions
Thermal
Gradient*
Approximate
Depth
(from Lu 2015)
1 12.3 in. dia. Strong 3.27 in.
2 9.6 in. x 8.9 in. Moderate 5.94 in.
3 11.5 in. x 12.8 in. Slight 5.91 in.
4 8.5 in. x 12.5 in. Moderate 5.35 in.
5 9.7 in. x 12.5 in. Strong 3.29 in.
6 5.9 in. x 12.0 in. Slight 3.28 in.
* Based on the contrast of the thermal images
An example of a representative infrared image of the deck is presented in Figure 3.6 (right). The
figure shows that this technique can provide reliable estimations of the delamination area in most
cases, particularly when the area is large and the defect is near the surface. However, the exact
depth location was not detected by the camera. Note that in this thermal infrared technique, only
the shallow- to moderate-depth delamination zones were clearly identified, which would be the
case if delamination of the overlay occurs. Two smaller delamination areas (Areas 5 and 7 in
Figure 3.5) were not detected due to the low thermal sensitivity of the employed equipment.
However, this issue would be minimized with the use of more sensitive equipment. As a
comparison, the results from an impact-echo test on the same slab can be found in Lu 2015.
From this validation test, the infrared imaging technique is deemed sufficient to detect
moderately sized areas of deck delamination.
3.6 Concrete Slabs with UHPC Overlay
Prior to conducting the field demonstration of the UHPC overlay, the new UHPC mix was
evaluated in the Structural Engineering Laboratory at Iowa State University. For this purpose,
two 8 ft (length) by 8 ft (width) by 7.75 in. (depth) concrete slabs were designed and constructed
with reinforcement details similar to those used in bridge decks to support dead and live loads.
One slab had an exposed aggregate surface (Slab A), and the other had a broom-finished surface
(Slab B) with a surface roughness of about 1/8 in. or 3 mm. Drawings of the slabs showing the
reinforcement details are presented in Figure 3.7.

24
Figure 3.7. Plan and section views of the concrete slabs with UHPC overlay
When the slabs were 43 days old, a 1.5 in. thick UHPC overlay was placed on the top of each
slab on July 22, 2015. In both cases, the slabs were positioned at a 6% slope to ensure that the
UHPC overlay could be placed on sloping surfaces. Curing of the slab specimens and overlays
was performed inside the structural laboratory. Afterwards, the slab specimens were moved to an
outdoor location for environmental exposure, as shown in Figure 3.8.
Figure 3.8. Test specimens placed outside of the laboratory: Slab A (left) and Slab B (right)
3.7 Thermal Imaging on Concrete Slabs
Infrared imaging scans on the test slabs shown in Figure 3.8 were carried out using a FLIR
T650sc camera. Detailed specifications of this camera include a field of view of 25° × 19°, a
spectral range of 7.5 to 13 μm, a thermal sensitivity of less than 20 mK, and an image resolution
of 640 x 480 pixels. The temperature range for this camera is -40°F to 3,632°F (-40°C to
2,000°C), with an accuracy of ±1%.
Specified 𝑓𝑐′ = 4 ksi,
Gr. 60 steel

25
The infrared imaging results of the Stage One scanning carried out in April 2015 are shown in
Figure 3.9.
Figure 3.9. Stage One infrared imaging results for Slab A (left) and Slab B (right)
In general, some possible delamination areas, shown as darker spots, were identified, especially
along the edges of the specimens, which could also be visually inspected. The delamination in
these areas is believed to be due to the free edges. For Slab A, a relatively strong thermal
gradient or cold region was identified in the middle of the specimen. This may be a result of high
moisture content resulting from rain and a slightly concave surface in this region, which
permitted the deposition of a water puddle. This phenomenon may have altered the scanning
results. Nonetheless, reduced thermal gradients indicated potential delamination areas in the
middle zone, as shown in Figure 3.9 (left). For Slab B, some smaller potential delamination areas
were observed at more scattered locations on the specimen, as indicated by the darker spots in
Figure 3.9 (right). Slab B was found to have relatively more scattered locations of potential
delamination compared to Slab A. However, no large potential delamination area was observed
on these two slabs.
According to the available data, some potential delamination areas on the UHPC-NC interface
may have been indicated by the infrared imaging technique. To date, no significant areas of
delamination have been identified that might question the integrity of the UHPC-NC interface.
The data from the first imaging sequence were also compared to data from the second sequence
of scanning conducted in February 2017, shown in Figure 3.10, to assess and potentially quantify
delamination resulting from freeze-thaw cycles.

26
Figure 3.10. Stage Two infrared imaging results for Slab A (top) and Slab B (bottom)
The results from the Stage Two scanning indicate cold regions similar to those previously
captured by the Stage One scanning. It can be seen that the areas of the cold regions did not grow
after the slabs experienced freeze-thaw cycles, and it can be inferred that the potential
delamination areas have remained unchanged since the construction of the slab specimens.
3.8 Pull-Off Tests
On a field inspection carried out by the Secondary Roads Department in Buchanan County using
the chain drag method, it was suspected that some areas on the deck of Mud Creek Bridge had
potential delamination issues. To evaluate this concern, the FHWA conducted several pull-off
tests on Mud Creek Bridge deck on November 28 and 29, 2016. Another set of chain drag tests
was conducted, and eight potential delamination regions were found. Out of these eight, two
potentially delaminated regions were selected for testing, one in the eastbound lane and one in
the westbound lane. For comparison, three good or intact bond areas were identified and tested,
two in the eastbound lane and one in the westbound lane. The pull-off tests were carried out
according to the direct tension bond pull-off test method described in ASTM C1583. A 2 in.
diameter saw corer was used to make a circular cut with a depth of approximately 4 in. on the
deck so that a 1.97 in. (50 mm) diameter specimen could be extracted. A pull-off tester, Proceq
DY-225, shown in Figure 3.11, was utilized to pull the specimen off.

27
Figure 3.11. Pull-off test on Mud Creek Bridge deck
The results from the potentially delaminated areas showed that the delamination occurred within
the NC deck and not at the UHPC-NC interface, as depicted in Figure 3.12.
Figure 3.12. Typical failure mode from pull-off test on Mud Creek Bridge deck
This delamination in the NC deck most likely happened even before the UHPC overlay was
applied. Thus, though the pull-off test uses a destructive testing method, it was shown that the
UHPC-NC interface bond was satisfactory. Mechanical testing verified that the locations
suspected of having a good UHPC-NC bond were able to carry relative high tensile stresses
without bond failure. Furthermore, visual inspections also indicated that the interface between
Steel Disk
(Part of Test Device)
UHPC
NC

28
the UHPC overlay and the deck concrete appeared intact. Additional results of the pull-off tests
are presented in a separate report published by the FHWA (Haber et al. 2017).
3.9 Thermal Imaging on Mud Creek Bridge Deck
Thermal image scanning was performed on Mud Creek Bridge on February 5, 2017 to assess the
delamination potential of the UHPC overlay. The thermal camera was mounted on top of a car
before the car was driven over the bridge, as shown in Figure 3.13.
Figure 3.13. Thermal image scanning of Mud Creek Bridge using thermal camera mounted
on a vehicle
A camera was also mounted on a drone and flown over the bridge to obtain an aerial view of the
bridge. The thermal camera used was a FLIR A8303sc. The spectral range of this camera is 3 to
5 μm, and the camera has a resolution of 1,280 × 720 pixels. The standard temperature range is -
20°C to 350°C (-4°F to 662°F). The filtered results of the thermal imaging are presented in
Figure 3.14.
Thermal Camera

29
Figure 3.14. Infrared imaging results for Mud Creek Bridge deck

30
The areas of potential delamination are indicated by darker regions. Most of these areas are
consistent with the ones indicated by the chain drag method that was used when the pull-off tests
were carried out. Some of these areas are located near the approach boundaries and on top of the
piers, where the NC deck had been found to have cracking. Taking into account the results from
the pull-off tests, it was concluded that the delamination most likely occurred within the NC deck
and not at the UHPC-NC interface.

31
CHAPTER 4: LABORATORY TESTING AND ANALYSIS
4.1 Introduction
This chapter summarizes the experimental program conducted on three slabs, two of which were
constructed with the UHPC overlay in the field. Details on the test specimens, setup, and results
are included in this chapter. The test results are presented in terms of applied force, slip at the
NC-UHPC interface, and displacement.
4.2 Specimen Details
Three slab specimens were cut from a larger concrete slab, used in another project, that was
intended to represent a typical concrete bridge deck in Iowa. The size of each slab specimen was
2 ft by 8 ft. The thickness of each slab was 9 in. The plan dimensions of the specimens were the
same as the specimens used in a previous study by Aaleti et al. (2013) to investigate the
minimum interface roughness, though those slabs had a depth of 7.75 in. Two of these slab
specimens were brought to the field. The surfaces of these specimens were prepared by manually
grooving the surface using a concrete diamond saw to emulate the required roughness, as shown
in Figure 4.1.
Figure 4.1. Surface preparation on concrete deck used for slab specimens
Note that this is not the common practice, but because the width of the specimen was only 2 ft,
the surface preparation method used on the Mud Creek Bridge deck could not be followed to
prepare the surfaces of the test specimens. In addition, the same type of wire mesh used on top of
the piers in one lane of Mud Creek Bridge was secured to the top of the roughened surface of
each slab with a 0.5 in. gap under the wire mesh. Prior to pouring the UHPC overlay, the
textured normal concrete deck slabs were dampened to minimize the water loss in the UHPC due
Wire mesh

32
to absorption by the unsaturated normal concrete deck panel. Then, a layer of UHPC overlay was
poured on top of the slabs, as shown in Figure 4.2.
Figure 4.2. Pouring of UHPC overlay on the slab specimens
No heat treatment was provided to accelerate the strength gain of the UHPC so that the
preparation of the specimen mimicked the preparation method used in field conditions. The
measured concrete strength for the slabs at 28 days was 6.6 ksi. The measured rebar yield
strength was 75 ksi, with an ultimate strength of 100 ksi. The assumed UHPC compressive
strength was 17 ksi, and the tensile strength was 1.3 ksi.
All three deck specimens were tested to evaluate the performance of the UHPC overlay. Details
of the specimens are as follows:
Normal concrete deck without UHPC overlay, as a benchmark case (no overlay [NO])
Normal concrete deck with UHPC overlay on top, to represent a positive moment case
(overlay on top [OT])
Normal concrete deck with UHPC overlay on bottom, to represent a negative moment case
(overlay on bottom [OB])
Note that Specimens OT and OB were thicker than Specimen NO due to the addition of 1.5 in. of
overlay thickness.

33
4.3 Test Setup
The test setup for all three cases is shown in Figure 4.3.
Figure 4.3. Test setup for Specimens NO (top), OT (center), and OB (bottom)
Hydraulic Jack
Load Cell
Loading Frame to Simulate Wheel Load

34
The slab specimens were simply-supported with a hinge and a roller. The center-to-center
distance between the supports was 6 ft. This simply-supported test configuration was chosen to
maximize the flexure and shear demands on the panel and, in turn, maximize the stresses at the
UHPC-NC interface. A rubber pad was placed on top of the surface of each slab. Directly on top
of the rubber pad, a 10 in. by 20 in. steel plate, representing a standard truck wheel contact area
in accordance with AASHTO design guidelines, was placed to distribute the load to the slab.
Then, the load was applied at the center of the specimen with a hydraulic actuator and was
measured using a 100-kip load cell.
The performance of the UHPC-NC interface was evaluated in two different load regimes using
two different wheel load orientations because this setup was expected to create various stress
conditions in the critical regions. As shown in Figure 4.4, Load Orientations 1 and 2 represented
wheel loads where a wheel with a width of 20 in. was oriented along the longitudinal direction
(traffic direction) and transverse direction, respectively. The two load regimes represented the
elastic and inelastic regions of the expected test unit response.
Figure 4.4. Load Orientation 1 (left) and Load Orientation 2 (right)
Load Orientation 1 subjected the specimen to higher bending stresses than Load Orientation 2 for
the same shear force. All of the specimens were subjected to the two load regimes for both load
orientations. In Load Regime 1, the specimens were subjected to loads just above the calculated
cracking values. In Load Regime 2, the specimens were subjected to loads sufficient to cause
significant cracking and failure of the specimens in shear or interface debonding. All of the
specimens were subjected to the same load protocol as illustrated in Figure 4.5, in the following
order:
1. Loading up to 12.5 kips in Load Orientation 1
2. Loading up to 21.3 kips and 48 kips in Load Orientation 2 to represent the service load
conditions expected in the prototype bridge
3. Loading up to 60 kips using Load Orientation 1 to cause shear cracking in the normal
concrete

35
Figure 4.5. Load protocol for the tests
4.4 Instrumentation
Several different types of instruments were used for this study, including a linear variable
differential transducer (LVDT), string potentiometers, and a state-of-the-art three-dimensional
(3D) Optotrak system. The LVDT was placed at the UHPC-NC interface at midspan. A total of
five string potentiometers were used to measure the vertical displacements along the span of the
composite specimen. The string potentiometers were located at the quarter points (i.e., 18 in.
from the supports), at the center (i.e., below the center of load), and at 5 in. from the center (i.e.,
at the edge of the load in Load Configuration 1). All string potentiometers were placed along the
centerline of the specimens running in the longitudinal direction. The Optotrak system consisted
of a state-of-the-art 3D camera and LED targets. The 3D coordinates of the LED targets were
captured continuously by the camera using photogrammetry principles. Each specimen was
instrumented with at least 54 LEDs to capture the vertical and shear deformations along the span
and depth of the specimen. The LED targets were attached to the specimen using hot glue.
During the test, the data from LVDT and string potentiometers were recorded using a computer-
based data acquisition system. The instrumentation layout for Specimen OT is shown in Figure
4.6; a similar layout was used for Specimens NO and OB.

36
Figure 4.6. Instrumentation layout for Specimen OT

37
4.5 Experimental Observations, Results, and Analysis
The failure modes for all three specimens are shown in Figure 4.7.
Figure 4.7. Slab specimens at failure for Specimens NO (top), OT (middle), and OB
(bottom)

38
For Specimen NO, after the formation of flexural cracks the specimen failed in shear, where a
large shear crack formed from the area approximately 1 ft away from the support towards the
midspan, as expected. For Specimen OT, a similar shear failure mode was found, but this
occurred at a higher load. The shear cracks did not penetrate to the UHPC layer but turned
horizontally and began to separate the UHPC overlay from NC specimen. Similar observations
were made by Aaleti and Sritharan (2017). For Specimen OB, a rather brittle failure mode was
observed where a single flexural crack developed primarily in the UHPC layer at the midspan
and propagated towards the top before the specimen finally experienced flexural tension failure,
with a little bit of the concrete at the top being crushed. This failure mode is typical of cases
where tension reinforcement is insufficient to provide resistance after flexural tension cracks
form in the UHPC; to strengthen the negative moment capacity of the specimen with a UHPC
overlay, more reinforcement within the overlay would need to be provided. It is unclear at this
time whether an increased amount of steel within the overlay would adversely affect the bond
between the UHPC and NC.
The load histories for all three specimens are presented in Figure 4.8 and follow the load
protocol described earlier.
Figure 4.8. Load histories used during test for all specimens
The maximum applied loads for Specimens NO, OT, and OB are 48.22 kips, 61.58 kips, and
32.59 kips, respectively. The load versus displacement plots for each case are depicted in Figure
4.9, which shows maximum recorded displacements of 3.53 in., 2.35 in., and 2.00 in. for
Specimens NO, OT, and OB, respectively.

39
Figure 4.9. Load versus midspan displacement plots for all three specimens
The Optotrak sensors show readings comparable to the displacement readings from the string
potentiometers, as shown in Figure 4.10.
Figure 4.10. String potentiometer and Optotrak sensor comparisons for Specimen NO

40
From these plots, it can be seen that adding a UHPC layer on top of the slab not only increased
stiffness but also enhanced the strength of the deck, as evident in the 28% increase in the failure
load of Specimen OT compared to Specimen NO. For Specimen OB, where the UHPC layer was
at the bottom to simulate a negative moment region, the strength was lower due to premature
tension failure, suggesting that the amount of required steel should be increased significantly.
Analyses using OpenSees software (McKenna et al. 2000) were carried out to further explain the
experimental observations. The analyses assumptions were as follows:
NC compressive strength is 6.6 ksi, based on material testing data
NC tensile strength is 0.3 ksi, taken as 5% of the NC compressive strength
NC peak strain is 3 mε
NC ultimate strain is 6 mε
NC elastic modulus is 4,631 ksi
UHPC compressive strength is 18 ksi, based on the design strength (Table 3.1)
UHPC tensile strength is 1.3 ksi, based on the design strength (Table 3.1)
UHPC peak strain is 3.5 mε
UHPC ultimate strain is 18 mε
UHPC elastic modulus is 6,389 ksi
Rebar yield strength is 75 ksi, based on material testing data
Wire mesh yield strength is 60 ksi
Steel strain hardening ratio is 0.01
Steel elastic modulus is 29,000 ksi (assumed)
Two layers of three #5 rebars in the NC deck are located at 1.75 in. and 5.25 in. from the
bottom of the deck, based on estimated measurement
Wire mesh layer is located 0.5 in. above the NC-UHPC interface
The analytical moment-curvature of the slab sections and the corresponding force-displacement
plots of the slabs are shown in Figure 4.11 and Figure 4.12, respectively.

41
Figure 4.11. Analytical moment versus curvature plots for cross-sectional sections of
Specimens NO, OT, and OB

42
Figure 4.12. Experimental and analytical load versus deflection plots for Specimens NO
(top), OT (middle), and OB (bottom)

43
The ultimate moment for Specimen NO is 60.50 kips-ft, and for Specimen OT the ultimate
moment is 91.82 kips-ft, which is 52% higher than that of Specimen NO. For Specimen OB the
ultimate moment is 51.78 kips-ft, which is 14% lower than that of Specimen NO. Further, the
analytical and experimental results match reasonably well in terms of the initial stiffness and
peak load. The discrepancies may come from the assumed versus actual values of the material
properties and the locations of the reinforcement bars. Because the NC deck without overlay was
not tested upside down, the load-displacement plot for Specimen OB was obtained analytically
for comparison. Considering the overestimation of the analytical peak load for this specimen, it
is apparent that after the UHPC overlay experienced tension fracture, the strength of the test
specimen was comparable to that of the NC deck. For Specimen OT, the increase in strength of
the deck with the UHPC overlay is attributed to the coupled effects of the height increase due to
the overlay thickness and the higher compressive strength of the UHPC. This is demonstrated in
the analysis results presented in Figure 4.13.
Figure 4.13. Analytical load versus displacement for NC deck with UHPC overlays
If the UHPC overlay had been replaced by an NC overlay with the same 1.5 in. thickness, the
peak load would have dropped by only 18%, from 61.22 kips to 50.06 kips. The 9 in. thick NC
deck alone has a strength of 40.33 kips, which represents a 34% drop in strength. It can also be
seen in Figure 4.13 that the use of a UHPC overlay on the top of the slab increases ductility
significantly due to the increase in the steel strain caused by the upward shift of the neutral axis.
A comparison of the failure patterns of Specimens NO and OT in Figure 4.7 suggests that the
increase in strength was possible despite both units failing in shear because the shear crack was
not able to penetrate through the overlay in Specimen OT.

44
Figure 4.14 shows different analysis cases for decks with the UHPC layer at the bottom, which
represent a negative bending condition.
Figure 4.14. Analytical load versus displacement for various cases of slabs in negative
bending
The results obtained for OB Analytical in Figure 4.14 show improvement in terms of the
inelastic response, which resembles that of the NC deck–only case. This finding and the test
observations suggest that the contributions of the wire mesh in terms of strength were negligible.
Rather, the increase in cracking strength above the NC deck was due to the higher moment of
inertia resulting from the increase in the thickness of the specimen. Most of the inelastic action
appears to have come from the steel reinforcement in the NC slab. The wire mesh reinforcement
can make a greater contribution to the UHPC overlay if the area of the reinforcement is
significantly increased. However, this change may affect the bonding between the UHPC and
NC.
The deflection profiles obtained from the string potentiometer data are presented in Figure 4.15.

45
Figure 4.15. Deflection profiles for Specimens NO (top), OT (middle), and OB (bottom)

46
The deflection profile for Specimen OB is slightly different than the profiles for Specimens NO
and OT due to the different failure modes. Figure 4.16 shows load versus NC-UHPC interface
slip for Specimen OT at a location near the support where slip began to develop after the
penetration of the shear crack.
Figure 4.16. Load versus UHPC-NC interface slip for Specimen OT at a location near the
support
At the midspan location directly underneath the applied load, no lateral slip was observed until
the end of the test. The lateral slip near the support was insignificant until the load dropped
below 40 kips and experienced a vertical displacement of about an inch. As the slab continued to
become displaced, the separation grew until it reached a slip of more than 1.0 in. towards the end
of the test. The growth in slip was due to the continuous penetration of the shear crack along the
interface, as seen in Figure 4.17, which damaged the interface bond across the entire width of the
specimen.

47
Figure 4.17. Damage to UHPC-NC interface after specimen reached peak load and shear
failure ensued
After the test was completed, the UHPC overlay could be pried open with a pry bar, as depicted
in Figure 4.18.
Figure 4.18. UHPC layer pried open after the test
It should be noted that the surface of the specimen was not prepared using the standard protocol.
While this approach could have contributed to reducing the bond strength, it is remarkable that
the performance of Specimen OC was good until reaching peak strength.

48
CHAPTER 5: CONCLUSIONS
A study on the use of UHPC as a bridge deck overlay has been presented in this report, with the
primary tasks being demonstration of a UHPC overlay in the field and laboratory testing of deck
specimens with and without overlays. In addition, the field demonstration included conducting
two workshops to educate state and county engineers, consultants, and contractors on new UHPC
overlay technology.
The following conclusions were drawn from the study:
The UHPC overlay technology developed in a previous phase of research was successfully
demonstrated on Mud Creek Bridge in Buchanan County, Iowa, as a viable technology.
The new UHPC mix developed by LafargeHolcim was found to be suitable for use in bridge
deck overlay projects. The material, which was placed during the demonstration project with
the help of a vertical vibratory screed, was appropriate for crowning and for placing the
material on sloping deck surfaces. Both nondestructive and destructive evaluations were
performed on the Mud Creek Bridge deck to evaluate the performance of the overlay over the
course of one year. No concerns have been identified for the top surface nor the interface
bond between the old concrete deck and the UHPC overlay, suggesting that the surface
preparation method adopted for Mud Creek Bridge was satisfactory.
The laboratory tests were conducted on three specimens, two of which had increased depth
due to the addition of the overlay and wire mesh reinforcement. The specimen with the
UHPC overlay on top, which simulated a positive moment region, showed increased stiffness
and strength compared to the NC deck–only specimen. Both increases are due more to the
increase in depth than the addition of UHPC, but the ductility of the unit increased due to
ability of the UHPC to carry a large compressive stress.
The negative moment test also showed an increase in strength, most of which was also due to
the increase in depth. The wire mesh in the negative moment region did not contribute
significantly because its total area was fairly small and was insufficient to distribute flexural
cracks. A greater amount of reinforcement within the overlay could increase the structural
performance of the deck significantly, though it could negatively impact the bond between
the NC and UHPC. A negative aspect of increasing the depth is that it increases the self-
weight of the bridge deck.

49
REFERENCES
Aaleti, S. and S. Sritharan, 2017. Investigation of a Suitable Shear Friction Interface between
UHPC and Normal Strength Concrete for Bridge Deck Applications. Bridge Engineering
Center, Iowa State University, Ames, IA.
Aaleti, S., S. Sritharan, and A. Abu-Hawash. 2013. Innovative UHPC-Normal Concrete
Composite Bridge Deck. Paper presented at RILEM-fib-AFGC International Symposium
on Ultra-High Performance Fibre-Reinforced Concrete, October 1–3, Marseille, France.
AASHTO. 2014. AASHTO LRFD Bridge Design Specifications. Customary U.S. Units, 7th
Edition. American Association of State Highway and Transportation Officials,
Washington, DC.
Abdel-Qader, I., S. Yohali, O. Abudayyeh, and S. Yehia. 2008. Segmentation of Thermal Images
for Non-Destructive Evaluation of Bridge Decks. NDT&E International, Vol. 41, No. 5,
pp. 395–405.
ASCE. 2015. Iowa Infrastructure 2015 Report Card. American Society of Civil Engineers, Iowa
Section, Des Moines, IA.
ASCE. 2017. 2017 Infrastructure Report Card. American Society of Civil Engineers, Reston,
VA.
Babaei, K. and N. M. Hawkins. 1988. Evaluation of Bridge-Deck Protective Strategies. Concrete
International, Vol. 10, No. 12, pp. 56–66.
Balakumaran, S. S. G., R. E. Weyers, and M. C. Brown. 2017. Influence of Cracks on Corrosion
Initiation in Bridge Decks. ACI Materials Journal, Vol. 114, No. 1, pp. 161–170.
Bandelt, M. J., T. E. Frank, M. D. Lepech, and S. L. Billington. 2017. Bond Behavior and
Interface Modeling of Reinforced High-Performance Fiber-Reinforced Cementitious
Composites. Cement and Concrete Composites, Vol. 83, pp. 188–201.
Bauer, E., V. P. de Freitas, N. Mustelier, E. Barreira, and S. S. de Freitas. 2015. Infrared
Thermography – Evaluation of the Results Reproducibility. Structural Survey, Vol. 33,
No. 1, pp. 20–35.
Bergren, J. V. and B. C. Brown. 1975. An Evaluation of Concrete Bridge Deck Resurfacing in
Iowa: Special Report. Iowa State Highway Commission, Ames, IA.
Bernardi, S., D. Jacomo, and F. Boudry. 2016. Overlay Ductal®: A Durable Solution for Bridges
Retrofitting. Paper presented at the First International Interactive Symposium on UHPC,
July 18–20, Des Moines, IA.
Bhalla, S., S. Tuli, and R. Arora. 2011. Defect Detection in Concrete Structures Using Thermal
Imaging Techniques. Experimental Techniques, Vol. 35, No. 4, pp. 39–43.
Brühwiler, E. and E. Denarié. 2013. Rehabilitation and Strengthening of Concrete Structures
Using Ultra-High Performance Fibre Reinforced Concrete. Structural Engineering
International, Vol. 23, No. 4, pp. 450–457.
Brühwiler, E., M. Bastien-Masse, H. Mühlberg, B. Houriet, B. Fleury, S. Cuennet, P. Schär, F.
Boudry, and M. Maurer. 2015. Strengthening the Chillon Viaducts Deck Slabs with
Reinforced UHPFRC. Paper presented at IABSE Conference – Structural Engineering:
Providing Solutions to Global Challenges, September 23–25, Geneva, Switzerland.
Buitelaar, P. and C. R. Braam. 2006. Ultra Thin White Topping to Re-strengthen Infrastructural
Structures and Pavements. Paper presented at Sixth International DUT-Workshop on
Fundamental Modelling of Design and Performance of Concrete Pavements, September
15–16, Old-Turnhout, Belgium.

50
Cady, P. D. and R. E. Weyers. 1984. Deterioration Rates of Concrete Bridge Decks. Journal of
Transportation Engineering, Vol. 110, No. 1, pp. 34–44.
Chen, D. H., M. Won, X. Chen, and W. Zhou. 2016. Design Improvements to Enhance the
Performance of Thin and Ultra-Thin Concrete Overlays in Texas. Construction and
Building Materials, Vol. 116, pp. 1–14.
Cheng, C. –C., T. –M. Cheng, and C. –H. Chiang. 2008. Defect Detection of Concrete Structures
Using Both Infrared Thermography and Elastic Waves. Automation in Construction, Vol.
18, No. 1, pp. 87–92.
Clark, M. R., D. M McCann, and M.C. Forde. 2003. Application of Infrared Thermography to
the Non-destructive Testing of Concrete and Masonry Bridges. NDT&E International,
Vol. 36, No. 4, pp. 265–275.
Denarié, E. and E. Brühwiler. 2015. Cast-On Site UHPFRC for Improvement of Existing
Structures – Achievements over the Last 10 Years in Practice and Research. Paper
presented at HPFRCC7: 7th Workshop on High Performance Fiber Reinforced Cement
Composites, June 1–3, Stuttgart, Germany.
Dunker, K. F. and B. G. Rabbat. 1993. Why America’s Bridges are Crumbling. Scientific
American, Vol. 266, No. 3, pp. 66–72.
EPFL: MCS. 2016. Ultra-High Performance Fibre-Reinforced Cement-Based Composites
(UHPFRC): Construction Material, Dimensioning and Application. English translation
of Technical Leaflet SIA 2052 with adaptations. Laboratory of Maintenance and Safety
of Structures, Lausanne, Switzerland.
FHWA. 2016. National Bridge Inventory. Federal Highway Administration, Washington, DC.
https://www.fhwa.dot.gov/bridge/nbi.cfm. (accessed on 02/12/2017).
Gucunski, N., F. Romero, S. Kruschwitz, R. Feldmann, and H. Parvadeh. 2011. Comprehensive
Bridge Deck Deterioration Mapping of Nine Bridges by Nondestructive Evaluation
Technologies. Rutgers University Center for Advanced Infrastructure and Transportation
(CAIT), Piscataway Township, NJ.
Gucunski, N., A. Imani, F. Romero, S. Nazarian, D. Yuan, H. Wiggenhauser, P. Shokouhi, A.
Taffe, and D. Kutrubes. 2013. Nondestructive Testing to Identify Concrete Bridge Deck
Deterioration. SHRP 2 Report S2-R06A-RR-1. Second Strategic Highway Research
Program, Washington, DC.
Haber, Z. B., J. F. Munoz, and B. A. Graybeal. 2017. Field Testing of an Ultra-High-
Performance Concrete Overlay. Report No. FHWA-HRT-17-096. Federal Highway
Administration, McLean, VA.
Harris, D. K., J. Sarkar, and T. M. Ahlborn. 2011. Characterization of Interface Bond of Ultra-
High-Performance Concrete Bridge Deck Overlays. Transportation Research Record:
Journal of the Transportation Research Board, No. 2240, pp. 40–49.
Hiasa, S., R. Birgul, A. Watase, M. Matsumoto, K. Mitani, and F. N. Catbas. 2014. A Review of
Field Implementation of Infrared Thermography as a Non-Destructive Evaluation
Technology. Paper presented at the 2014 International Conference on Computing in Civil
and Building Engineering, June 23–25, Orlando, FL.
Hiasa, S., R. Birgul, and F. N. Catbas. 2017. Effect of Defect Size on Subsurface Defect
Detectability and Defect Depth Estimation for Concrete Structures by Infrared
Thermography. Journal of Nondestructive Evaluation, Vol. 36, No. 3, pp. 36–57.

51
Hor, Y., W. Teo, and S. Kazutaka. 2017. Experimental Investigation on the Behaviour of
Reinforced Concrete Slabs Strengthened with Ultra-High-Performance Concrete.
Construction and Building Materials, Vol. 155, pp. 463–474.
Iffland, J. S. B. and C. Birnstiel. 1993. Causes of Bridge Deterioration. In Bridge Management 2:
Inspection, Maintenance, Assessment, and Repair. Thomas Telford, Ltd., London, UK.
Jiang, X., Y. Yuan, C. Wu, and C. Luo. 2017. Fatigue Life Assessment of Orthotropic Steel
Deck with UHPC Pavement. Journal of Engineering, Vol. 2017, pp. 1–10.
Kepler, J. L., D. Darwin, and C. E. Locke, Jr. 2000. Evaluation of Corrosion Protection Methods
for Reinforced Concrete Highway Structures. University of Kansas Center for Research,
Inc., Lawrence, KS.
Khayat, K. H. and M Valipour. 2014. Design of Ultra-High-Performance Concrete as an
Overlay in Pavements and Bridge Decks, Center for Transportation Infrastructure and
Safety, Missouri University of Science and Technology, Rolla, MO.
Li, Z. and P. R. Rangaraju. 2016. Effect of Surface Roughness on the Bond between Ultrahigh-
Performance and Precast Concrete in Bridge Deck Connections. Transportation Research
Record: Journal of the Transportation Research Board, No. 2577, pp. 88–96.
Lu, J. 2015. Advancements in Evaluation of Air-Coupled Impact-Echo Test Method. MS Thesis.
Civil, Construction, and Environmental Engineering, Iowa State University, Ames, IA.
Matsumoto, M., K. Mitani, and F. N. Catbas. 2014. Nondestructive Bridge Deck Assessment
Using Image Processing and Infrared Thermography. Paper presented at the
Transportation Research Board 93rd Annual Meeting, January 12–16, Washington, DC.
McKenna, F., G. Fenves, and M. Scott. 2000. Open System for Earthquake Engineering
Simulation. Computer software. The Pacific Earthquake Engineering Research Center,
University of California, Berkeley, CA.
Noshiravani, T. and E. Brühwiler. 2013. Experimental Investigation on Reinforced Ultra-High-
Performance Fiber-Reinforced Concrete Composite Beams Subjected to Combined
Bending and Shear. ACI Structural Journal, Vol. 110, No. 2, pp. 251–262.
Oh, T., S.–H. Kee, R. W. Arndt, J. S. Popovics, and J. Zhu. 2013. Comparison of NDT Methods
for Assessment of a Concrete Bridge Deck. Journal of Engineering Mechanics, Vol. 139,
No. 3, pp. 305–314.
Omar, T., M. L. Nehdi, and T. Zayed. 2018. Infrared Thermography Model for Automated
Detection of Delamination in RC Bridge Decks. Construction and Building Materials,
Vol. 168, pp. 313–327.
Popovics, J. S. 2003. NDE Techniques for Concrete and Masonry Structures. Progress in
Structural Engineering and Materials, Vol. 5, No. 2, pp. 49–59.
Prem, P. R., A. R. Murthy, and M. Verma. 2018. Theoretical Modelling and Acoustic Emission
Monitoring of RC Beams Strengthened with UHPC. Construction and Building
Materials, Vol. 158, pp. 670–682.
Rubio, M. C., G. Martínez, L. Baena, and F. Moreno. 2012. Warm Mix Asphalt: An Overview.
Journal of Cleaner Production, Vol. 24, pp. 76–84.
Russell, H. G. 2004. NCHRP Synthesis of Highway Practice 333: Concrete Bridge Deck
Performance. National Cooperative Highway Research Program, Washington, DC.
Scott, M. and D. Kruger. 2014. Infrared Thermography as a Diagnostic Tool for Subsurface
Assessments of Concrete Structures. Paper presented at the First International
Construction Materials and Structures, November 24–26, Johannesburg, South Africa.

52
Scott, M., A. Rezaizadeh, A. Delahaza, C. G. Santos, M. Moore, B. Graybeal, and G. Washer.
2003. A Comparison of Nondestructive Evaluation Methods for Bridge Deck
Assessment. NDT&E International, Vol. 36, No. 4, pp. 245–255.
Shann, S. V., D. K. Harris, M. A. Carbonell, and T. M. Ahlborn. 2012. Application of Ultra-
High-Performance Concrete (UHPC) as a Thin-Overlay for Concrete Bridge Decks.
Paper presented at HiPerMat 2012 3rd International Symposium on UHPC and
Nanotechnology for High Performance Construction Materials: Ultra-High-Performance
Concrete and Nanotechnology in Construction, March 7–9, Kassel, Germany,
Silfwerbrand, J. 2017. Bonded Concrete Overlays: Over 30 Years of Swedish Research and
Experiences. Concrete International, Vol. 39, No. 5, pp. 31–36.
Sritharan, S. 2015. Design of UHPC Structural Members: Lessons Learned and ASTM Test
Requirements. Advances in Civil Engineering Materials, Vol. 4, No. 2, pp. 113–131.
Sritharan, S., G. Doiron, D. Bierwagen, B. Keierleber, and A. Abu-Hawash. 2018. The First
Application of UHPC Bridge Deck Overlay in North America. Transportation Research
Record: Journal of the Transportation Research Board of the National Academies. (In
press).
Sritharan, S., G. Doiron, D. Bierwagen, B. Keierleber, and A. Abu-Hawash. 2017. A UHPC
Overlay for Deteriorated Bridge Decks. Paper presented at AFGC-ACI-fib-RILEM
International Symposium on Ultra-High-Performance Fibre-Reinforced Concrete 2017,
October 2–4, Montpellier, France.
Steele, G. W. and J. M. Judy. 1977. Polymer-Modified Concretes in Bridge Deck Overlay
Systems. In Chloride Corrosion of Steel in Concrete, American Society for Testing and
Materials (ASTM), West Conshohocken, PA.
Sultan, A. A. and G. Washer. 2017. A Pixel-by-Pixel Reliability Analysis of Infrared
Thermography (IRT) for the Detection of Subsurface Delamination. NDT&E
International, Vol. 92, pp. 177–186.
Tanarslan, H. M., N. Alver, R. Jahangiri, Ç. Yalçınkaya, and H. Yazıcı. 2017. Flexural
Strengthening of RC Beams Using UHPFRC Laminates: Bonding Techniques and Rebar
Addition. Construction and Building Materials, Vol. 155, pp. 45–55.
Vaghefi, K., T. M. Ahlborn, D. K. Harris, and C. N. Brooks. 2015. Combined Imaging
Technologies for Concrete Bridge Deck Condition Assessment. Journal of Performance
of Constructed Facilities, Vol. 29, No. 4, pp. 04014102-1–04014102-8.
Vande Voort, T. L., M. T. Suleiman, and S. Sritharan. 2008. Design and Performance
Verification of Ultra-High-Performance Concrete Piles for Deep Foundations. Center for
Transportation Research and Education, Iowa State University, Ames, IA.
Washer, G., R. Fenwick, N. Bolleni, and J. Harper. 2009. Effects of Environmental Variables on
Infrared Imaging of Subsurface Features of Concrete Bridges. Transportation Research
Record: Journal of the Transportation Research Board, No. 2108, pp. 107–114.
Washer, G., R. Fenwick, S. Nelson, and R. Rumbayan. 2013. Guidelines for Thermographic
Inspection of Concrete Bridge Components in Shaded Conditions. Transportation
Research Record: Journal of the Transportation Research Board, No. 2360, pp. 13–20.
Yehia, S., O. Abudayyeh, S. Nabulsi, and I. Abdelqader. 2007. Detection of Common Defects in
Concrete Bridge Decks Using Nondestructive Evaluation Techniques. Journal of Bridge
Engineering, Vol. 12, No. 2, pp. 215–225.

53
Zingaila, T., M. Augonis, E. Šerelis, Š. Kelpša, and D. Martinavičius. 2016. Influence of Heat
Treatment Regimes on Mechanical Properties of NSC-UHPC Composite Members.
Journal of Sustainable Architecture and Civil Engineering, Vol. 1, No. 14, pp. 51–59.


55
APPENDIX A: UHPC FOR LOCAL BRIDGE APPLICATIONS WORKSHOPS
As part of the projects discussed in this report, two workshops were held primarily to educate
Iowa engineers, consultants, and contractors about UHPC, its characteristics and past
applications, and research and development completed on the UHPC overlay technology. The
first workshop was held close the Mud Creek Bridge site on May 12, 2016, and the second
workshop was held in Ames, Iowa, on May 4, 2017. The first workshop attracted 45 participants
and the second workshop attracted more than 50 participants. The agendas and selected
photographs from the workshops are included in this appendix.
The participants at the first workshop were able to visit the Mud Creek Bridge site and witness
the installation of the UHPC overlay on the deck. The participants at the second workshop were
able to visit the Structural Engineering Laboratory at Iowa State University and see UHPC
mixing, the mock-up slabs, and other UHPC products.

56

57

58
Figure A1. First workshop in Brandon, Iowa, during a presentation by County Engineer
Brian Moore
Figure A2. Group photo at the end of the first workshop

59
Figure A3. Visit to Mud Creek Bridge after completing the overlay on the first lane
Figure A4. Inspecting a UHPC mixer on site at the Mud Creek Bridge

60
Figure A5. Participants at the second workshop
Figure A6. Presentation by President and CEO of Walo International during the workshop

61
Figure A7. Demonstration of UHPC mixing
Figure A8. Placing UHPC overlay at ISU for demonstration purposes

62
Walo International
Figure A9. Drilled UHPC-NC core samples
Figure A10. Inspecting deck specimens completed with UHPC overlays


Visit www.InTrans.iastate.edu for color pdfs of this and other research reports.
THE INSTITUTE FOR TRANSPORTATION IS THE FOCAL POINT FOR TRANSPORTATION AT IOWA STATE UNIVERSITY.
InTrans centers and programs perform transportation research and provide technology transfer services for government agencies and private companies;
InTrans manages its own education program for transportation students and provides K-12 resources; and
InTrans conducts local, regional, and national transportation services and continuing education programs.