Embed Size (px)
Citation preview

• Use point plotting to graph polar equations.
• Use symmetry to graph polar equations.
Section 6.4

Using Polar Grids to Graph
A polar equation is an equation whose variables are r andThe graph of a polar equation is the set of all points whosepolar coordinates satisfy the equation.
We use polar grids like theone in the figure to graphpolar equations.

Circles in Polar Coordinates

Example: Graphing an Equation Using the Point-Plotting Method
•Graph the equation with in
radians. Use multiples of from 0 to π to
generate coordinates for points
•We construct a partial table of coordinates for
using multiples of
Then we plot the points and join them in a
smooth curve.
4sinr
6
( , ).r
4sinr .
6

Example: Graphing an Equation Using the Point-Plotting Method (continued)
•Graph 4sinr
4sinr ( , )r
4 0 0
14 2
2
34 2 3 3.5
2
4 1 4
(0,0)
2,6
3.5,3
4,2
0
6
3
2

Example: Graphing an Equation Using the Point-Plotting Method (continued)
•Graph 4sinr
4sinr ( , )r
34 2 3 3.5
2
14 2
2
4 0 0
23.5,
3
52,
6
0,
23
56

Example: Graphing an Equation Using the Point-Plotting Method (continued)
•Graph 4sinr
0
6
4sinr 3
2
2
3
5
6
7
6
4
3
3
2
5
3
11
6
(0,2)
4sinr 2 4 sinr r 2 2 4x y y
2 2 4 0x y y 2 2 4 4 4x y y
2 2( 2) 4x y We can verifythat the graphis a circle bychanging frompolar to rectangularform.
The graph is acircle with centerat (0, 2) and r = 2.

Tests for Symmetry in Polar Coordinates
Example: Graphing a Polar Equation Using Symmetry
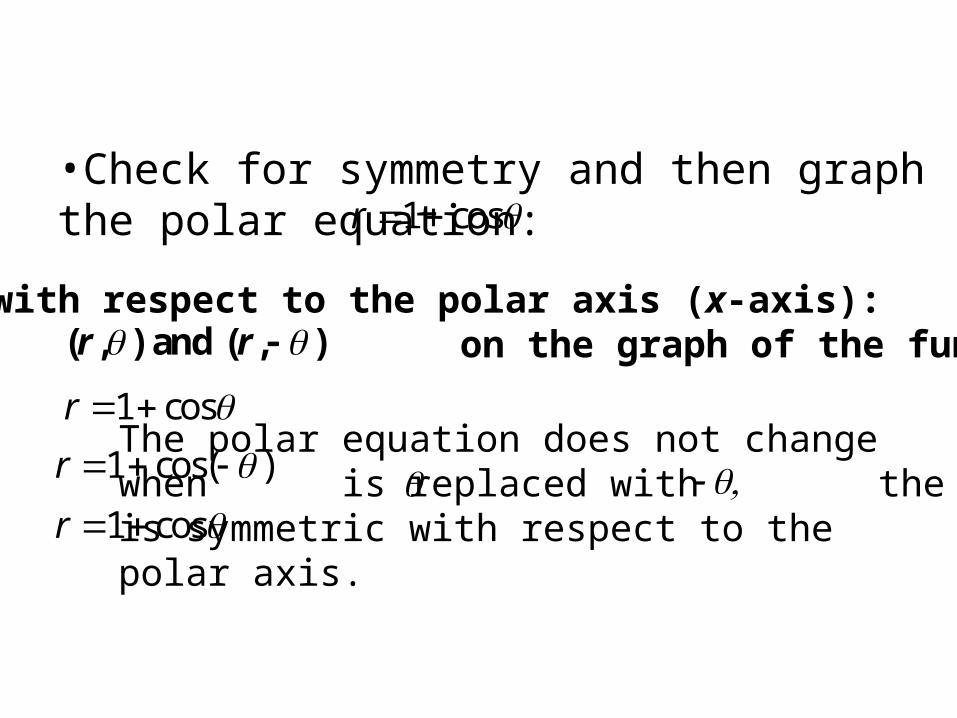
•Check for symmetry and then graph the polar equation: 1 cosr
Symmetry with respect to the polar axis (x-axis): on the graph of the function. ( , ) and ( , )r r
1 cosr
1 cos( )r
1 cosr
The polar equation does not changewhen is replaced with the graphis symmetric with respect to thepolar axis.

Example: Graphing a Polar Equation Using Symmetry
(continued)•Check for symmetry and then graph the polar equation: 1 cosr
Symmetry with respect to the line (origin):
on the graph of the function. ( , ) and ( , )r r
2
1 cosr
1 cosr 1 cosr
The polar equation changeswhen is replaced with The graphis not symmetric with respect to theline
.2
Example: Graphing a Polar Equation Using Symmetry
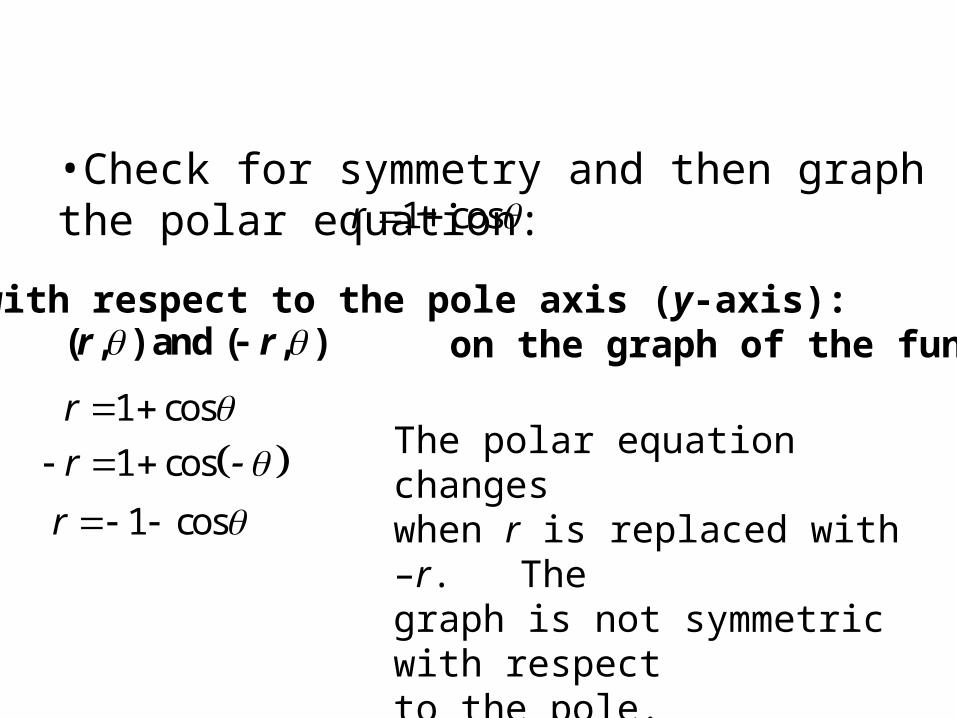
(continued)•Check for symmetry and then graph the polar equation: 1 cosr
Symmetry with respect to the pole axis (y-axis): on the graph of the function. ( , ) and ( , )r r
1 cosr 1 cosr
1 cosr The polar equation changeswhen r is replaced with –r. The graph is not symmetric with respect to the pole.

Example: Graphing a Polar Equation Using Symmetry
(continued)•Check for symmetry and then graph the polar equation:
1 cosr
1 cosr
0
6
3
2
2
1.87
1.5
1
1 cosr
23
56
0.5
0.13
0
1 cosr
0
6
3
2
2
3
5
6
7
6
4
3
3
2
5
3
11
6
4
3
4
5
4
7
4
Complete a table of values for the function:
Example: Graphing a Polar Equation Using Symmetry
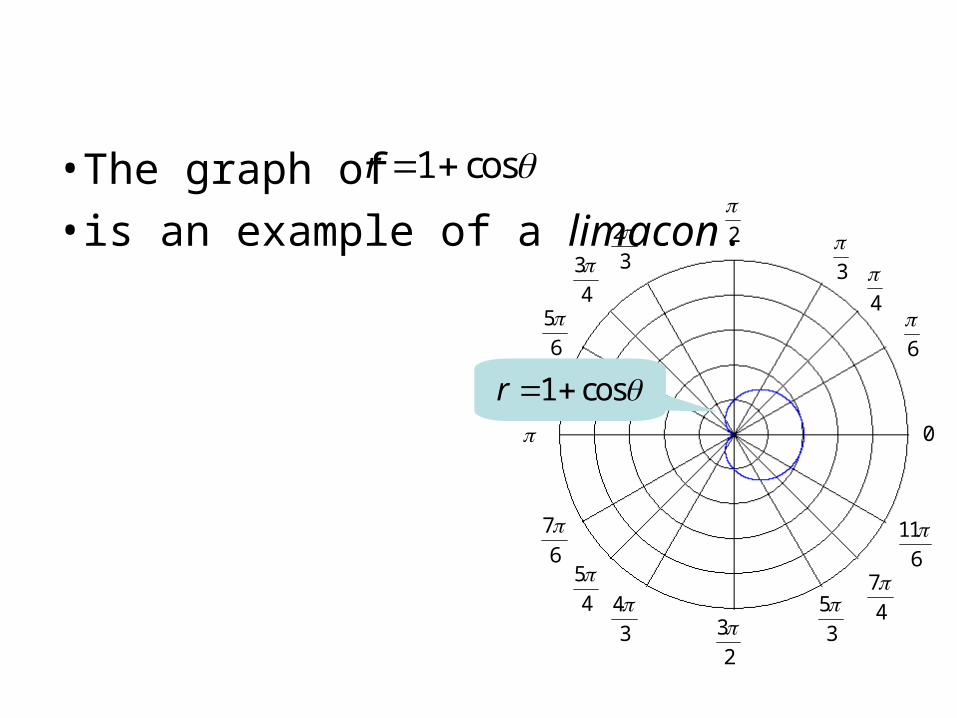
(continued)•The graph of
•is an example of a limaçon.
1 cosr
1 cosr
0
6
3
2
2
3
5
6
7
6
4
3
3
2
5
3
11
6
4
3
4
5
4
7
4

Limaçons
Example: Graphing a Polar Equation
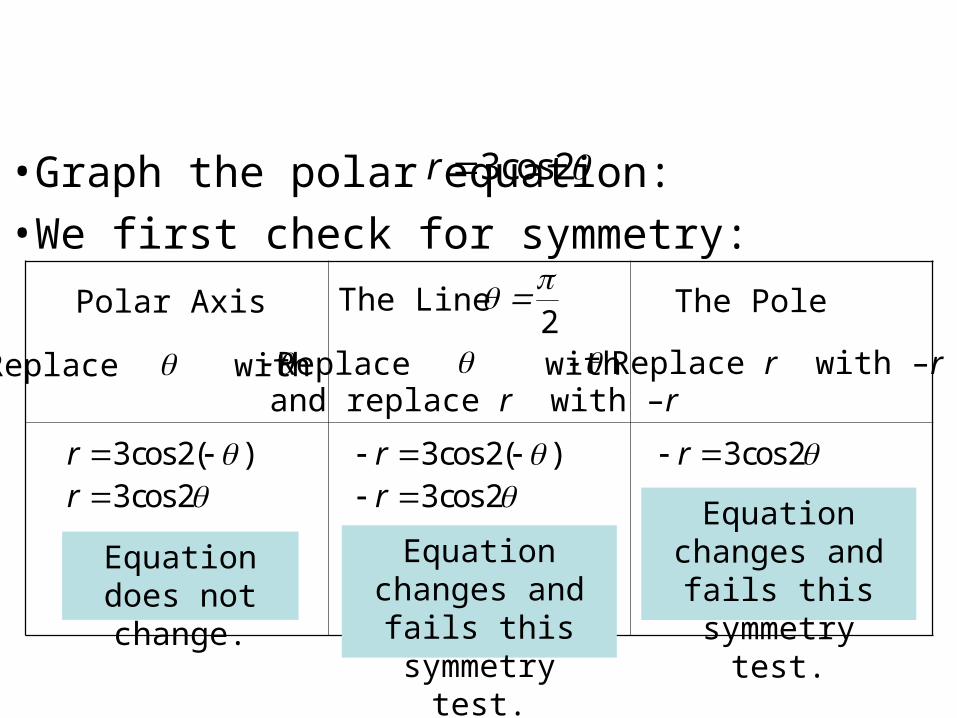
•Graph the polar equation:
•We first check for symmetry:
3cos2r
Polar Axis The Line The Pole2
Replace with Replace with Replace r with –r
3cos 2( )r 3cos 2r
and replace r with –r
3cos 2( )r 3cos 2r
3cos 2r
Equation changes and fails this
symmetry test.Equation does
not change.
Equation changes and fails this
symmetry test.

Example: Graphing a Polar Equation (continued)
•Graph the polar equation:
•Complete a table of values for the function:
3cos2r
3cos 2r
0 3
6 3
2
4
0
3 3
2
3cos 2r 3cos 2r
2
23
34
56
3
32
0
32
3

Example: Graphing a Polar Equation (continued)
•Graph the polar equation: 3cos2r
3cos 2r
0
6
3
2
2
3
5
6
7
6
4
3
3
2
5
3
11
6
4
3
4
5
4
7
4
Example: Graphing a Polar Equation (continued)
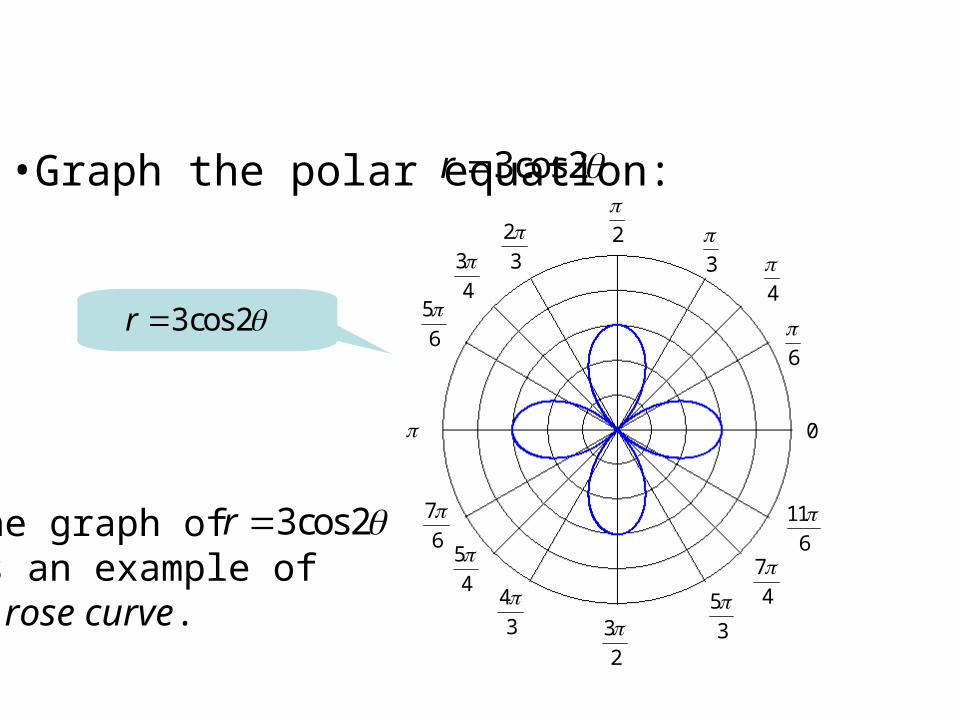
•Graph the polar equation: 3cos2r
3cos 2r
0
6
3
2
2
3
5
6
7
6
4
3
3
2
5
3
11
6
4
3
4
5
4
7
4
The graph ofis an example ofa rose curve.
3cos2r

Rose Curves

Example: Graphing a Polar Equation
•Graph the polar equation:
•We first check for symmetry:
2 4cos2r
Polar Axis The Line The Pole2
Replace with Replace with Replace r with –r and replace r with –r
2 4cos 2( )r 2 4cos2r
Equation does not change.
24cos 2( )r
2 4cos2r
Equation does not change.
2 4cos2r 2
4cos 2r
Equation does not change.

Example: Graphing a Polar Equation (continued)
•Graph the polar equation:
•Complete a table of values for the function:
2 4cos2r
2 4cos2r
0
6
4
2
1.4
0

Example: Graphing a Polar Equation (continued)
Graph the polar equation:
0
6
3
2
2
3
5
6
7
6
4
3
3
2
5
3
11
6
4
3
4
5
4
7
4
2 4cos2r
2 4cos 2r

Example: Graphing a Polar Equation (continued)
•Graph the polar equation:
0
6
3
2
2
3
5
6
7
6
4
3
3
2
5
3
11
6
4
3
4
5
4
7
4
2 4cos2r
2 4cos 2r
The graph ofthe polar equation
is an example of a lemniscate.
2 4cos2r

Lemniscates