Embed Size (px)
Citation preview
The relative strength index has become one of the most popular and widely
cited technical indicators. However, using it in time frames for which it wasn't
designed requires customization of the inputs. With a few modifications, we
can create an adaptive RSI that is more flexible.
use u
BY DAVID SEPI ASHVILI
eveloped by J . W. Wilder in 1978, the re lat ive strength index (RSl) has become one of t h e preva lent tech n ical
too ls. This lIsefu l momentum osci ll a~
ror has gai ned genera l recogn it ion and found its way to all fi nancia l markets. When W ilde r introduced the RSI, he recommended using 14 days for aver~ ag ing upwa rd and d own wa rd pr ice changes. He intended the period to he equal to ha lf the dominant cycle -namely the lunar 28-day cyc le . He a lso suggested use rs consider levels of 70% or more as overbough t and 30% or less as oversold.
H owever, in recent years, a na lysts are ca lcu lating t h e RS I fo r per iods rang ing betwee n five and 25 days whil e using, fo r t h e most pa rt , t h e o rigi n ally suggested overbough t and oversold levels. But at diffe ren t look back periods, d ifferent overbought and overso ld leve ls perform be tte r. T h is li mitat ion in the ind icator's applica· [ion is dictated by a variable arrem la· tion factor of financ ial t ime series. The
34 FUTURES I .July 2004
ess 0
higher the averaging period, the high · e r th e acc um ulated losses a re th a t resul t from t h e atte n ua t io n factor. This g ives insight in to why the best performing overbought/oversold range is narrower when the averag ing peri·
CHANGING DIRECTION
ods arc above ] 4, and widens with the periods below 14.
He re, we ' ll extend the appl icat io n area of the classic RSI so that it could be applied [0 mul tip le marke t cond i ~
t io ns a nd lIsed with th e sa me ove r'
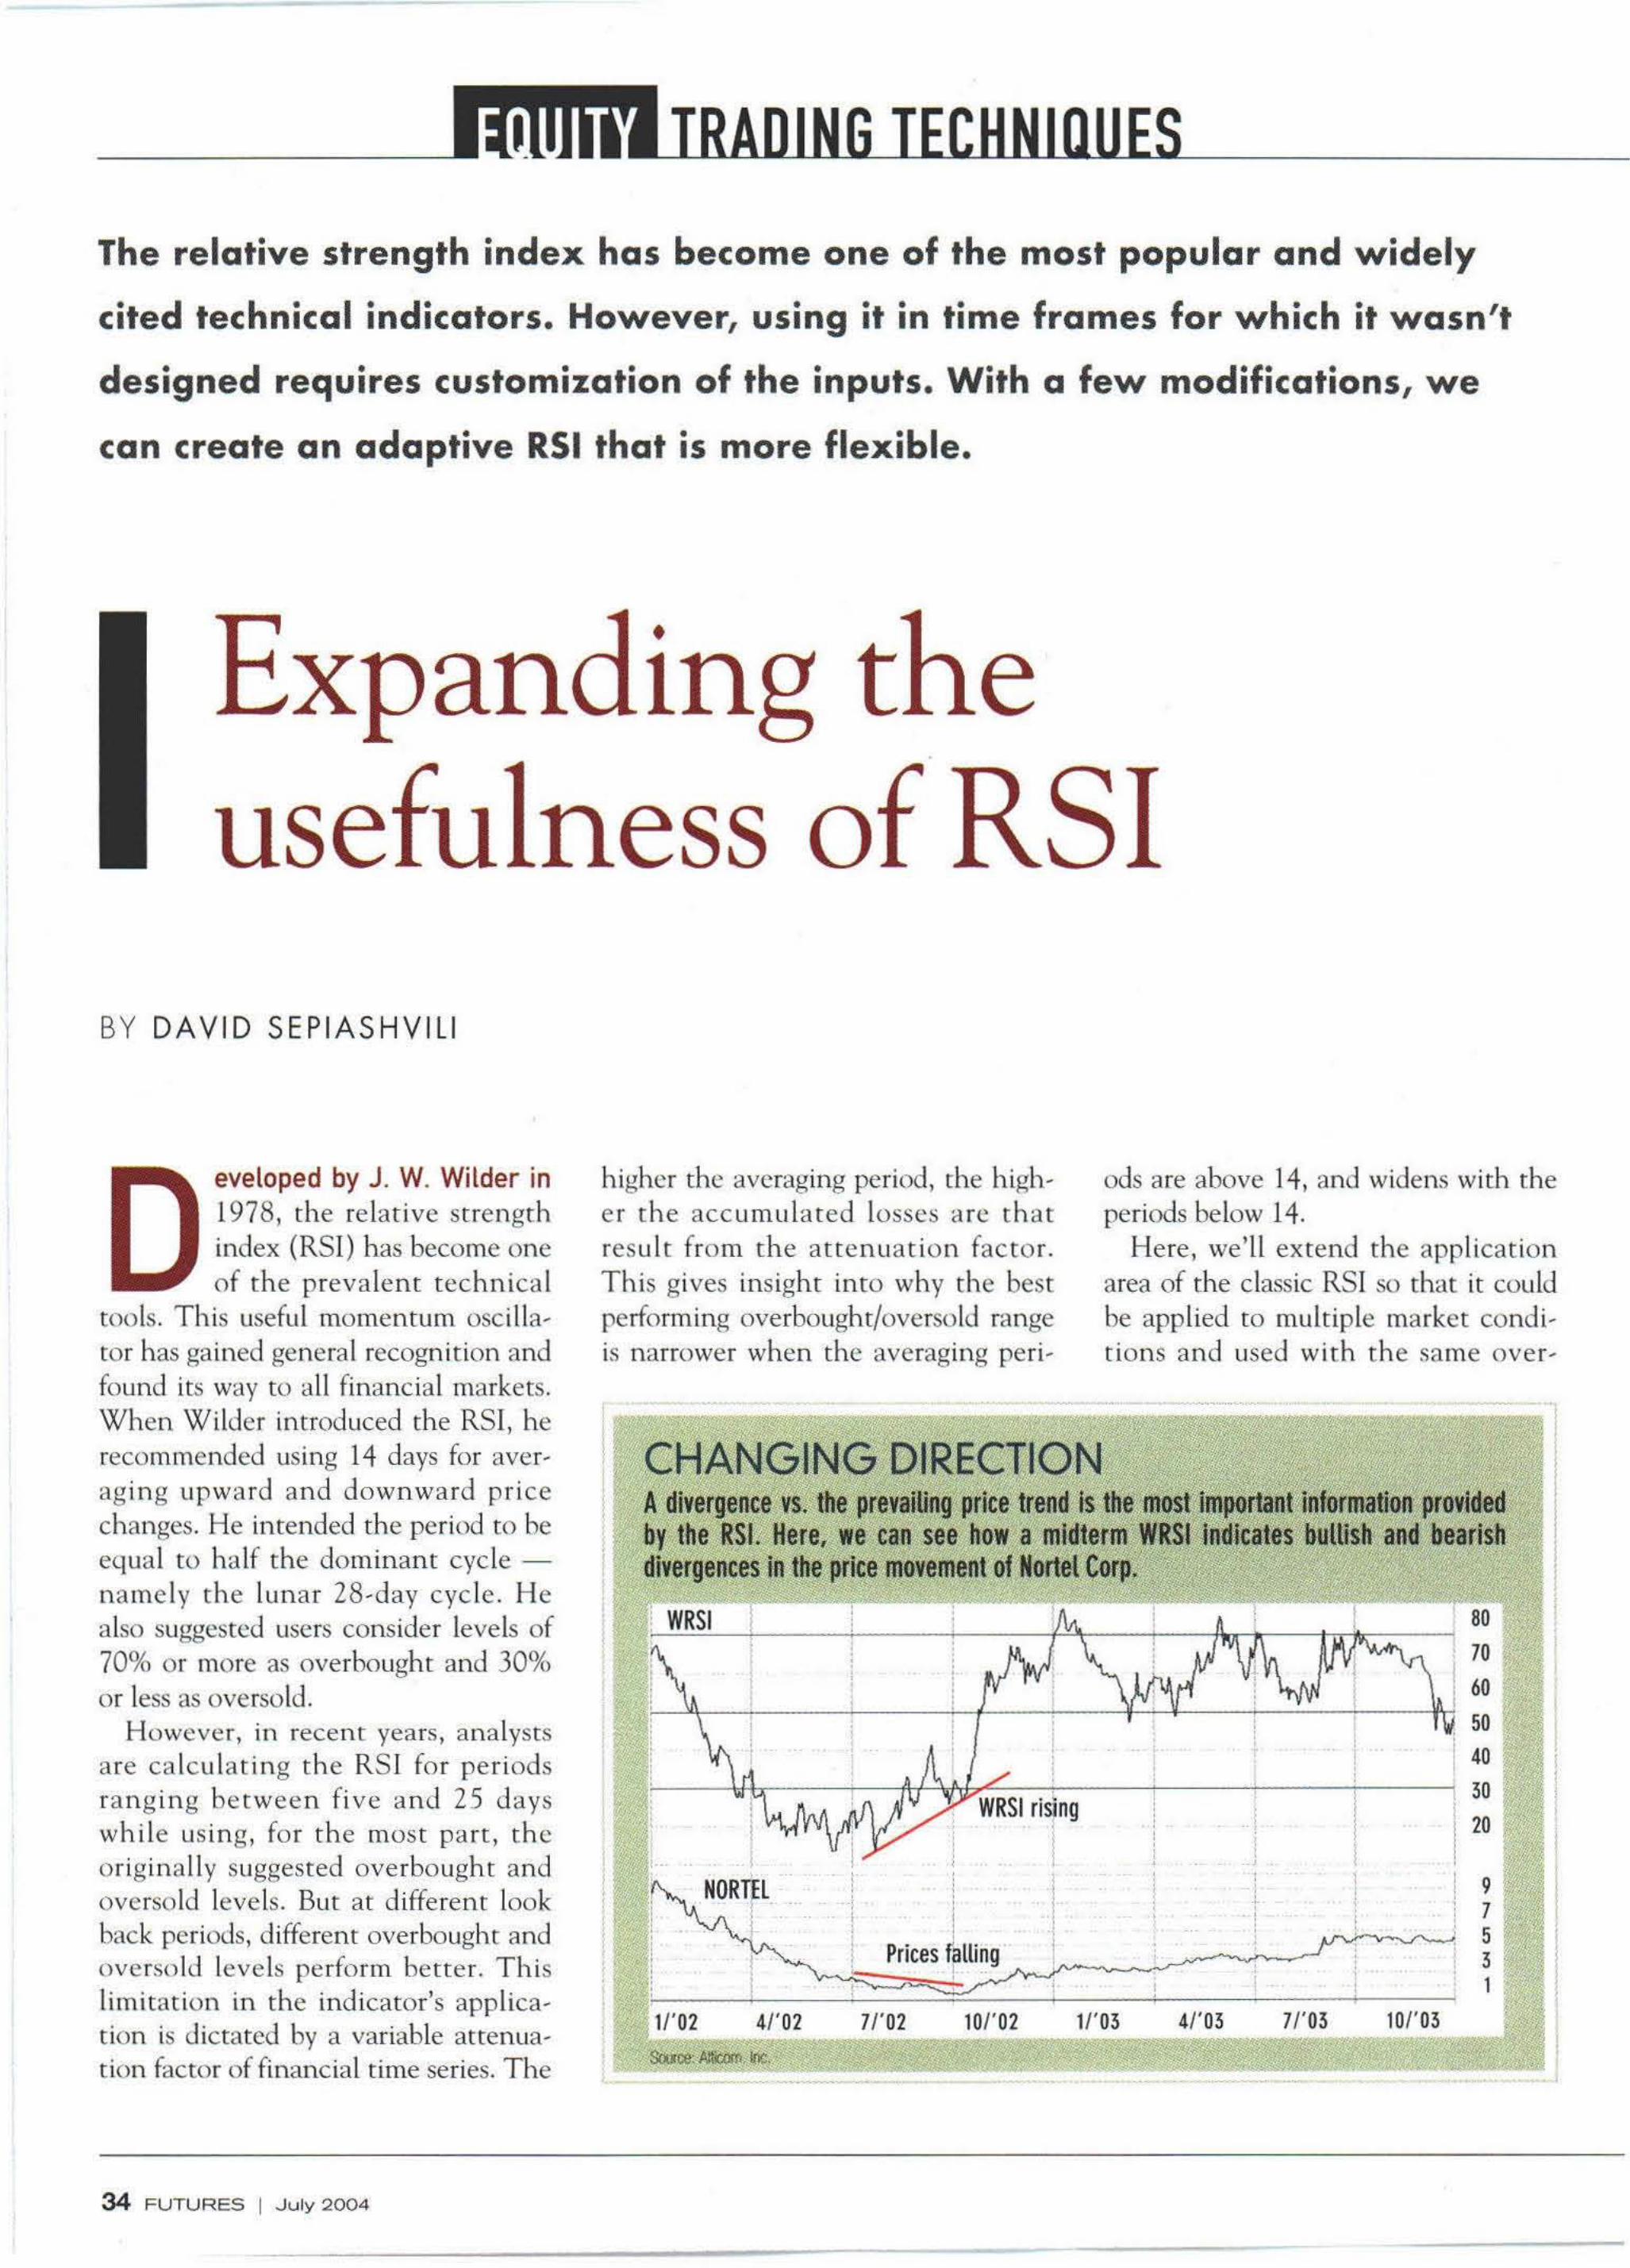
A divergence n. tile prevailing price trend Is tile most imporIant information prOYlded I by the RSI. Here. we can see how a midterm WRSI Indicates bulUsh and bearish divergences in tile price llIOYement of Horlel Corp.
, WRSI 80
70
60
50
40
30 WRSI ri~ ng
I 10 I •
, • , • ,
• •
NORTH • 9 I I • • • • • 7 • • . I ,
• I , •
I • • • 5 • •
I Prices falling 3 • • I • • • ,
1 • • •
41'01 71'01 101'01 11' 03 41' 03 71'03 101'03
bought and oversold levels not only in sho rt~ tenn tasks, but also in very short, inrcrmecli(ltc and long~term analysis. as we ll as in multi ~frame studies.
To address the problem of expand ing the appl ication area of the RSI we have devel oped the Wide-range Re lati ve S trength Index (WRS I) . The fundamental property of the WRSI is that it takes into account the attenuatio n factor compensating for variat ions in the
RS I bandwidth for averaging periods other than 14. The WRSI is a simple way to measure momentum changes of market prices over any time frame.
The attenuation factor depends on the amount of days lIsed in the calcu lation, on volatility, and upper and lower
thresholds thar mark the extremities of the RSI. Its calcu lation is based theoret ica lly on Do w Theory princ ipals, Ellio t[ wave theo ry and renacement theory, combining the best of these approaches to provide an o bj ective ba sis for good performance of the indi cato r. "C alculating the WRS I" (ri ght) inc lud es the formula e th at resulted from th is study.
INTERPRETATION OF WRSI The RSI is a momentllm indica tor, designed to measure a sec urity's strength or weakness relative co itself over a given period. The WRSI simpli fies this applicatio n over time frames.
The cha racteris tic fe ature of the WRSI is that it allows detect ion of momentum changes not only in short~
term cycles , but also in midterm and long~ term cycles. It sho ws security's strength re lative to itself without any lagging not o nly for n = 14, as in its class ic form, but for any averaging peri ~
a d, including intermediate and long term va lues.
Such an expansio n natura ll y results in certa in peculiari ties. Estimating a security's strength over lo nger periods, the WRSI is less sensiti ve and less cor~ rupted by no ise than the class ic RS I. But this fi ltering does not e ntai l any lagg ing. Being less vo la tile, th e
WRSI = ,,( k:...+:..:.!.1 ):;-* F.U:i( n;L),.,-"( k::,-~I )_*=n'1.) * 1 00 2 U(n) + D(n)}
WRSI(n = 14,k = I) U( 14) )* U( 14) + D(14)
WRS/(n = 14,k = I)=( RS )* 100 RS+l
WRSI(n = 14.k=I)=(I- 1 )* 100 RS+ 1
WRSI(n = 14.k = I) = RSI
I
Equity Trading Techniques conlinued
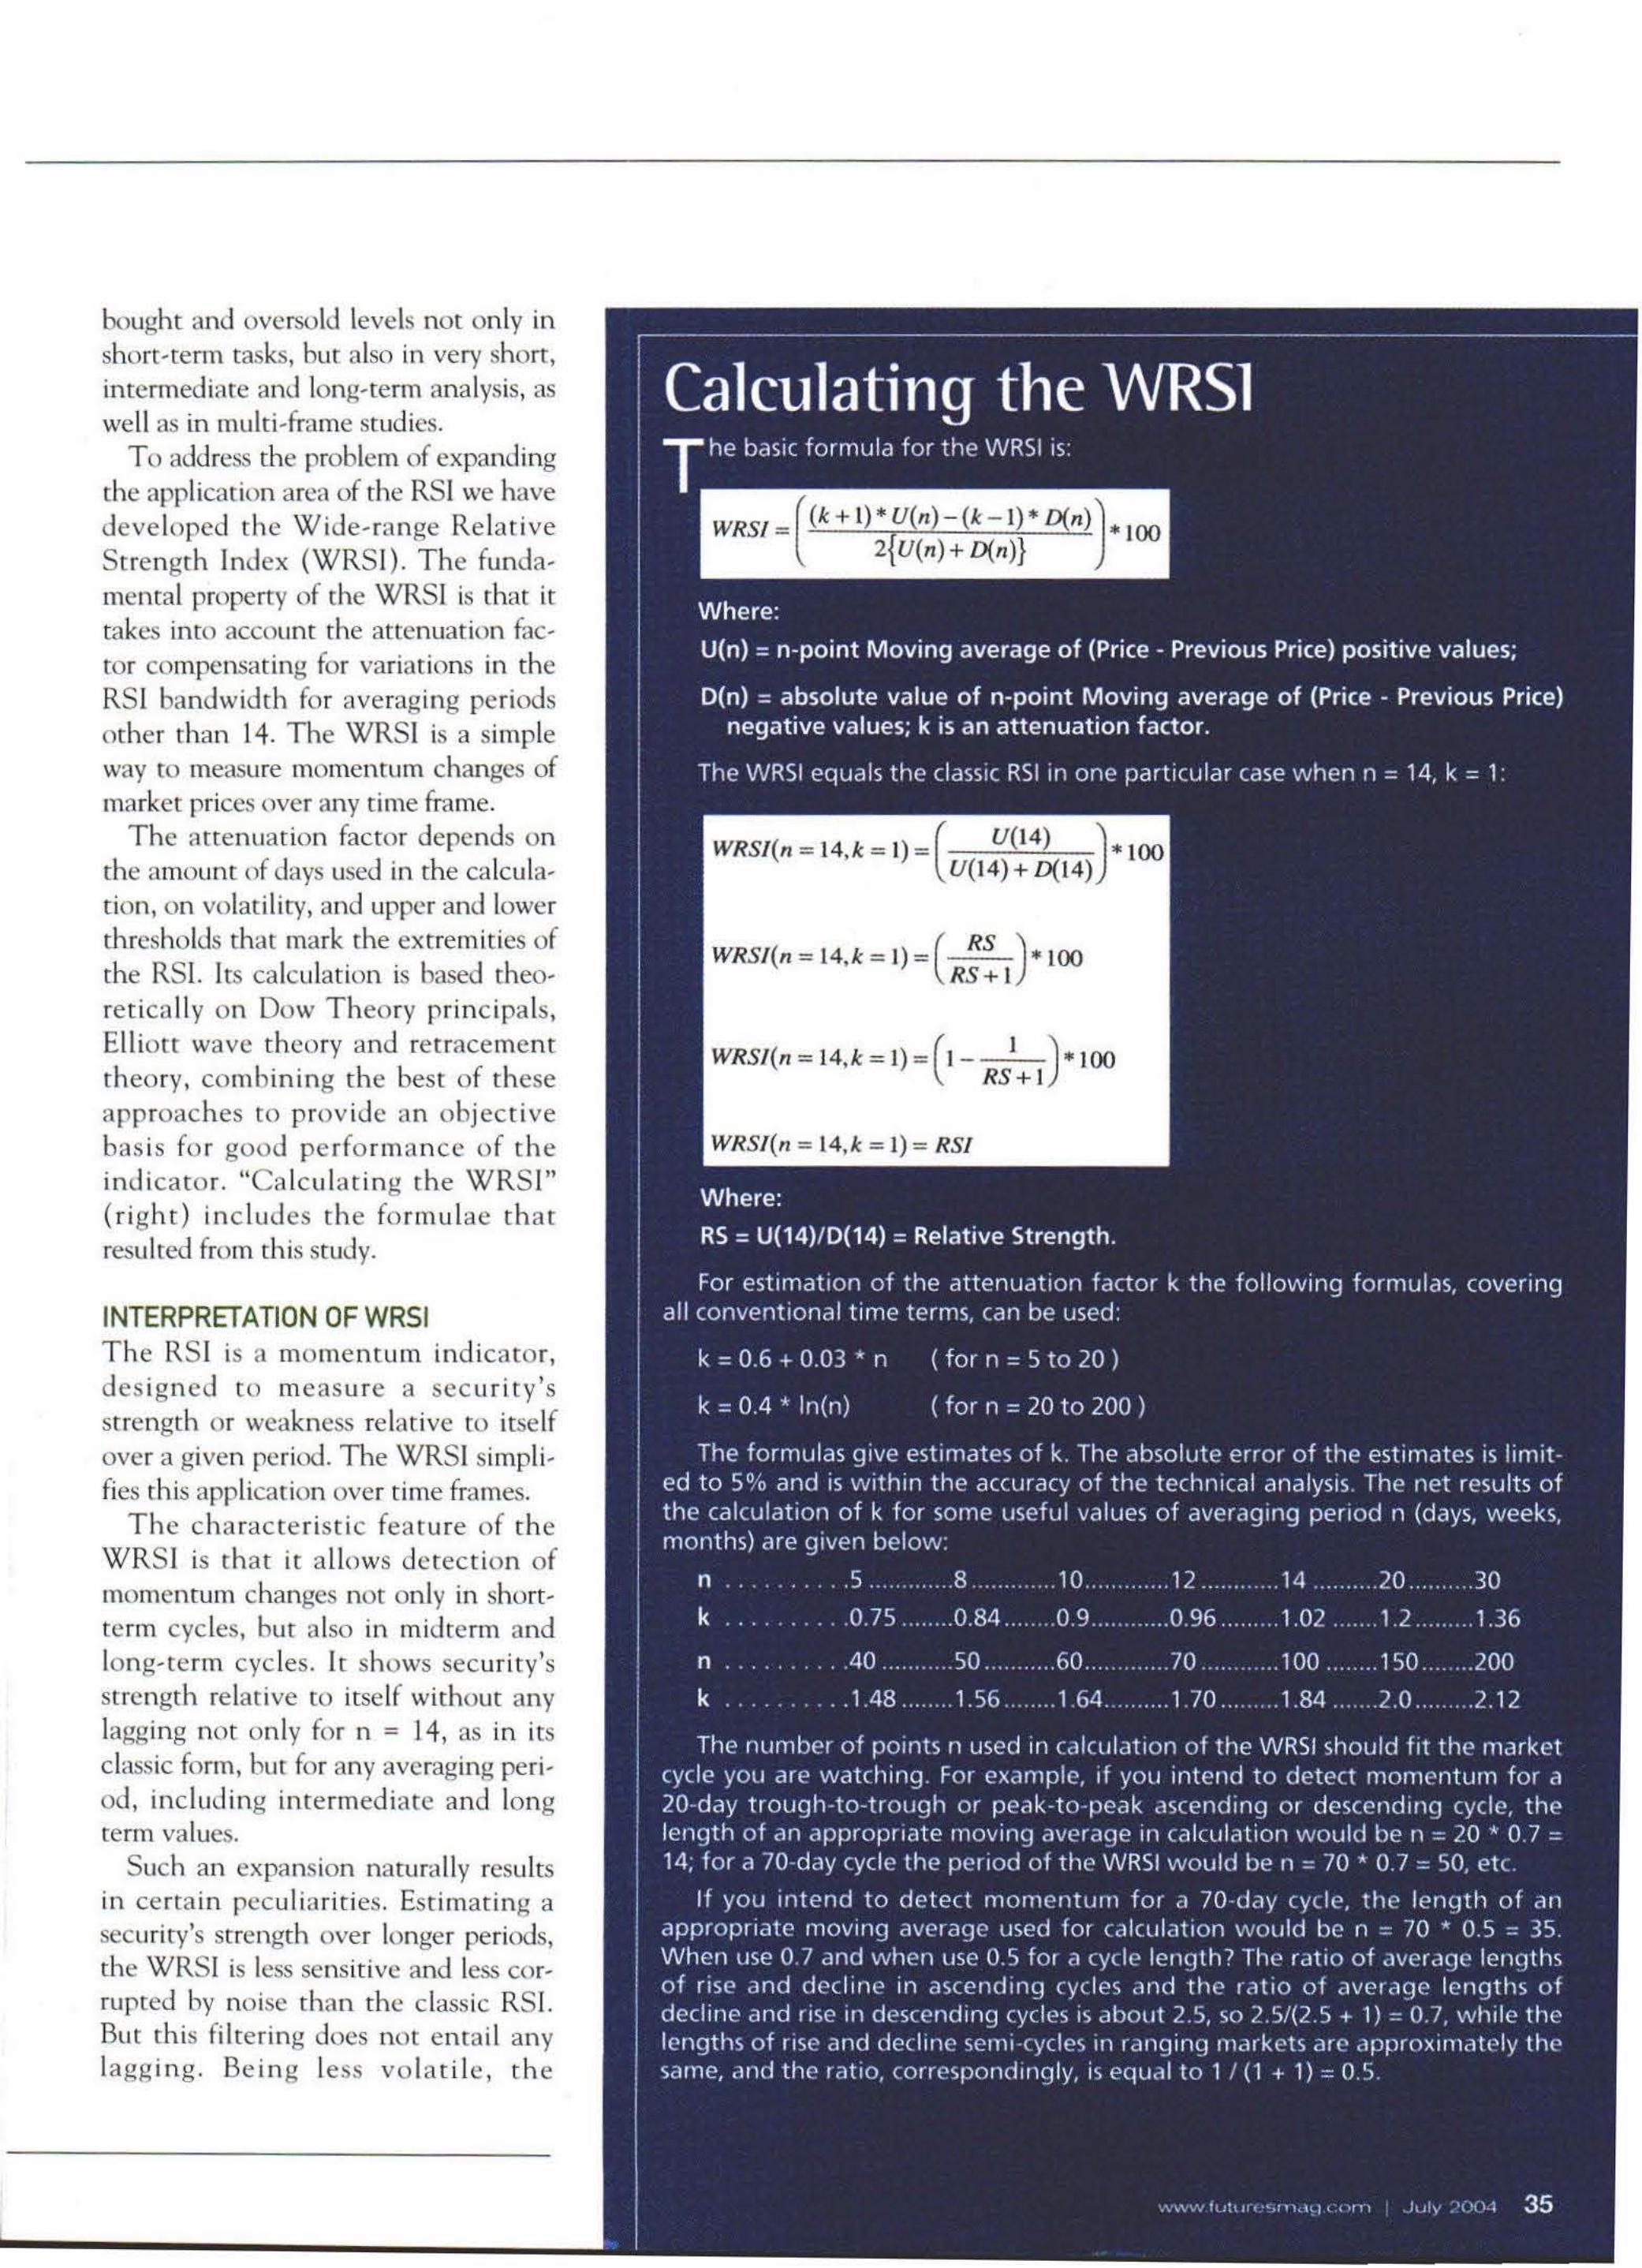
LONG-TERM LOOK II _ ..... caR HI ..... " lilt IISI oI6etet'11 DyntaIcs ..... 70-50
\nels _ ... a .... period _111111 caIctdIIIIII.
•
General Dynamics I
1/' 01
--- - --
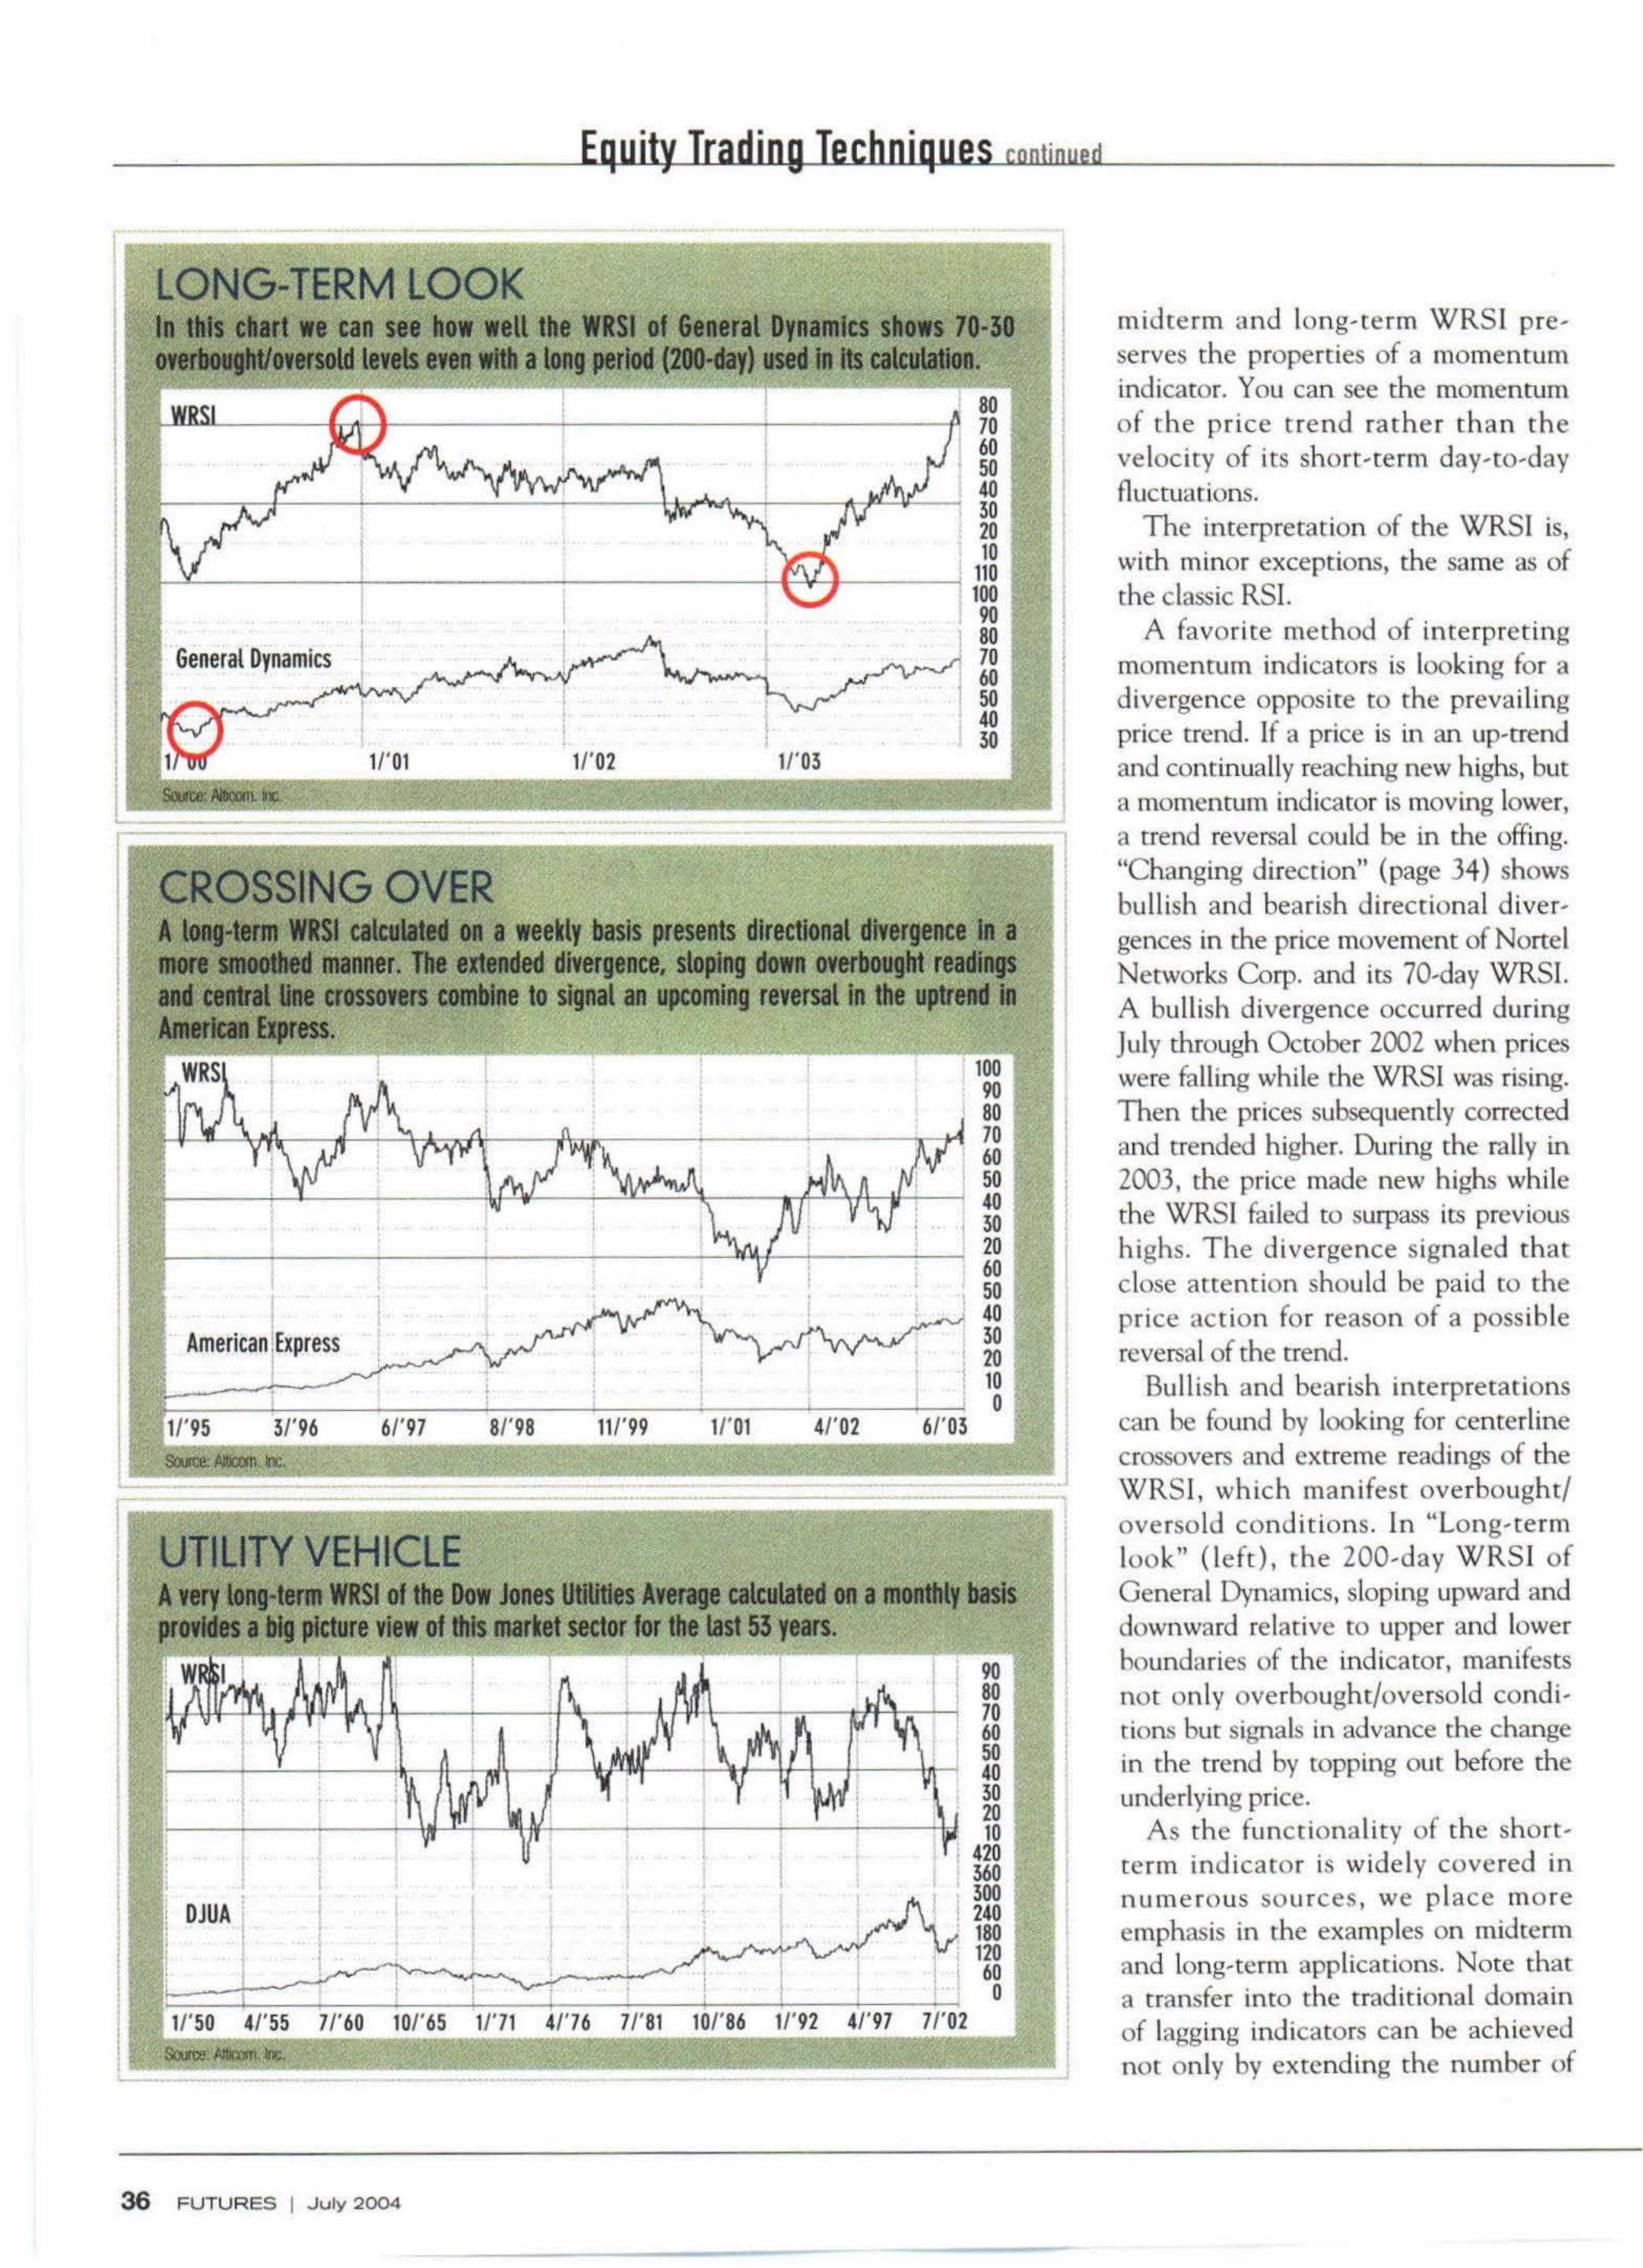
CROSSING OVER A .,._ CIIaIIIIII •• ........... _. 1111 RIIIdetI ......... _ CIIIIIIIe 10 ....
, I •
3/' 96 6/' 97
•
! 8/'98
, •
I
I 1/' 02
11/'99 1/' 01
80 70 60
! 50 40 30 20 10
'------I 110 .... lOll
1/'03
4/' 02
9iI 80 70 60 50 4lI 50
9iI 80 70 60 50 40 30 20 60 50 40 30
, 10 o
6/' 03
I I I
I I
I I I I
I
0/ tile Dow ./otIes UIIUIIes Atenge caIaaIIIed 8ft • __ bIsIs I pIdure willi 01II1II ant sector lor tlletast 53 yws.
~-r-"'"n- 9iI 80 70 60 50 40 30 20 10
420 •
I I
DJUA I
I
,
, I I 360 . 300
I I 240 1 180
:::=:~:::t=:~~====~:2:Ll '20 I 60
~ 0 7/' 60 10/' 65 Ii'l l 41'76 7/' 81 1/'92 4/' 97
- - -
36 FUTURES I July 2004
I
I
midterm and long-term WRSI preserves the properties of a momentum indicator. You can see the momentum of the price trend ra th e r than th e velocity of its sh ort-term day-to-day fluctuations.
The interpretation of the WRSI is, with minor exceptions, the same as of the class ic RSI.
A favorite method of interpret ing momentum indicators is looking for a divergence opposite to the prevai ling price trend. If a price is in an up· trend and continually reaching new highs. but a momentum indicator is moving lower, a trend reversal could be in the offing. "Changing d irection" (page 34) shows bullish and bearish directional divergences in the price movement of Nortel Networks Corp. and its 70-day WRSI. A bullish divergence occurred during July through October 2002 when prices were fa ll ing while the WRSI was rising. Then the prices subsequently corrected and trended higher. During the rally in 2003, the price made new highs while the WRSI failed to surpass its previous highs. The divergence signaled that close attention should be paid to the price act ion fo r reason of a possible reversal of the trend.
Bullish and bearish in terpretat ions can be found by looking for centerl ine crossovers and extreme readings of [he WRS I, whi ch ma n ifest overbo ught/ oversold condi t ions. In "Long;[crm look" ( left), the 200-day WRSI of Geneml Dynamics, sloping upward and downward relative to upper and lower boundaries of the indicator, manifests not only overbought/oversold conditions but signals in advance the change in the trend by topping out before the underlying price.
As the funct io nality of the sho rt; term indicator is widely covered in nume ro us so urces, we place mo re emphasis in the examples on micircnn and iong;[cnn applicat ions. Note that a transfer into the traditional domain of I;]gging indicators can be achieved not only by extending the number of
I
days in the WRS I calculation, but also by con verting an y WRS I calculated on a daily basis into weekl y or month, Iy WRSI s. Such a conversion gives a more smoothed picture in comparison to the WRS I calculated o n a daily basis. In "Crossing over" (left) , a price chart of American Express Co. and its 40- week WR S I a re presented. It is ano ther illustration of typical l ong~
term d irectional divergence in price uptrend and its WRS J. The uptrend lasting almost six years is not Slipper[ '
ed here by t h e s lo p in g d o wnwa rd WRSI and re lative to 70 and 50 level read ings.
As shown in "Uti lity vehicle" (left) , the WRS I can be a powerfu l suppo rt roo l for ex u eme ly !ong, te rm investment. The 30-month WRS I of the Dow j ones U tility Average (Dj UA) accurate ly tracks trend ing periods the market has exhibited during the last 53 years. Yo u ca n a lso sec that in the macro-co ntext a blow-off we hav e experienced recently is apparentl y a normal behavior of the stock market's cyclical nature.
As can be seen from the examples, the WRSI as a momentum indicator usually turns ahead of price and can mostly be uscd as a d ivergence indica~ tor. The modulation of peaks or troughs in extended uptrends or downtrencls assumes a new importance characteristic for the midterm and long~tenn WRSI. In lo n ge r time span s, the WR S I becomes most usefu l in [rend ing pe ri~
ods, as its readings do not distOrt ovc r~
bought, oversold and divergence signals. It's much more reliab le to get trading
support signals fro m relat ive st rengd1 inclicarors of different t ime frames. Multi ~ frame ana lysis attempts to ana~ lyze short, i ntermediate~ and long~term
cyc les based o n thei r indiv idua l W RS ls. The approach wil l let the trade r see the big picture and nor just an isolated picture, which can be mislead, ing if it is not adequate to the length of the price movement's actua l cycles. TI1 is can be useful not only as a strate~
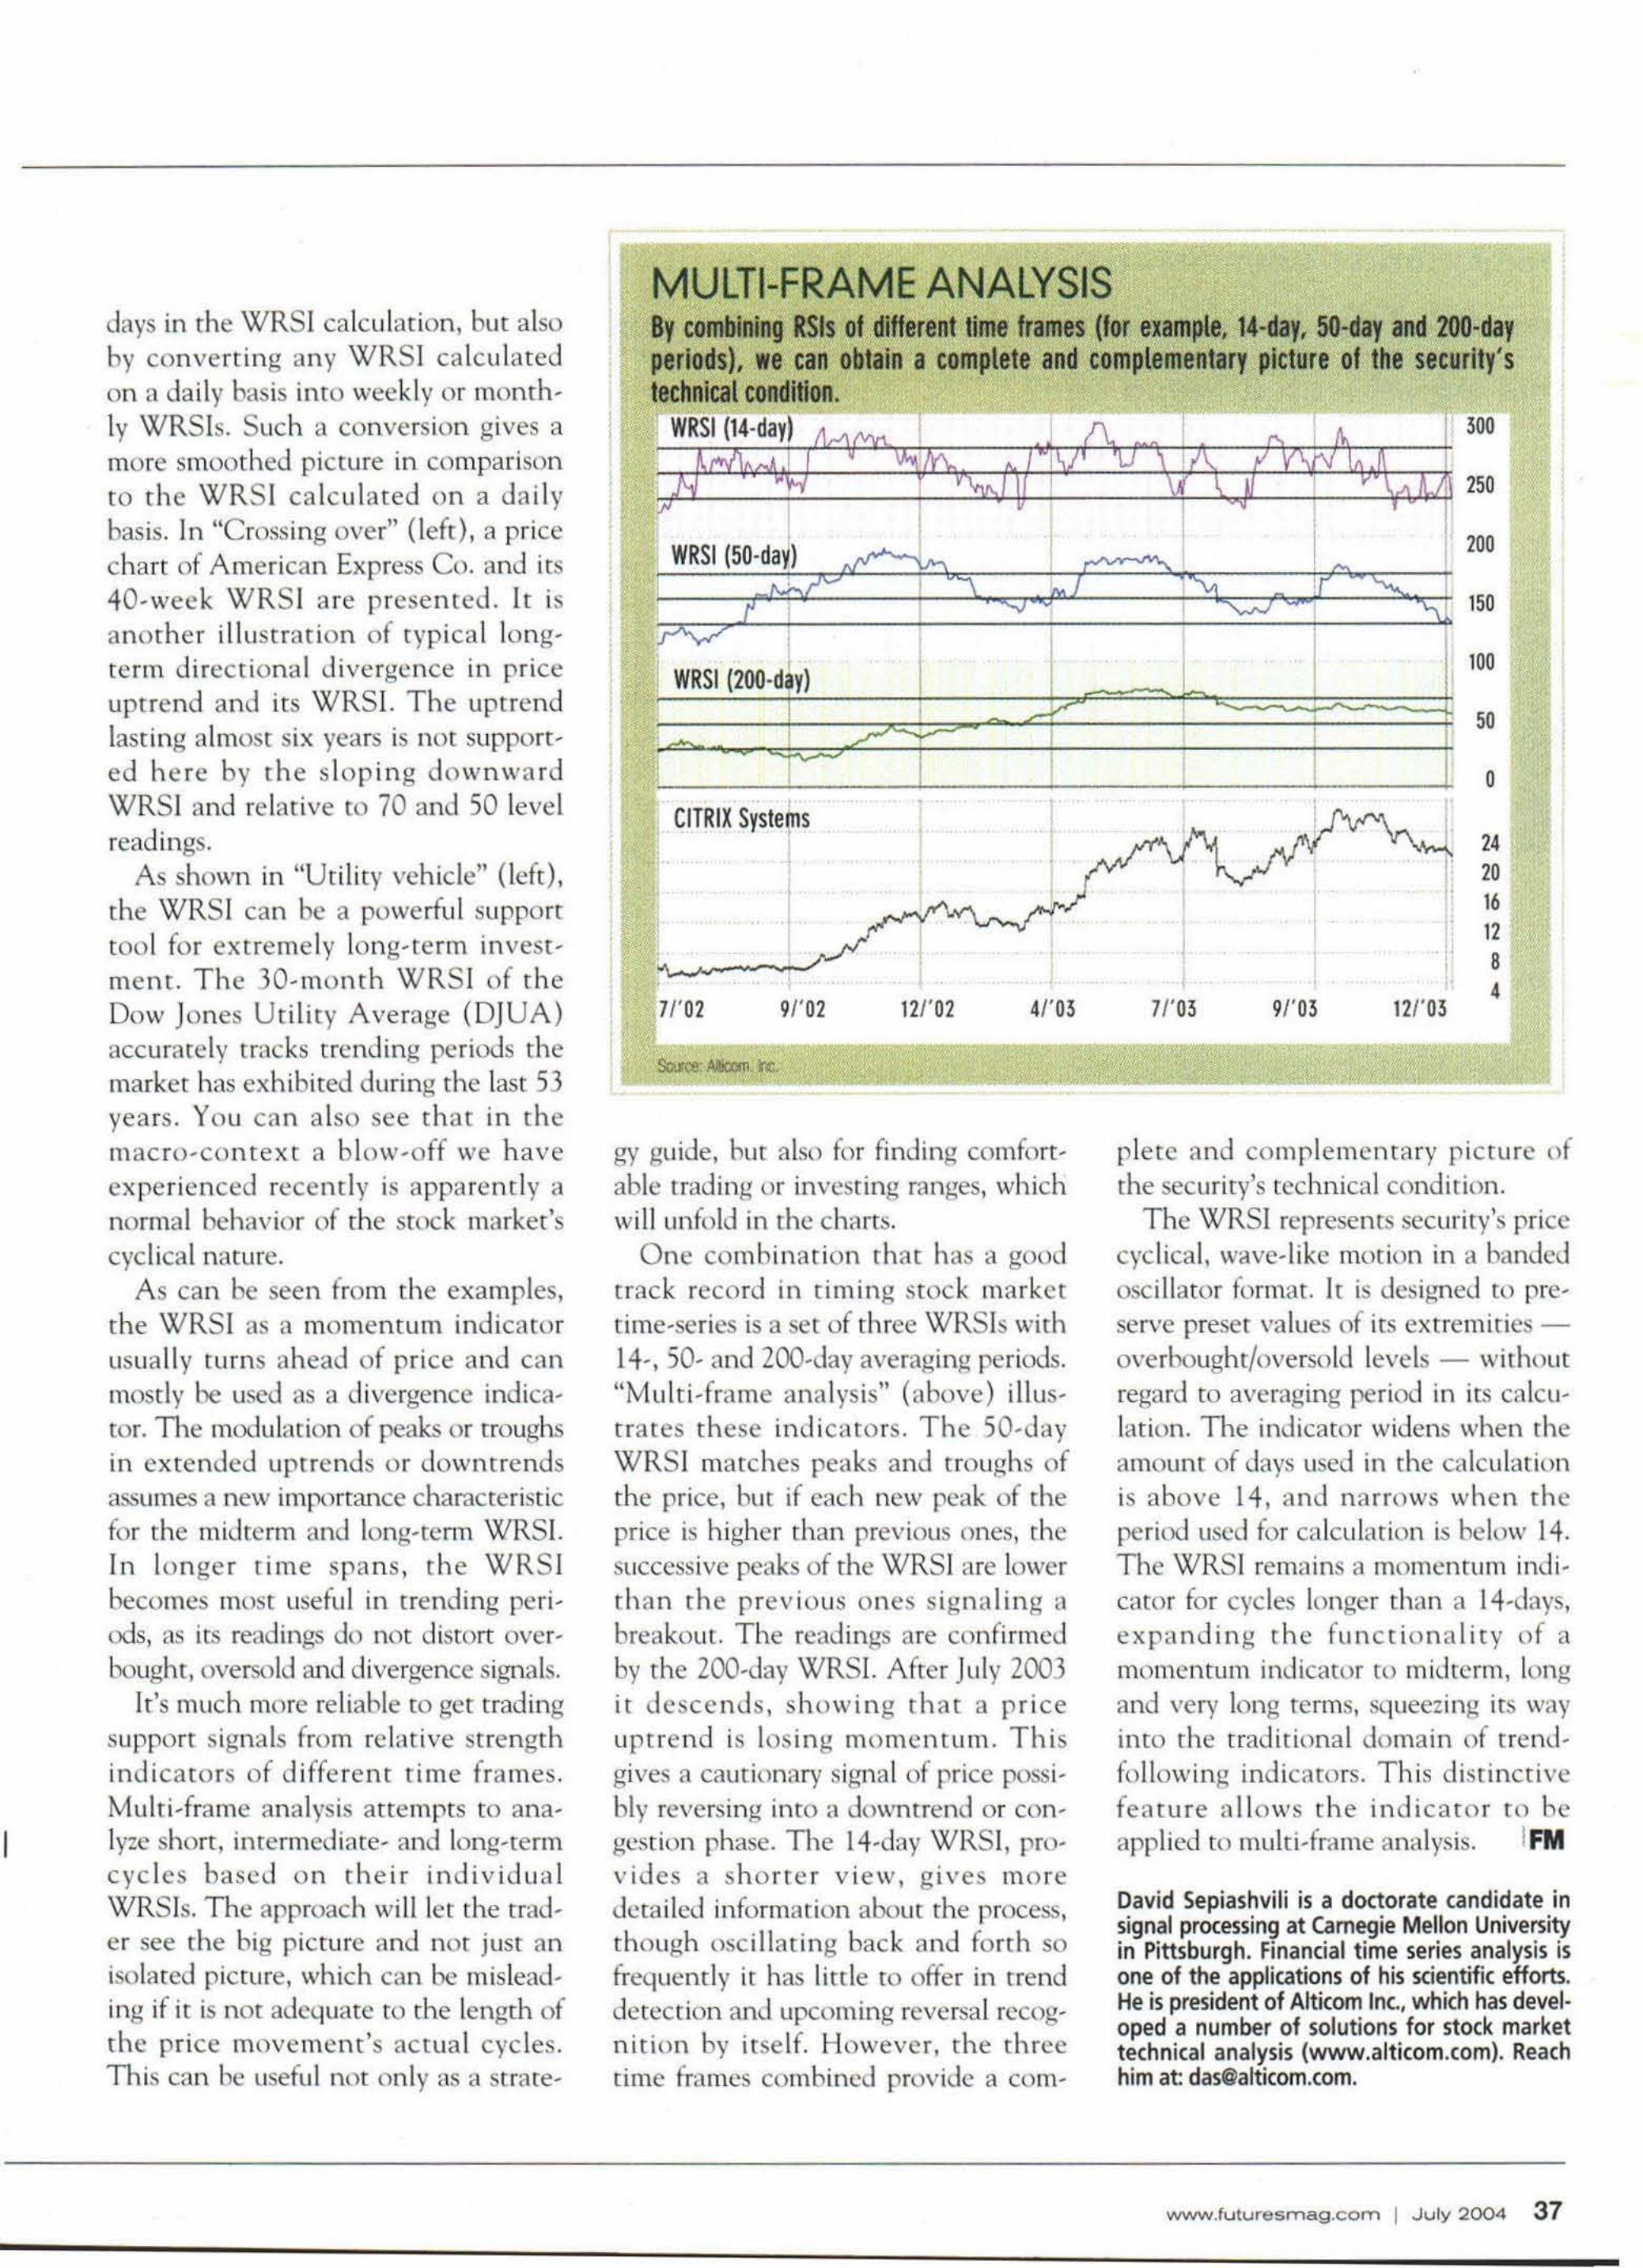
MULTI-FRAME ANALYSIS By combining RSls of different time frames (lor example. U-day. 5O-day and 2OO-day periods) •• e can obtain a complete and complementary picture 01 the securlty's technical condltiotl.
WRSI (14-d'yl 300
250
WRSI {50· d.!) 200
~~~:~=====t==::~~====~==~~:;==~~ 150
WRSI (200-d!y) 1
, CITRIX Syslems . ,
,
71'02 91'02 121' 02 41'03
gy guide, but also for finding comfortable trading or invest ing ranges, wh ich will unfold in the charts.
O ne combination (hat has a good track reco rd in timing stoc k market time-series is a set of three WRSIs with 14-,50- and 200-day averaging periods. "Mult i-frame ana lys is" (above) illustra tes these indi cato rs. The 50~day WRSI matches peaks and troughs of the price, but if each new peak of the price is higher than previous ones, the success ive peaks of the WRS1 are lower than th e prev io us o nes signa ling a breakout . The readi ngs are confirmed by the 200-day WRSJ. After july 2003 it desce nd s , sh o wing (ha t a pr ice uptrend is lOS ing mo mentum. This gives a cautionary signal of price poss i ~
bly reversing into a dowmrend or can, gest ion phase. The 14-day WRS I, provides a sh o rte r v iew , g ives mo re de tai led information about the process, though osci llat ing back and forth so frequently it has little ro offer in trend de tection and upcoming reversa l recog~ l1ition by itself. However , the th ree time frames combined provide a com~
71'03 91'03
100
50
o
24 20 16 12
I' 8 4
121'03
plete and complementary picrure of the security's technical concl ition .
The WRSI represents security's price cyclica l, wave~ lik e motion in a banded oscillator format. It is designed to pre~
serve preset va lues of its extremities -overbought/oversold levels - without regard to averaging period in its calcu~ lation . The indicatOr widens when the amount of days used in the calculation is above 14. and narrows when the period used for calculation is below 14. The WRSI remains a momentum indi ~
carQf for cycles longer than a 14~days,
expand in g rhe fun c ti o n a lity of a momentum indicator to midterm, long l·md very long terms, squeezing its way into the trad it iona l domain of trend ~
fo llowing ind icators. This distincrive fe a ture al lo ws t he indi ca to r to be app lied to multi ,frame analys is. IFM
David Sepiashvili is a doctorate candidate in signal processing at Camegie Mellon University in Pittsburgh. Financial time series analysis is one of the applications of his scientific efforts. He is president of Alticom Inc., which has developed a number of solutions fo r stock market technical analysis (www.alticom.com). Reach him at [email protected].
www.futuresmag.com l ..July 2004 37