Embed Size (px)
Citation preview

User Behavior and Perceptions at Intersections with Turning and Mixing
Zones on Protected Bike Lanes
Paper # 15-1178
Christopher M. Monsere (corresponding author)
Department of Civil & Environmental Engineering
Portland State University
PO Box 751
Portland, OR 97201
503-725-9746 (phone); 503-725-5950 (fax)
Nick Foster
Kittelson & Associates, Inc.
101 S Capitol Boulevard, Suite 301
Boise, ID 83702
Email: [email protected]
Phone: 208-338-2683
Fax: 208-338-2685
Jennifer Dill
Nohad A. Toulan School of Urban Studies and Planning
Portland State University
PO Box 751
Portland, OR 97201
503-725-5173 (phone)
503-725-8770 (fax)
Nathan McNeil
Center for Transportation Studies
Nohad A. Toulan School of Urban Studies and Planning
Portland State University
PO Box 751
Portland, OR 97201
503-725-8581 (phone)
503-725-8770 (fax)
Submitted for presentation at the Annual Meeting and publication in the Journal of the Transportation
Research Board
Submitted August 1, 2014, Revised November 15, 2014
4,767 words + 3 figures x 250 + 8 tables x 250 = 7517 words

Monsere, Foster, Dill, and McNeil 2
ABSTRACT 1
An acknowledged challenge with protected bike lanes in the U.S. is that even though the segment is 2
separated from traffic, bicyclists must merge or interact with turning traffic at intersections unless all 3
movements are signalized. This paper presents a comparison of five different intersection designs for 4
protected bike lanes at intersections without bicycle signals. They represent different ideas for how to 5
mix and interact bicycles and motor vehicles. The designs communicate to road users how this interaction 6
is to occur with lane striping, green pavement markings, shared lane-use markings (sharrows), and with 7
vertical flexpost delineators. In the paper, the designs are divided into “mixing zones” and “turning zones 8
with a through bike lane” for evaluation purposes. The paper compares and contrast the designs using 9
observed user behavior (from 78 hours of video were analyzed, in which 6,082 bicyclists and 7,574 10
turning vehicles were observed) and self-reported behaviors and comprehension (from 1,245 nearby 11
residents and 690 intercepted bicyclists). Overall, the evaluation suggests there are benefits to clear 12
demarcation of the entry to the merge zone for bicycles and cars and to creating a semi-protected through 13
bicycle lane. 14
15
Monsere, Foster, Dill, and McNeil 3
INTRODUCTION 1
Until recently there was limited research on protected bike lanes, also known as cycle tracks or separated 2
bikeways, in the North American context. As more cities have installed them, the opportunity for 3
evaluation has increased. Recent findings suggest that protected bike lanes can both improve bicyclists’ 4
level of comfort and safety and potentially increase the number of people bicycling. In terms of observed 5
safety, evidence suggests that protected bike lanes can reduce the risk of crashes or injuries for cyclists. 6
Lusk et al. (1) analyzed 10 years of emergency medical response records and compared them to bicycle 7
counts to calculate a relative risk of injury on six protected bike lanes and eight control streets in 8
Montreal. Their findings indicate that the protected bike lanes resulted in a 28% lower risk of injury. A 9
follow-up study of 19 protected bike lanes in the United States found that the crash rate for bicyclists on 10
protected bike lanes was lower than on general roadways (2). Another study examined records of adults 11
treated at hospital emergency departments for injuries while bicycling and compared injury sites to 12
control sites in Vancouver and Toronto, Canada using a case-crossover design (3). They found that 13
separated facilities for bicyclists were associated with lower injury risk. A recent literature review on the 14
safety of urban protected bike lanes found that they can reduce collisions and injuries when effective 15
intersection treatments are employed, though only one of the reviewed papers was from North America 16
(4). 17
An acknowledged challenge with protected bike lanes in the U.S. is that even though the segment 18
is separated from traffic, must merge or interact with turning traffic at intersections unless all movements 19
are signalized. A study in Denmark, a country with considerable experience with protected bike lanes, 20
analyzed bicycle crash risk using traffic volumes and one to five years of before-and-after crash counts on 21
20 km of protected bike lanes and 110 km of comparison routes (5). The study found that crashes and 22
injuries along protected bike lanes increased at intersections but decreased along links, with an overall 23
increase of 10%, indicating the need for careful design at intersections. The study also noted that cycle 24
traffic increased 20%, and that the costs of injuries needed to be weighed against the benefits of increased 25
cycling. 26
This paper presents the comparison of five different intersection designs for protected bike lanes 27
at intersections. They represent different ideas for how to mix bicycles and motor vehicles. The designs 28
(presented in Figure 3) communicate to road users how this interaction is to occur with striping, the use of 29
green pavement markings, shared lane-use markings (sharrows), and the use of flexpost or safe hit 30
delineators. Past research has shown that innovative bicycle road markings may not be well 31
comprehended by drivers (6), and so evaluating user comprehension is important. The designs are divided 32
into “mixing zones” and “turning zones with a through bike lane” for evaluation. The data presented in 33
this paper are drawn from a larger research effort that studied nine new protected bike lanes in five large 34
U.S. cities: Austin, TX; Chicago, IL; Portland, OR; San Francisco, CA; and Washington, D.C. More 35
details on the project and findings are available in the final report (7). 36
The paper begins with an overview of the video and survey data collection process. Next, the 37
study intersections included in this analysis are explained with a focus on intended behaviors of bicyclists 38
and motorists. Findings are presented on stated behavior (from surveys) and observed behavior (from 39
video). Intersection safety is assessed based on observed conflicts and stated perceptions of safety. 40
Finally a summary table is presented and conclusions presented. 41
DATA 42
Video Data 43
Video was recorded at the study intersections in the spring and fall of 2013. For the locations presented in 44
this paper, a total of 78 hours of video were analyzed, in which 6,082 bicyclists and 7,574 turning 45
vehicles were observed. Camera views at each study site were selected that would best capture potential 46
Monsere, Foster, Dill, and McNeil 4
turning conflicts with motorists and pedestrians. The camera views allowed for collection of vehicle 1
positioning, bicyclist positioning, traffic signal indications, and other features. Cameras were mounted for 2
at least 48 hours with the goal of capturing two midweek days between the hours of 7 a.m. and 7 p.m. 3
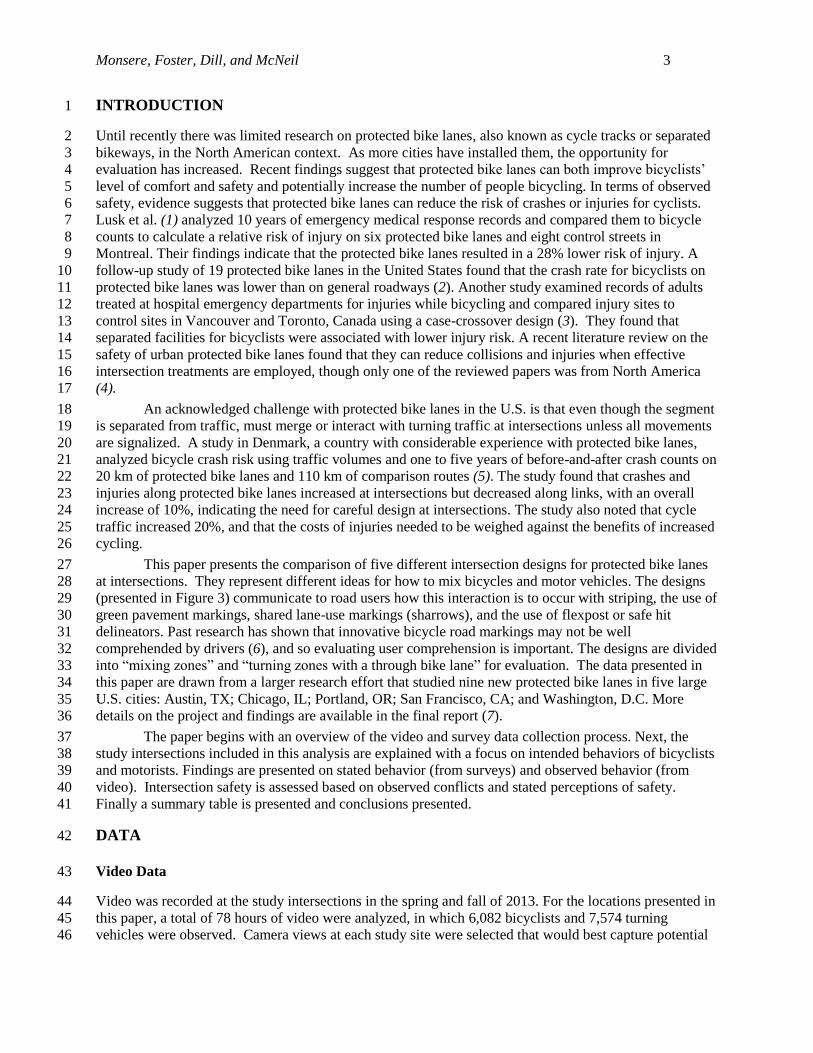
Because the San Francisco facilities are popular weekend routes for accessing Golden Gate Park, video 4
was also collected on a Saturday at those locations and two hours at each location is included in the 5
reduced data. Weekend traffic (non-commuter) could differ in behaviors. A sample of the video from San 6
Francisco is shown in Figure 1. 7
The video was reviewed and reduced by six individuals who each were responsible for between 8 8
to 23 two-hour time periods. Video data consistency and reliability was monitored through spot checks, 9
flagging and re-reviewing unexpected variations between reviewers, and distributing video assignments 10
evenly across facilities. For this paper, only a subset of the information gathered from the video review 11
but relevant to this evaluation is presented. Other data collected from the video, such as compliance with 12
traffic signals and other bicycle and driver behavior variables not specifically related to the mixing and 13
turning zones, are presented in the full report. 14
15 FIGURE 1. Example Video Screenshots (2 views) from San Francisco at Oak and Broderick 16
Survey 17
Two surveys were conducted for each facility studied, as described below. All survey protocols were 18
pilot-tested and approved by the Portland State University Human Subjects Review Committee. 19
Resident Survey 20
Paper copies of the resident survey were mailed to up to 2,000 resident addresses within a specific 21
boundary (up to a quarter mile) of each study facility. The size of the boundary around each facility 22
differed based on the density of the surrounding area and the resulting distance needed to achieve an 23
ample sample size. Resident addresses are taken from the Reference USA database accessed through a 24
subscription service. The paper surveys were printed in booklet form and ranged in size from 8-12 pages. 25
Survey recipients were given the option of completing and returning the paper survey in a postage-paid 26
envelope or completing an online version of the questionnaire. Respondents also had the option of 27
entering a drawing for one of three $100 Amazon.com gift cards in each city. For the subset of the 28
facilities reported in this paper, a total of 1,245 or 24% of those who received the survey in the mail 29
responded to the survey. These respondents provided the perspective of people who live, drive, and walk 30
near the new lanes, as well as residents who bike on the new lanes. 31
Bicyclist Intercept Survey 32
The bicyclist survey focused more on people’s experiences riding in the protected lanes. The survey was 33
designed as an intercept survey with riders receiving a postcard directing them to a web address to 34
complete the survey electronically. Project team members, volunteers, or city staff intercepted bicyclists 35

Monsere, Foster, Dill, and McNeil 5
along the study facility and handed them a postcard encouraging them to take an online survey. The 1
postcard included a web address and unique code needed to access the survey. Locations for survey 2
distribution along each facility were typically at locations where bicyclists were already required to stop 3
(i.e., stop-controlled or signalized intersections). Similar to the resident survey, respondents to the 4
bicyclist survey were provided the option to enter a drawing for one of three $100 Amazon.com gift cards 5
in each city. For the subset of the facilities reported in this paper, a total of 690 or 37% of those invited to 6
participate responded. 7
STUDY INTERSECTIONS 8
A summary of the designs presented in this paper are shown in Figure 2, and again as plan view 9
schematics in Figure 3. The design dimensions and most details are shown (note signage is not shown and 10
was not evaluated). In general, there are two different design approaches were evaluated. First, some 11
designs require the bicycles and turning vehicles to “mix” in the same space. These designs are called 12
“mixing zones.” The second approach moves the through bicycle from the protected lane near the curb to 13
the left or right of the turning traffic into a narrow through bike lane (TBL). The space where the turning 14
vehicle and through bicycle cross happens in space defined as the turn/merge gap. These are called 15
“turning zones.” The through bike lanes are marked with dotted lines recognizing that larger vehicles will 16
probably encroach on the bike lane due to the narrow widths of the turning lanes. The figure shows that 17
the contexts evaluated include both left- and right-turn designs. In Figure 3, the relevant design 18
dimensions are provided for the all the critical features. In this paper, a motor vehicle was defined “as 19
present” for bicycles if they were within two car lengths of the bicycle from when the bicycle was in the 20
study area (mixing or turning zone). Additional operating details such as posted speeds, vehicle volumes 21
and turning volumes are presented in the Table 8. 22
Mixing Zone with Yield Entry
Markings NE Multnomah and NE 9th Ave
Portland, OR
Turning Zone with Post Restricted Entry and Through Bike Lane (TBL)
L Street & 15th Street, L Street & Connecticut.
Washington D.C.
Turning Zone with Unrestricted Entry and Through Bike Lane (TBL)
Fell St. and Divisadero St Oak St. and Divisadero St
San Francisco, CA
Mixing Zone with Sharrow Oak St. and Broderick St
San Francisco, CA
Mixing Zone with Green Coloring Fell St. and Baker St
San Francisco, CA
FIGURE 2 Pictures of Intersections included in Analysis 23
24

Monsere, Foster, Dill, and McNeil 6
Mixing Zone with Yield Entry
Markings NE Multnomah and NE 9th Ave
Portland, OR
Turning Zone with Post Restricted Entry and Through Bike Lane (TBL)
L Street & 15th Street, L Street & Connecticut.
Washington D.C.
Turning Zone with Unrestricted Entry and Through Bike Lane (TBL)
Fell St. and Divisadero St Oak St. and Divisadero St
San Francisco, CA
For each schematic:
Dimension is width (ft) for mixing zone, motor vehicle turn lane,
motor vehicle through lane, through bicycle lane.
End of protected lane is measured from the stop bar (ft).
Turn merge gap is length (ft).
Mixing Zone with Sharrow Oak St. and Broderick St
San Francisco, CA
Mixing Zone with Green Coloring Fell St. and Baker St
San Francisco, CA
FIGURE 3 Plan Schematics for Intersections (Not to Scale and Not all Design Elements Shown) 1
2

Monsere, Foster, Dill, and McNeil 7
RESULTS 1
The task of communicating when a street space is shared for two purposes— turning vehicles and through 2
bicycles— presents a design challenge. To understand how well the intersections met their design 3
objectives, behaviors of people driving and bicycling were analyzed using video (“observed behavior”) as 4
well as asking comprehension-related questions in the surveys. The results are presented separately as 5
self-reported comprehension and observed behaviors. Safety performance was quantified by a surrogate 6
measure of safety—observed conflicts between users. Self-reported perceptions of safety are also 7
presented. 8
Definition of Expected User Behaviors 9
In order to evaluate the designs, the expected behaviors must be defined. While the expected behaviors 10
are labeled “correct” in our analysis, other observed behaviors may be acceptable or even legal (e.g. not 11
ridding over a sharrow). The degree to which the incorrect behavior is a critical issue depends on the 12
situation. In Figure 3, the appropriate turn/merge gap is identified with purple color (light gray in black 13
and white print). Table 1 summarizes the behaviors expected and highlighted in the remaining sections as 14
“correct”. 15
16
TABLE 1 Expected User Behaviors 17
Design Type Through Bicycle Behavior Driver Turning Behavior
Turning Zone with Post Restricted
Entry and Through Bike Lane (TBL)
From the protected lane, follow sharrows
through the turn/merge gap to the TBL,
positioning themselves completely in the
TBL From the through vehicle lane, cross the
through bicycle lane at the turn/merge
gap and position vehicle for turn entirely
in motor vehicle turn lane Turning Zone with Unrestricted
Entry and TBL
From the protected lane, follow the TBL
marking through the turn/merge gap to the
through bicycle lane positioning themselves
completely in the TBL
Mixing Zone with Yield Entry
Markings From the protected lane, enter the mixing
zone (riding over sharrows if present),
positioning themselves completely in mixing
zone
From the through vehicle lane, enter the
mixing zone at the turn/merge gap and
position vehicle for turn entirely in
mixing zone
Mixing Zone with Sharrow Marking
Mixing Zone with Green Skip
Coloring
18
Observed Use of Designs 19
Bicyclist 20
In the video review, the paths and actions of cyclists through the intersection were observed and recorded. 21
To control for the influence of motor vehicles on path choice, the video review noted whether a vehicle 22
was present. Table 2 summarizes the results of the video review. The results for the Turning Zone with 23
Post Restricted Entry and Through Bike Lane (TBL) in Washington, D.C. and Turning Zone with 24
Unrestricted Entry and TBL San Francisco are shown in the top rows. The table shows that bicyclists use 25
the TBLs at L Street at Connecticut Avenue and Oak Street at Divisadero Street nearly as often when 26
there are not cars as when there are, about 87% of the time. At L Street and 15th Street, bicyclists only use 27
the TBL when cars aren't present two-thirds of the time; however, this was due to the number of bicyclists 28
turning left onto the 15th Street protected bike lanes. Though not shown in the table, additional analysis 29
found that the use of the TBL is 84% when only through bicyclists are considered at 15th Street, which is 30
comparable to the other two locations. The video review also noted when cars forced bicyclists out of the 31
Monsere, Foster, Dill, and McNeil 8
TBL (forced out by MV). This is relatively infrequent at the L Street intersections (about 4% of the 1
observations when cars are present) because the design has restricted entry and shorter turning/merge 2
space. At the Oak/Divisadero location, however, this occurs more frequently, about 13% of the time. 3
This primarily occurs when motor vehicles merge late or straddle the TBL (which is shown in Table 3 to 4
occur for 21% of turning motor vehicles). 5
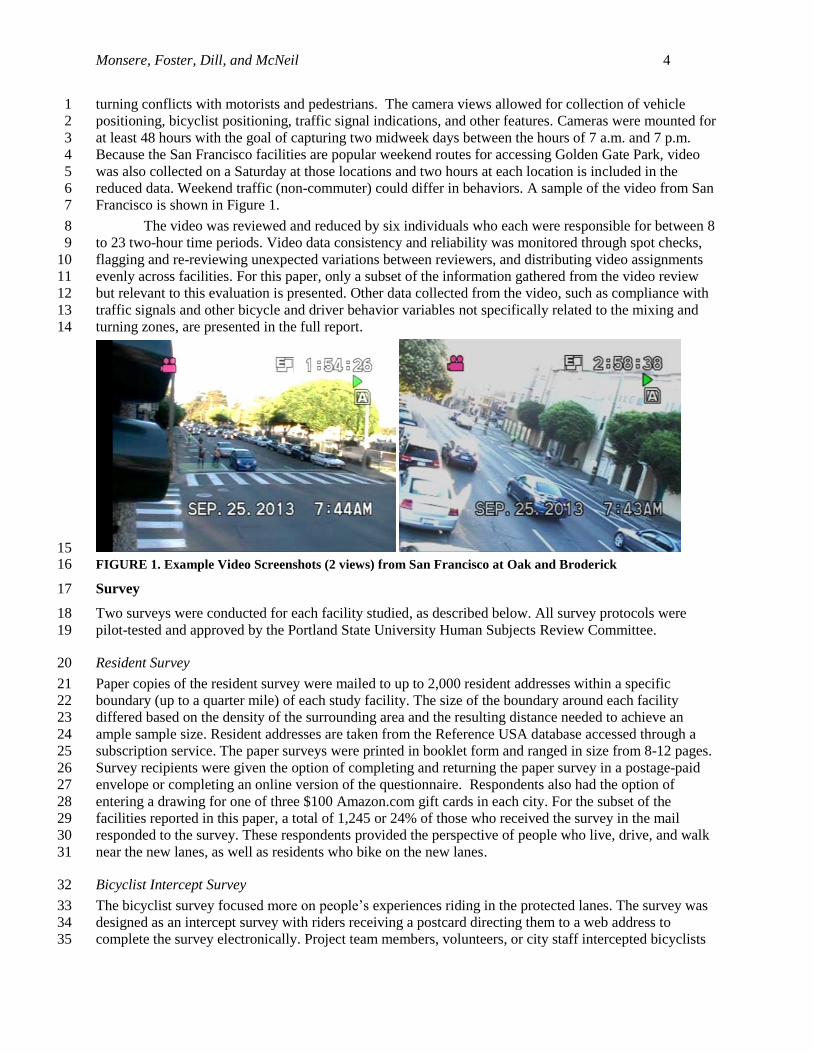
In the lower section of Table 2, the observed through lane use for bicyclists for the Mixing Zone 6
with Yield Entry Markings and the Mixing Zone with Sharrow designs. At Mixing Zone with Yield Entry 7
Markings at NE Multnomah/9th only about 15% of the observed cyclists used the buffer space when a car 8
was not present. When a car was present, the buffer space was more than twice as likely to be used (37%). 9
This likely reveals that many bicyclists prefer to be out of the vehicle lane (and not wait in the queue of 10
turning vehicles). At the Mixing Zone with Sharrow design at Oak/Broderick intersection, there was a 11
significant difference in the cyclists’ path when cars were present or not, as shown in Table 2. When there 12
were no cars present, about 76% of cyclists rode directly over the sharrows in the center of the lane (the 13
video review did not log whether the cyclists went to right of left of the sharrow). When vehicles were 14
present, cyclists only rode over the sharrows 30% of the time. At this location, the pavement closest to 15
the curb was rough concrete and the sharrows were located in the smooth asphalt—this likely influenced 16
cyclists positioning. 17
18
TABLE 2. Through Bicyclist Observed Behaviors for Turning and Mixing Zones 19
Through
Bicyclist Lane
Use
Turning Zone with Post
Restricted Entry and TBL:
L Street/ 15th Street
Turning Zone with Post
Restricted Entry and TBL:
L Street/ Connecticut
Turning Zone with Unrestricted
Entry and TBL:
Oak/ Divisadero:
No Cars
Present
Cars
Present
No Cars
Present
Cars
Present
No Cars
Present Cars Present
In TBL 68% 89% 87% 93% 83% 81%
Not in TBL 32% 8% 13% 3% 17% 6%
Forced out by
MV 0% 3% 0% 4% 0% 13%
n 225 448 434 320 1237 404
Through
Bicyclist Lane
Use
Mixing Zone with Yield Entry
Markings: NE Multnomah/9th
No Cars
Present
Cars
Present
In Mixing Zone 85% 63%
Uses Buffer 15% 37%
n 163 87
Through
Bicyclist Lane
Use
Mixing Zone with Sharrow:
Oak/Broderick
No Cars
Present
Cars
Present
Cyclist Rode
Over Sharrow 76% 30%
Cyclist Did Not
Ride Over
Sharrow
24% 70%
n 115 1351
Note: Excludes Bicyclists Observed Not in Protected Lane or Wrong-Way Cyclists 20
Drivers 21
In the video review, vehicles were coded based on where they entered the merge zone or alternatively, if 22
they merged early, merged across the buffer/TBL (a late decision to turn), or just turned from the wrong 23

Monsere, Foster, Dill, and McNeil 9
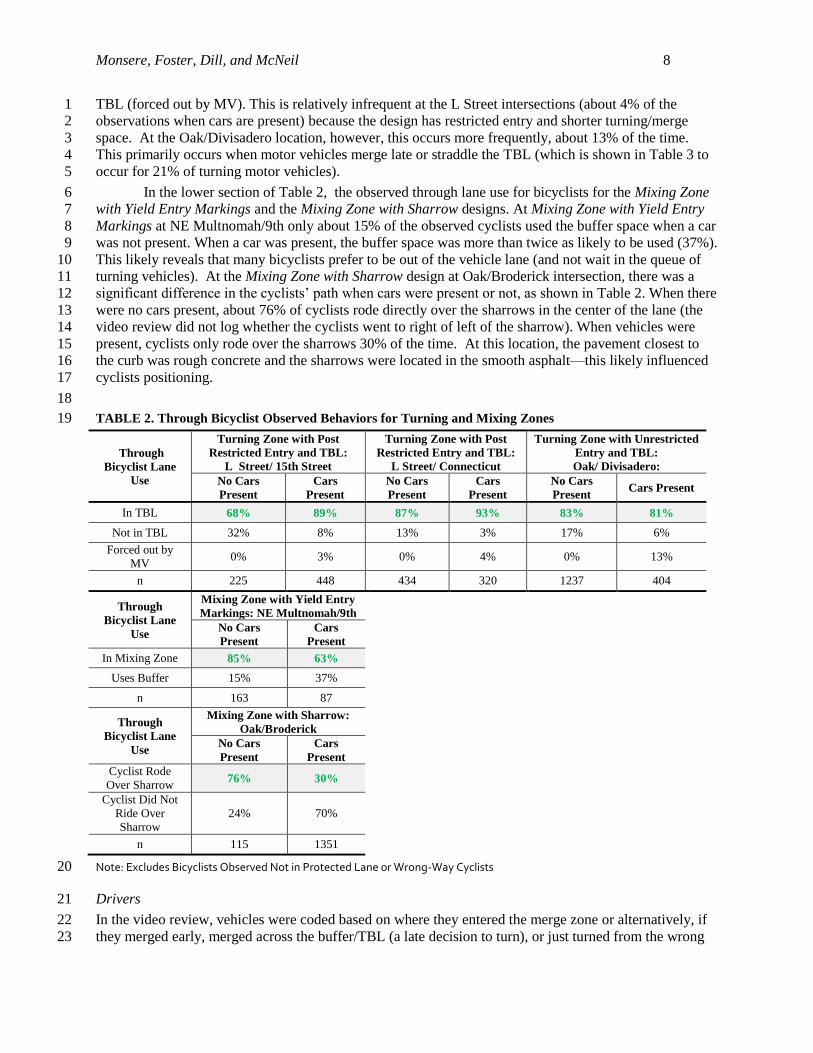
lane. Table 3 summarizes the result of the video review. The correct behavior, entered in the merge zone, 1
is bolded in green and the cell is shaded. Of the designs evaluated, motorists are most likely to merge into 2
the zone at the appropriate location at Mixing Zone with Yield Entry Markings at NE Multnomah/9th (93% 3
of observed vehicles entered correctly) and the two Turning Zone with Post Restricted Entry and TBL in 4
D.C. intersections on L St. with the (88% and 86%). These intersections have strong guidance (i.e., posts 5
and parked cars) making it difficult or impossible for motor vehicles to enter the bike lane at any location 6
other than the designated merge point. They are least likely to merge at the appropriate location at the 7
Mixing Zone designs in San Francisco locations—the sharrow at Oak/Broderick (only 48%) and the full 8
green skip marking at Fell/Baker (49%). At the Mixing Zone with Sharrow at Oak/Broderick, motorists 9
are entering early (20% fully into the facility early and another 11% just merging a bit early across the 10
buffer). One site-specific issue is that prior to the intersection, there are not many flexposts for the 11
protected segment due to driveways. Finally, at Mixing Zone with Green Skip Coloring at Fell/Baker 12
where the green skip markings cover the entire lane, nearly 20% of the observed motor vehicles were 13
observed turning from the wrong lane (another 17% are turning while straddling the turn lane and the 14
through lane and 15% entering early). 15
For the three Turning Zone locations, video reviewers recorded the observed position of the 16
vehicle after it had completed its merge through the mixing zone and had started its turn. Vehicles were 17
coded as either having wheels still in the TBL or not in the TBL at all. Note that it's not illegal or 18
unexpected to have some drivers in the TBL with the dotted marking. The lower portion of Table 3 shows 19
the results. A relatively high percentage of drivers encroached in the TBL after merging across the TBL 20
into the turn lane by continuing to drive or stop in them (Oak/Divisadero: 66%, L St/Connecticut: 41%, L 21
St/15th: 30%). This observed encroachment is likely primarily due to the narrow turn lane widths (less 22
than 9 feet). 23
24
25

Monsere, Foster, Dill, and McNeil 10
TABLE 3. Observed Motor Vehicle Turning Location at Mixing Zone Intersections 1
Motor Vehicle
Actions
Turning Zone Mixing Zone
with Post
Restricted
Entry and
TBL
with Post
Restricted
Entry and
TBL
with
Unrestricted
Entry and
TBL
with Yield
Entry
Markings
with Sharrow with Green
Skip Coloring
L Street/
15th Street
L Street/
Connecticut
Oak/
Divisadero
NE
Multnomah/
9th
Oak/
Broderick Fell/Baker
Entered in Merge
Zone 88% 86% 66% 93% 48% 49%
Wrong Lane 2% 8% 6% 1% 7% 18%
Entered Early 7% 2% 7% 2% 20% 15%
Entered from
Garage/Alley/etc. 2% 4% 0% n/a 4% 0%
Merged Across
Buffer/TBL n/a n/a 11% n/a 11% 0%
Straddled
Lanes/Buffer n/a n/a 10% 5% 9% 17%
Other 0% 1% 0% 0% 0% 1%
n 1978 1348 1900 1524 323 501
Position of vehicle after it had completed its merge through the
mixing zone and had started its turn:
Not in TBL 70% 59% 34%
Drove/Stopped in
TBL 30% 41% 66%
n * 47 104 125
Turn Lane Width 8 ft 9 ft 8ft 9in
Notes: *Observations excludes those who don't enter and those movements coded unable to determine 2 Correct response for each design in bold green type with grey shading. 3
4
Self-Reported Comprehension of Designs 5
Bicyclist 6
In the cyclist survey in Portland and the resident survey (that includes users of all modes) in San 7
Francisco, participants were asked to select a region of a photograph of the intersection that identified the 8
proper lane position for a bicyclist continuing through the intersection. The image was from the 9
perspective of the person on a bicycle looking towards the intersection (similar to the images in Figure 2). 10
This type of question was not asked in the D.C. survey (it was the first survey and these questions were 11
added later). Table 4 summarizes the self-reported understanding of correct lane positioning for bicycles 12
going through the intersection and turning right. As with the previous tables, the “correct” response is 13
bolded and in green text and the cell is shaded. 14
When asked to identify the correct lane for through bicyclists, the Turning Zone with Unrestricted 15
Entry and TBL designs in San Francisco elicited the highest self-reported understanding. A total of 93-16
Monsere, Foster, Dill, and McNeil 11
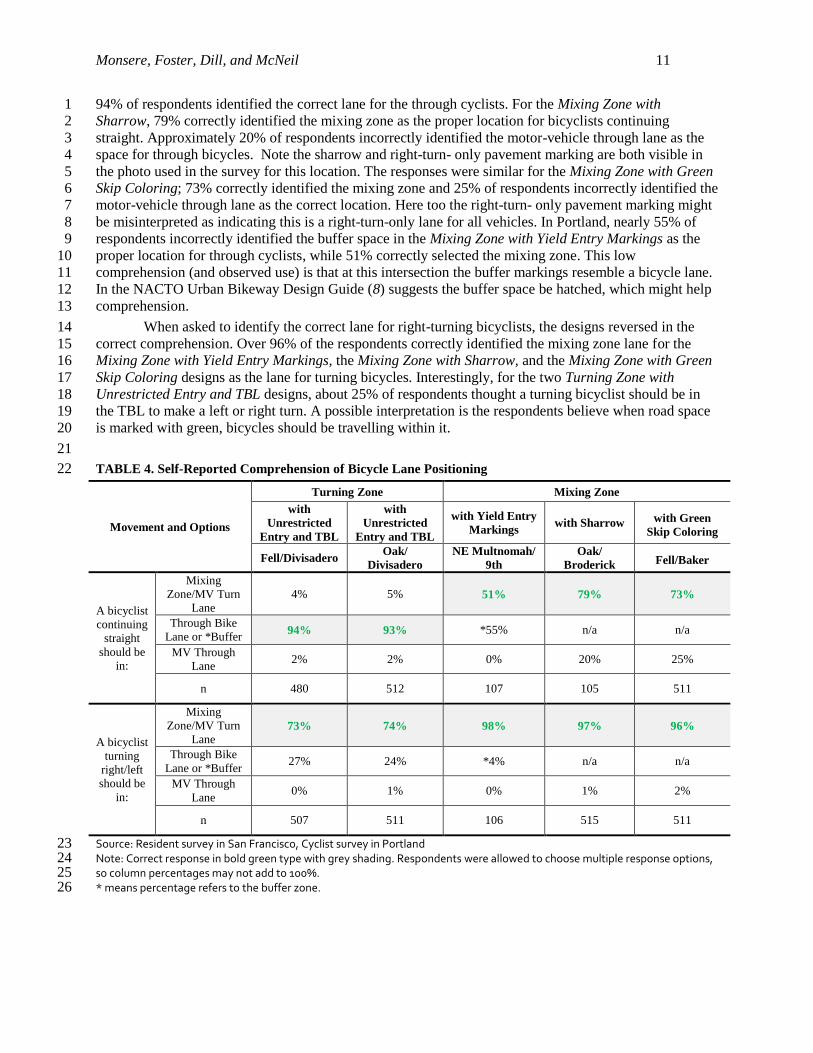
94% of respondents identified the correct lane for the through cyclists. For the Mixing Zone with 1
Sharrow, 79% correctly identified the mixing zone as the proper location for bicyclists continuing 2
straight. Approximately 20% of respondents incorrectly identified the motor-vehicle through lane as the 3
space for through bicycles. Note the sharrow and right-turn- only pavement marking are both visible in 4
the photo used in the survey for this location. The responses were similar for the Mixing Zone with Green 5
Skip Coloring; 73% correctly identified the mixing zone and 25% of respondents incorrectly identified the 6
motor-vehicle through lane as the correct location. Here too the right-turn- only pavement marking might 7
be misinterpreted as indicating this is a right-turn-only lane for all vehicles. In Portland, nearly 55% of 8
respondents incorrectly identified the buffer space in the Mixing Zone with Yield Entry Markings as the 9
proper location for through cyclists, while 51% correctly selected the mixing zone. This low 10
comprehension (and observed use) is that at this intersection the buffer markings resemble a bicycle lane. 11
In the NACTO Urban Bikeway Design Guide (8) suggests the buffer space be hatched, which might help 12
comprehension. 13
When asked to identify the correct lane for right-turning bicyclists, the designs reversed in the 14
correct comprehension. Over 96% of the respondents correctly identified the mixing zone lane for the 15
Mixing Zone with Yield Entry Markings, the Mixing Zone with Sharrow, and the Mixing Zone with Green 16
Skip Coloring designs as the lane for turning bicycles. Interestingly, for the two Turning Zone with 17
Unrestricted Entry and TBL designs, about 25% of respondents thought a turning bicyclist should be in 18
the TBL to make a left or right turn. A possible interpretation is the respondents believe when road space 19
is marked with green, bicycles should be travelling within it. 20
21
TABLE 4. Self-Reported Comprehension of Bicycle Lane Positioning 22
Movement and Options
Turning Zone Mixing Zone
with
Unrestricted
Entry and TBL
with
Unrestricted
Entry and TBL
with Yield Entry
Markings with Sharrow with Green
Skip Coloring
Fell/Divisadero Oak/
Divisadero
NE Multnomah/
9th
Oak/
Broderick Fell/Baker
A bicyclist
continuing
straight
should be
in:
Mixing
Zone/MV Turn
Lane
4% 5% 51% 79% 73%
Through Bike
Lane or *Buffer 94% 93% *55% n/a n/a
MV Through
Lane 2% 2% 0% 20% 25%
n 480 512 107 105 511
A bicyclist
turning
right/left
should be
in:
Mixing
Zone/MV Turn
Lane 73% 74% 98% 97% 96%
Through Bike
Lane or *Buffer 27% 24% *4% n/a n/a
MV Through
Lane 0% 1% 0% 1% 2%
n 507 511 106 515 511
Source: Resident survey in San Francisco, Cyclist survey in Portland 23 Note: Correct response in bold green type with grey shading. Respondents were allowed to choose multiple response options, 24 so column percentages may not add to 100%. 25 * means percentage refers to the buffer zone. 26
Monsere, Foster, Dill, and McNeil 12
Drivers 1
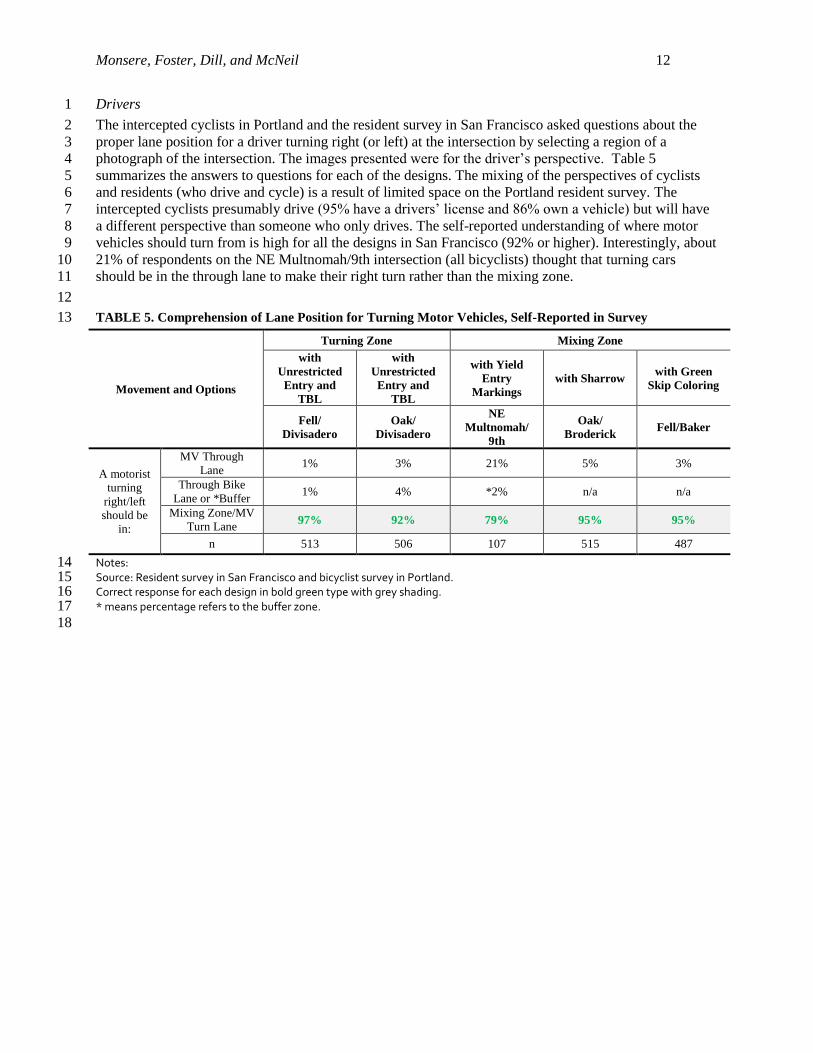
The intercepted cyclists in Portland and the resident survey in San Francisco asked questions about the 2
proper lane position for a driver turning right (or left) at the intersection by selecting a region of a 3
photograph of the intersection. The images presented were for the driver’s perspective. Table 5 4
summarizes the answers to questions for each of the designs. The mixing of the perspectives of cyclists 5
and residents (who drive and cycle) is a result of limited space on the Portland resident survey. The 6
intercepted cyclists presumably drive (95% have a drivers’ license and 86% own a vehicle) but will have 7
a different perspective than someone who only drives. The self-reported understanding of where motor 8
vehicles should turn from is high for all the designs in San Francisco (92% or higher). Interestingly, about 9
21% of respondents on the NE Multnomah/9th intersection (all bicyclists) thought that turning cars 10
should be in the through lane to make their right turn rather than the mixing zone. 11
12
TABLE 5. Comprehension of Lane Position for Turning Motor Vehicles, Self-Reported in Survey 13
Movement and Options
Turning Zone Mixing Zone
with
Unrestricted
Entry and
TBL
with
Unrestricted
Entry and
TBL
with Yield
Entry
Markings
with Sharrow with Green
Skip Coloring
Fell/
Divisadero
Oak/
Divisadero
NE
Multnomah/
9th
Oak/
Broderick Fell/Baker
A motorist
turning
right/left
should be
in:
MV Through
Lane 1% 3% 21% 5% 3%
Through Bike
Lane or *Buffer 1% 4% *2% n/a n/a
Mixing Zone/MV
Turn Lane 97% 92% 79% 95% 95%
n 513 506 107 515 487
Notes: 14 Source: Resident survey in San Francisco and bicyclist survey in Portland. 15 Correct response for each design in bold green type with grey shading. 16 * means percentage refers to the buffer zone. 17
18
Monsere, Foster, Dill, and McNeil 13
Safety 1
Safety performance was quantified by a surrogate measure of safety—conflicts between users. Surrogate 2
measures (rather than reported collision data) were used because, in general, motor vehicle-bicycle 3
collisions are rare occurrences, there is significant underreporting of events, and long time periods and a 4
large number of sites are needed for meaningful analysis with reported crash data. The installation dates 5
of the facilities meant that reported collision data were not yet available for most cities at the time of this 6
paper. 7
Conflicts 8
Video reviewers flagged all potential conflicts, and were instructed to liberally define these events as any 9
motor vehicle–bicycle interaction that did not appear typical. To ensure repeatability in defining conflicts, 10
each flagged event was reviewed by the lead researchers on the study team. Drawing on work in earlier 11
studies, the conflicts were identified and categorized based on observed precautionary braking, 12
precautionary change of direction, emergency braking, emergency change of direction, and/or full stop by 13
either the motorist or cyclist (9-12). A conflict was defined as series of events that could lead to a 14
collision. Each flagged vehicle-bicycle interaction was rated as major (near collision with emergency 15
braking and/or change of direction); substantial (emergency braking and/or change of direction); minor 16
(precautionary braking and/or change of direction); precautionary (a low-risk interaction where a minor 17
change in direction or speed was needed to avoid a conflict); or no conflict. 18
Table 6 summarizes the results of the conflict analysis for the intersections with the various 19
mixing zone designs. No actual collisions were observed and none of the observed conflicts were major, 20
limiting the information to be drawn from the conflict analysis. The majority of events that are identified 21
in the table are “precautionary” conflicts. It should be stressed that these are very minor events on the 22
conflict scale and it not clear if these conflicts have a direct relationship to crashes. The use of 23
precautionary as measure differs from our previous work (8) which excluded reporting these conflicts, 24
and it is not known if precautionary conflicts are predictive of collisions. Note that the San Francisco 25
locations included two additional weekend hours of analysis. In the video review, it was noted for each 26
turning vehicle if a bicycle was present. Thus, both the total number of turning vehicles and the turning 27
vehicles when a bicycle was present are known. Observed conflict rates were calculated using the 28
exposure information (number of through bicycles and number of turning vehicles) and the total number 29
of conflicts (minor + precautionary) using the following equation: 30
𝐶𝑜𝑛𝑓𝑙𝑖𝑐𝑡 𝑅𝑎𝑡𝑒 = 𝐶𝑜𝑛𝑓𝑙𝑖𝑐𝑡𝑠 ∗ 1000
𝑇𝑢𝑟𝑛𝑖𝑛𝑔 𝑉𝑒ℎ𝑖𝑐𝑙𝑒𝑠 ∗ 𝑇ℎ𝑟𝑜𝑢𝑔ℎ 𝐵𝑖𝑐𝑦𝑐𝑙𝑒𝑠 31
The second measure (the turning vehicles when a bicycle was present) more accurately represents 32
“opportunity for collision” than total turning vehicles. This measure is less than ideal though, since some 33
of the turning vehicles in this count may not have had the opportunity to interact with bicycles and the 34
measure still includes all through bicycles. Nonetheless, it allows for a more nuanced exposure rather 35
than total turning vehicles and is bolded in the Table 6. 36
The locations with the two highest rates are mixing zones. At NE Multnomah and 9th there are 37
relatively few bicycles compared to total turning vehicles (219 bicycles, 1,524 turning cars), and the total 38
conflict rate is 0.40. At Oak/Broderick, there are 1,376 bicycles and 323 turning vehicles, and the conflict 39
rate is 0.44. The other mixing zone (Fell / Baker) has the green skip coloring which keeps some vehicles 40
from entering the mixing zone. The largest observed number of conflicts occurs at Oak and Divisadero, 41
with 108 motor vehicle conflicts. However, the rate is the lowest (0.12) and it has the second highest 42
exposure of turning vehicles (1,900) and the highest bicycle volumes (1,609). The other turning zone 43
intersections have similar conflict rates. 44
45

Monsere, Foster, Dill, and McNeil 14
TABLE 6. Summary of Conflict Analysis from Video Review 1
Measure
Turning Zone Mixing Zone
with Post
Restricted
Entry and
TBL:
with Post
Restricted
Entry and
TBL:
with
Unrestricte
d Entry and
TBL:
with Yield
Entry
Markings:
with
Sharrow:
with Green
Skip
Coloring:
L Street/
15th Street
L Street/
Connecticut
Oak/
Divisadero
NE
Multnomah
/ 9th
Oak/Broder
ick Fell/Baker
Conflicts
Precautionary Conflict 40 42 106 13 57 48
Minor Conflict 0 2 2 0 0 1
Total Conflicts 40 44 108 13 57 49
Exposures
Bicycles 518 580 1609 219 1376 1780
Turning Motor Vehicles 1978 1348 1900 1524 323 501
Turning Motor Vehicles
When Bike Present 599 400 547 148 94 209
Conflict
Rate *
1000
Turning Vehicles 0.04 0.06 0.04 0.04 0.13 0.05
Turning Vehicles When
Bikes Present 0.13 0.19 0.12 0.40 0.44 0.13
Note: * Includes 2 additional hours of weekend video 2
Perceptions 3
Bicyclists were asked many questions about the design of the various mixing zones at intersections. With 4
respect to safety, bicyclists were asked how safe they felt bicycling through the intersection. The question 5
asked the bicyclists if they “generally feel safe when bicycling through the intersections.” It is 6
acknowledged that term “generally” can introduce latitude into a respondent’s answer. Table 7 shows the 7
percentage of respondents agreeing with the statement for each intersection. The Multnomah/9th, 8
Oak/Broderick, and Fell/Broderick intersections had the next highest perceptions of safety, and the L 9
Street intersections had the lowest perception of safety, though a large majority (64%) did feel safe. 10
11
TABLE 7. Safety Perceptions of Bicyclists Surveyed About Intersection Designs 12
Intersection
I generally feel safe when bicycling through the intersections.
Strongly
Disagree
Somewhat
Disagree
Somewhat
Agree Strongly Agree n
Turning Zone
with Post Restricted Entry and
Through Bike Lane (TBL): L Street 10% 25% 49% 15% 284
with Unrestricted Entry and Through
Bike Lane (TBL): Fell/Divisadero 6% 21% 54% 19% 242
with Unrestricted Entry and Through
Bike Lane (TBL): Oak/ Divisadero 5% 21% 52% 22% 238
Mixing Zone
with Yield Entry Markings:
Multnomah /9th 7% 20% 57% 16% 107
with Sharrow Marking:
Oak/Broderick 0% 19% 55% 24% 234
with Full Green Skip Marking:
Fell/Broderick 3% 13% 54% 30% 240
Source: Cyclist intercept survey. Rows do not sum to 100% - responses with “No Opinion” not shown 13

Monsere, Foster, Dill, and McNeil 15
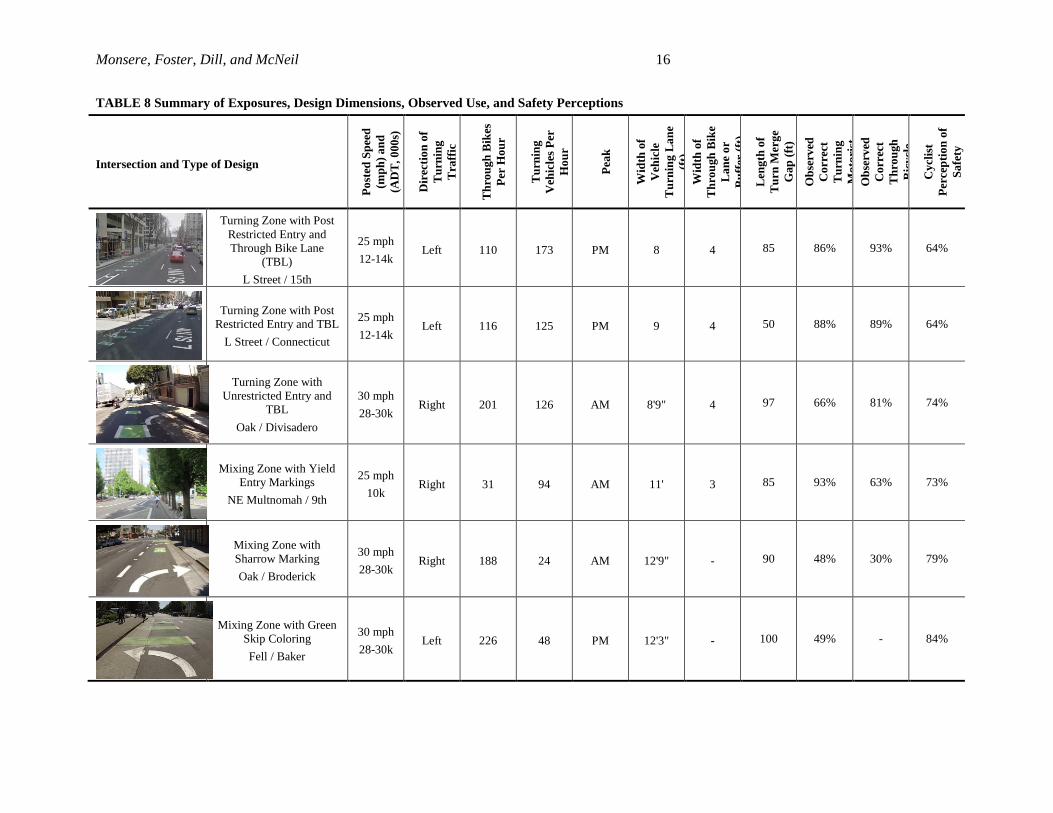
Summary 1
Table 8 summarizes the through bicycle volumes, the turning vehicle volumes, and the design dimensions 2
for each intersection. The table also includes the average hourly volumes from the 2-day period in the 3
video data collection for the peak period. 4
Monsere, Foster, Dill, and McNeil 16
TABLE 8 Summary of Exposures, Design Dimensions, Observed Use, and Safety Perceptions
Intersection and Type of Design
Po
sted
Sp
eed
(mp
h)
an
d
(AD
T,
000
s)
Dir
ecti
on
of
Tu
rnin
g
Tra
ffic
Th
rou
gh
Bik
es
Per
Ho
ur
Tu
rnin
g
Veh
icle
s P
er
Ho
ur
Pea
k
Wid
th o
f
Veh
icle
Tu
rnin
g L
an
e
(ft)
Wid
th o
f
Th
rou
gh
Bik
e
La
ne
or
Bu
ffer
(ft
)
Len
gth
of
Tu
rn M
erg
e
Ga
p (
ft)
Ob
serv
ed
Co
rrec
t
Tu
rnin
g
Mo
tori
st
Ob
serv
ed
Co
rrec
t
Th
rou
gh
Bic
ycl
e
Cy
clis
t
Per
cep
tio
n o
f
Sa
fety
Turning Zone with Post
Restricted Entry and
Through Bike Lane
(TBL)
L Street / 15th
25 mph
12-14k Left 110 173 PM 8 4 85 86% 93% 64%
Turning Zone with Post
Restricted Entry and TBL
L Street / Connecticut
25 mph
12-14k Left 116 125 PM 9 4 50 88% 89% 64%
Turning Zone with
Unrestricted Entry and
TBL
Oak / Divisadero
30 mph
28-30k Right 201 126 AM 8'9" 4 97 66% 81% 74%
Mixing Zone with Yield
Entry Markings
NE Multnomah / 9th
25 mph
10k Right 31 94 AM 11' 3 85 93% 63% 73%
Mixing Zone with
Sharrow Marking
Oak / Broderick
30 mph
28-30k Right 188 24 AM 12'9" - 90 48% 30% 79%
Mixing Zone with Green
Skip Coloring
Fell / Baker
30 mph
28-30k Left 226 48 PM 12'3" - 100 49% - 84%

Monsere, Foster, Dill, and McNeil 17
CONCLUSIONS 1
This paper presented the comprehensive evaluation of intersection designs for protected bicycle lanes. 2
Information was gathered from a total of 78 hours of video in which 6,082 bicyclists and 7,574 turning 3
vehicles were observed. Self-reported comprehension was taken from the 1,245 resident responses to the 4
survey and the 690 of bicyclists who responded to the survey. Based on these observations and analysis, 5
the following conclusions are drawn: 6
For the turning zones, the design using the through bike lane (TBL) works well for its intended 7
purpose. The TBLs help position cyclists and reduce confusion compared to sharrows in mixing 8
zones. The design in Washington D.C. (where vehicles have a limited entry into the turning lane) 9
had high correct lane use by turning vehicles (87%) and by through bicyclists (91%). This 10
suggests a clear benefit of the restricted entry approach and creating a semi-protected through 11
bicycle lane. 12
For the mixing zones, evaluation of the video found that in the Mixing Zone with Yield Markings 13
design in Portland, OR (generally following the NACTO Design Guidance) nearly all (93%) of 14
the turning vehicles used the lane as intended—the highest compliance of any design. However, 15
only 63% of observed bicycles correctly used the mixing zone when a car was present (they chose 16
to go around vehicle in the buffer space to left). This is not necessarily a critical issue and 17
hatching this space may change this observed behavior. However, the observed behavior does 18
suggest a preference of giving cyclists space with a TBL. 19
When comparing the turning and mixing zone intersection designs, the video revealed that a low 20
of 1% to a high of 18% of the turning vehicles at mixing zones actually turned from the wrong 21
lane. The high incorrect rate was at the Mixing Zone with Green Coloring at Fell and Baker in 22
San Francisco, which has since been removed and replaced with another design. The Mixing Zone 23
with Yield Markings design in Portland and the Turning Zone with Post-Restricted Entry and TBL 24
in Washington, D.C. had the fewest vehicles observed turning from the wrong lanes (2% and 1% 25
respectively) indicating that clear marking, including vertical delineation, of the vehicle entry 26
point to the turning lane is beneficial. 27
Cyclist perception of safety appears to be more heavily influenced by the volume of turning 28
motor vehicle traffic than correct turning movements of motorists at these locations. It is also 29
possible that the turning zones are making cyclists feel less safe because of the requirement that 30
they cross the turn lane to enter the through bike lane, whereas with the mixing zone, the onus on 31
merging is more evening split between bicyclist and motorist. 32
There are some clear limitations to this evaluation. There are significant variations in the designs, 33
turning vehicles, and though bicycle volumes. The designs were chosen based on these inputs and it is 34
difficult to speculate how well the same design would function at higher or lower volumes. These 35
thresholds are information that designers are seeking. As more facilities are installed, future research 36
could evaluate a design across various volume thresholds. User behaviors are likely to be different 37
merging/turning left or right but the sample of designs is too small to make many observations about this 38
difference. A complete comparison of the self-reported design comprehensions could not be done because 39
we did not include these questions in Washington D.C. (the first survey conducted). We also mixed the 40
perceptions of bicyclist and resident perceptions of driving behavior. In our opinion, this is not as critical 41
since we rely more heavily on the observed behaviors for our conclusions. The vast majority of conflicts 42
in analysis are very minor. Compounded by the limitations described above, it is difficult to draw much 43

Monsere, Foster, Dill, and McNeil 18
conclusion from the conflict analysis. Importantly, no collisions or significant conflicts were observed. 1
Future work to evaluate the designs should include actual crash data. The most likely benefit will come 2
from comparing intersections designs on protected bikeways to traditional bike lanes at intersections. 3
ACKNOWLEDGEMENTS 4
This research was funded by the National Institute for Transportation and Communities (NITC), a U.S. 5
Department of Transportation university transportation center, People for Bikes (formerly Bikes Belong) 6
and the Summit Foundation. Joe Gilpin, Matt Berkow and Jamie Parks reviewed and commented on this 7
work as part of the project team. These individuals provided data, design plans, conducted numerous 8
reviews, and hosted our field visits: Mike Amsden (CDOT), David Smith (CDOT), Jim Sebastian 9
(DDOT), Mike Goodno (DDOT), Roger Geller (PBOT), Rob Burchfield (PBOT), Ross Swanson 10
(PBOT), Wendy Cawley (PBOT), Lindsay Walker (Lloyd District TMA), Seleta Reynolds (SFMTA), 11
Miriam Sorell (SFMTA), Annick Beaudet (Austin), Nathan Wilkes (Austin), Aleksiina Chapman 12
(Austin). We acknowledge the efforts of the following Portland State University Students who assisted in 13
survey mailing and video processing: Chase Ballew, Dan Stumpf, Dan Mercer, Lisa Okimoto, Allison 14
Duncan, and Belinda Judelman. Finally, thanks to anonymous peer reviewers who provided immensely 15
helpful insights and corrections to the original research report (including suggesting the term “turning 16
zone,” which we adopted). We also acknowledge the reviewers of this paper. 17
REFERENCES 18
1. Lusk, A.C., P.G. Furth, P. Morency, L.F. Miranda-Moreno, W.C. Willett, and J.T. Dennerlein. 19
Risk of Injury for Bicycling on Cycle Tracks Versus in the Street, Injury Prevention. Vol. 17, 20
2011, pp. 131. 21
2. Lusk, A.C., P. Morency, L.F. Miranda-Moreno, W.C. Willett, and J.T. Dennerlein. Bicycle 22
Guidelines and Crash Raters on Cycle Tracks in the United States. American Journal of Public 23
Health. Vol. 107, No. 7, 2013, pp. 1240-1248. 24
3. Harris, M.A., C.C.O. Reynolds, M. Winters, P.A. Cripton, H. Shen, M.L. Chipman, M.D. 25
Cusimano, S. Babul, J.R. Brubacker, S.M. Friedman, G. Hunte, M. Munro, L. Vernich, K. 26
Teschke. Comparing the effects of infrastructure on bicycling injury at intersections and non-27
intersections using a case–crossover design. Injury Prevention, Vol. 19, No. 5, 2013, pp. 303-28
310. 29
4. Thomas, B., DeRobertis, M., 2013. The safety of urban cycle tracks: A review of the literature. 30
Accident Analysis & Prevention 52, 219–227. doi:10.1016/j.aap.2012.12.017 31
5. Jensen, S.U. Bicycle Tracks and Lanes: A Before-After study. Presented at the 87th Annual 32
Meeting of the Transportation Research Board, Washington, D.C., 2008. 33
6. Hunter, W.W., Srinivasan, R., and Martell, C.A. (2008). Evaluation of a Green Bike Lane 34
Weaving Area in St. Petersburg, Florida. Tallahassee, FL: Florida Department of Transportation. 35
7. Monsere, C., J. Dill, N. McNeil, K. Clifton, N. Foster, and T. Goddard. Lessons from the Green 36
Lanes: Evaluating Protected Bike Lanes in the U.S. National Institute for Transportation and 37
Communities, Portland, OR, 2014. 38
8. Urban Bikeway Design Guide. National Association of City Transportation Officials, New York. 39
http://nacto.org/cities-for-cycling/design-guide/. Accessed July 2014. 40
9. Dill, J. C. Monsere, N. McNeil. “Evaluation of Bike Boxes at Signalized Intersections. Accident 41
Analysis and Prevention, Special Issue from International Conference on Safety and Mobility of 42
Vulnerable Road Users: Pedestrians, Motorcyclists and Bicyclists. Accident Analysis and 43
Prevention. doi:10.1016/j.aap.2010.10.030 | 44
10. Allen, D., S. Bygrave, and H. Harper. 2005. Behavior at Cycle Advanced Stop Lines Report No. 45
PPR240. London, UK: Transport for London, London Road Safety Unit. 46

Monsere, Foster, Dill, and McNeil 19
11. Atkins Services, 2005. Advanced Stop Line Variations, Research Study Report No. 503 1271. 1
London: Transport for London. 2
12. Hunter, W. W., D. L. Harkey, J.R. Stewart, and M.L. Birk. 2000. Evaluation of Blue Bike-Lane 3
Treatment in Portland, Oregon. Transportation Research Record, 1705: 107-115 4