Embed Size (px)
Citation preview
User Case Study: How Much
Information? “Big Data”
Research Findings for Enterprise
and Consumer Information
James Short, Roger Bohn and Chaitan Baru
UC San Diego, San Diego Supercomputer Center
Thursday, April 7 11:15 - Noon
What is HMI?• A research program at UCSD and SDSC
• Our goal: create a census of the World’s
information
– How much is there?
– Of what types?
– How is it created and where does it go?
• Measuring data and information
– Inexact science
– Assumptions and methods key
3
Our Agenda This Morning
• Review HMI’s Greatest Hits
– Consumer Information Report
– (new) Enterprise Server Report
• Including:– A new way to measure server activity that aggregates capacity
over very different kinds of servers, using a common metric
– New data on price/performance across different benchmarks and server classes
– Review and discuss alternative views of server load types and load factors
– Identify methods for defining and measuring data and information value
• Ongoing and Future Research
4
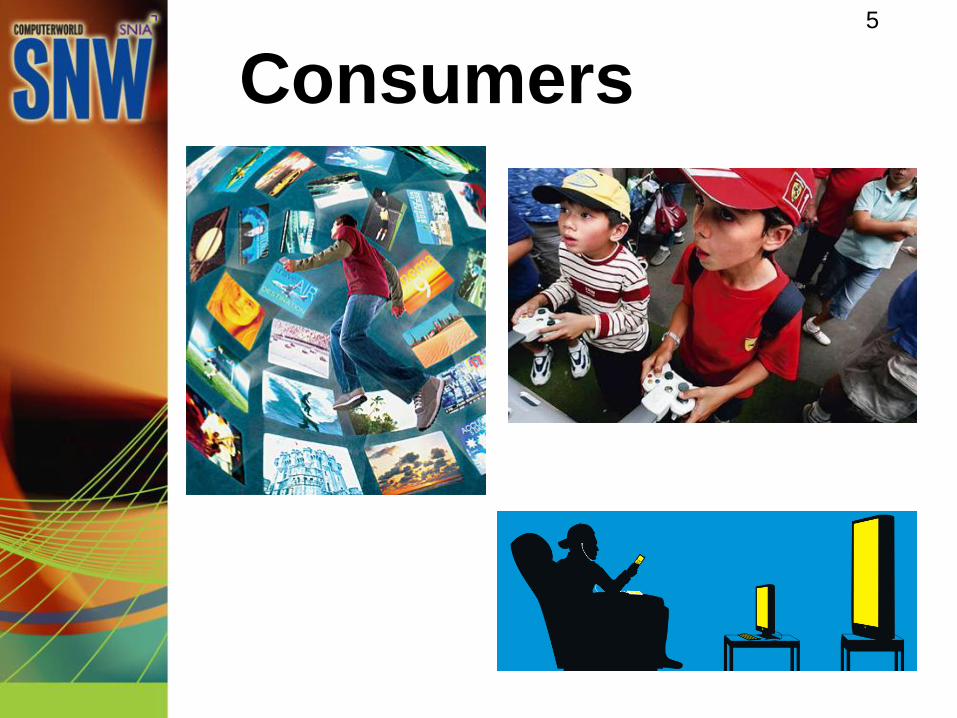
Consumers5
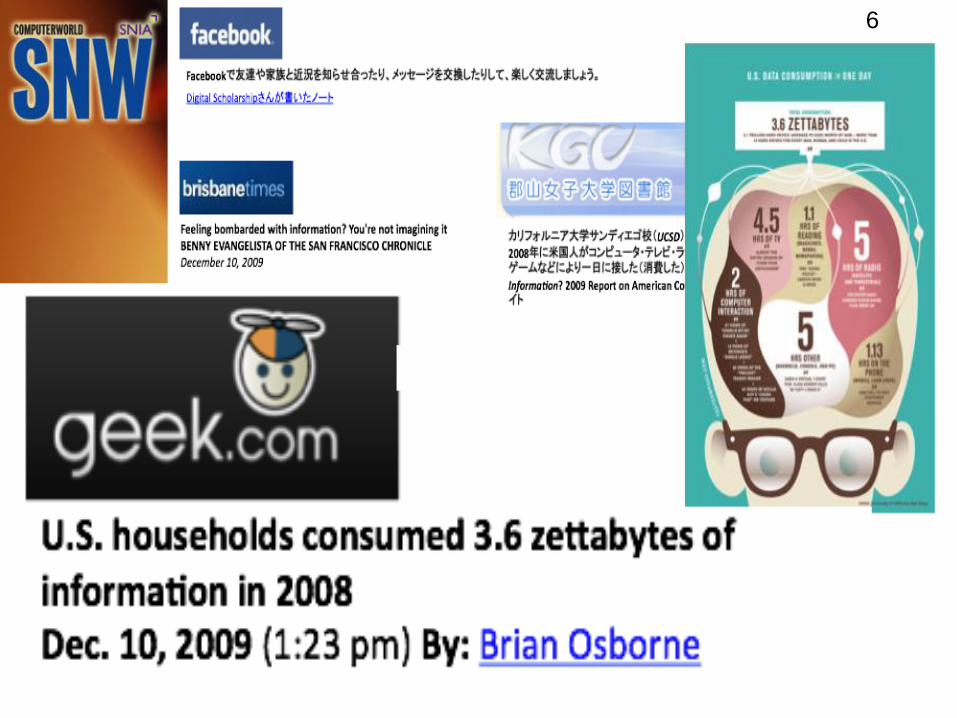
6
6
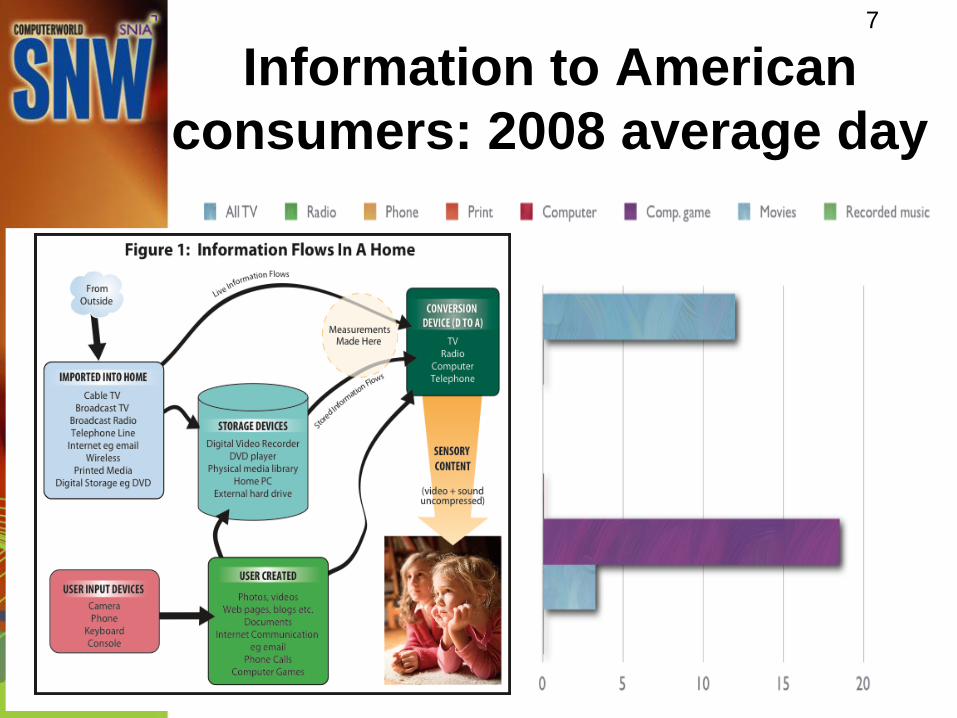
Information to American
consumers: 2008 average day
7
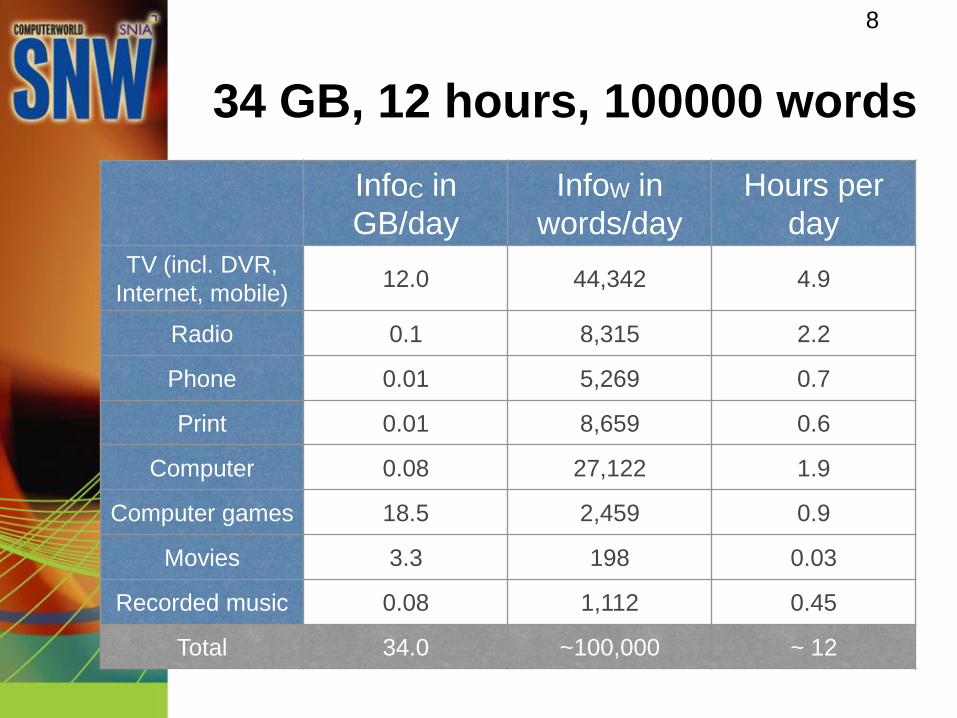
34 GB, 12 hours, 100000 words
InfoC in
GB/day
InfoW in
words/day
Hours per
day
TV (incl. DVR,
Internet, mobile)12.0 44,342 4.9
Radio 0.1 8,315 2.2
Phone 0.01 5,269 0.7
Print 0.01 8,659 0.6
Computer 0.08 27,122 1.9
Computer games 18.5 2,459 0.9
Movies 3.3 198 0.03
Recorded music 0.08 1,112 0.45
Total 34.0 ~100,000 ~ 12
8
9
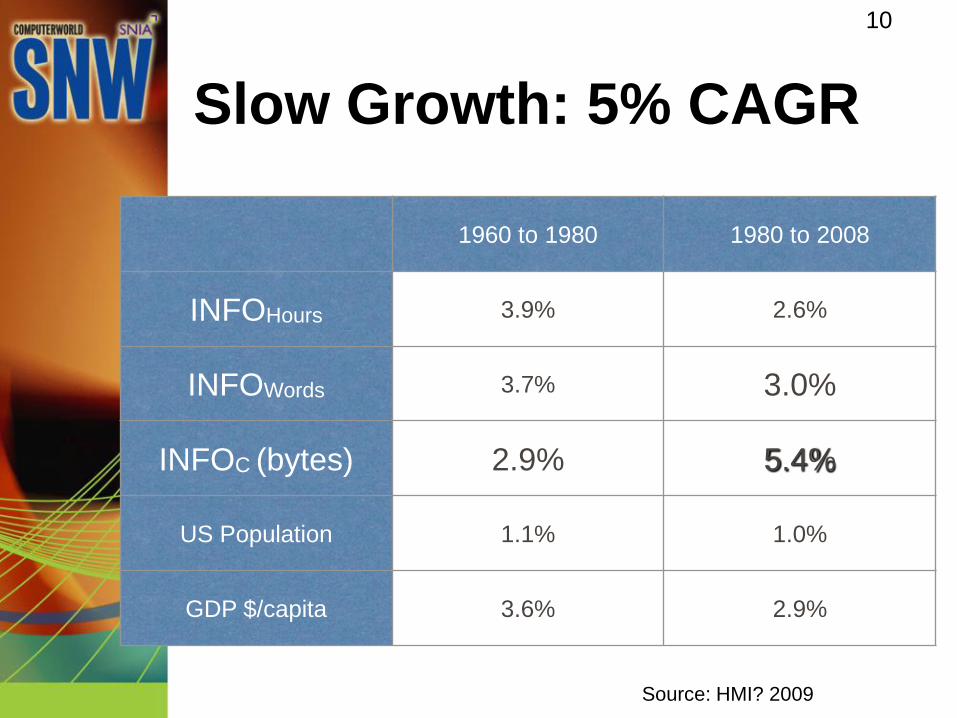
Slow Growth: 5% CAGR
1960 to 1980 1980 to 2008
INFOHours 3.9% 2.6%
INFOWords 3.7% 3.0%
INFOC (bytes) 2.9% 5.4%
US Population 1.1% 1.0%
GDP $/capita 3.6% 2.9%
Source: HMI? 2009
10
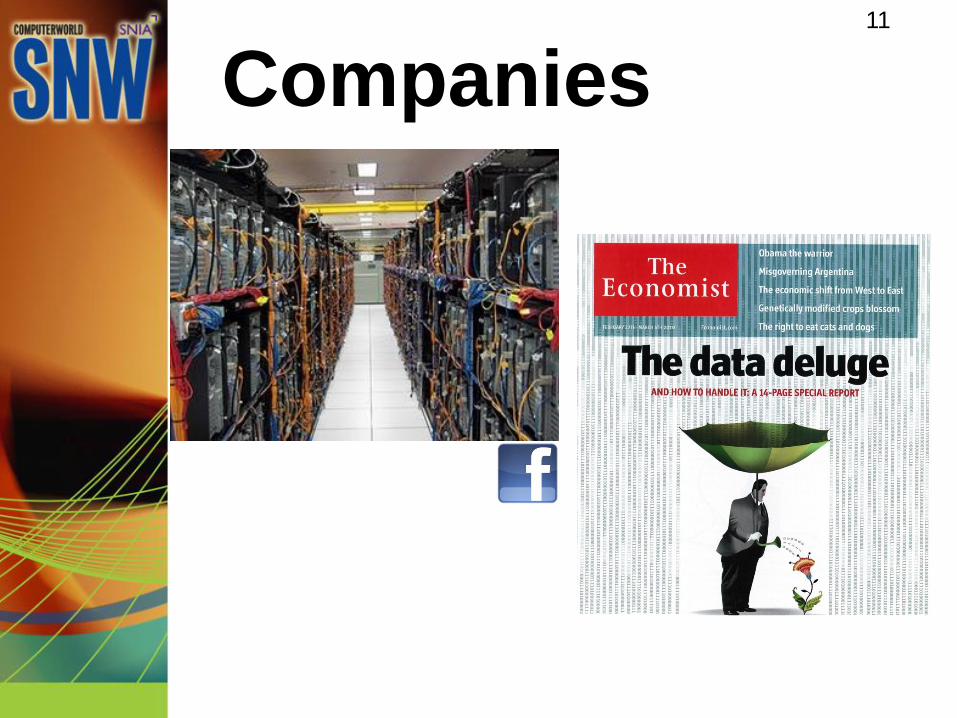
Companies11
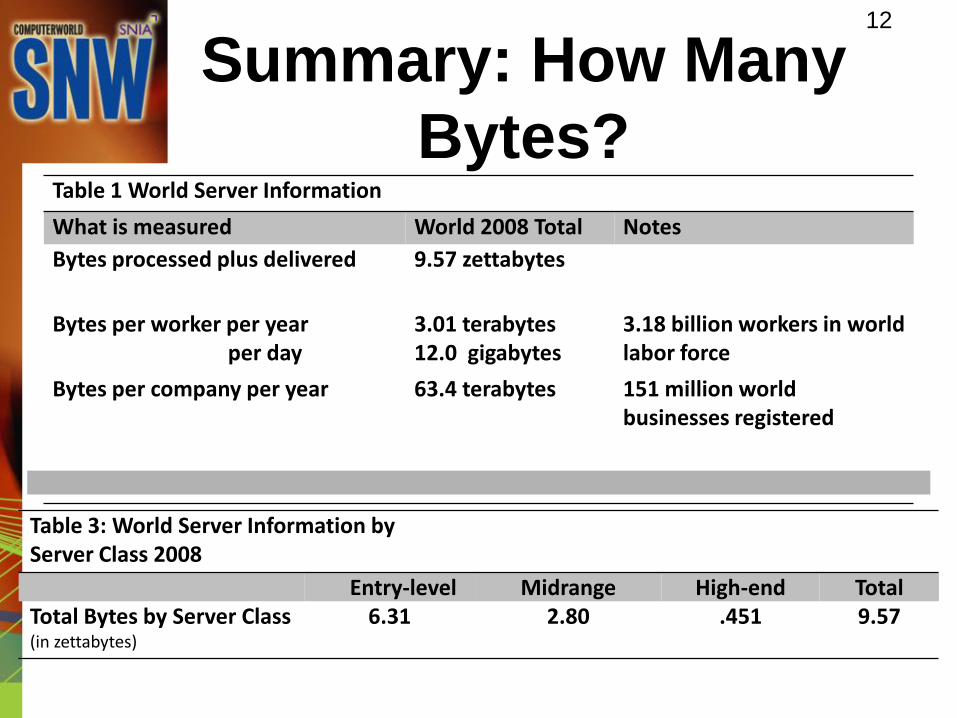
Summary: How Many
Bytes?Table 1 World Server Information
What is measured World 2008 Total Notes
Bytes processed plus delivered 9.57 zettabytes
Bytes per worker per yearper day
3.01 terabytes12.0 gigabytes
3.18 billion workers in world labor force
Bytes per company per year 63.4 terabytes 151 million world businesses registered
Table 3: World Server Information by Server Class 2008
Entry-level Midrange High-end TotalTotal Bytes by Server Class 6.31 2.80 .451 9.57(in zettabytes)
12
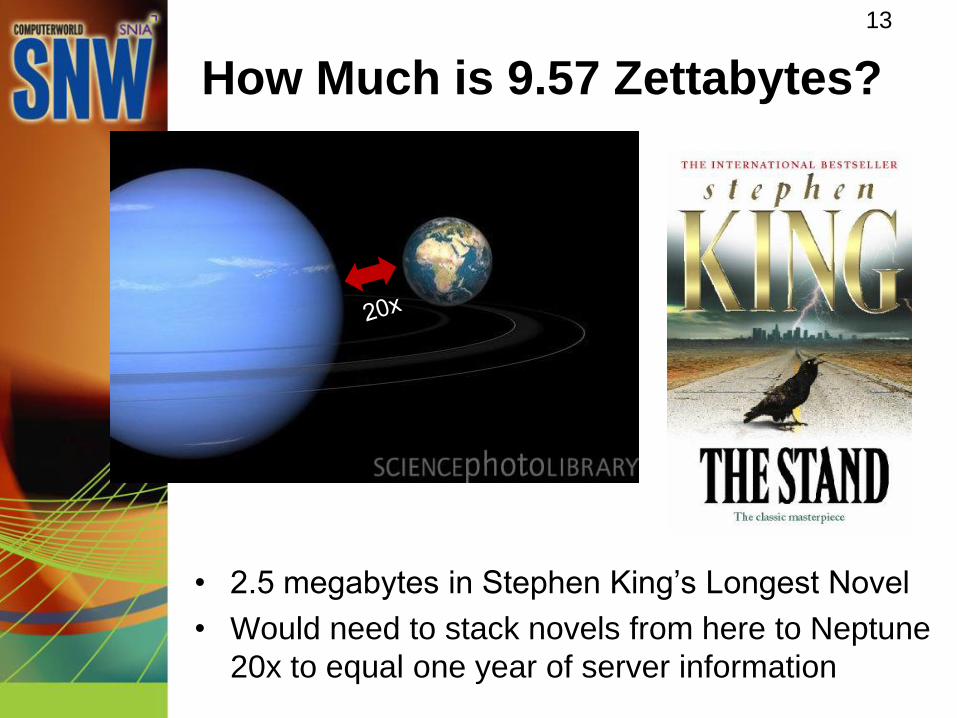
How Much is 9.57 Zettabytes?
• 2.5 megabytes in Stephen King’s Longest Novel
• Would need to stack novels from here to Neptune
20x to equal one year of server information
13
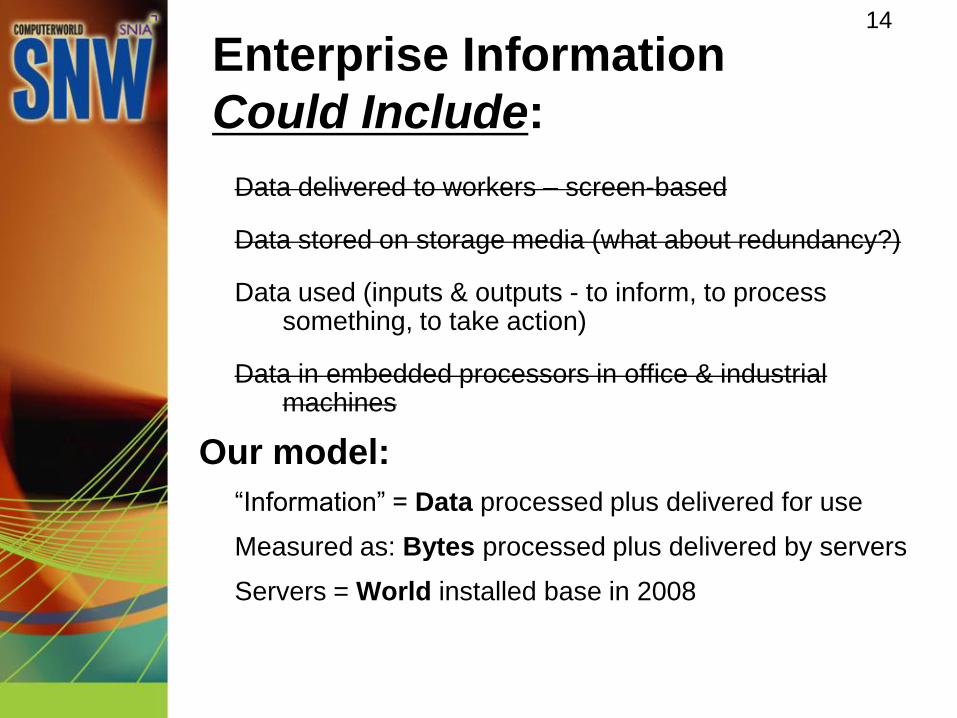
Enterprise Information
Could Include:
Data delivered to workers – screen-based
Data stored on storage media (what about redundancy?)
Data used (inputs & outputs - to inform, to process something, to take action)
Data in embedded processors in office & industrial machines
Our model:
“Information” = Data processed plus delivered for use
Measured as: Bytes processed plus delivered by servers
Servers = World installed base in 2008
14
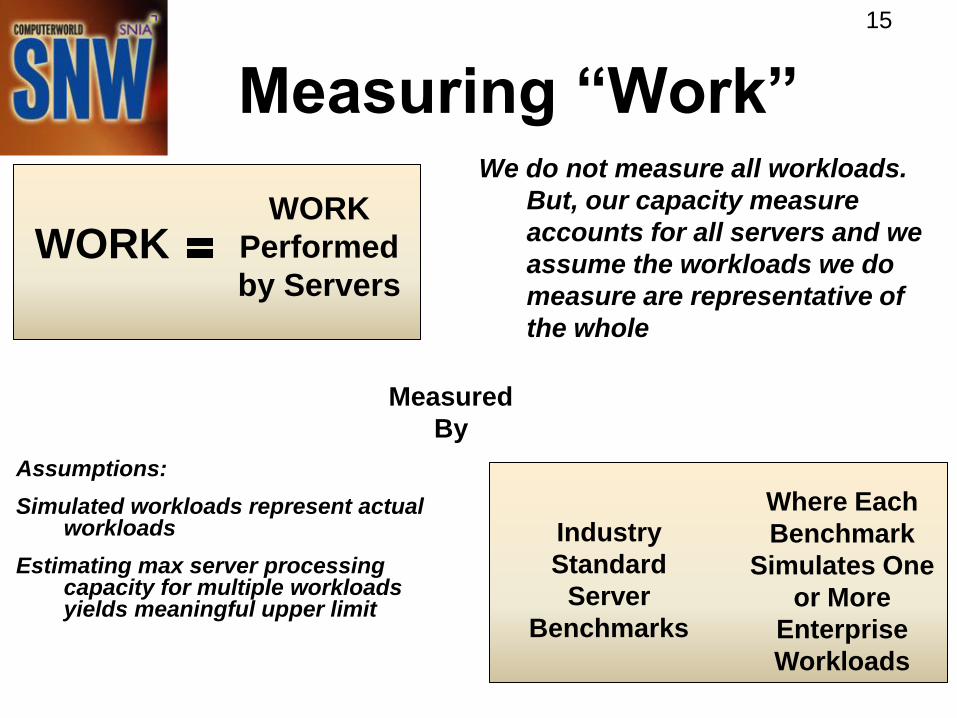
Measuring “Work”
Assumptions:
Simulated workloads represent actual workloads
Estimating max server processing capacity for multiple workloads yields meaningful upper limit
WORKWORK
Performed
by Servers
Measured
By
Industry
Standard
Server
Benchmarks
Where Each
Benchmark
Simulates One
or More
Enterprise
Workloads
We do not measure all workloads.
But, our capacity measure
accounts for all servers and we
assume the workloads we do
measure are representative of
the whole
15
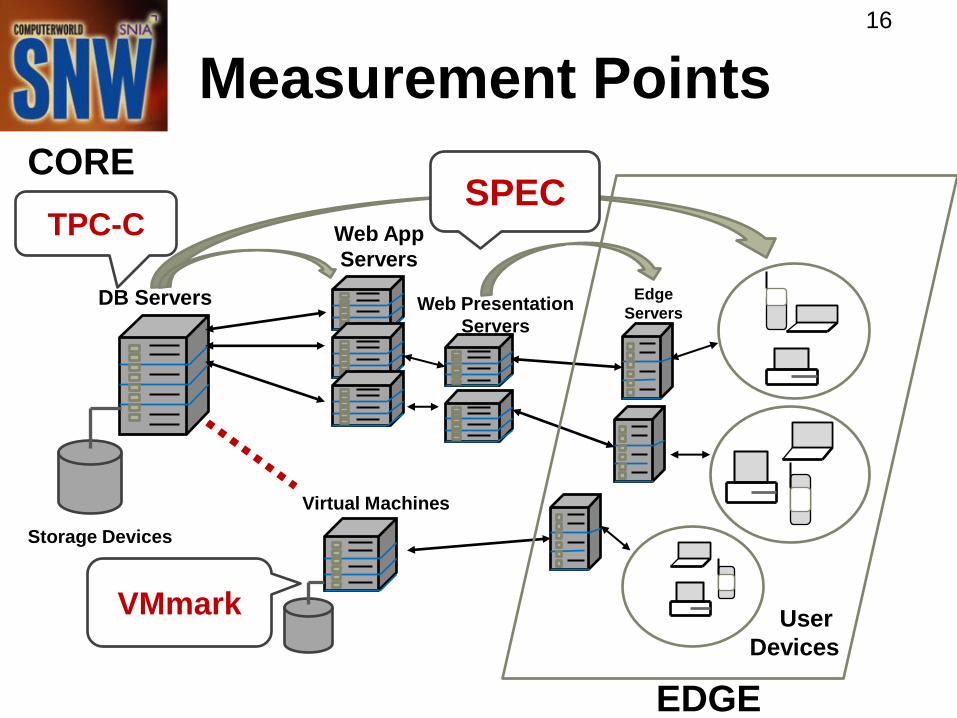
Measurement Points
DB Servers
Web App
Servers
Web Presentation
Servers
Edge
Servers
Storage Devices
User
Devices
Virtual Machines
SPEC
VMmark
TPC-C
EDGE
CORE
16
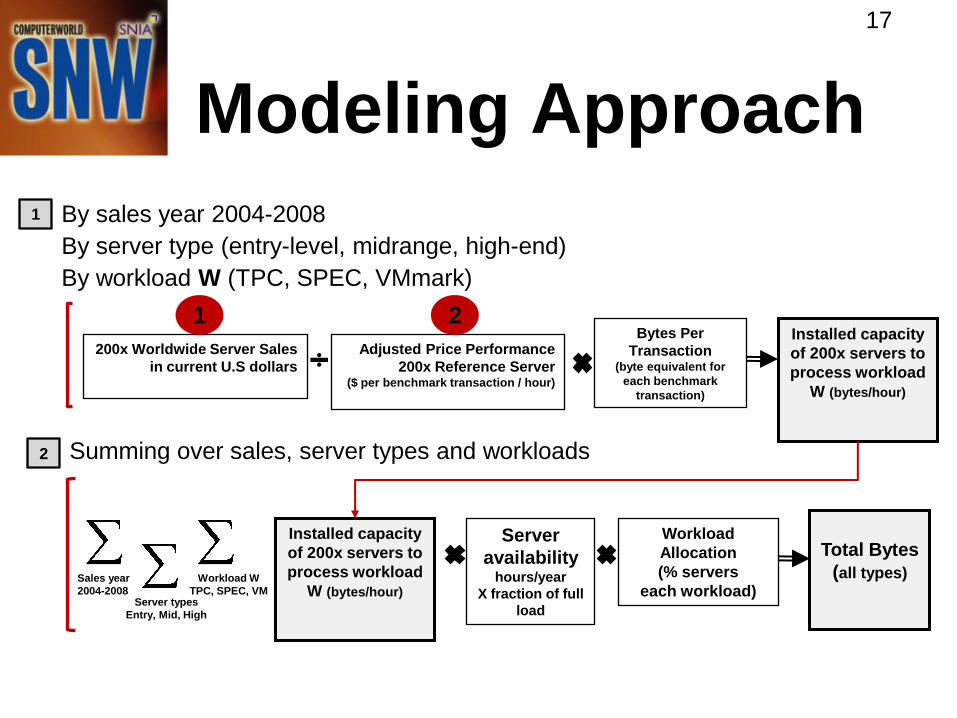
Modeling Approach
Adjusted Price Performance
200x Reference Server($ per benchmark transaction / hour)
200x Worldwide Server Sales
in current U.S dollars
By server type (entry-level, midrange, high-end)
By workload W (TPC, SPEC, VMmark)
1
2
Workload
Allocation
(% servers
each workload)
Bytes Per
Transaction(byte equivalent for
each benchmark
transaction)
Total Bytes
(all types)
Server
availability hours/year
X fraction of full
load
By sales year 2004-2008
Installed capacity
of 200x servers to
process workload
W (bytes/hour)
Installed capacity
of 200x servers to
process workload
W (bytes/hour)Sales year
2004-2008
Workload W
TPC, SPEC, VMServer types
Entry, Mid, High
Summing over sales, server types and workloads
1 2
17
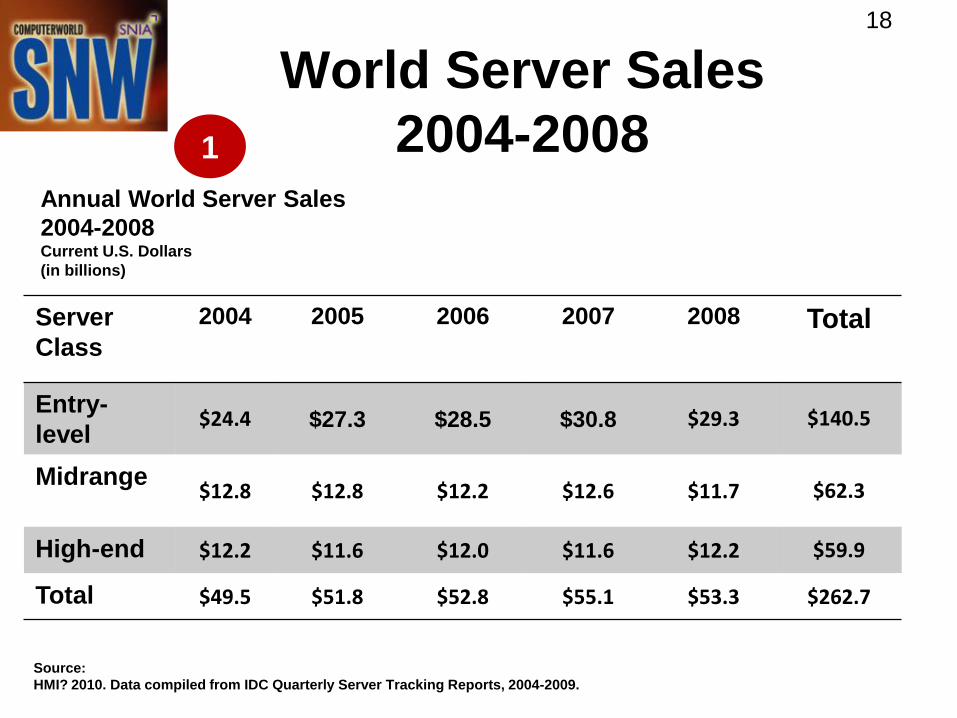
World Server Sales
2004-2008
Server
Class
2004 2005 2006 2007 2008 Total
Entry-
level$24.4 $27.3 $28.5 $30.8 $29.3 $140.5
Midrange$12.8 $12.8 $12.2 $12.6 $11.7 $62.3
High-end $12.2 $11.6 $12.0 $11.6 $12.2 $59.9
Total $49.5 $51.8 $52.8 $55.1 $53.3 $262.7
Annual World Server Sales
2004-2008Current U.S. Dollars
(in billions)
Source:
HMI? 2010. Data compiled from IDC Quarterly Server Tracking Reports, 2004-2009.
18
1
COST ANALYSIS
• We used the detailed TPC-C pricing sheets
to break down the costs of the System Under
Test (SUT) into the cost of the Server
Hardware and other components
• To accord with our server sales numbers, we
recalculated price performance using only
the costs of the server hardware (current
dollars)
• Further cost performance (storage, network)
analyses are possible and planned
2
19
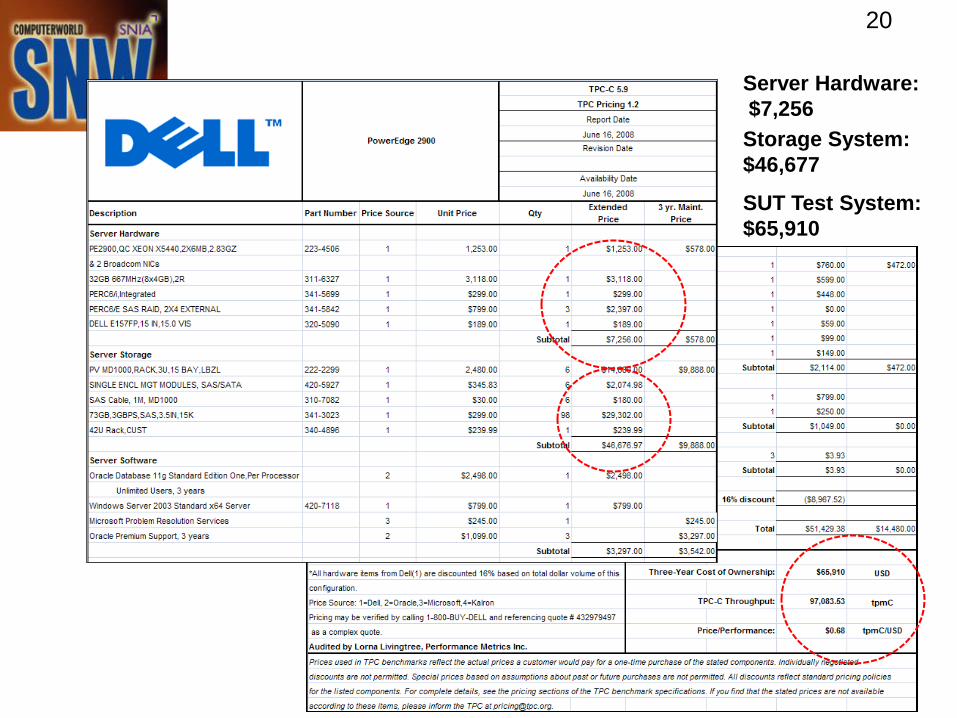
Server Hardware:
$7,256
SUT Test System:
$65,910
Storage System:
$46,677
20
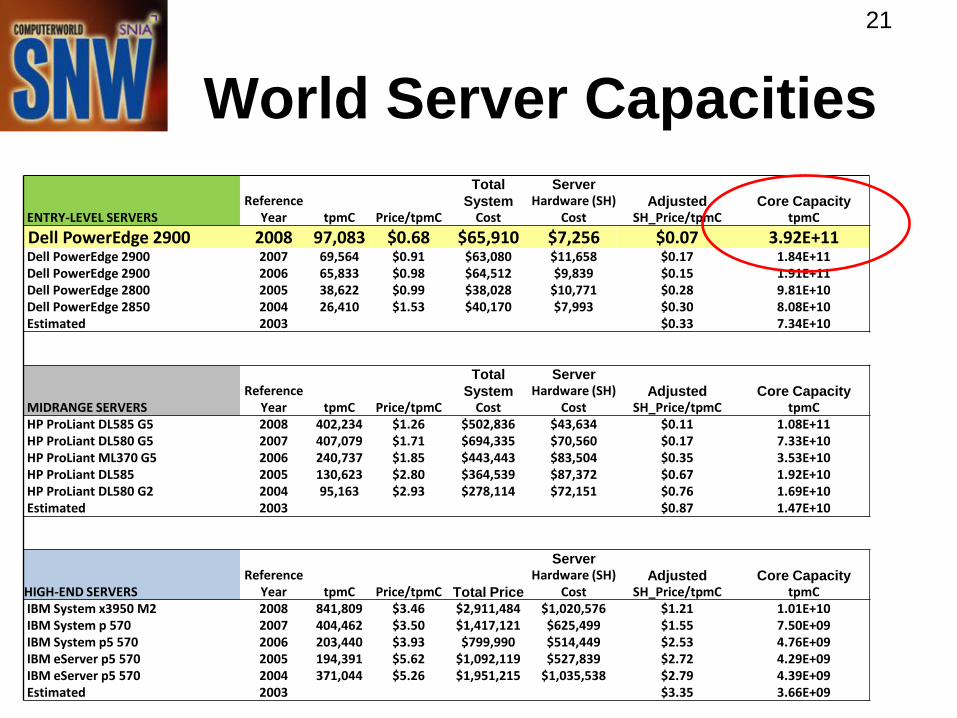
World Server Capacities
21
ENTRY-LEVEL SERVERSReference
Year tpmC Price/tpmC
Total
SystemCost
ServerHardware (SH)
CostAdjusted
SH_Price/tpmCCore Capacity
tpmC
Dell PowerEdge 2900 2008 97,083 $0.68 $65,910 $7,256 $0.07 3.92E+11Dell PowerEdge 2900 2007 69,564 $0.91 $63,080 $11,658 $0.17 1.84E+11Dell PowerEdge 2900 2006 65,833 $0.98 $64,512 $9,839 $0.15 1.91E+11Dell PowerEdge 2800 2005 38,622 $0.99 $38,028 $10,771 $0.28 9.81E+10Dell PowerEdge 2850 2004 26,410 $1.53 $40,170 $7,993 $0.30 8.08E+10Estimated 2003 $0.33 7.34E+10
MIDRANGE SERVERSReference
Year tpmC Price/tpmC
Total
SystemCost
ServerHardware (SH)
CostAdjusted
SH_Price/tpmCCore Capacity
tpmCHP ProLiant DL585 G5 2008 402,234 $1.26 $502,836 $43,634 $0.11 1.08E+11HP ProLiant DL580 G5 2007 407,079 $1.71 $694,335 $70,560 $0.17 7.33E+10HP ProLiant ML370 G5 2006 240,737 $1.85 $443,443 $83,504 $0.35 3.53E+10HP ProLiant DL585 2005 130,623 $2.80 $364,539 $87,372 $0.67 1.92E+10HP ProLiant DL580 G2 2004 95,163 $2.93 $278,114 $72,151 $0.76 1.69E+10Estimated 2003 $0.87 1.47E+10
HIGH-END SERVERSReference
Year tpmC Price/tpmC Total Price
ServerHardware (SH)
CostAdjusted
SH_Price/tpmCCore Capacity
tpmCIBM System x3950 M2 2008 841,809 $3.46 $2,911,484 $1,020,576 $1.21 1.01E+10IBM System p 570 2007 404,462 $3.50 $1,417,121 $625,499 $1.55 7.50E+09IBM System p5 570 2006 203,440 $3.93 $799,990 $514,449 $2.53 4.76E+09IBM eServer p5 570 2005 194,391 $5.62 $1,092,119 $527,839 $2.72 4.29E+09IBM eServer p5 570 2004 371,044 $5.26 $1,951,215 $1,035,538 $2.79 4.39E+09Estimated 2003 $3.35 3.66E+09
New Way To Measure
Capacity
• Aggregate capacity over very different
kinds of servers
• Assume companies spend dollars for
server capacity efficiently
• Measure capital cost per unit of
benchmarked performance
• Then we translate different benchmarks
into a common unit: bytes
22
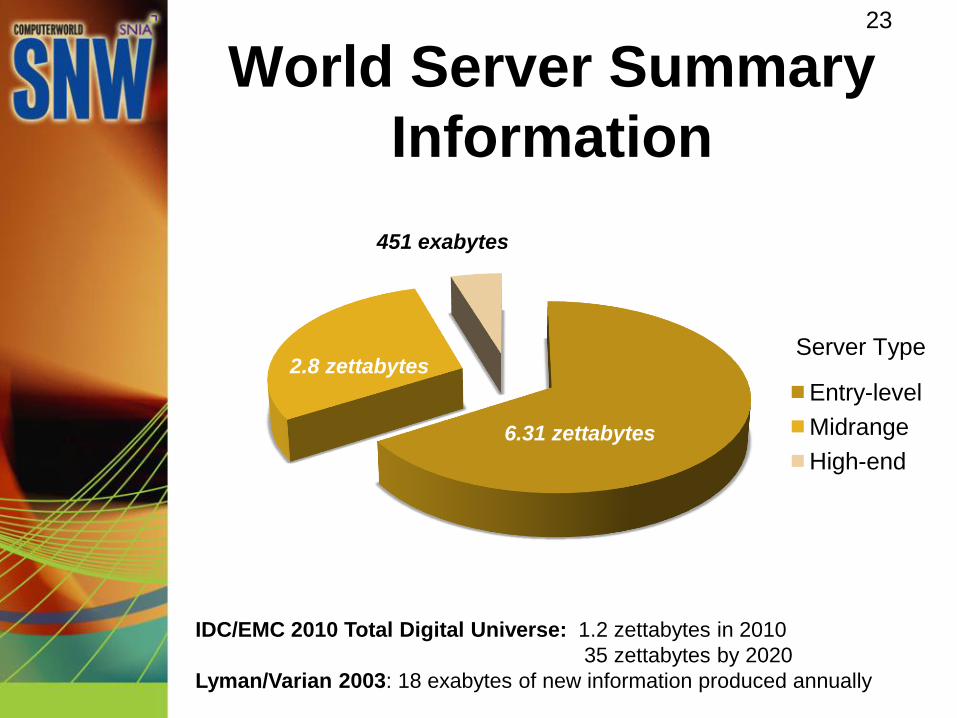
World Server Summary
Information
23
Entry-level
Midrange
High-end
Server Type
6.31 zettabytes
2.8 zettabytes
451 exabytes
IDC/EMC 2010 Total Digital Universe: 1.2 zettabytes in 2010
35 zettabytes by 2020
Lyman/Varian 2003: 18 exabytes of new information produced annually
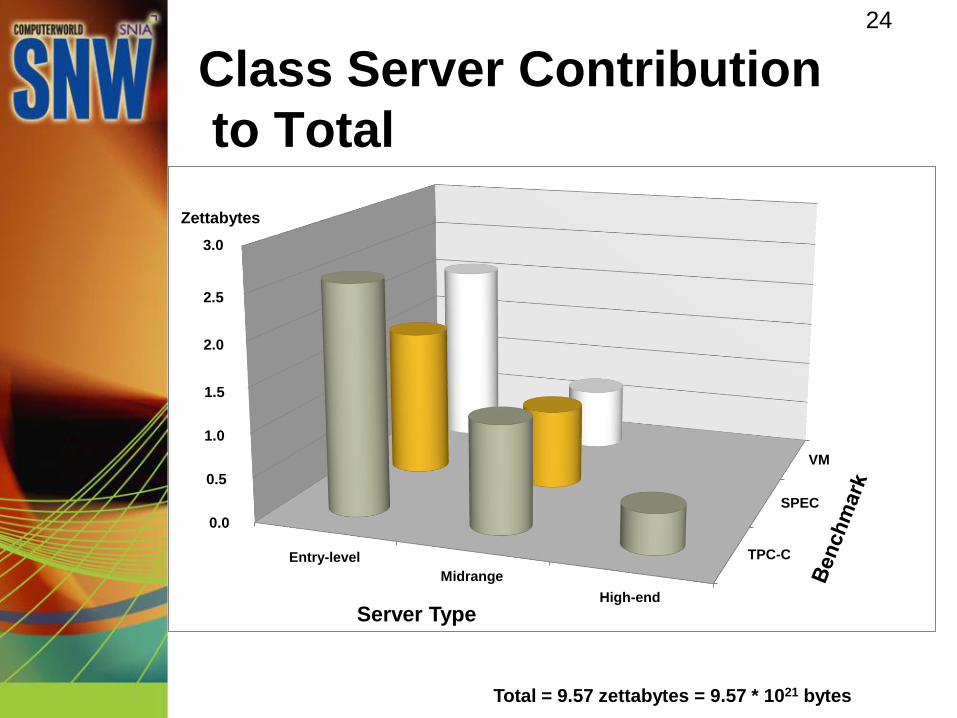
Class Server Contribution
to Total
24
TPC-C
SPEC
VM
Entry-level
Midrange
High-end
3.0
2.5
1.5
2.0
1.0
0.5
0.0
Server Type
Total = 9.57 zettabytes = 9.57 * 1021 bytes
Zettabytes
Discussion and
Implications
• Results expressed in capacity per dollar
(not capacity per server)
• Data Intensive Computing Platforms
– Large memory systems
– Shared nothing platforms
– Database machines
• Ongoing and Future Research
– Center for Large Scale Data Systems Research
(CLDS)
25
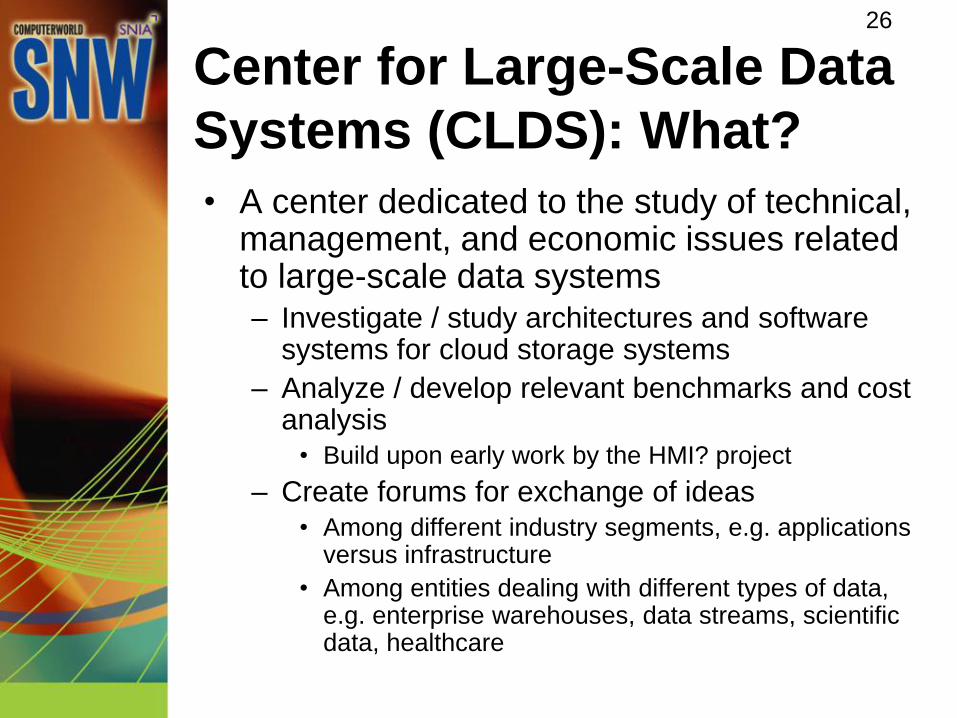
Center for Large-Scale Data
Systems (CLDS): What?
• A center dedicated to the study of technical, management, and economic issues related to large-scale data systems– Investigate / study architectures and software
systems for cloud storage systems
– Analyze / develop relevant benchmarks and cost analysis
• Build upon early work by the HMI? project
– Create forums for exchange of ideas
• Among different industry segments, e.g. applications versus infrastructure
• Among entities dealing with different types of data, e.g. enterprise warehouses, data streams, scientific data, healthcare
26
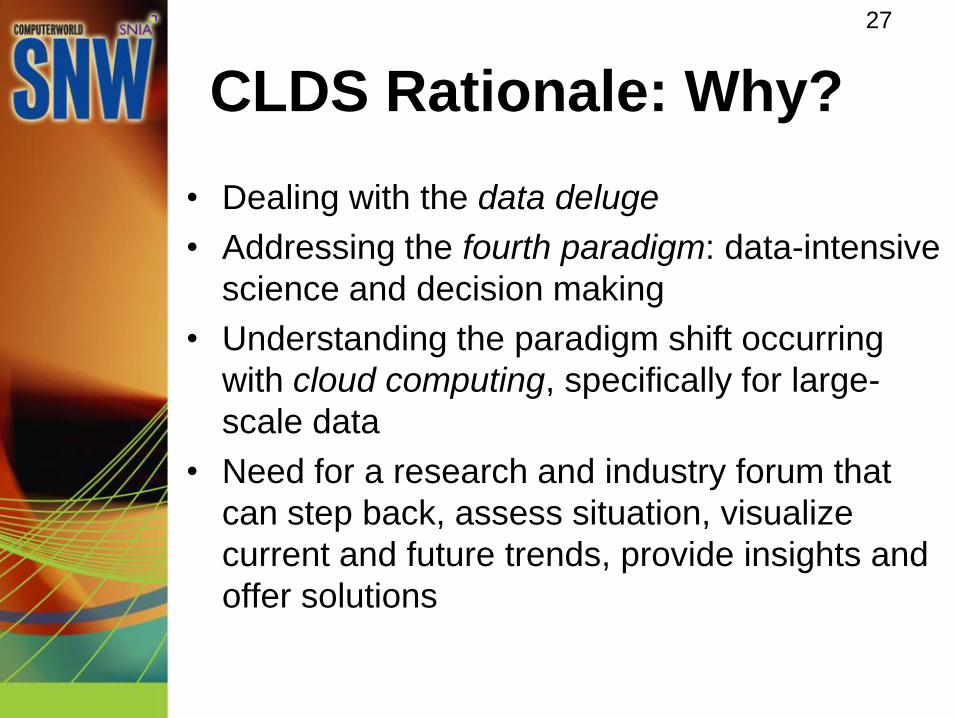
CLDS Rationale: Why?
• Dealing with the data deluge
• Addressing the fourth paradigm: data-intensive
science and decision making
• Understanding the paradigm shift occurring
with cloud computing, specifically for large-
scale data
• Need for a research and industry forum that
can step back, assess situation, visualize
current and future trends, provide insights and
offer solutions
27
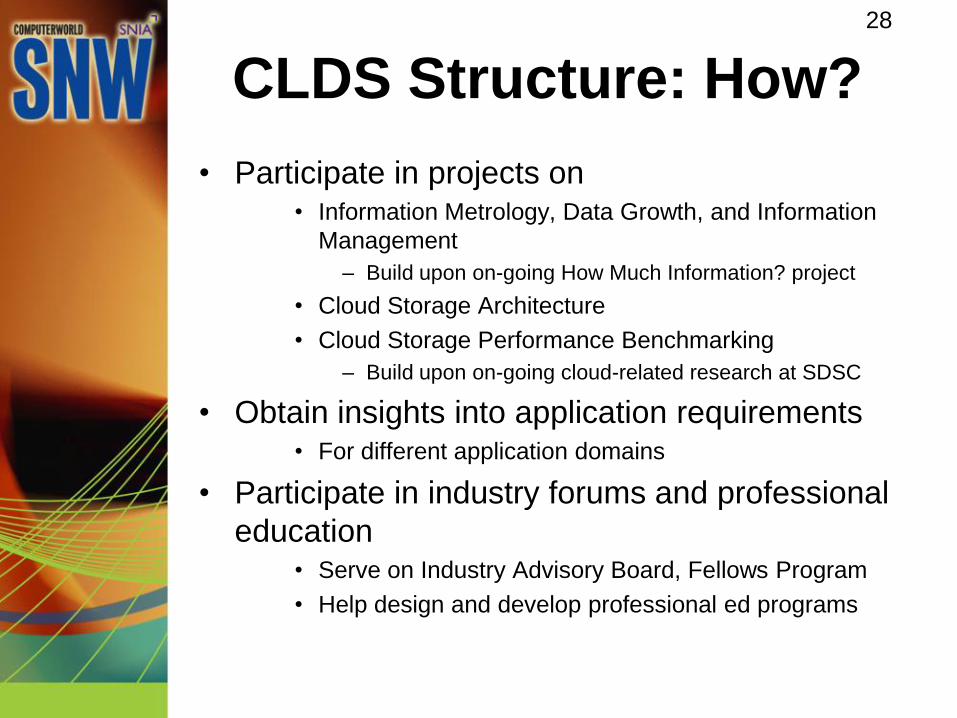
CLDS Structure: How?
• Participate in projects on • Information Metrology, Data Growth, and Information
Management
– Build upon on-going How Much Information? project
• Cloud Storage Architecture
• Cloud Storage Performance Benchmarking
– Build upon on-going cloud-related research at SDSC
• Obtain insights into application requirements • For different application domains
• Participate in industry forums and professional
education• Serve on Industry Advisory Board, Fellows Program
• Help design and develop professional ed programs
28
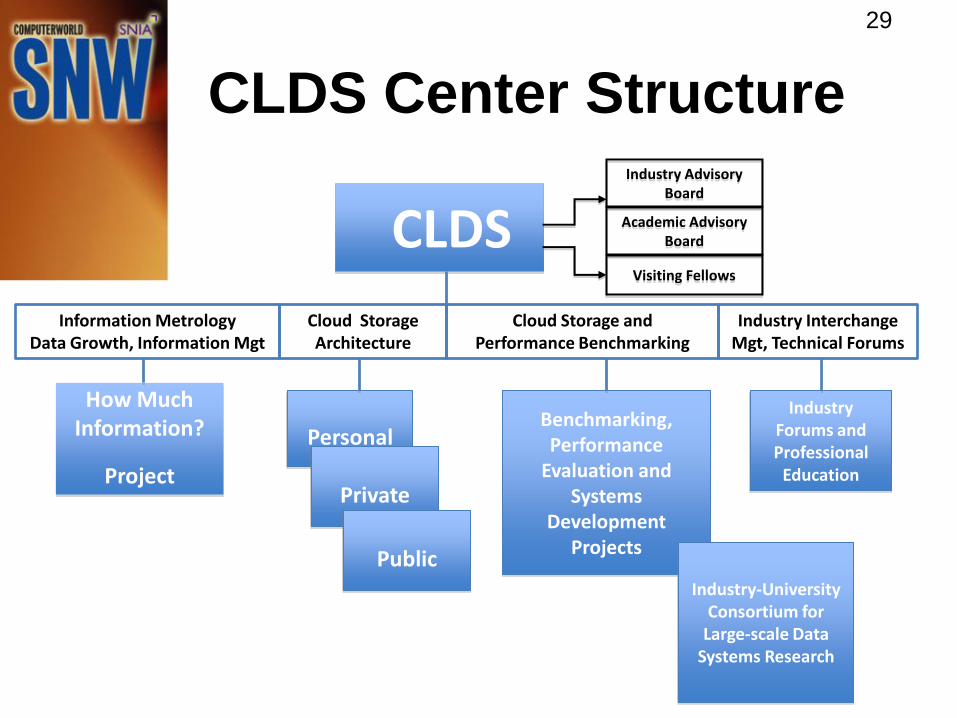
CLDS Center Structure
CLDSIndustry Advisory
Board
Academic Advisory Board
Benchmarking,Performance
Evaluation and Systems
Development Projects
Industry Forums and Professional
Education
Industry-University Consortium for
Large-scale Data Systems Research
How Much Information?
Project
Personal
29
Visiting Fellows
Information MetrologyData Growth, Information Mgt
Cloud StorageArchitecture
Cloud Storage andPerformance Benchmarking
Industry InterchangeMgt, Technical Forums
Private
Public
Example CLDS Projects• HMI?: How Much Information?
– HMI Consumer, HMI Enterprise reports
– HMI enterprise server study – adding storage and network
– HMI company projects• Data Mobility and Information Value
• CIO Interview Project: Managing the Challenges and Opportunities in “Big Data”
• Pilot Projects on Managing and Exploiting Information Value
• Cloud Storage Architecture, Benchmarking & Performance– Management and technical systems research on
personal, private, and public cloud storage architectures
– Cloud storage systems evaluation and performance benchmarking, including development and testing of new benchmarks
– Cloud storage capacity and performance evaluation by industry vertical and by enterprise workload
30
For More Information
• Chaitanya Baru [[email protected]]
• Jim Short [[email protected]]
Director, Industry Relations, SDSC
• Ron Hawkins [[email protected]]
31