Embed Size (px)
Citation preview
USER DESIGN OF CUSTOMIZED PRODUCTS
Taylor Randall David Eccles School of Business
University of Utah 1645 E Campus Center Dr. Salt Lake City, UT 84112
Christian Terwiesch The Wharton School
University of Pennsylvania 548 Huntsman Hall
Philadelphia, PA 19104 [email protected]
Karl T. Ulrich* The Wharton School
University of Pennsylvania 547 Huntsman Hall
Philadelphia, PA 19104 [email protected]
*corresponding author.
First Version: August 2003 This Version: December 2004
Abstract
User design offers tantalizing potential benefits to manufacturers and consumers, including a closer match of products to user preferences, which should result in a higher willingness to pay for goods and services. There are two fundamental approaches that can be taken to user design: parameter-based systems and needs-based systems. With parameter-based systems, users directly specify the values of design parameters of the product. With needs-based systems, users specify the relative importance of their needs, and an optimization algorithm recommends the combination of design parameters that is likely to maximize user utility. Through an experiment in the domain of consumer laptop computers, we show that for parameter-based systems, outcomes, including measures for comfort and fit, increase in the expertise of the user. We also show that for novices, the needs-based interface results in better outcomes than the parameter-based interface.
Key words: user design, customization, mass customization, product variety, product design One sentence abstract: This paper reports on an experiment to compare needs-based and parameter-based systems for user design of customized products. Author biographies: Taylor Randall Christian Terwiesch is an Associate Professor of Operations and Information Management at The Wharton School of the University of Pennsylvania. His research on product development and supply chain management appears in many of the leading academic journals, including Management Science, Operations Research, Organization Science, and the Journal of Product

1
Innovation Management. He is also active on various editorial boards for journals such as Management Science, Decision Sciences, Production and Operations Management, and IEEE Transactions. Terwiesch has researched with and consulted for various organizations, including a project on concurrent engineering for BMW, supply chain management for Intel and Medtronic, R&D pipeline management for Merck, and operations improvements for several large hospitals. He is the co-author of a new book Matching Supply with Demand, a widely used textbook in Operations Management. He is also the author of numerous teaching cases, most of which are available via the Epodia teaching network, which Terwiesch co-founded. Professor Terwiesch holds a PhD from Insead and a Masters in Business and Information Technology from the University of Mannheim, Germany. Karl Ulrich is Professor of Operations and Information Management Department at the Wharton School of the University of Pennsylvania. Ulrich is the faculty director of the Weiss Tech House, an incubator for fostering student innovation. His work has been published in, among other journals, Management Science, Marketing Science, Sloan Management Review, Research Policy, and ASME Journal of Mechanical Design. He is the co-author of Product Design and Development (McGraw-Hill, 3rd Edition, 2004), the leading graduate textbook on the subject. Professor Ulrich has been a member of development teams for over 30 new products or processes, including medical devices, tools, computer peripherals, food products, and sporting goods. As a result of this development work, he has been granted 18 patents. From 1999-2002, while on leave from Wharton, Ulrich founded and managed Nova Cruz Products, a manufacturer of high-performance personal transportation products including the Xootr scooter. Ulrich is also a founder of Epodia, the open network for higher-education teaching materials and Benven, a consumer marketer of environmental offsets. Professor Ulrich holds bachelors, masters, and doctoral degrees in mechanical engineering from the Massachusetts Institute of Technology.
Acknowledgments We acknowledge the substantial contributions of Rachel Nation, Gabe Silvasi, Johnny Lee, Martha Eining, Chetan Salian, Noah Springer, Ryan Sundquist, and Matthias Kellmer. We would also like to thank Dell Computer. The comments of three anonymous reviewers are greatly appreciated.
2
USER DESIGN OF CUSTOMIZED PRODUCTS
Abstract
User design offers tantalizing potential benefits to manufacturers and consumers, including a closer
match of products to user preferences, which should result in a higher willingness to pay for goods
and services. There are two fundamental approaches that can be taken to user design: parameter-
based systems and needs-based systems. With parameter-based systems, users directly specify the
values of design parameters of the product. With needs-based systems, users specify the relative
importance of their needs, and an optimization algorithm recommends the combination of design
parameters that is likely to maximize user utility. Through an experiment in the domain of
consumer laptop computers, we show that for parameter-based systems, outcomes, including
measures for comfort and fit, increase in the expertise of the user. We also show that for novices,
the needs-based interface results in better outcomes than the parameter-based interface.
3
1. Introduction
User design is a particular form of product customization that allows the user to specify the
properties of a product. Consider three examples. At Cmax.com, athletes can design a running shoe
to their specifications, selecting almost every element of the shoe from the material of the sole to
the color of the shoelace. General Mills experimented with an on-line service with which consumers
could design a customized breakfast cereal. Consumers can design a customized computer from
Dell using the company’s website. User design has emerged as a mechanism to build brand loyalty,
to fit products to the heterogeneous needs of a market, and to differentiate the offerings of a
manufacturer (Dahan and Hauser 2002, Wind and Rangaswamy 2001). The use of computing and
the internet in consumer decision making makes user design and customization particularly relevant
today (Winer et al. 1997).
User design is especially challenging if the user has little or no background in the underlying
technical domain. For example, a particular consumer might actually prefer a specific level of
computer gaming performance, e.g. at least 50 frames-per-second refresh rate on Motocross
Madness. But is the consumer really well equipped to evaluate and optimize potentially interacting
design decisions concerning the microprocessor, video processor, and display resolution to achieve
this goal?
Hence, we observe a dilemma inherent to product customization. The user has the most information
concerning his or her utility function, but typically only has a partial understanding of the technical
domain underlying the design problem. In contrast, the manufacturer typically understands the
technical domain well, but has only partial information about the user’s preferences.
In this article, we present and evaluate a novel approach to user design, in which the user expresses
needs directly and leaves to the manufacturer the translation of needs into parameter choices. We
refer to this approach as the needs-based approach. The needs-based approach provides an
alternative to the traditional user design approach-- the parameter-based approach-- in which the
user directly manipulates design parameters.
Our research compares the parameter-based approach and the needs-based approach in the context
of the consumer laptop business. In collaboration with Dell, we developed two user interfaces. The
first one largely resembles Dell’s current user design approach (parameter-based) while the second
4
one provides an alternative, needs-based approach. We use these two systems to control and
monitor a simulated purchase experience (Brucks 1988, Mandel and Johnson 2004).
The objective of this article is to demonstrate the strengths and limitations of these two approaches
and to outline several opportunities for the improvement of user-design interfaces. We believe that
we make several unique contributions. First, we believe that this is the first paper to articulate the
two approaches to user design. Second, we believe that the needs-based system that we have
designed, built, and tested offers solutions to several limitations of the parameter-based approach.
Third, we believe that ours is the first empirical research testing any approaches to user design.
The remainder of this article is organized as follows. In Section 2, we develop theory and
hypotheses. In Section 3, we describe the design of the two user interfaces we test. In Section 4, we
describe the experimental design. In Section 5 we present the results. Section 6 contains discussion
and concluding remarks.
2. Theory and Hypotheses
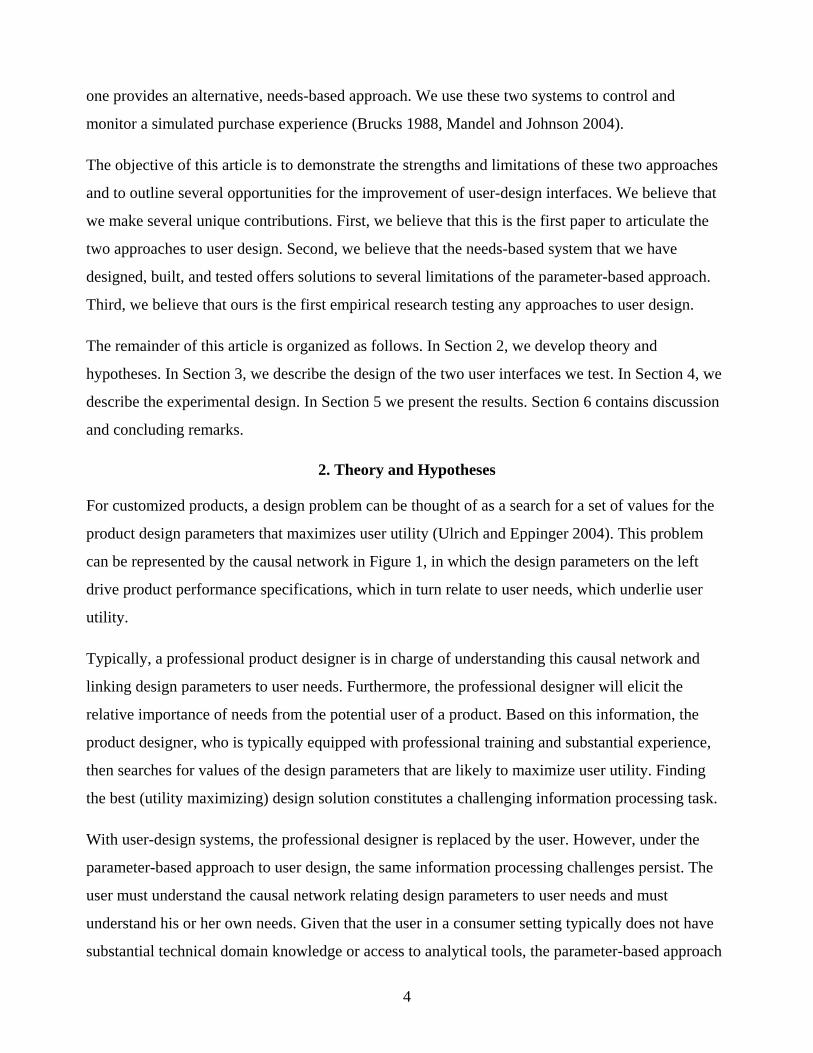
For customized products, a design problem can be thought of as a search for a set of values for the
product design parameters that maximizes user utility (Ulrich and Eppinger 2004). This problem
can be represented by the causal network in Figure 1, in which the design parameters on the left
drive product performance specifications, which in turn relate to user needs, which underlie user
utility.
Typically, a professional product designer is in charge of understanding this causal network and
linking design parameters to user needs. Furthermore, the professional designer will elicit the
relative importance of needs from the potential user of a product. Based on this information, the
product designer, who is typically equipped with professional training and substantial experience,
then searches for values of the design parameters that are likely to maximize user utility. Finding
the best (utility maximizing) design solution constitutes a challenging information processing task.
With user-design systems, the professional designer is replaced by the user. However, under the
parameter-based approach to user design, the same information processing challenges persist. The
user must understand the causal network relating design parameters to user needs and must
understand his or her own needs. Given that the user in a consumer setting typically does not have
substantial technical domain knowledge or access to analytical tools, the parameter-based approach
5
inherently bears the risk of what we call a design defect – a choice of design parameters that does
not maximize user utility. A design defect reflects a misfit between the product designed and the
utility-maximizing product that might have been designed, despite the fact that the user is in control
of all the design decisions.
Design Variables Performance Specifications User Needs/ utility function
User Utility
processor
display
memory
package
XGA / SXGA / UXGA
video card
hard drive
portability
gaming performance
Informationon screen
View from distance
MS-office performance
affordability
Resolution
price
Physical dimensions
Frames per second
HD capacity
Viewable area
RAM
Instructions per second (MIPS)
Data storage potential
Integrated devices
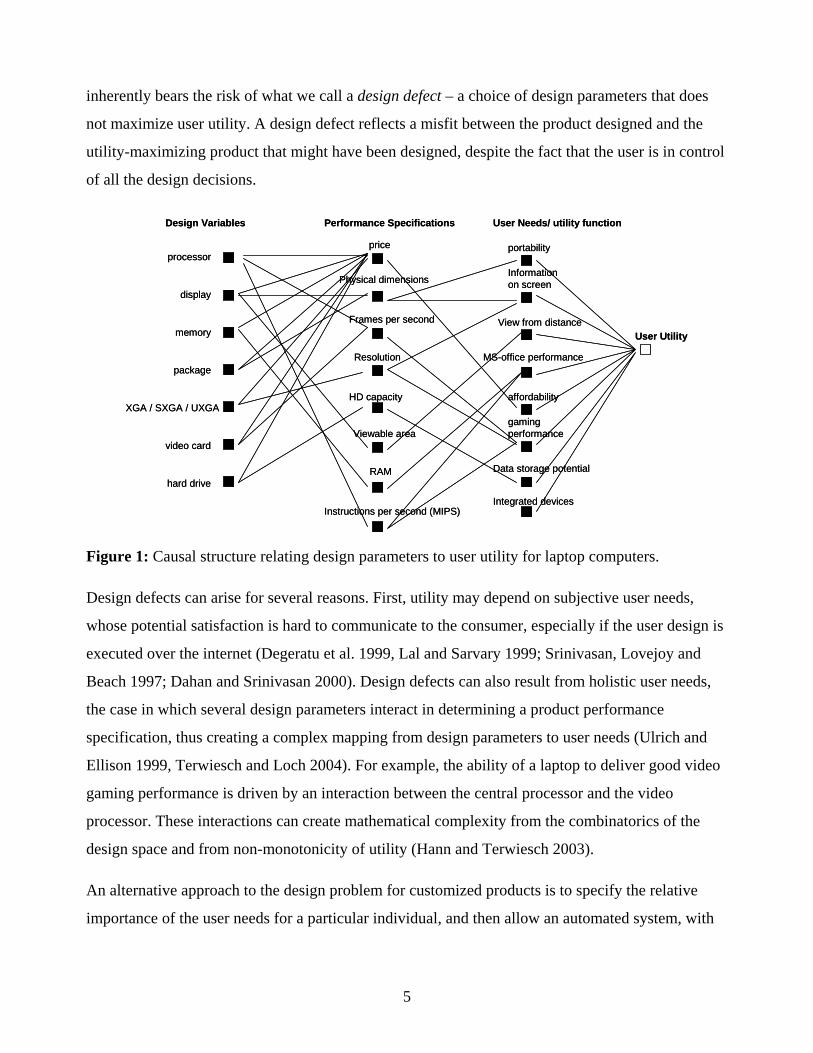
Figure 1: Causal structure relating design parameters to user utility for laptop computers.
Design defects can arise for several reasons. First, utility may depend on subjective user needs,
whose potential satisfaction is hard to communicate to the consumer, especially if the user design is
executed over the internet (Degeratu et al. 1999, Lal and Sarvary 1999; Srinivasan, Lovejoy and
Beach 1997; Dahan and Srinivasan 2000). Design defects can also result from holistic user needs,
the case in which several design parameters interact in determining a product performance
specification, thus creating a complex mapping from design parameters to user needs (Ulrich and
Ellison 1999, Terwiesch and Loch 2004). For example, the ability of a laptop to deliver good video
gaming performance is driven by an interaction between the central processor and the video
processor. These interactions can create mathematical complexity from the combinatorics of the
design space and from non-monotonicity of utility (Hann and Terwiesch 2003).
An alternative approach to the design problem for customized products is to specify the relative
importance of the user needs for a particular individual, and then allow an automated system, with
6
an embedded model of the causal network, to find a feasible set of design parameters to maximize
the user’s utility given the relative importance of the needs. We call this the needs-based approach.
Essentially, the difference between the parameter-based approach and the need-based approach is
the “knobs” that are made available to the designer. While in the parameter-based approach the
knobs are design parameters (left side of Figure 1), the knobs in the need-based approach are actual
user needs (right side of Figure 1), which are closer to the user’s utility function and thereby
typically require less knowledge about the underlying design space. Each approach offers some
potential advantages and disadvantages.
• The parameter-based approach allows direct and predictable navigation of the design space.
This approach also allows fine tuning of a design with small perturbations of design
parameters. Whereas, the needs-based approach allows fine perturbation of the relative
importance of a need, but such a perturbation in the “needs space” may require large and
discontinuous changes to several design parameters by the embedded optimization system.
• The parameter-based approach requires that the designer know the technical language of the
domain. Whereas, the needs-based approach requires only that the designer be able to
express the relative importance of user needs.
• The parameter-based approach is transparent to the user. Whereas, the needs-based approach
requires an automated optimization procedure, which is typically a “black box” to the user.
Expertise in consumer decision making in general has been established as an important element of
transaction success (Sujan 1985, Bettman and Sujan 1987, Mandel and Johnson 2004, Wood and
Lynch 2002). Prior research has shown that information “depth” and “interactivity” are important
factors underlying satisfaction, yet the ability to absorb information is likely to depend heavily on
expertise (Shankar et al. 2000). Therefore, it would not be surprising if expertise plays a critical role
in user design systems. The potential strengths and weaknesses of the two approaches to user design
lead us to hypothesize that neither approach will dominate for all users, and that domain expertise
will play a critical role in determining satisfaction and the quality of actual outcomes.
There are at least three dimensions of outcome performance for user-design systems: the optimality
or fit of the resulting product with respect to the user’s utility function, the comfort of the user with

7
the design process, and the speed with which a user can design a product. We pose three
hypotheses.
Hypothesis 1: For the parameter-based interface, fit, comfort, and speed increase in the expertise of the user.
Hypothesis 2: The advantage of the needs-based interface relative to the parameter-based interface decreases in the user’s expertise.
Hypothesis 3: For novices, the needs-based interface results in better fit, comfort, and speed than the parameter-based interface.
Hypothesis 1 is the baseline hypothesis that novices face difficulties with parameter-based
interfaces. Hypothesis 2 focuses on the relationship between expertise and the magnitude of relative
advantage of the needs-based system. Note that technically we do not imply with Hypothesis 2 that
the needs-based system is always better, only that as user expertise increases, the relative advantage
of the needs-based system declines. In the event that the needs-based system is worse than the
parameter-based systems, Hypothesis 2 implies that this disadvantage increases with the expertise
of the user. Hypothesis 3 explicitly posits that for novices, the needs-based interface is better than
the parameter-based interface.
3. Parameter-Based and Needs-Based Systems for Laptop Computers
A parameter-based system forms the baseline against which we test the needs-based system. The
current web-based user interface for Dell Computer’s consumer laptop business is essentially a
parameter-based system. The system requires the user to specify the values of design parameters
such as the microprocessor type, microprocessor speed, memory size, hard drive size, and video
processor type.
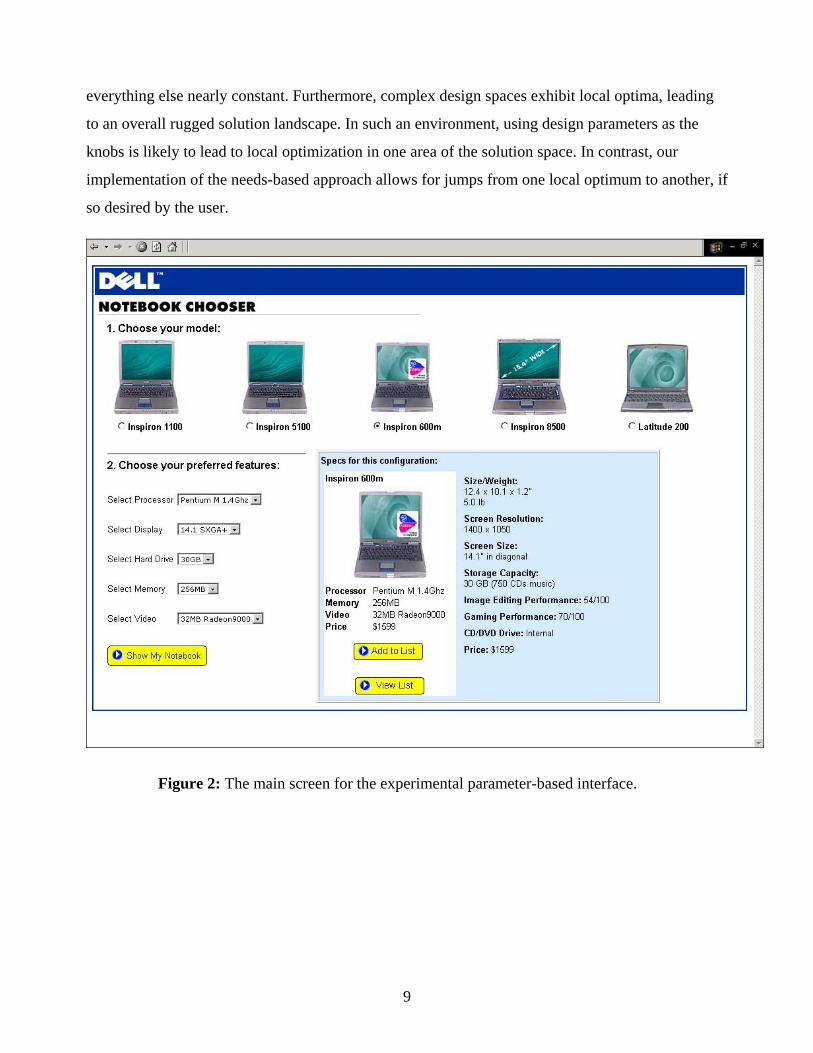
For experimental purposes, we designed a parameter-based system (Figure 2) similar to Dell’s
regular commercial site1. In addition to the main screen, the system includes a “shopping list”-- a
separate web page with a table to which the user can add product configurations for comparison.
When the user finds a desirable configuration, it can be added to the shopping list and can then be
1 Our experimental system differs in at least two ways from the typical Dell shopping experience. First, many Dell consumers first explore the website, but then call a sales representative who helps the consumer configure their computer. Second, Dell offers several standard products, which a consumer can select and bypass the user design problem altogether.
8
“purchased.” We encoded essentially Dell’s entire consumer laptop computer product line with this
system, so that a user could in theory design any consumer laptop product offered by Dell.
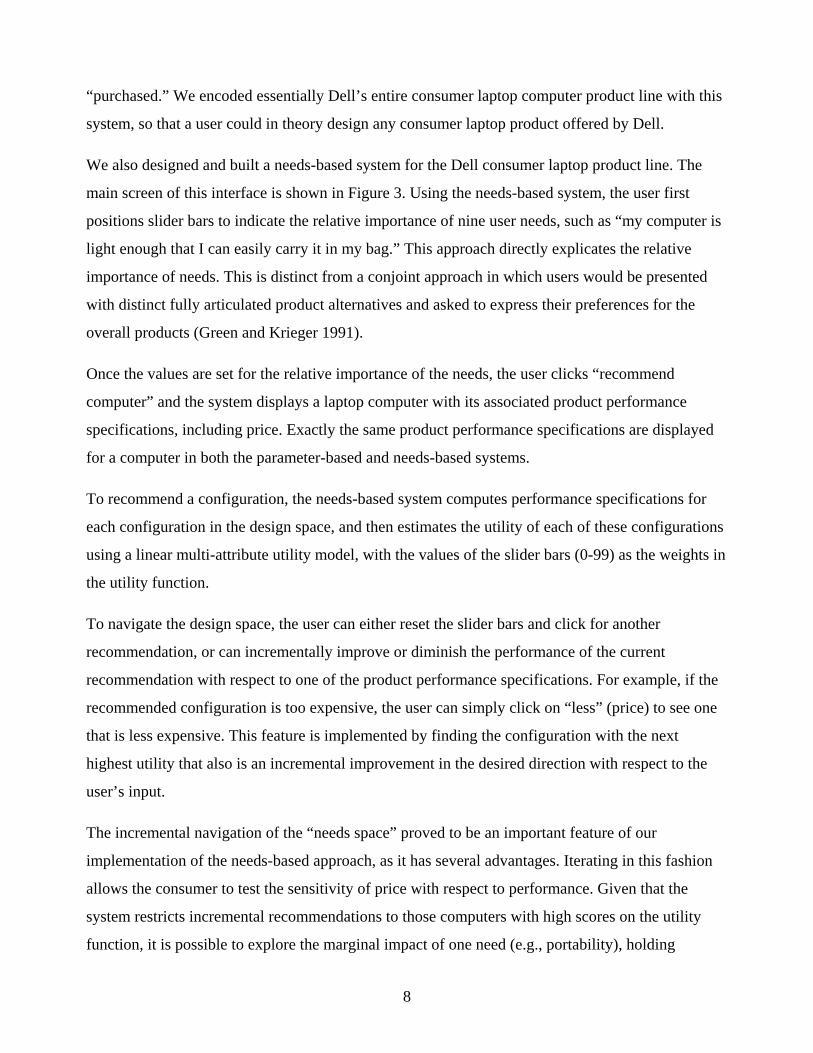
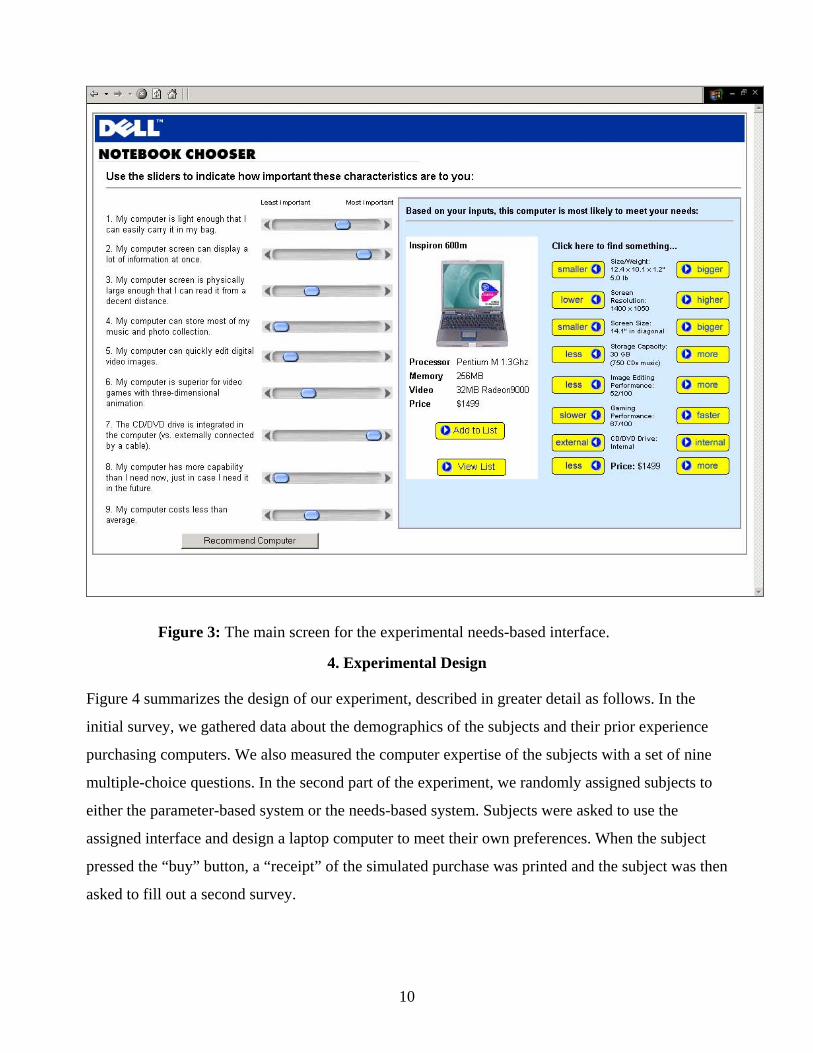
We also designed and built a needs-based system for the Dell consumer laptop product line. The
main screen of this interface is shown in Figure 3. Using the needs-based system, the user first
positions slider bars to indicate the relative importance of nine user needs, such as “my computer is
light enough that I can easily carry it in my bag.” This approach directly explicates the relative
importance of needs. This is distinct from a conjoint approach in which users would be presented
with distinct fully articulated product alternatives and asked to express their preferences for the
overall products (Green and Krieger 1991).
Once the values are set for the relative importance of the needs, the user clicks “recommend
computer” and the system displays a laptop computer with its associated product performance
specifications, including price. Exactly the same product performance specifications are displayed
for a computer in both the parameter-based and needs-based systems.
To recommend a configuration, the needs-based system computes performance specifications for
each configuration in the design space, and then estimates the utility of each of these configurations
using a linear multi-attribute utility model, with the values of the slider bars (0-99) as the weights in
the utility function.
To navigate the design space, the user can either reset the slider bars and click for another
recommendation, or can incrementally improve or diminish the performance of the current
recommendation with respect to one of the product performance specifications. For example, if the
recommended configuration is too expensive, the user can simply click on “less” (price) to see one
that is less expensive. This feature is implemented by finding the configuration with the next
highest utility that also is an incremental improvement in the desired direction with respect to the
user’s input.
The incremental navigation of the “needs space” proved to be an important feature of our
implementation of the needs-based approach, as it has several advantages. Iterating in this fashion
allows the consumer to test the sensitivity of price with respect to performance. Given that the
system restricts incremental recommendations to those computers with high scores on the utility
function, it is possible to explore the marginal impact of one need (e.g., portability), holding
9
everything else nearly constant. Furthermore, complex design spaces exhibit local optima, leading
to an overall rugged solution landscape. In such an environment, using design parameters as the
knobs is likely to lead to local optimization in one area of the solution space. In contrast, our
implementation of the needs-based approach allows for jumps from one local optimum to another, if
so desired by the user.
Figure 2: The main screen for the experimental parameter-based interface.
10
Figure 3: The main screen for the experimental needs-based interface.
4. Experimental Design
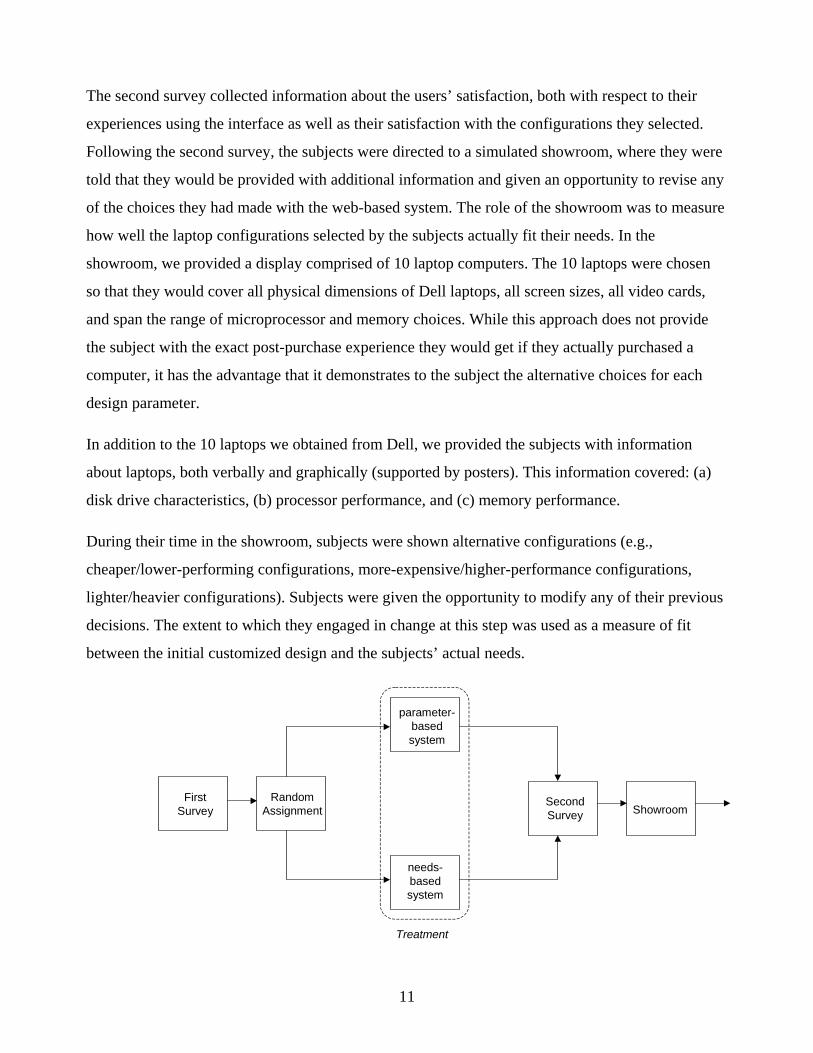
Figure 4 summarizes the design of our experiment, described in greater detail as follows. In the
initial survey, we gathered data about the demographics of the subjects and their prior experience
purchasing computers. We also measured the computer expertise of the subjects with a set of nine
multiple-choice questions. In the second part of the experiment, we randomly assigned subjects to
either the parameter-based system or the needs-based system. Subjects were asked to use the
assigned interface and design a laptop computer to meet their own preferences. When the subject
pressed the “buy” button, a “receipt” of the simulated purchase was printed and the subject was then
asked to fill out a second survey.
11
The second survey collected information about the users’ satisfaction, both with respect to their
experiences using the interface as well as their satisfaction with the configurations they selected.
Following the second survey, the subjects were directed to a simulated showroom, where they were
told that they would be provided with additional information and given an opportunity to revise any
of the choices they had made with the web-based system. The role of the showroom was to measure
how well the laptop configurations selected by the subjects actually fit their needs. In the
showroom, we provided a display comprised of 10 laptop computers. The 10 laptops were chosen
so that they would cover all physical dimensions of Dell laptops, all screen sizes, all video cards,
and span the range of microprocessor and memory choices. While this approach does not provide
the subject with the exact post-purchase experience they would get if they actually purchased a
computer, it has the advantage that it demonstrates to the subject the alternative choices for each
design parameter.
In addition to the 10 laptops we obtained from Dell, we provided the subjects with information
about laptops, both verbally and graphically (supported by posters). This information covered: (a)
disk drive characteristics, (b) processor performance, and (c) memory performance.
During their time in the showroom, subjects were shown alternative configurations (e.g.,
cheaper/lower-performing configurations, more-expensive/higher-performance configurations,
lighter/heavier configurations). Subjects were given the opportunity to modify any of their previous
decisions. The extent to which they engaged in change at this step was used as a measure of fit
between the initial customized design and the subjects’ actual needs.
Random Assignment
FirstSurvey
SecondSurvey
Treatment
Showroom
parameter-basedsystem
needs-based system
12
Figure 4: Process flow diagram for experiment.
Subjects
Subjects for the experiment were recruited from the students and staff of a large research university.
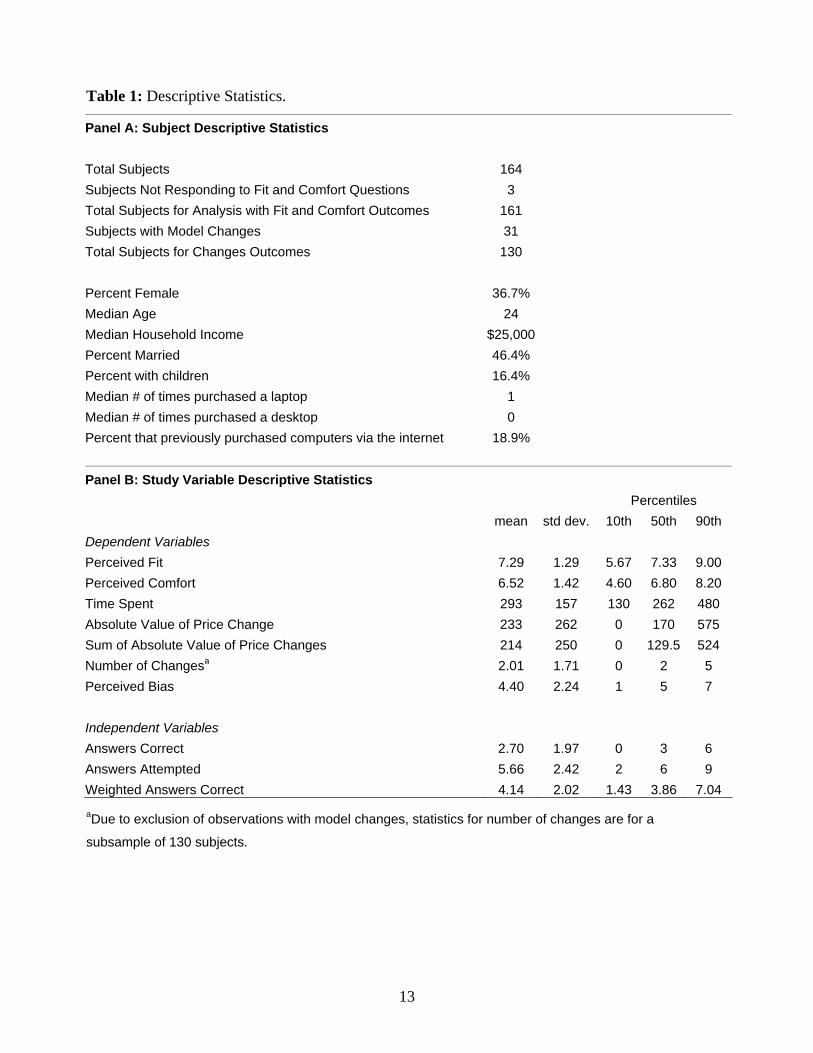
The characteristics of the sample are provided in Table 1 – Panel A. The experiment took about 1
hour on average and subjects were given $10 for their time.
Measures
In the following paragraphs we describe the dependent and independent variables used in the
experiment. Throughout the discussion, we refer to descriptive statistics of each variable found in
Table 1 – Panel B.
Dependent Variables
Perceived Fit: Perceived fit is an aggregate construct based on the average response to these three
statements. 1) From the computers available on the system, I believe I found the one that would be
best for me. 2) If I were to buy a Dell computer in the near future, I would purchase essentially the
one I selected. 3) I’m satisfied that the computer I selected would meet my needs. Question 3 and
the 9-point scale were adapted from Häubl and Trifts (2000). The Cronbach alpha score for the
combined measure is 0.83, which exceeds acceptable limits on construct validity (Nunnally and
Bertstein 1994).
Perceived Comfort: Perceived comfort is an aggregate construct based on the average response of
a subject to these five statements: 1) I felt it was easy to explore the alternatives that were available
to me. 2) I felt that I was able to easily find a computer that would meet my needs. 3) I wish an
independent person could have helped me select the right computer (reverse coded). 4) I felt
confused during the selection process (reverse coded). 5) I felt comfortable with the process of
selecting a computer. The Cronbach alpha score for the construct is 0.72, which exceeds acceptable
limits for construct validity.
Absolute Value of Price Change: This variable is measured as the absolute value of the net price
changes a subject made while in the showroom. For example, a change from an Inspiron 600M to a
Latitude X200 increases the base price of the computer by $250.
13
Table 1: Descriptive Statistics.
Panel A: Subject Descriptive Statistics Total Subjects 164 Subjects Not Responding to Fit and Comfort Questions 3 Total Subjects for Analysis with Fit and Comfort Outcomes 161 Subjects with Model Changes 31 Total Subjects for Changes Outcomes 130 Percent Female 36.7% Median Age 24 Median Household Income $25,000 Percent Married 46.4% Percent with children 16.4% Median # of times purchased a laptop 1 Median # of times purchased a desktop 0 Percent that previously purchased computers via the internet 18.9%
Panel B: Study Variable Descriptive Statistics Percentiles mean std dev. 10th 50th 90th Dependent Variables Perceived Fit 7.29 1.29 5.67 7.33 9.00 Perceived Comfort 6.52 1.42 4.60 6.80 8.20 Time Spent 293 157 130 262 480 Absolute Value of Price Change 233 262 0 170 575 Sum of Absolute Value of Price Changes 214 250 0 129.5 524 Number of Changesa 2.01 1.71 0 2 5 Perceived Bias 4.40 2.24 1 5 7 Independent Variables Answers Correct 2.70 1.97 0 3 6 Answers Attempted 5.66 2.42 2 6 9 Weighted Answers Correct 4.14 2.02 1.43 3.86 7.04
aDue to exclusion of observations with model changes, statistics for number of changes are for a
subsample of 130 subjects.
14
Sum of Absolute Value of Price Changes: The previous measure of price change only accounts
for the net effect of price changes. It does not account for the total dollar value of changes made by
participants. For example, a subject might increase RAM by 256 MB at a cost of $150, but
decrease the hard drive capacity by 30 GB at a gain of $199. The previous measure would measure
this as a $49 change in the absolute value of price. The Sum of the Absolute Value of Price
Changes in this example would be $349.
Time Spent: The elapsed time used to select a computer configuration from the web site.
Number of Changes: The number of changes is the raw quantity of changes a subject made to
their chosen computer configuration when in the showroom. A value of zero implies the best fit. In
our analysis of number of changes, we exclude the subjects who make a model change because a
model change almost always requires a change to many other attributes of the computer. For
example, a subject that changes from the Latitude X200 to the Inspiron 8500 is forced to change
screen size, screen resolution, processor, and video processor, whether or not these other changes
are desired, because the same values of these parameters are not available on the Inspiron 8500.
Independent Variables
Treatment: Subjects were randomly assigned to the parameter-based system or the needs-based
system. In the analysis that follows, the assigned system is coded as an indicator variable with
Treatment=1 for the needs-based system and Treatment=0 for the parameter-based system. We
observe no statistically significant differences between groups in terms of expertise, age, gender,
income and education.
Expertise (Number Correct, Weighted Correct, Number Attempted)
When measuring expertise, it is important to distinguish between objective and subjective expertise
(Brucks 1988). While objective expertise relates to actual knowledge, subjective expertise measures
to what extent subjects perceive themselves to be knowledgeable.
We use two variables to measure objective expertise. First, we use the number of correct answers to
a nine-question multiple-choice test consisting of specific questions in the domain of laptop
computers (Number Correct). This approach is adapted from the instruments reported by Sujan
(1985) and Bettman and Sujan (1987). Second, we use a variant on the number-correct measure
15
which gives partial credit for “close” answers (Weighted Correct). For example, one question asks
for the thickness dimension of the thinnest laptop computers. The correct answer was “less than 1
inch.” However, the response “1 inch to 1.25 inch” is more correct than the response “1.5 to 2
inch”. The measure Weighted Correct provides partial credit for wrong answers and thus reduces
some of the random variability in the expertise measure.
We also measure subjective expertise. For each question a respondent could answer “I don’t know.”
We use the Number Attempted, defined as nine less the number of “I don’t know” responses, as a
measure of subjective expertise.
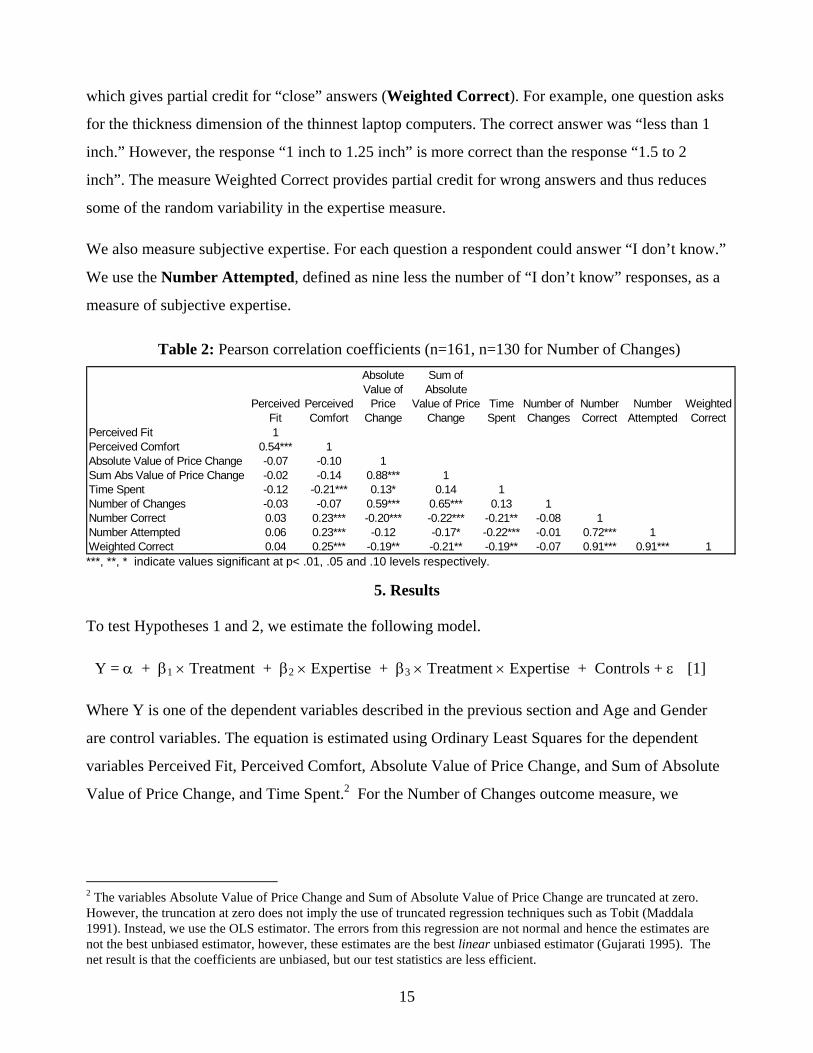
Table 2: Pearson correlation coefficients (n=161, n=130 for Number of Changes)
***, **, * indicate values significant at p< .01, .05 and .10 levels respectively.
5. Results
To test Hypotheses 1 and 2, we estimate the following model.
Y = α + β1 × Treatment + β2 × Expertise + β3 × Treatment × Expertise + Controls + ε [1]
Where Y is one of the dependent variables described in the previous section and Age and Gender
are control variables. The equation is estimated using Ordinary Least Squares for the dependent
variables Perceived Fit, Perceived Comfort, Absolute Value of Price Change, and Sum of Absolute
Value of Price Change, and Time Spent.2 For the Number of Changes outcome measure, we
2 The variables Absolute Value of Price Change and Sum of Absolute Value of Price Change are truncated at zero. However, the truncation at zero does not imply the use of truncated regression techniques such as Tobit (Maddala 1991). Instead, we use the OLS estimator. The errors from this regression are not normal and hence the estimates are not the best unbiased estimator, however, these estimates are the best linear unbiased estimator (Gujarati 1995). The net result is that the coefficients are unbiased, but our test statistics are less efficient.
Perceived Fit
Perceived Comfort
Absolute Value of
Price Change
Sum of Absolute
Value of Price Change
Time Spent
Number of Changes
Number Correct
Number Attempted
Weighted Correct
Perceived Fit 1Perceived Comfort 0.54*** 1Absolute Value of Price Change -0.07 -0.10 1Sum Abs Value of Price Change -0.02 -0.14 0.88*** 1Time Spent -0.12 -0.21*** 0.13* 0.14 1Number of Changes -0.03 -0.07 0.59*** 0.65*** 0.13 1Number Correct 0.03 0.23*** -0.20*** -0.22*** -0.21** -0.08 1Number Attempted 0.06 0.23*** -0.12 -0.17* -0.22*** -0.01 0.72*** 1Weighted Correct 0.04 0.25*** -0.19** -0.21** -0.19** -0.07 0.91*** 0.91*** 1
16
estimate the equation using Poisson regression, which is suggested by Greene (1997) when the data
represent counts of events.3 We mean center the expertise measure in our analysis.
This formulation provides two equations to interpret results based on the two different treatments.
For subjects using the parameter-based interface (Treatment=0) the relevant model is:
Y = α + β2 × Expertise + Controls + ε [2]
For subjects using the needs-based interface (Treatment=1), the relevant model is:
Y = (α + β1) + (β2 + β3) × Expertise + Controls + ε [3]
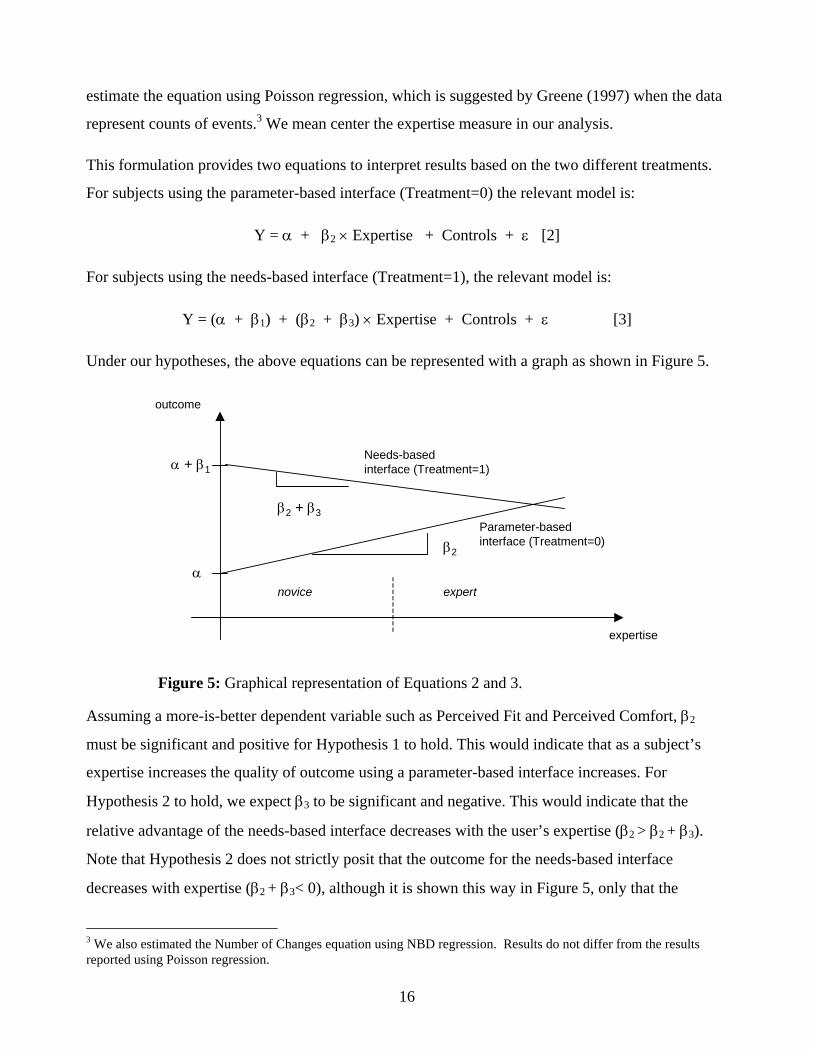
Under our hypotheses, the above equations can be represented with a graph as shown in Figure 5.
expertise
outcome
Needs-based interface (Treatment=1)
Parameter-based interface (Treatment=0)
β2 + β3
β2
α
α + β1
novice expert
Figure 5: Graphical representation of Equations 2 and 3.
Assuming a more-is-better dependent variable such as Perceived Fit and Perceived Comfort, β2
must be significant and positive for Hypothesis 1 to hold. This would indicate that as a subject’s
expertise increases the quality of outcome using a parameter-based interface increases. For
Hypothesis 2 to hold, we expect β3 to be significant and negative. This would indicate that the
relative advantage of the needs-based interface decreases with the user’s expertise (β2 > β2 + β3).
Note that Hypothesis 2 does not strictly posit that the outcome for the needs-based interface
decreases with expertise (β2 + β3< 0), although it is shown this way in Figure 5, only that the
3 We also estimated the Number of Changes equation using NBD regression. Results do not differ from the results reported using Poisson regression.

17
relative advantage of the needs-based interface decreases with expertise. For a less-is-better
dependent variable, such as Time Spent, Absolute Value of Price Change, Sum of Absolute Value
of Price Changes or Number of Changes, the signs in the preceding argument would be reversed.
Panels A, B, and C of Table 3 report results of the regression analysis for our three different
expertise measures. To facilitate the discussion of these results, we show plots in Figure 6 of the
outcomes as a function of expertise using the coefficient estimates from the regression models in
Panel C only.
Table 3: The relation between outcomes, expertise, and design interface (standard errors in parentheses)
Panel A: Expertise = Number of Answers Correct
Dependent Variable Perceived
Fit Perceived Comfort
Abs. Value of Price Change
Sum of Absolute Value
of Price Change
Time Spent
Number of
Changes
Intercept 6.91*** 6.67*** 472.28*** 489.42*** 355.22*** 0.94*** (0.48) (0.50) (93.25) (93.40) (54.01) (0.37)
Treatment (Needs=1) 0.20 0.19 -147.19** -155.31** 4.45 -0.15 (0.35) (0.21) (69.98) (72.52) (24.12) (0.15)
Expertise 0.07 0.25*** -35.37*** -39.69*** -24.21*** -0.09 (0.07) (0.07) (13.43) (14.82) (8.02) (0.05)
Expertise x Needs Interface -0.19* -0.26** 29.26 29.70 29.65** 0.06 (0.11) (0.11) (21.21) (21.99) (12.67) (0.08)
Age 0.01 -0.01 -3.51 -5.02 -1.55 -0.02 (0.02) (0.02) (3.22) (3.14) (1.92) (0.01)
Male 0.09 0.12 -28.97 -1.57 -36.29 -0.06 (0.23) (0.25) (45.45) (47.85) (27.27) (0.17)
Significance Statistic4 1.13 3.10*** 2.77** 3.02** 3.11*** 128.34 Adjusted R-squared 0.00 0.06 0.05 0.07 0.06 - N 162 161 163 134 162 130 Statistical Method Used OLS OLS OLS OLS OLS Poisson
*** p<.01, ** p<.05 one-tailed tests
4 The model significance statistic is the F statistic from ordinary least squares models for the perceived fit, perceived comfort and time spent models. The model significance statistic is the Pearson Chi-square statistic from a Poisson regression for the number of changes model. Note that with the Pearson Chi-Square test we compare the estimated model with a fully saturated model and hence expect no significance in the statistic.
18
Panel B: Expertise = Number of Attempted Answers
Dependent Variable Perceived
Fit Perceived Comfort
Abs. Value of Price Change
Sum of Absolute Value
of Price Change
Time Spent
Number of
Changes
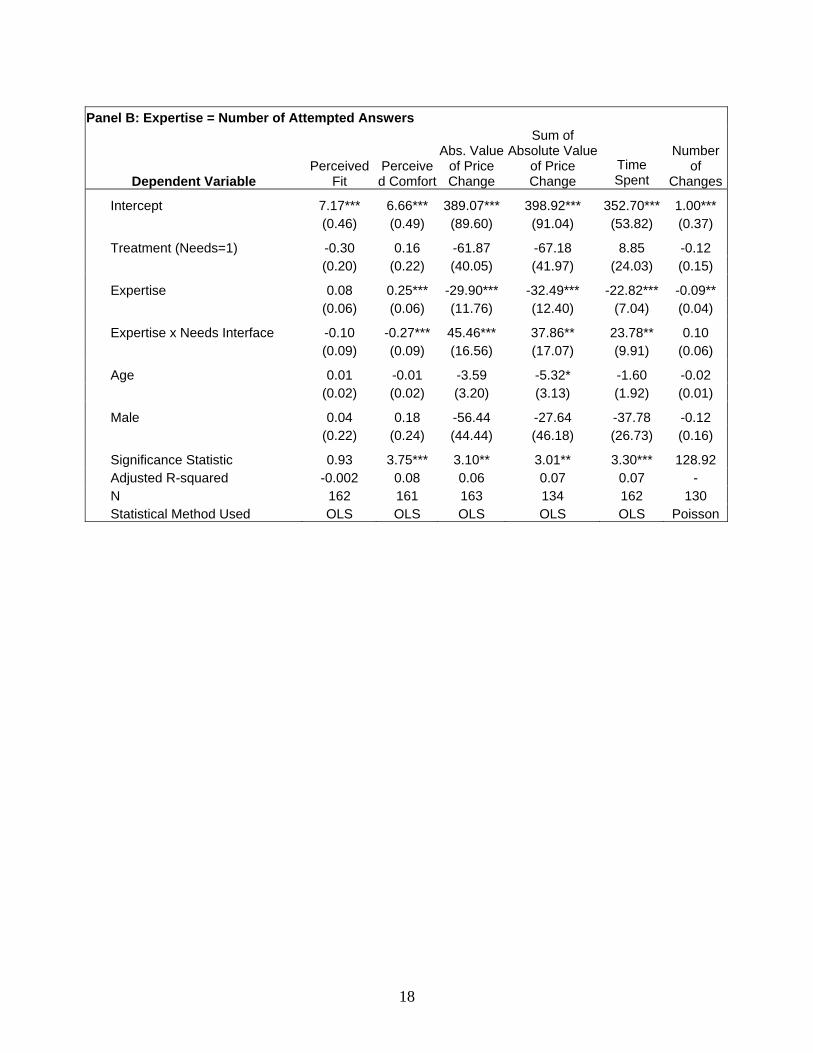
Intercept 7.17*** 6.66*** 389.07*** 398.92*** 352.70*** 1.00*** (0.46) (0.49) (89.60) (91.04) (53.82) (0.37)
Treatment (Needs=1) -0.30 0.16 -61.87 -67.18 8.85 -0.12 (0.20) (0.22) (40.05) (41.97) (24.03) (0.15)
Expertise 0.08 0.25*** -29.90*** -32.49*** -22.82*** -0.09** (0.06) (0.06) (11.76) (12.40) (7.04) (0.04)
Expertise x Needs Interface -0.10 -0.27*** 45.46*** 37.86** 23.78** 0.10 (0.09) (0.09) (16.56) (17.07) (9.91) (0.06)
Age 0.01 -0.01 -3.59 -5.32* -1.60 -0.02 (0.02) (0.02) (3.20) (3.13) (1.92) (0.01)
Male 0.04 0.18 -56.44 -27.64 -37.78 -0.12 (0.22) (0.24) (44.44) (46.18) (26.73) (0.16)
Significance Statistic 0.93 3.75*** 3.10** 3.01** 3.30*** 128.92 Adjusted R-squared -0.002 0.08 0.06 0.07 0.07 - N 162 161 163 134 162 130 Statistical Method Used OLS OLS OLS OLS OLS Poisson

19
Panel C: Expertise = Weighted Answers Correct
Dependent Variable Perceived
Fit Perceived Comfort
Abs. Value of Price Change
Sum of Absolute Value
of Price Change
Time Spent
Number of
Changes
Intercept 7.20*** 6.75*** 323.91*** 378.62*** 356.66*** 0.95*** (0.47) (0.50) (93.96) (91.82) (54.20) (0.37)
Treatment (Needs=1) -0.27 0.18 -77.84* -67.42 10.04 -0.12 (0.20) (0.22) (43.29) (42.31) (24.22) (0.15)
Expertise 0.09 0.27*** -59.91*** -45.29*** -22.76*** -0.11** (0.07) (0.07) (3.87) (15.12) (8.22) (0.05)
Expertise x Needs Interface -0.18 -0.26** 58.95*** 45.73** 26.34** 0.11
(0.10) (0.11) (21.73) (21.23) (12.13) (0.08)
Age 0.01 -0.01 -2.93 -4.99 -1.76 -0.02 (0.02) (0.02) (3.27) (3.19) (1.94) (0.01)
Male 0.07 0.11 -7.35 -5.77 -35.64 -0.08 (0.23) (0.24) (49.19) (48.07) (27.39) (0.17)
Significance statistic 1.10 3.57*** 4.52*** 3.36*** 2.76** 128.57 Adjusted R-squared 0.003 0.07 0.12 0.08 0.05 - N 161 160 162 133 161 129 Statistical Method Used OLS OLS OLS OLS OLS Poisson
Consistent with Hypothesis 1 we report positive and significant coefficients for β2 across all
measures of expertise in models for Perceived Comfort, and a negative and significant coefficient
for the Absolute Value of Price Change, Sum of Absolute Value of Price Changes, Time Spent and
for the Number of Changes. We do not report a significant positive coefficient for β2 in the
Perceived Fit model.
Consistent with Hypothesis 2, across all panels we report negative and significant coefficients for β3
in models for Perceived Comfort and positive and significant coefficients for Time Spent. Results
for other outcome measures vary by the measure of expertise used in the analysis. Consistent with
Hypothesis 2, we report a positive and significant coefficient for β3 in the model for Absolute Value
of Price Change and Sum of Absolute Value of Price Changes in Panel B and Panel C, but not in
Panel A. Consistent with Hypothesis 2, we report a negative and significant coefficients for
Perceived Fit in Panel A and Panel C, but not in Panels A and B. We do not find a significant
coefficient for β3 in the model for the Number of Changes.
20
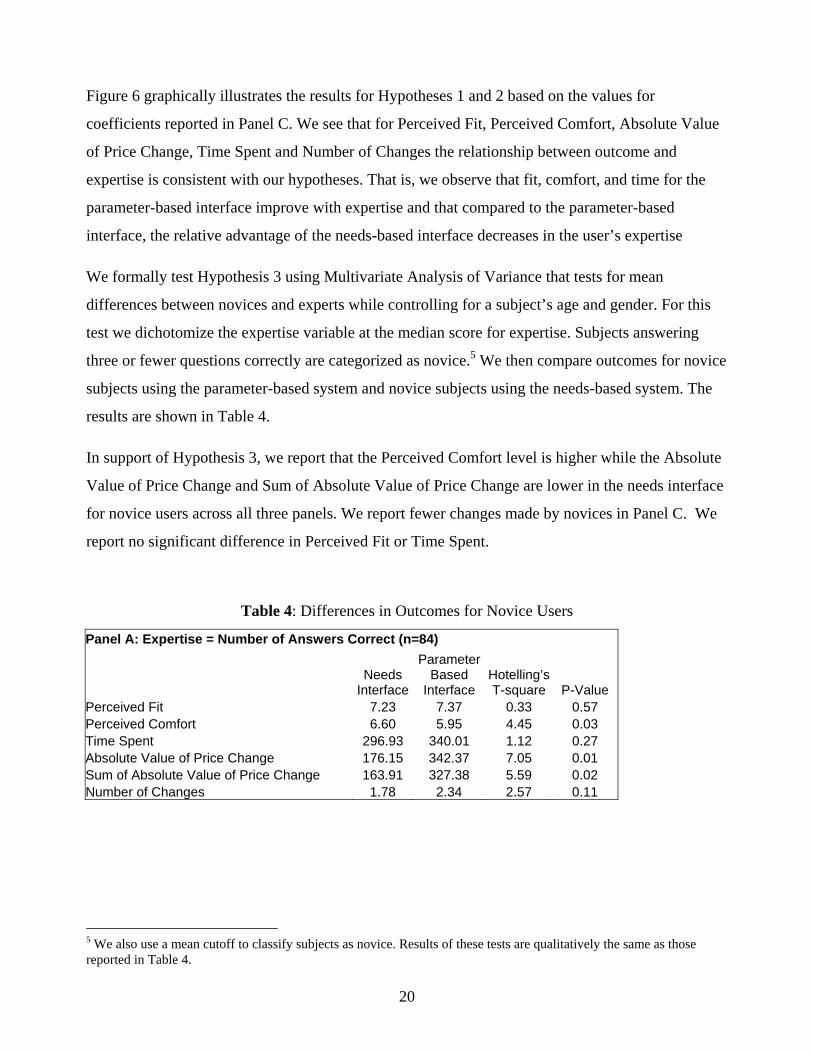
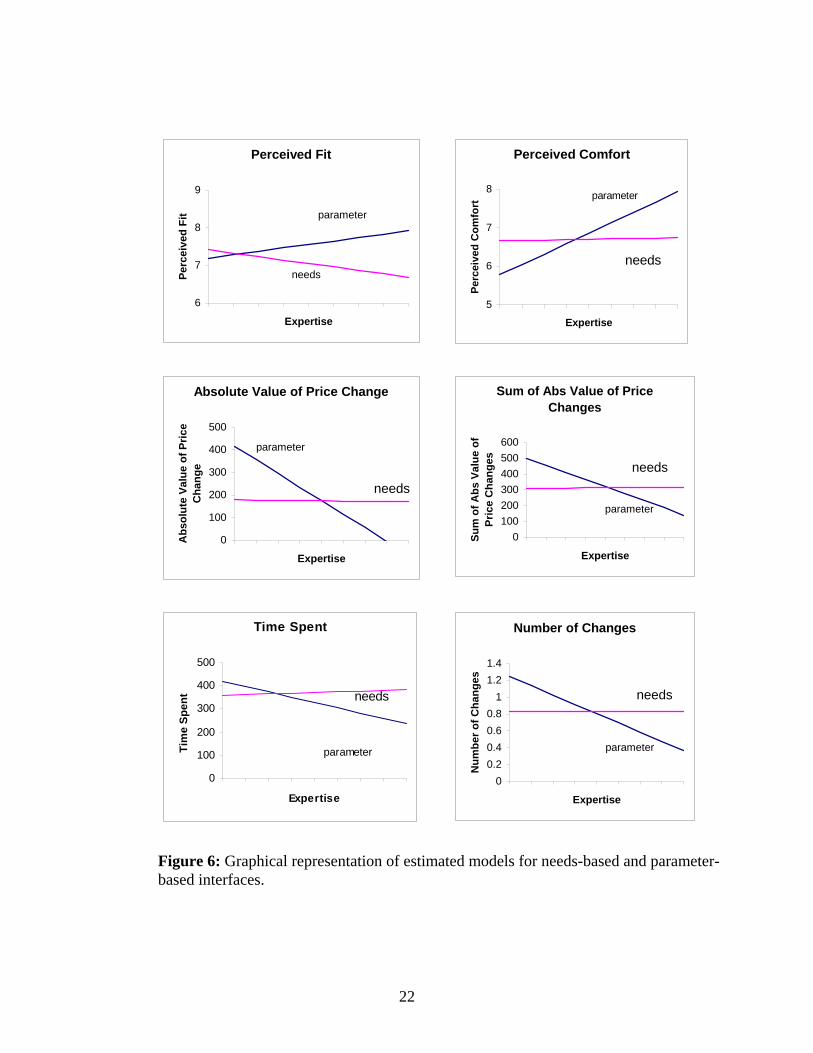
Figure 6 graphically illustrates the results for Hypotheses 1 and 2 based on the values for
coefficients reported in Panel C. We see that for Perceived Fit, Perceived Comfort, Absolute Value
of Price Change, Time Spent and Number of Changes the relationship between outcome and
expertise is consistent with our hypotheses. That is, we observe that fit, comfort, and time for the
parameter-based interface improve with expertise and that compared to the parameter-based
interface, the relative advantage of the needs-based interface decreases in the user’s expertise
We formally test Hypothesis 3 using Multivariate Analysis of Variance that tests for mean
differences between novices and experts while controlling for a subject’s age and gender. For this
test we dichotomize the expertise variable at the median score for expertise. Subjects answering
three or fewer questions correctly are categorized as novice.5 We then compare outcomes for novice
subjects using the parameter-based system and novice subjects using the needs-based system. The
results are shown in Table 4.
In support of Hypothesis 3, we report that the Perceived Comfort level is higher while the Absolute
Value of Price Change and Sum of Absolute Value of Price Change are lower in the needs interface
for novice users across all three panels. We report fewer changes made by novices in Panel C. We
report no significant difference in Perceived Fit or Time Spent.
Table 4: Differences in Outcomes for Novice Users
Panel A: Expertise = Number of Answers Correct (n=84)
Needs
Interface
Parameter Based
Interface Hotelling’s T-square P-Value
Perceived Fit 7.23 7.37 0.33 0.57 Perceived Comfort 6.60 5.95 4.45 0.03 Time Spent 296.93 340.01 1.12 0.27 Absolute Value of Price Change 176.15 342.37 7.05 0.01 Sum of Absolute Value of Price Change 163.91 327.38 5.59 0.02 Number of Changes 1.78 2.34 2.57 0.11
5 We also use a mean cutoff to classify subjects as novice. Results of these tests are qualitatively the same as those reported in Table 4.
21
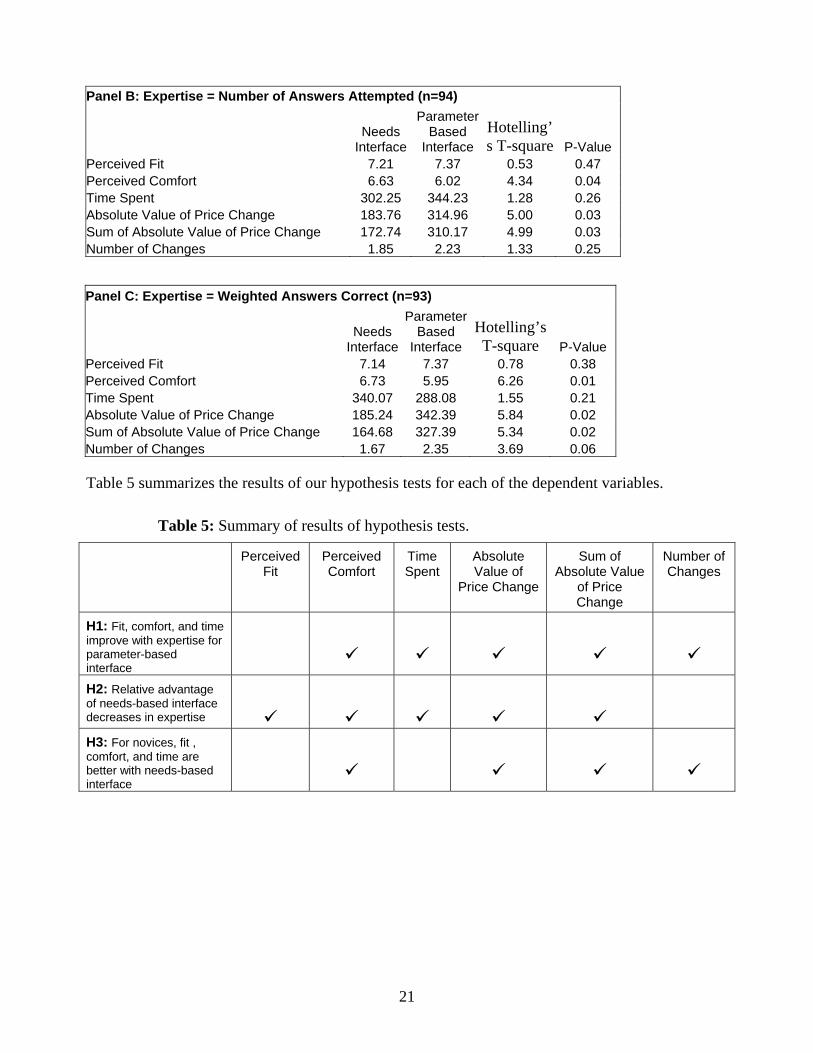
Panel B: Expertise = Number of Answers Attempted (n=94)
Needs
Interface
Parameter Based
Interface Hotelling’s T-square P-Value
Perceived Fit 7.21 7.37 0.53 0.47 Perceived Comfort 6.63 6.02 4.34 0.04 Time Spent 302.25 344.23 1.28 0.26 Absolute Value of Price Change 183.76 314.96 5.00 0.03 Sum of Absolute Value of Price Change 172.74 310.17 4.99 0.03 Number of Changes 1.85 2.23 1.33 0.25
Panel C: Expertise = Weighted Answers Correct (n=93)
Needs
Interface
Parameter Based
Interface Hotelling’s T-square P-Value
Perceived Fit 7.14 7.37 0.78 0.38 Perceived Comfort 6.73 5.95 6.26 0.01 Time Spent 340.07 288.08 1.55 0.21 Absolute Value of Price Change 185.24 342.39 5.84 0.02 Sum of Absolute Value of Price Change 164.68 327.39 5.34 0.02 Number of Changes 1.67 2.35 3.69 0.06
Table 5 summarizes the results of our hypothesis tests for each of the dependent variables.
Table 5: Summary of results of hypothesis tests.
Perceived Fit
Perceived Comfort
Time Spent
Absolute Value of
Price Change
Sum of Absolute Value
of Price Change
Number of Changes
H1: Fit, comfort, and time improve with expertise for parameter-based interface
H2: Relative advantage of needs-based interface decreases in expertise
H3: For novices, fit , comfort, and time are better with needs-based interface
22
Perceived Fit
6
7
8
9
Expertise
Perc
eive
d Fi
t parameter
needs
Perceived Comfort
5
6
7
8
Expertise
Perc
eive
d C
omfo
rt
parameter
needs
Absolute Value of Price Change
0
100
200
300
400
500
Expertise
Abs
olut
e Va
lue
of P
rice
Cha
nge
parameter
needs
Sum of Abs Value of Price Changes
0100200300400500600
Expertise
Sum
of A
bs V
alue
of
Pric
e C
hang
es needs
parameter
Time Spent
0
100
200
300
400
500
Expertise
Tim
e Sp
ent
parameter
needs
Number of Changes
00.20.40.60.8
11.21.4
Expertise
Num
ber o
f Cha
nges
needs
parameter
Figure 6: Graphical representation of estimated models for needs-based and parameter-based interfaces.
23
6. Discussion
The experimental results provide substantial support for our hypotheses. Novices are less
comfortable with parameter-based systems and achieve better fit in less time with needs-based
systems. In this section, we discuss some limitations of our study, along with several issues related
to application of needs-based systems in industrial practice.
Limitations of the Study
Our sample is not fully representative of the overall consumer population, as college-educated
consumers, especially business students, are over-represented. Therefore inferences about all
consumers may not be valid. However, we conjecture that most consumers are in fact likely to be
less well suited to parameter-based approaches than college students of business.
Our study focuses on a single product domain, laptop computers. We would expect similar results
for other technology-based goods. For simple domains, say the design of a sandwich or a pizza, or
for domains in which even more modular architectures are prominent, we expect that parameter-
based systems exhibit fewer disadvantages relative to needs-based systems.
Several additional domains seem especially promising for needs-based approaches including
retirement planning, medical plan choice, and product selection in categories with hundreds of
products, such as automobiles and cameras. Another avenue of research that appears promising is to
study how the alternatives presented to consumers shape the user design process (Huber et al.
1982).
Hybrid Systems
In testing our hypotheses, we chose to create a clear distinction between the parameter-based
system and the needs-based system. A simple hybrid system could offer the user the choice of a
parameter-based interface or a needs-based interface. A more sophisticated hybrid system could
allow the same interface to work in both ways. That is, either parameters or needs could be directly
manipulated. One such system would be equivalent to the needs-based system we developed, with
the additional feature that any parameter (e.g., amount of memory) could be directly manipulated
with the resulting impact on the customer needs shown immediately.
24
Conclusion
User design offers tantalizing potential benefits to manufacturers and consumers, including a closer
match of products to user preferences, which should result a higher willingness to pay for goods and
services. However, the user design experience can suffer from a mismatch between preferences and
the resulting product. Design defects can result from overwhelming confusion for novice users and
daunting design complexity.
There are two fundamental approaches that can be taken to user design: parameter-based systems
and needs-based systems. In parameter-based systems, users directly specify the values of design
parameters of the product. In needs-based systems, users specify the relative importance of their
needs, and an optimization algorithm recommends the combination of design parameters that is
likely to maximize the user’s utility.
Through an experiment in the domain of consumer laptop computers, we show that for parameter-
based systems, comfort and fit increase in the expertise of the user. We also show that for novices,
the needs-based interface results in better fit, comfort, and speed than the parameter-based interface.
25
References
Bettman, J. and M. Sujan, “Effects of Framing on Evaluation of Comparable and Noncomparable Alternatives by Expert and Novice Consumers,” Journal of Consumer Research, Vol. 15, p. 141-153, September 1987.
Bhattacherjee, A., “Individual Trust in Online Firms: Scale Development and Initial Test,” Journal of Management Information Systems, Vol. 19, p. 211-241, Summer 2002.
Brucks, M., “Search Monitor: An Approach for Computer-Controlled Experiments Involving Consumer Information Search,” The Journal of Consumer Research, Vol. 15, No. 1, p. 117-121, June 1988.
Cragg, J., “Some Statistical Models for Limited Dependent Variables with Application to the Demand for Durable Goods,” Econometrica Vol. 39, p. 829-844, 1971.
Dahan, Ely and John R. Hauser, “The Virtual Customer,” Journal of Product Innovation Management, September 2002.
Dahan, Ely and V. Seenu Srinivasan, “The Predictive Power of Internet-Based Product Concept Testing Using Visual Depiction and Animation,” Journal of Product Innovation Management, March 2000.
Degeratu, A., A. Rangaswamy, J. Wu, “Consumer Choice Behavior in Online and Traditional Supermarkets: The Effects of Brand Name, Price, and Other Search Attributes,” Working Paper, Smeal College of Business, 1999.
Doney, P. and J. Cannon, “An Examination of the Nature of Trust in Buyer-Seller Relationships,” Journal of Marketing, April 1997, p. 35-51.
Green, P. E. and A. M. Krieger, “Conjoint Analysis: Methods and Applications,” in Handbook of Marketing Research, M. J. Houston (ed.). New York: McGraw Hill, 1991.
Gujarati, D. Basic Econometrics, McGraw Hill 1995.
Gujarati, D., Basic Econometrics, McGraw-Hill, New York, 1995. Hall.
Hann, Il-Horn, Christian Terwiesch, “Measuring the Frictional Costs of Online Transactions: The Case of a Name-Your-Own-Price Channel”, Management Science (forthcoming).
Häubl, G and V. Trifts, “Consumer Decision Making in Online Shopping Environments: The Effects of Interactive Decision Aids,” Marketing Science, Vol. 19, Winter 2000, p. 4-21.
Huber, J., D.R. Wittink, J.A. Fiedler and R.L. Miller, "The Effectiveness of Alternative Preference Elicitation Procedures in Predicting Choice," Journal of Marketing Research, Vol. 30, February 1993, p.105-114.
Huber, J., J.W. Payne, C. Puto, “Adding Asymmetrically Dominated Alternatives: Violations of Regularity and the Similarity Hypothesis,” The Journal of Consumer Research, Vol. 9, No. 1, p.90-98, June 1982.
Lal, R. and M. Sarvary, “When and How is the Internet Likely to Decrease Price Competition?” Marketing Science, Vol. 18, No. 4, 1999, p. 485-503.

26
Leigh, Thomas W., David B. McKay, and John O. Summers, “Reliability and Validity of Conjoint Analysis and Self-Explicated Weights: A Comparison,” Journal of Marketing Research, Vol. 21, November 1984, p. 456-462.
Lynch, J. and Ariely, D., “Wine Online: Search Costs Affect Competition on Price, Quality and Distribution,” Marketing Science, Vol. 19, Winter 2000, p. 83-103.
Maddala, G. “A Perspective on the Use of Limited-Dependent and Qualitative Variables Models in Accounting Research,” The Accounting Review, Vol. 66 No. 4, 1991, p. 788-807.
Maddala, G., “A Perspective on the Use of Limited-Dependent and Qualitative Variables Models in Accounting Research,” The Accounting Review, Vol. 66, No. 4, p. 788-807, 1991.
Maddala, G., Introduction to Econometrics, 2nd ed., Macmillan, New York, 1992.
Mandel, N. and E.J. Johnson, “When Web Pages Influence Choice: Effects of Visual Primes on Experts and Novices,” to appear The Journal of Consumer Research, 2004.
Morgan, R. and S. Hunt, “The Commitment-Trust Theory of Relationship Marketing,” Journal of Marketing, Vol. 58, July 1994, p. 20-38.
Nelson, F and Olson, L., “Specification and Estimation of a Simultaneous-Equation Model with Limited Dependent Variables,” International Economic Review, Vol 19, No. 3. p. 695-709, 1978.
Nunnally, J.C. and I.H. Bernstein, Psychometric Theory, McGraw-Hill, New York, 1994.
Pullman, Madeleine, Kimberly J. Dodson and William L. Moore, “A Comparison of Conjoint Methods When There Are Many Attributes,” Marketing Letters, Vol. 10 No. 2, 1999, p. 123-138.
Ramaswamy, Rajan and Karl Ulrich, “A Designer’s Spreadsheet,” ASME Journal of Mechanical Design, Vol. 119, No. 1, p.48-56, 1997.
Ramaswamy, Rajan and Karl Ulrich, “Augmenting the House of Quality with Engineering Models,” Research in Engineering Design, Vol. 5, No. 2, p. 70-79, 1993.
Shankar, V., A.K. Smith, A. Rangaswamy, “Customer Satisfaction and Loyalty in Online and Offline Environments,” Working Paper, Smeal College of Business, October 2000.
Sigelman, L. and Zheng, L., “Analyzing Censored and Sample-Selected Data with Tobit and Heckit Models,” Political Analysis, Vol. 8, No. 2, p. 167-182, 1999.
Srinivasan, V. and Chan Su Park (1997), “Surprising Robustness of the Self-Explicated Approach to Customer Preference Structure Measurement,” Journal of Marketing Research, Vol. 34, May 1997, p. 286-291.
Srinivasan, V., W.S. Lovejoy, and D. Beach, “Integrated Product Design for Marketability and Manufacturing,” Journal of Marketing Research, Vol. 34, 1997, p. 154-163.
Sujan, M., “Consumer Knowledge: Effects on Evaluation Strategies Mediating Consumer Judgements,” Journal of Consumer Research, Vol. 12, June 1985, p. 31-46.
Terwiesch, Christian, Christoph H. Loch, “Collaborative Prototyping and the Pricing of Customized Products,” revised for Management Science.
Torkzadeh, G. and G. Dhillon, “Measuring Factors that Influence the Success of Internet Commerce,” Information Systems Research, June 2002, Vol. 13, p. 187-204.
27
Ulrich, Karl and David Ellison, “Holistic Customer Requirements and the Design-Select Decision,” Management Science, Vol. 45, No. 5, p. 641-658, May 1999.
Ulrich, Karl and Steven Eppinger, Product Design and Development, McGraw-Hill, New York, 3rd Edition, 2004.
Ulrich, Karl, “The Role of Product Architecture in the Manufacturing Firm,” Research Policy, Vol. 24, p. 419-440, 1995.
Wind, Jerry and Arvind Rangaswamy, “Customerization: The Next Revolution in Mass Customization,” Journal of Interactive Marketing, Vol. 15, No. 1, p. 13-32, 2001.
Winer, R.S., J. Deighton, S. Gupta, E.J. Johnson, B. Mellers, V.G. Morwitz, T. O’Guinn, A. Rangaswamy, A.G. Sawyer, “Choice in Computer-Mediated Environments,” Marketing Letters, Vol. 8, No. 3, p. 287-296, 1997.
Wood, S. and J. Lynch, “Prior Knowledge and Complacency in New Product Learning,” Journal of Consumer Research, Vol. 29, December 2002, p. 416-426.
Yermack, D., “Do Corporations award CEO stock options effectively?” Journal of Financial Economics, Vol. 39, p 237-369, 1995.

28
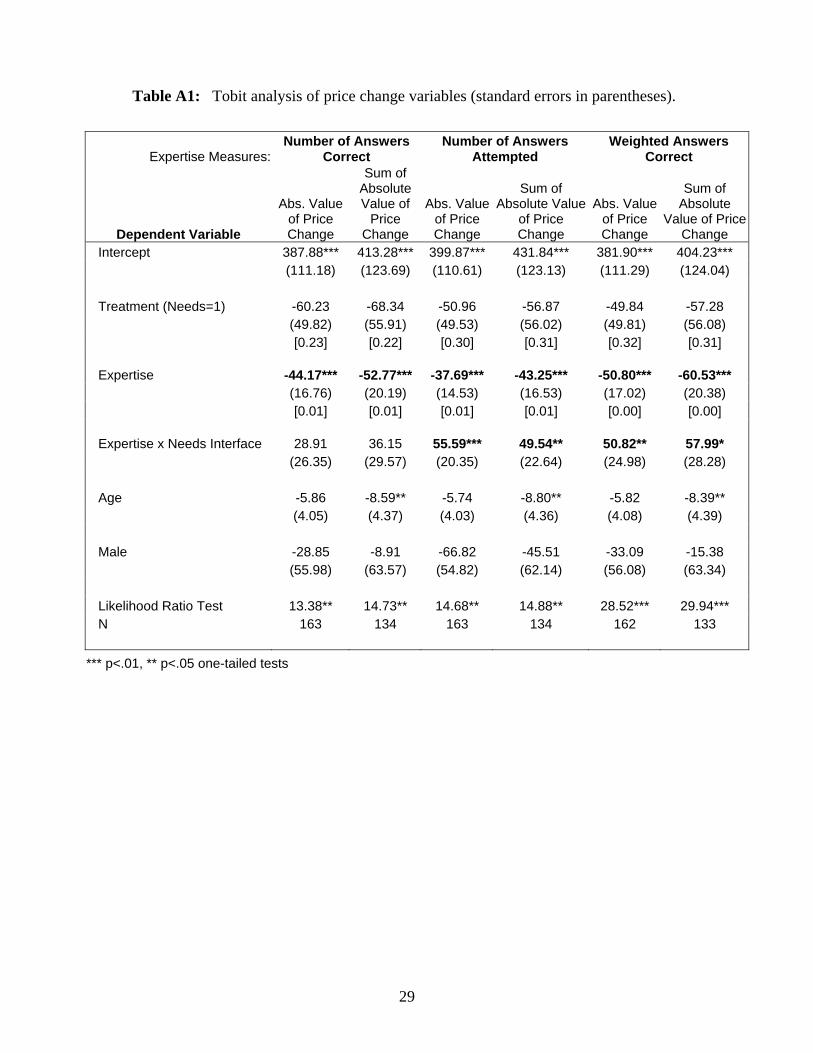
Appendix : Tobit Analysis
Table A1 shows the results of Tobit regression models for the price change variables. There are no
qualitative differences between these results and the OLS results reported in the body of the paper.
Opinions differ on the applicability of Tobit in situations similar to ours. We share the positions of
Sigelman and Zeng (1999) and Maddala (1991) that Tobit is not the right specification in the
absence of explicit censoring, however we believe that the results of the Tobit analysis reported in
Table A1 are an indication of the robustness of our basic results.
We offer these comments on Tobit for the interested reader. Maddala distinguishes between two
types of censoring. First, there are situations in which the dependent variable can take on negative
values in theory, but for which such values are actually observed as zeroes. Such cases qualify as
true censoring for which Tobit is appropriate. However in a second situation, the dependent variable
cannot, even in theory, take on negative variables, as is the case for automobile expenditures, hours
worked or wages. This second situation holds for our various change measures. In such situations,
Maddala (1992 p. 341) states that Tobit models are inappropriate. Specifically, he states:
“every time we have some zero observations in the sample, it is tempting to use
the Tobit model. However, it is important to understand what the model…really
says. What we have [with Tobit] is a situation where [the dependent variable] can,
in principle, take on negative values. However, we do not observe them because
of censoring. Thus zero values are due to non-observability. This is not the case
with automobile expenditures, hours worked or wages. These variables cannot, in
principle, assume negative values.”
Sigelman and Zeng (1999) state, “if no censoring has occurred or if censoring has occurred but not
at zero, then the standard Tobit specification is inappropriate.”
Researchers have suggested remedies to several situations where Tobit models were used
incorrectly with data limited at zero. See as examples Cragg (1971) and Nelson and Olson (1978).
However, these situations do not apply specifically to our situation. Based on these arguments, we
believe OLS is our best reasonable alternative. The OLS estimates are still BLUE, but not BUE
(Gujarati 1995).
29
Table A1: Tobit analysis of price change variables (standard errors in parentheses).
Expertise Measures: Number of Answers
Correct Number of Answers
Attempted Weighted Answers
Correct
Dependent Variable
Abs. Value of Price Change
Sum of Absolute Value of
Price Change
Abs. Value of Price Change
Sum of Absolute Value
of Price Change
Abs. Value of Price Change
Sum of Absolute
Value of Price Change
Intercept 387.88*** 413.28*** 399.87*** 431.84*** 381.90*** 404.23*** (111.18) (123.69) (110.61) (123.13) (111.29) (124.04) Treatment (Needs=1) -60.23 -68.34 -50.96 -56.87 -49.84 -57.28 (49.82) (55.91) (49.53) (56.02) (49.81) (56.08) [0.23] [0.22] [0.30] [0.31] [0.32] [0.31]
Expertise -44.17*** -52.77*** -37.69*** -43.25*** -50.80*** -60.53*** (16.76) (20.19) (14.53) (16.53) (17.02) (20.38) [0.01] [0.01] [0.01] [0.01] [0.00] [0.00]
Expertise x Needs Interface 28.91 36.15 55.59*** 49.54** 50.82** 57.99* (26.35) (29.57) (20.35) (22.64) (24.98) (28.28) Age -5.86 -8.59** -5.74 -8.80** -5.82 -8.39** (4.05) (4.37) (4.03) (4.36) (4.08) (4.39) Male -28.85 -8.91 -66.82 -45.51 -33.09 -15.38 (55.98) (63.57) (54.82) (62.14) (56.08) (63.34) Likelihood Ratio Test 13.38** 14.73** 14.68** 14.88** 28.52*** 29.94*** N 163 134 163 134 162 133
*** p<.01, ** p<.05 one-tailed tests