Embed Size (px)
Citation preview
User-Friendly Multivariate Analysis for Linking Predictive
Water Quality Models to Biological Data
Janna Owens
Water Quality Monitoring
Physical, chemical and biological assessments
Calculate environmental impacts Create models of water processes
as predictive tools for physical/chemical data
Ideally, a compatible framework would integrate biological data
PRIMER software
Plymouth Research Routines in Multivariate Ecological Research
Coherent strategy for interpretation of community structure
Wide range univariate/multivariate routines
Ease of use and comprehension

Predictive Model
0.00
1.00
2.00
3.00
4.00
5.00
2 -Year 5 -Year 10 -Year 25 -Year 50 -Year 100 -Year
Per
cen
tag
e In
crea
se
Peak Flow (cfs)
Runoff Depth (in)

Deterministic models do not directly evaluate larger biological organisms
Won’t simulate many aspects of complex community
Statistical data modeling integrates biological and environmental variables
Basic methodologies: Cluster and Ordination
Aquatic Biological Modeling
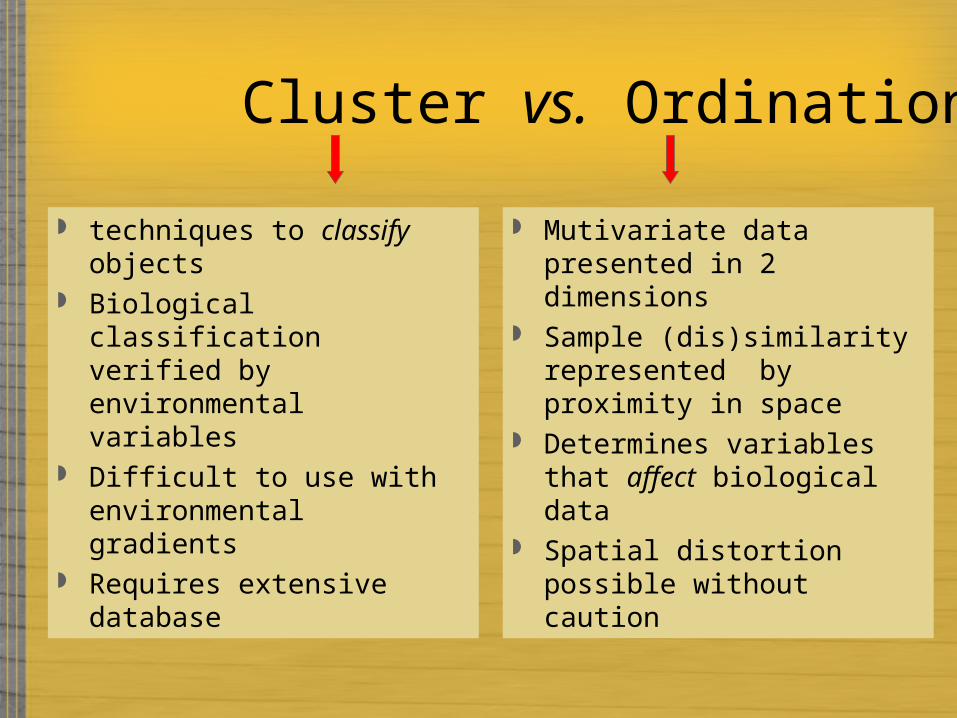
techniques to classify objects
Biological classification verified by environmental variables
Difficult to use with environmental gradients
Requires extensive database
Mutivariate data presented in 2 dimensions
Sample (dis)similarity represented by proximity in space
Determines variables that affect biological data
Spatial distortion possible without caution
Cluster vs. Ordination

Cluster Analysis
?

Hierarchical Cluster
Stable Unstable

Ordination Analysis
Multi-Variable
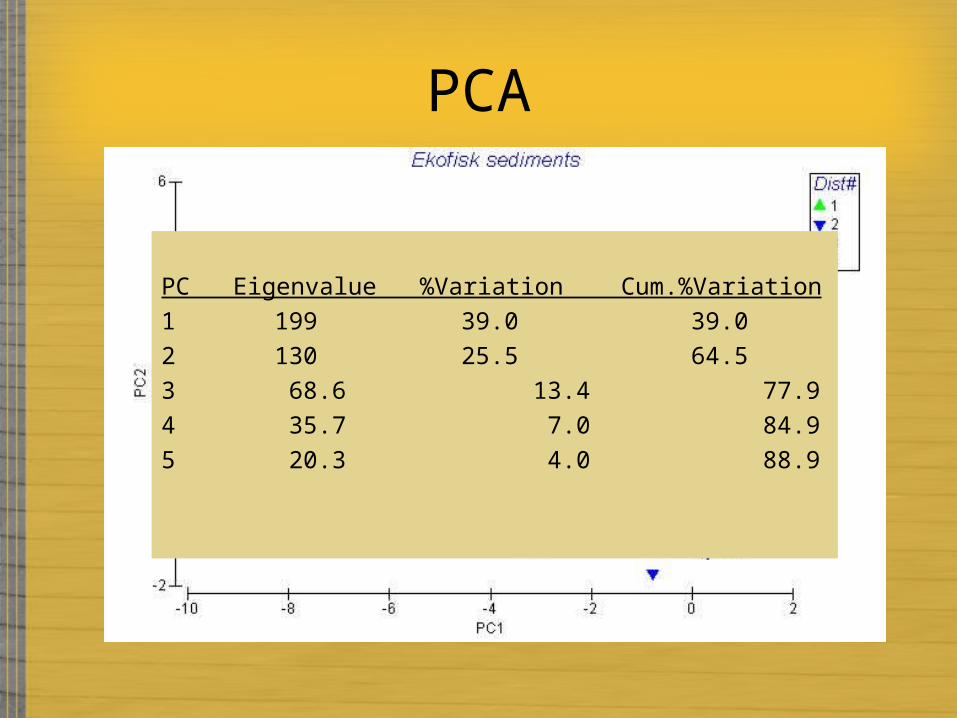
PCA
PC Eigenvalue %Variation Cum.
%Variation1 199 39.0 39.02 130 25.5 64.53 68.6 13.4 77.94 35.7 7.0 84.95 20.3 4.0 88.9
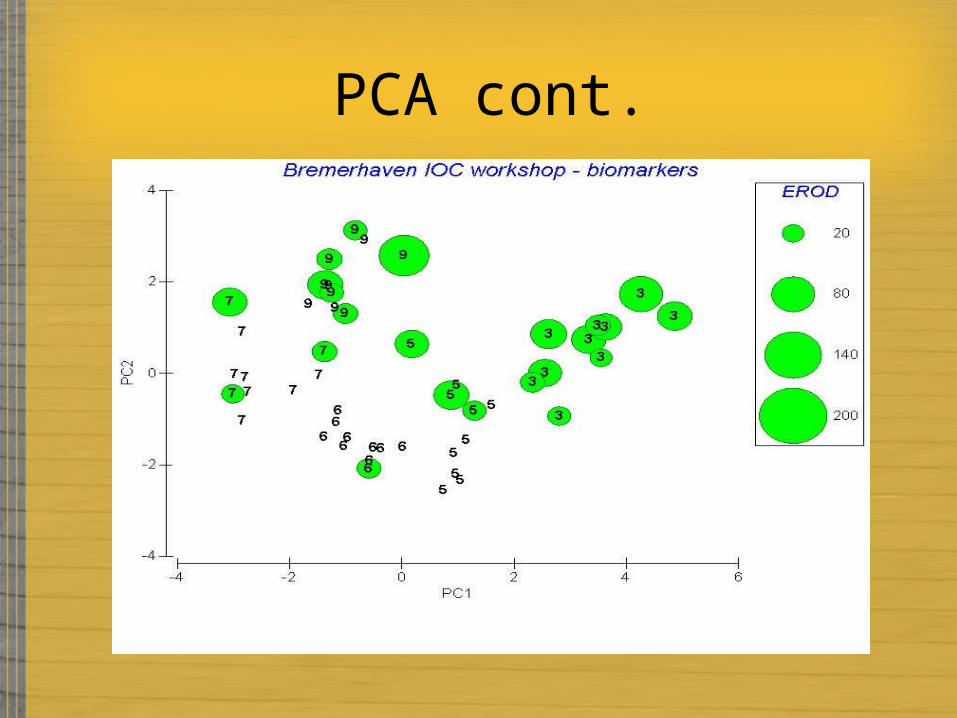
PCA cont.
G H
L
S
P
G
L S
P
V
G
H
L
S
P
V
G H
L
S P
V
G H L
S
P
V
G H L
S
P
V G
H C
L
M
S
P
G H
C
L M
S
P
G H
C
L
M S
P
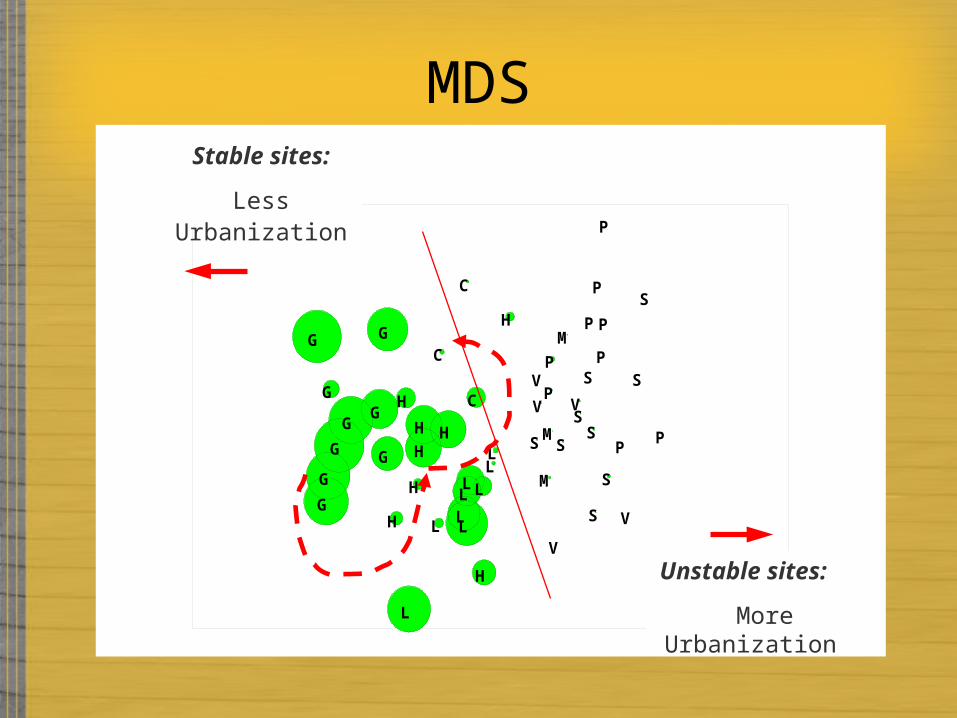
Stable sites:
Less Urbanization
Unstable sites:
More Urbanization
MDS

MDS Trajectory

ANOSIM

Dominance Curves
3
~ 67%
~ 27%
Sites
Species rank by abundance
Cu
mu
lati
ve D
om
inan
ce (
%)
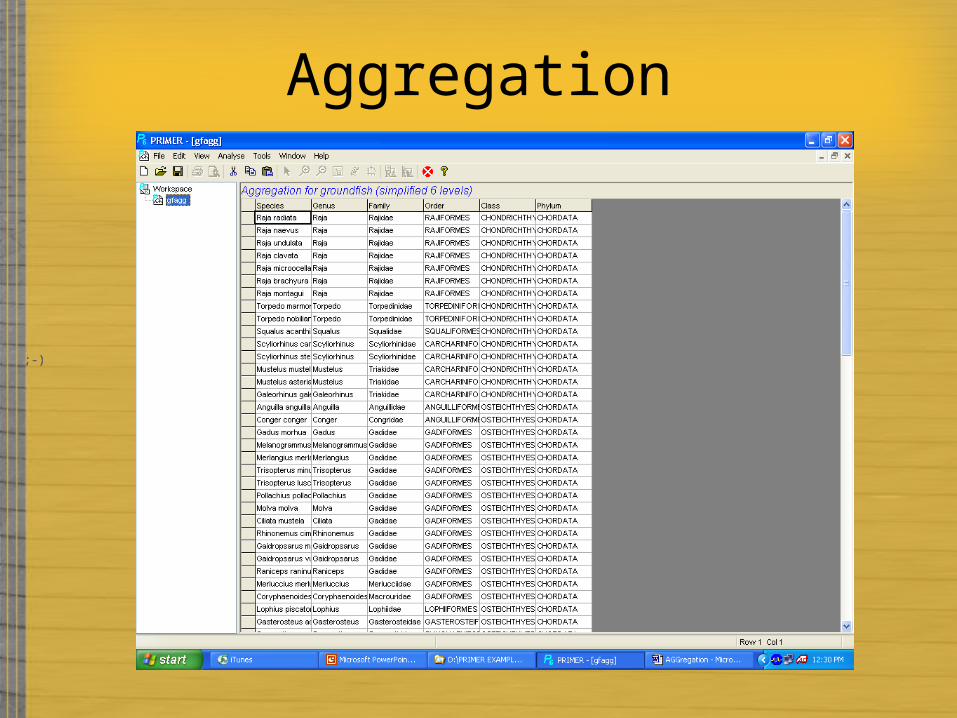
Aggregation
;-) ;-)
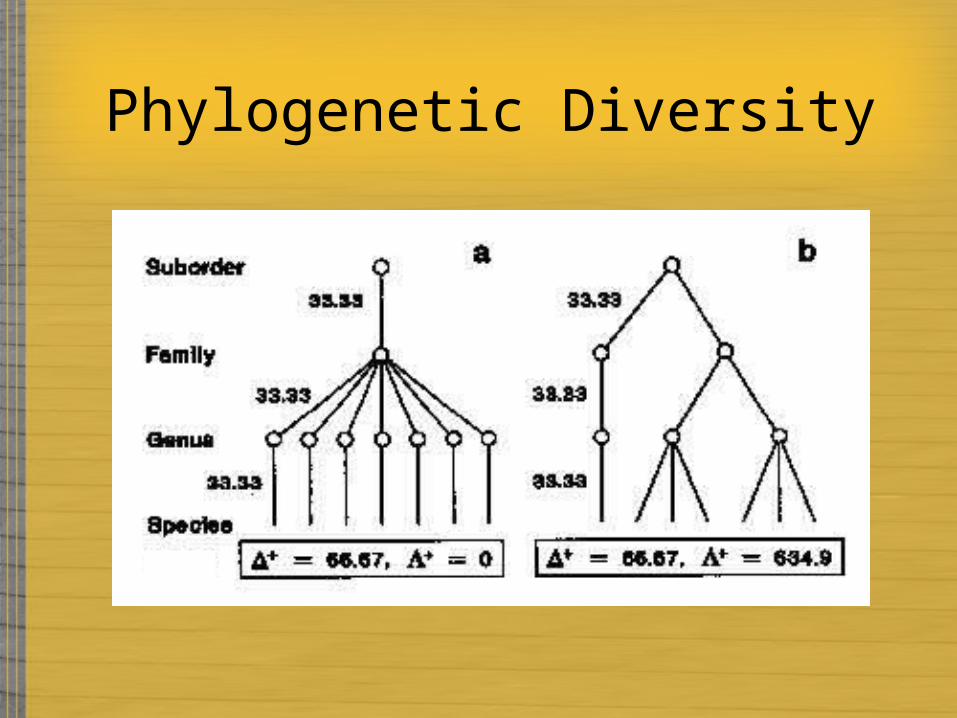
Phylogenetic Diversity
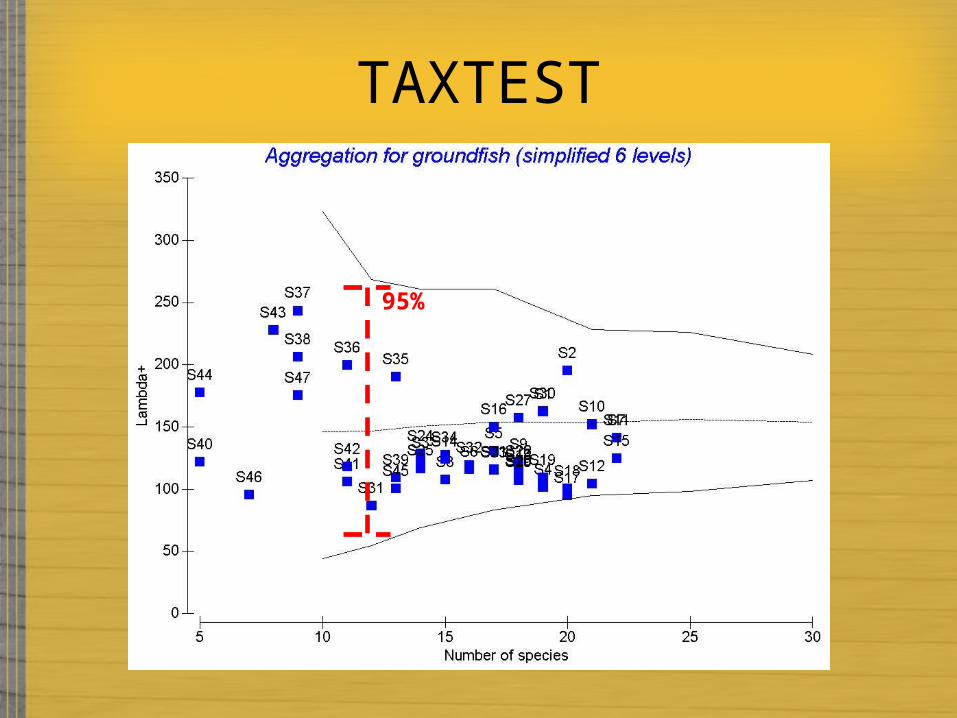
TAXTEST
95%

Sample Spreadsheet
Applications
More productive data mining Allow merging of historical and
diverse sample efforts Comparison to a variety of predictive
models to assess trends Universal comprehension
Acknowledgments US EPA Region IV Dr. Andrew Simon, USDA, National
Sedimentation Lab Drs. Angus and Marion, UAB Clarke, K.R. and Warwick, R.M. 1993.
Change in Marine Communities: An approach to Statistical Analysis and Interpretation, Bourne Press Ltd., Bournemouth, U.K.

Questions?


![Janna medina[1]](https://img.pdfslide.net/doc/110x75/5588f5c2d8b42a4e138b46d2/janna-medina1.jpg)
