Embed Size (px)
Citation preview

Copyright © 2006 MDIO Software
USER MANUAL

TABLE OF CONTENTS
1 INTRODUCTION........................................................................................................................ 1
2 PATTERN TYPES....................................................................................................................... 2
2.1 TRIANGLES ............................................................................................................................ 2 2.2 CHANNELS AND RECTANGLES ............................................................................................... 3 2.3 WEDGES ................................................................................................................................ 5 2.4 HEAD AND SHOULDERS ......................................................................................................... 6 2.5 DOUBLE TOP & DOUBLE BOTTOM......................................................................................... 6 2.6 TRIPLE TOP & TRIPLE BOTTOM ............................................................................................. 7
3 TRENDS AND BREAKOUT ...................................................................................................... 8
4 SEARCHING FOR PATTERNS ................................................................................................ 9
4.1 SEARCH BY CATEGORY ......................................................................................................... 9 4.2 SEARCH BY EXCHANGE ......................................................................................................... 9 4.3 SEARCH BY SYMBOL ........................................................................................................... 10 4.4 ADVANCED CRITERIA.......................................................................................................... 10 4.5 PATTERN CHARACTERISTICS ............................................................................................... 10 4.6 PATTERN QUALITY .............................................................................................................. 10 4.7 PATTERNS............................................................................................................................ 11
5 RESULTS.................................................................................................................................... 12
6 UPDATING RESULTS ............................................................................................................. 14
7 VIEWING RESULT IMAGES ................................................................................................. 15
8 DELETING A SEARCH ........................................................................................................... 16
9 APPLICATION SETTINGS ..................................................................................................... 17
1
1 Introduction
Welcome to the Autochartist.com help section. Please use the menu on the left to
navigate to the required help area.
Technical Analysis refers to the study of financial markets based on price movements.
It uses the assumption that the price of a share reflects all information about that share
including market sentiment as well as its perceived value.
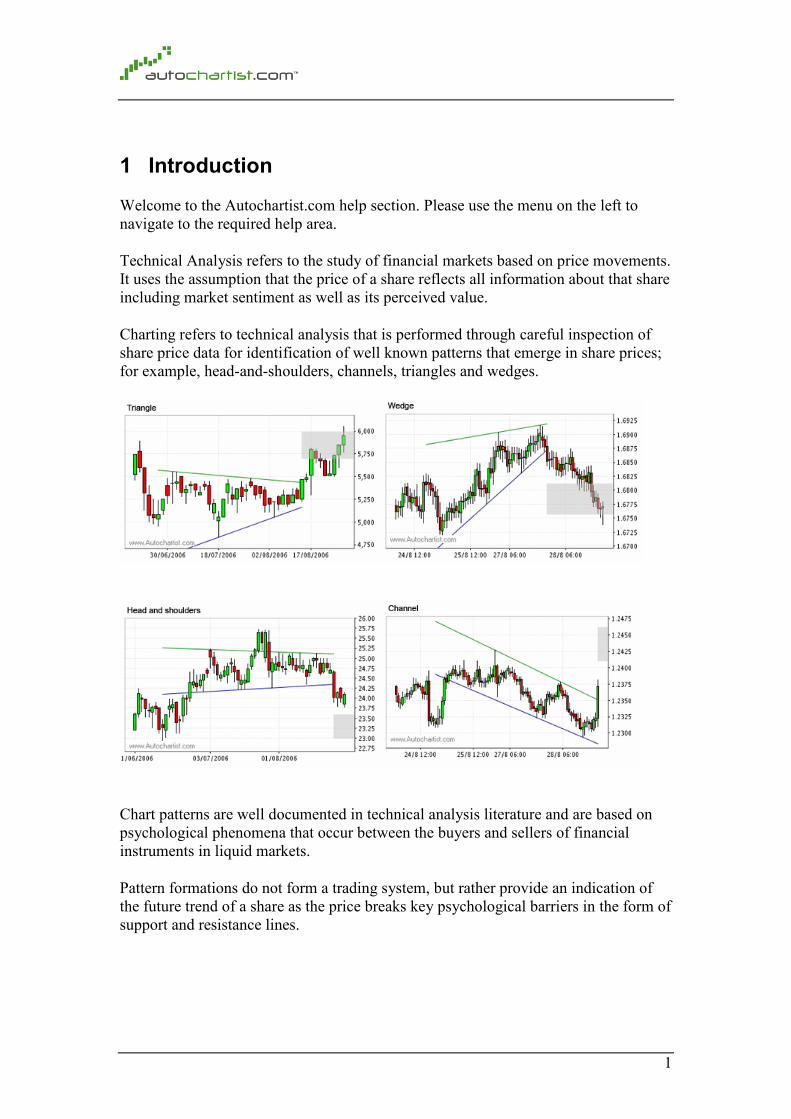
Charting refers to technical analysis that is performed through careful inspection of
share price data for identification of well known patterns that emerge in share prices;
for example, head-and-shoulders, channels, triangles and wedges.
Chart patterns are well documented in technical analysis literature and are based on
psychological phenomena that occur between the buyers and sellers of financial
instruments in liquid markets.
Pattern formations do not form a trading system, but rather provide an indication of
the future trend of a share as the price breaks key psychological barriers in the form of
support and resistance lines.
2
2 Pattern Types
There are numerous types of patterns, all named according to the shapes that the price
graphs form between the support and resistance lines. The general types of patterns
include Triangles, Channels, Wedges, and Head-and-Shoulders.
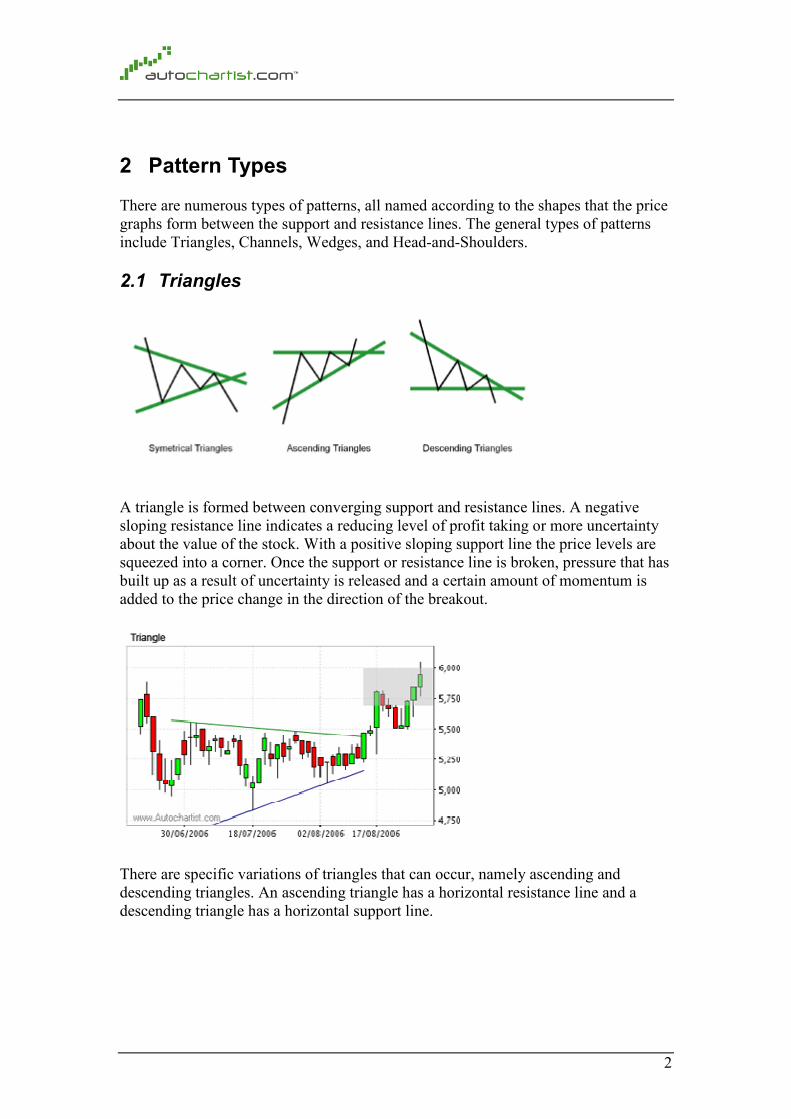
2.1 Triangles
A triangle is formed between converging support and resistance lines. A negative
sloping resistance line indicates a reducing level of profit taking or more uncertainty
about the value of the stock. With a positive sloping support line the price levels are
squeezed into a corner. Once the support or resistance line is broken, pressure that has
built up as a result of uncertainty is released and a certain amount of momentum is
added to the price change in the direction of the breakout.
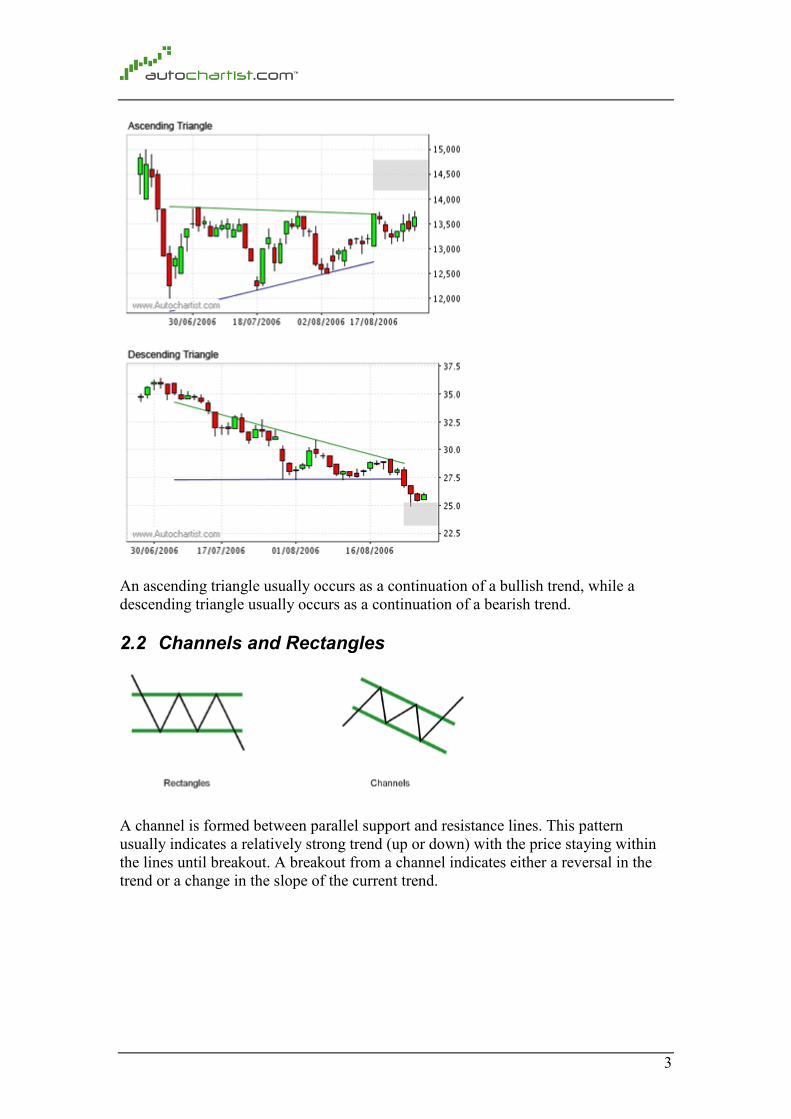
There are specific variations of triangles that can occur, namely ascending and
descending triangles. An ascending triangle has a horizontal resistance line and a
descending triangle has a horizontal support line.
3
An ascending triangle usually occurs as a continuation of a bullish trend, while a
descending triangle usually occurs as a continuation of a bearish trend.
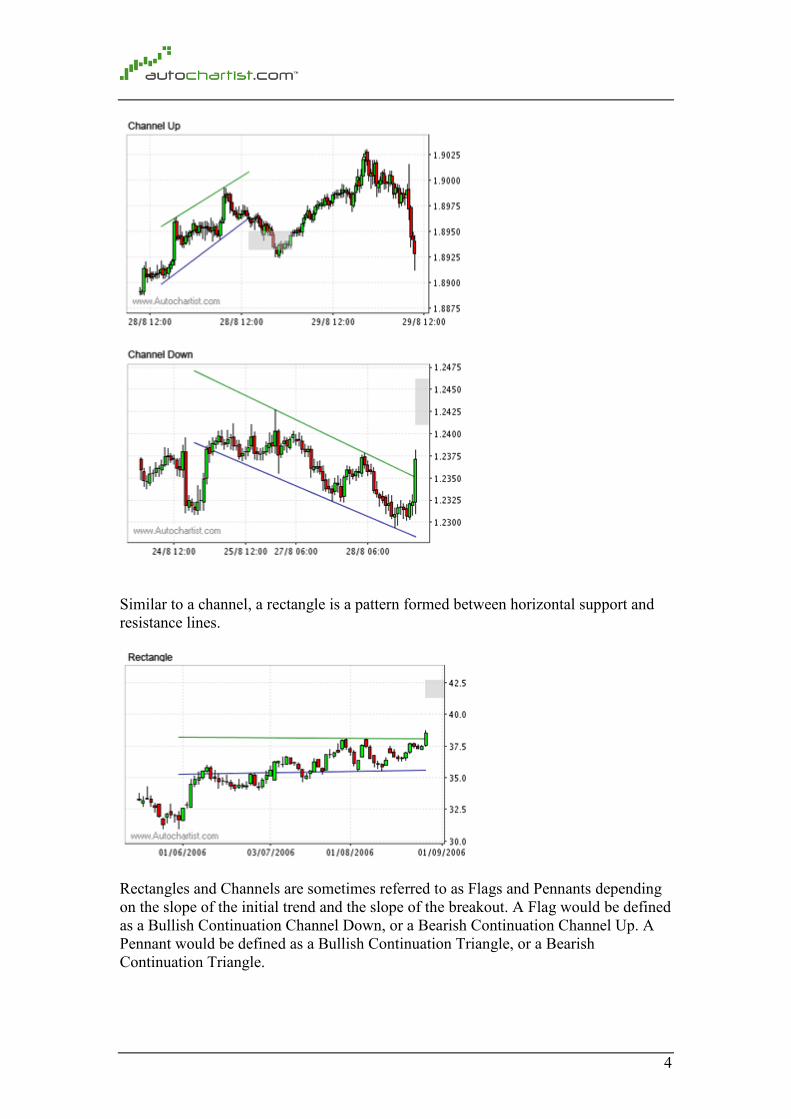
2.2 Channels and Rectangles
A channel is formed between parallel support and resistance lines. This pattern
usually indicates a relatively strong trend (up or down) with the price staying within
the lines until breakout. A breakout from a channel indicates either a reversal in the
trend or a change in the slope of the current trend.
4
Similar to a channel, a rectangle is a pattern formed between horizontal support and
resistance lines.
Rectangles and Channels are sometimes referred to as Flags and Pennants depending
on the slope of the initial trend and the slope of the breakout. A Flag would be defined
as a Bullish Continuation Channel Down, or a Bearish Continuation Channel Up. A
Pennant would be defined as a Bullish Continuation Triangle, or a Bearish
Continuation Triangle.
5
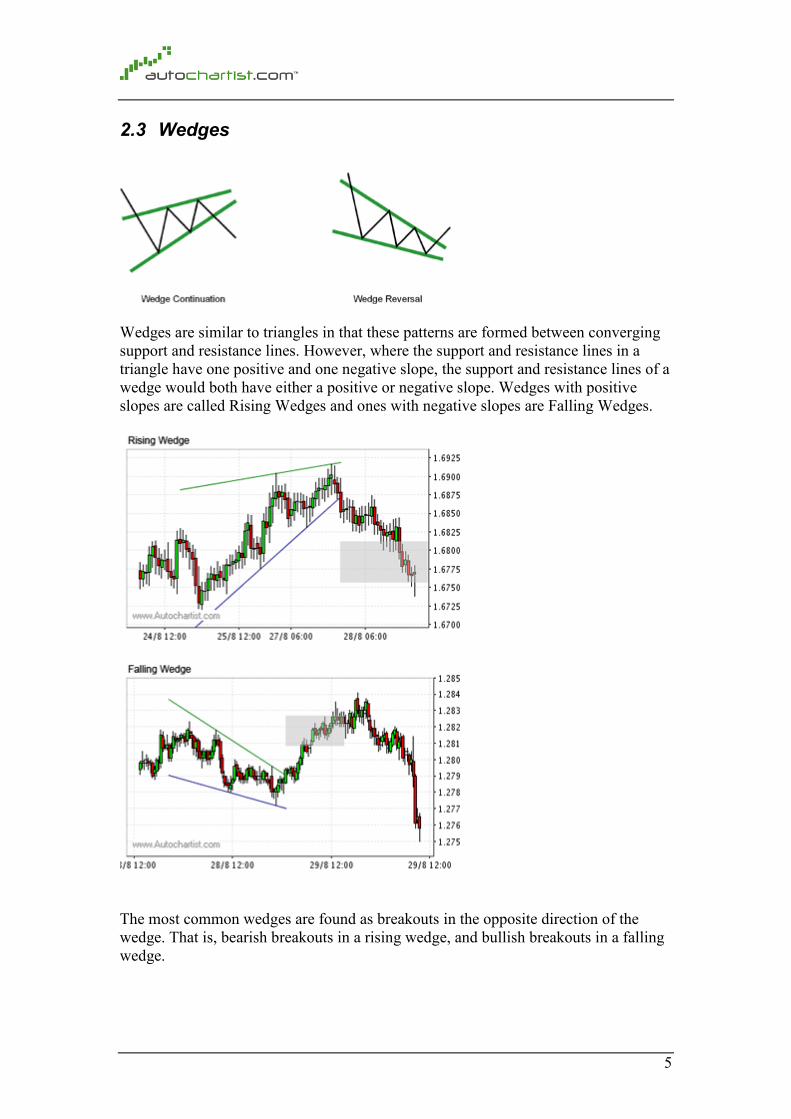
2.3 Wedges
Wedges are similar to triangles in that these patterns are formed between converging
support and resistance lines. However, where the support and resistance lines in a
triangle have one positive and one negative slope, the support and resistance lines of a
wedge would both have either a positive or negative slope. Wedges with positive
slopes are called Rising Wedges and ones with negative slopes are Falling Wedges.
The most common wedges are found as breakouts in the opposite direction of the
wedge. That is, bearish breakouts in a rising wedge, and bullish breakouts in a falling
wedge.
6
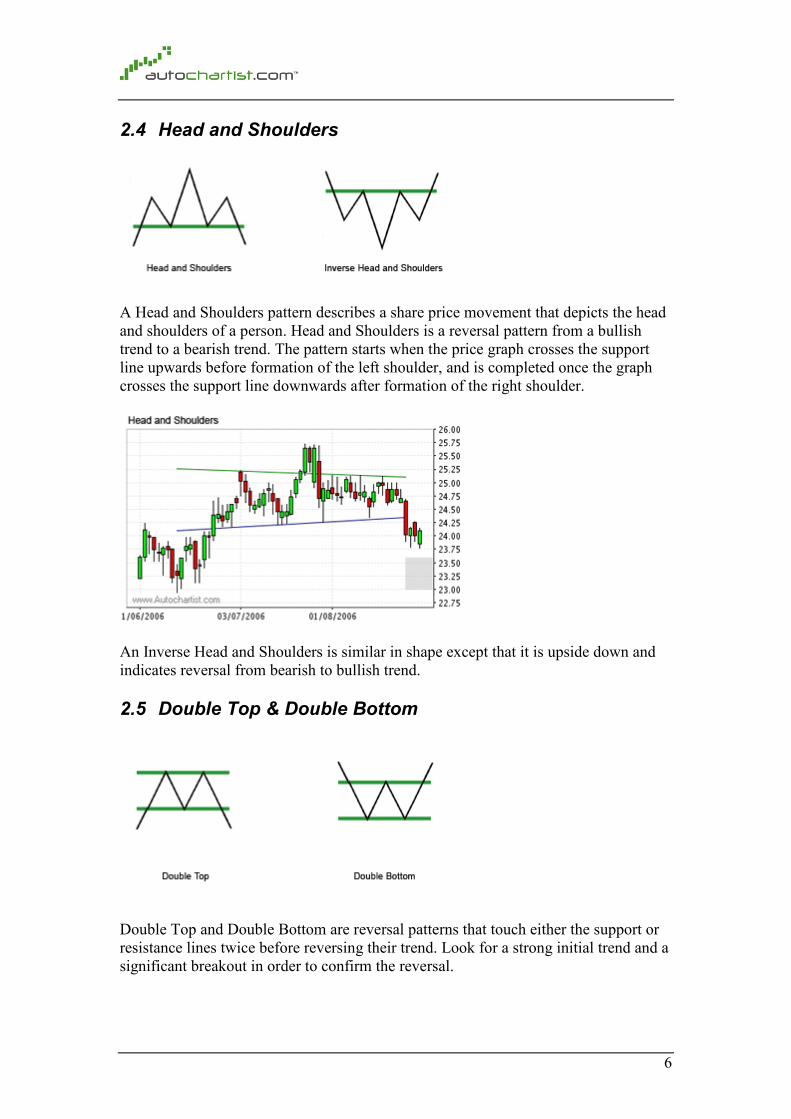
2.4 Head and Shoulders
A Head and Shoulders pattern describes a share price movement that depicts the head
and shoulders of a person. Head and Shoulders is a reversal pattern from a bullish
trend to a bearish trend. The pattern starts when the price graph crosses the support
line upwards before formation of the left shoulder, and is completed once the graph
crosses the support line downwards after formation of the right shoulder.
An Inverse Head and Shoulders is similar in shape except that it is upside down and
indicates reversal from bearish to bullish trend.
2.5 Double Top & Double Bottom
Double Top and Double Bottom are reversal patterns that touch either the support or
resistance lines twice before reversing their trend. Look for a strong initial trend and a
significant breakout in order to confirm the reversal.

7
2.6 Triple Top & Triple Bottom
Triple Top and Triple Bottom are reversal patterns that touch either the support or
resistance lines three times before reversing their trend. This is a stronger indicator of
a trend change than a Double Top or Double Bottom. Look for a strong initial trend
and a significant breakout in order to confirm the reversal.
8
3 Trends and breakout
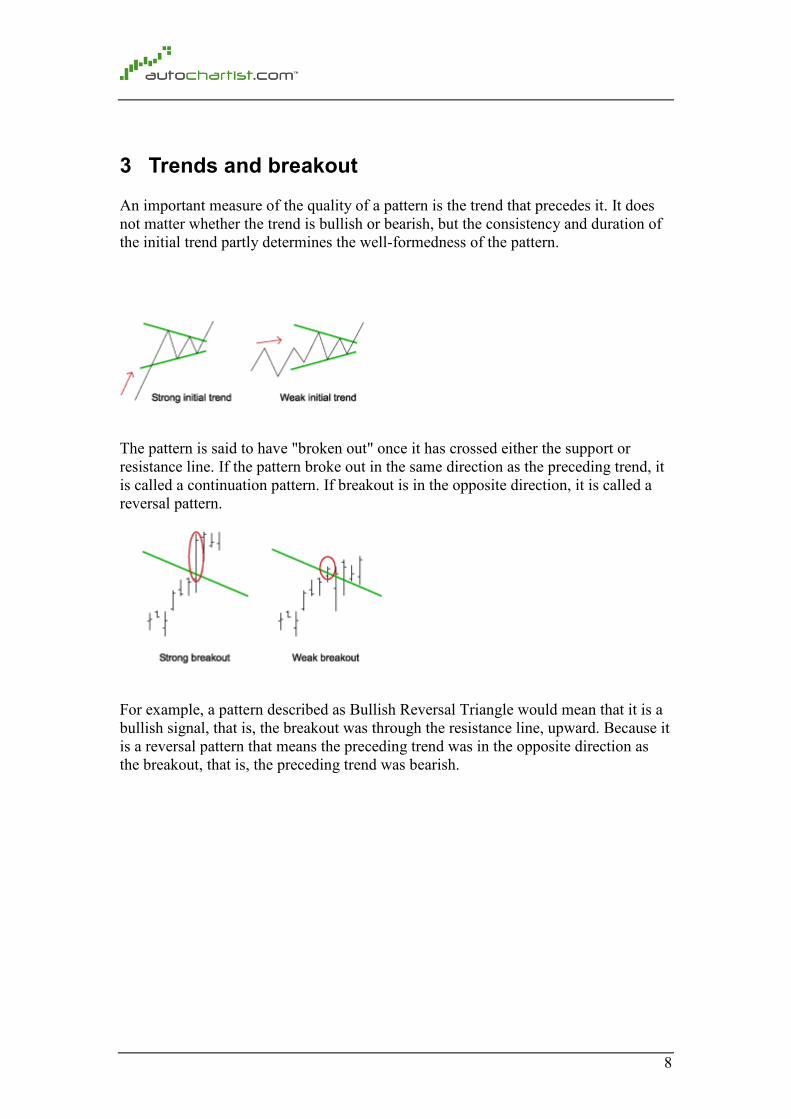
An important measure of the quality of a pattern is the trend that precedes it. It does
not matter whether the trend is bullish or bearish, but the consistency and duration of
the initial trend partly determines the well-formedness of the pattern.
The pattern is said to have "broken out" once it has crossed either the support or
resistance line. If the pattern broke out in the same direction as the preceding trend, it
is called a continuation pattern. If breakout is in the opposite direction, it is called a
reversal pattern.
For example, a pattern described as Bullish Reversal Triangle would mean that it is a
bullish signal, that is, the breakout was through the resistance line, upward. Because it
is a reversal pattern that means the preceding trend was in the opposite direction as
the breakout, that is, the preceding trend was bearish.
9
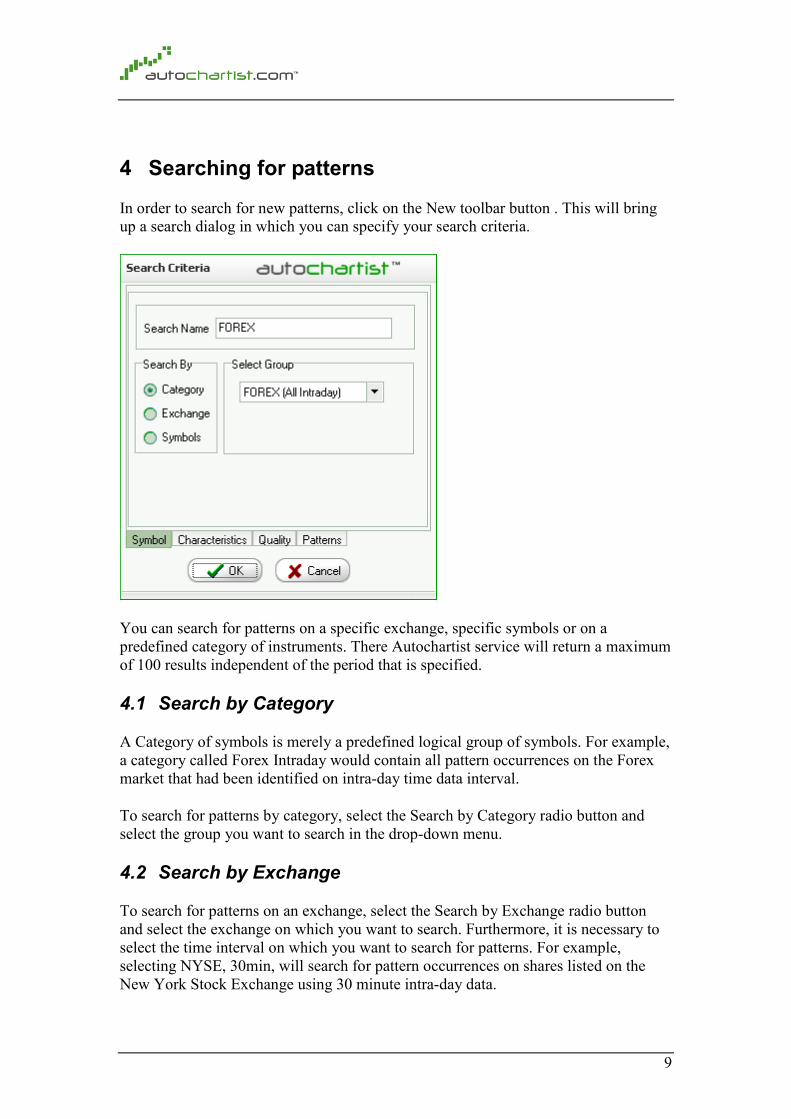
4 Searching for patterns
In order to search for new patterns, click on the New toolbar button . This will bring
up a search dialog in which you can specify your search criteria.
You can search for patterns on a specific exchange, specific symbols or on a
predefined category of instruments. There Autochartist service will return a maximum
of 100 results independent of the period that is specified.
4.1 Search by Category
A Category of symbols is merely a predefined logical group of symbols. For example,
a category called Forex Intraday would contain all pattern occurrences on the Forex
market that had been identified on intra-day time data interval.
To search for patterns by category, select the Search by Category radio button and
select the group you want to search in the drop-down menu.
4.2 Search by Exchange
To search for patterns on an exchange, select the Search by Exchange radio button
and select the exchange on which you want to search. Furthermore, it is necessary to
select the time interval on which you want to search for patterns. For example,
selecting NYSE, 30min, will search for pattern occurrences on shares listed on the
New York Stock Exchange using 30 minute intra-day data.
10
4.3 Search By Symbol
To search for signals on a specific symbol, select the Search by Symbol radio button
and enter the details of the symbol you want to look for. Autochartist does not verify
the validity of the symbols entered - if an incorrect symbol is entered then no patterns
will be returned.
4.4 Advanced Criteria
Once you have entered which symbols, exchanges or groups to search, you can adjust
the more advanced search criteria by switching between different tabs on the search
window.
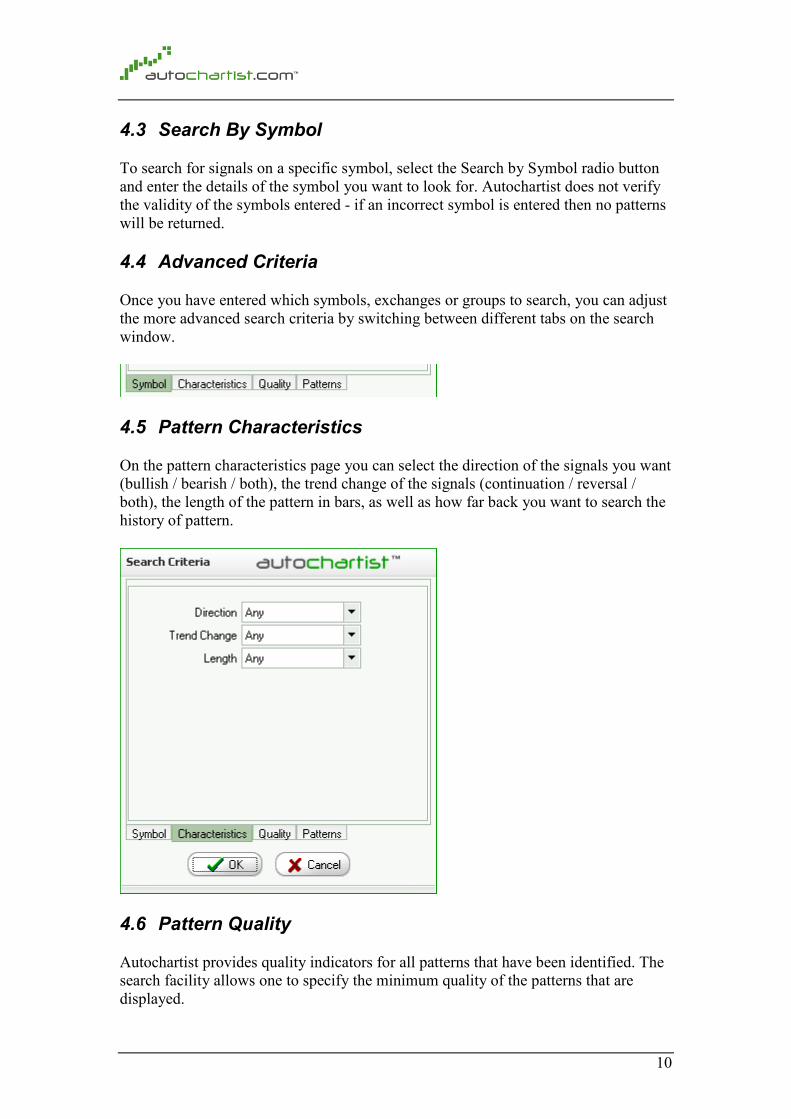
4.5 Pattern Characteristics
On the pattern characteristics page you can select the direction of the signals you want
(bullish / bearish / both), the trend change of the signals (continuation / reversal /
both), the length of the pattern in bars, as well as how far back you want to search the
history of pattern.
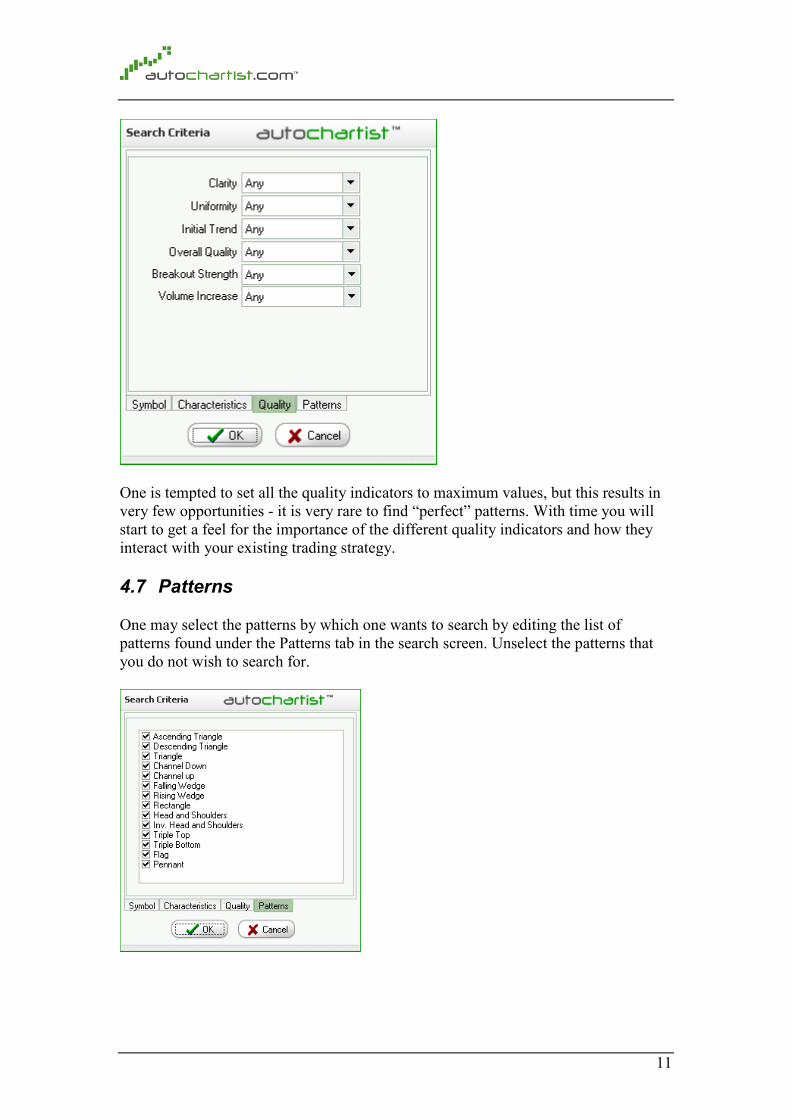
4.6 Pattern Quality
Autochartist provides quality indicators for all patterns that have been identified. The
search facility allows one to specify the minimum quality of the patterns that are
displayed.
11
One is tempted to set all the quality indicators to maximum values, but this results in
very few opportunities - it is very rare to find “perfect” patterns. With time you will
start to get a feel for the importance of the different quality indicators and how they
interact with your existing trading strategy.
4.7 Patterns
One may select the patterns by which one wants to search by editing the list of
patterns found under the Patterns tab in the search screen. Unselect the patterns that
you do not wish to search for.
12
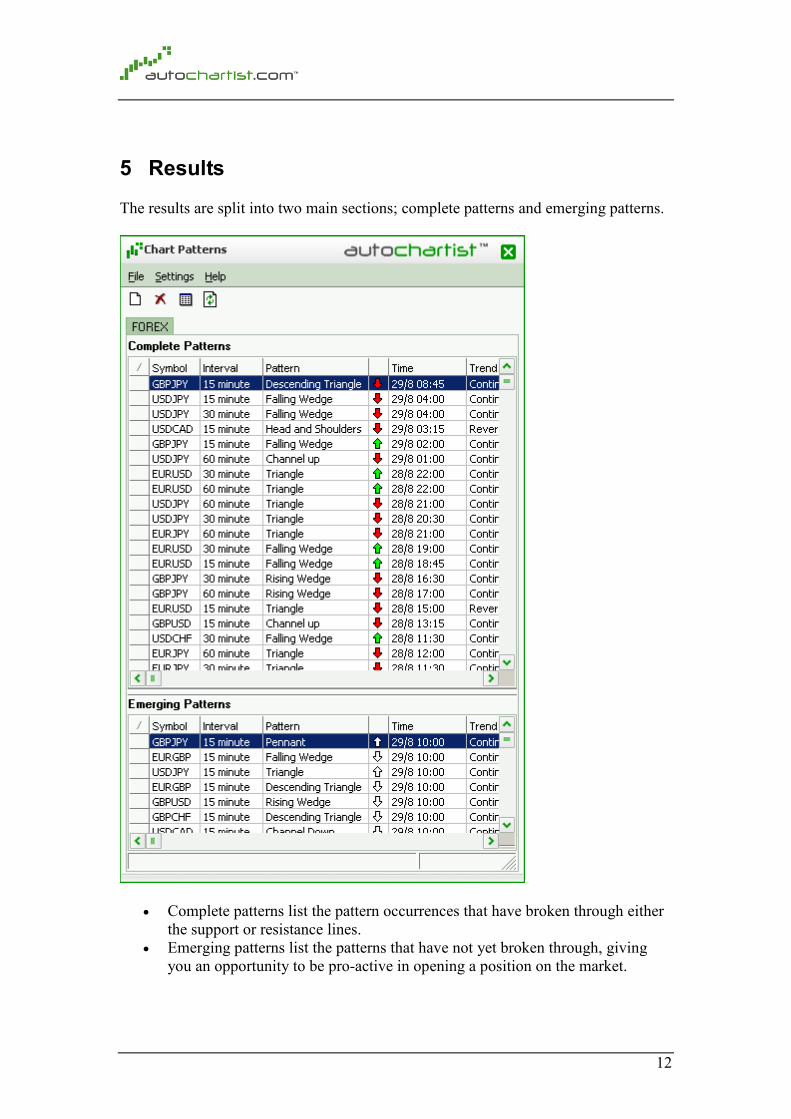
5 Results
The results are split into two main sections; complete patterns and emerging patterns.
• Complete patterns list the pattern occurrences that have broken through either
the support or resistance lines.
• Emerging patterns list the patterns that have not yet broken through, giving
you an opportunity to be pro-active in opening a position on the market.
13
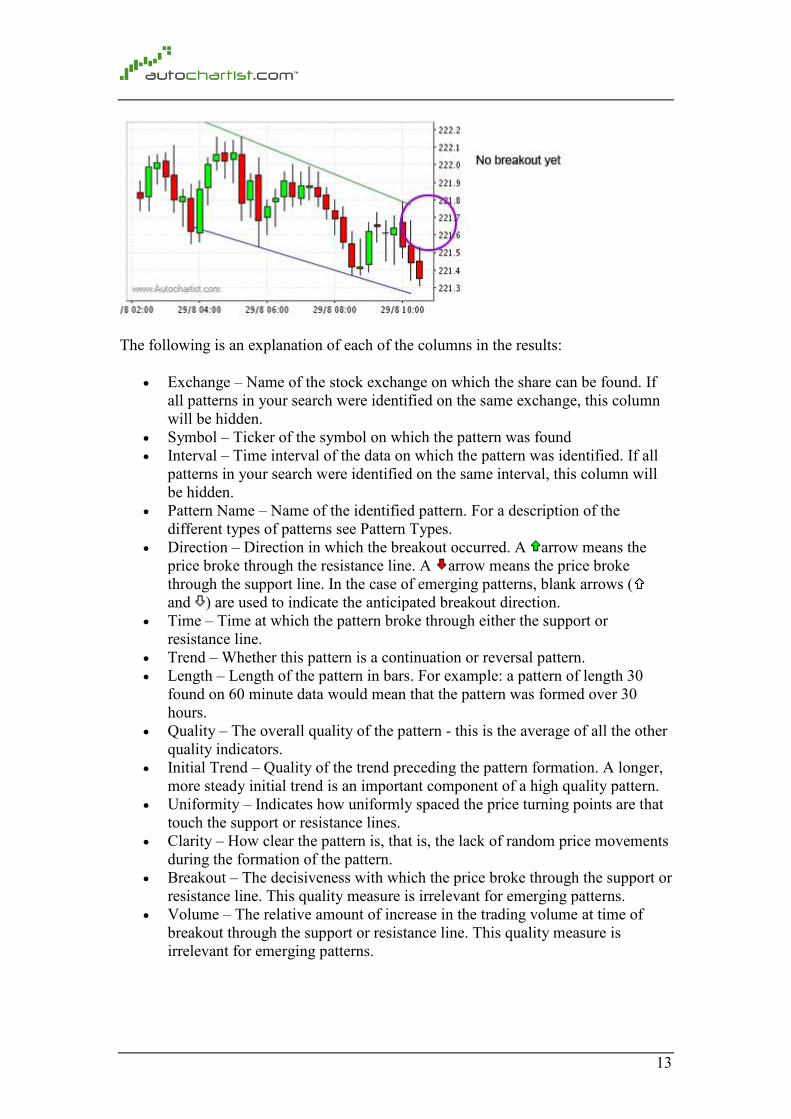
The following is an explanation of each of the columns in the results:
• Exchange – Name of the stock exchange on which the share can be found. If
all patterns in your search were identified on the same exchange, this column
will be hidden.
• Symbol – Ticker of the symbol on which the pattern was found
• Interval – Time interval of the data on which the pattern was identified. If all
patterns in your search were identified on the same interval, this column will
be hidden.
• Pattern Name – Name of the identified pattern. For a description of the
different types of patterns see Pattern Types.
• Direction – Direction in which the breakout occurred. A arrow means the
price broke through the resistance line. A arrow means the price broke
through the support line. In the case of emerging patterns, blank arrows (
and ) are used to indicate the anticipated breakout direction.
• Time – Time at which the pattern broke through either the support or
resistance line.
• Trend – Whether this pattern is a continuation or reversal pattern.
• Length – Length of the pattern in bars. For example: a pattern of length 30
found on 60 minute data would mean that the pattern was formed over 30
hours.
• Quality – The overall quality of the pattern - this is the average of all the other
quality indicators.
• Initial Trend – Quality of the trend preceding the pattern formation. A longer,
more steady initial trend is an important component of a high quality pattern.
• Uniformity – Indicates how uniformly spaced the price turning points are that
touch the support or resistance lines.
• Clarity – How clear the pattern is, that is, the lack of random price movements
during the formation of the pattern.
• Breakout – The decisiveness with which the price broke through the support or
resistance line. This quality measure is irrelevant for emerging patterns.
• Volume – The relative amount of increase in the trading volume at time of
breakout through the support or resistance line. This quality measure is
irrelevant for emerging patterns.
14
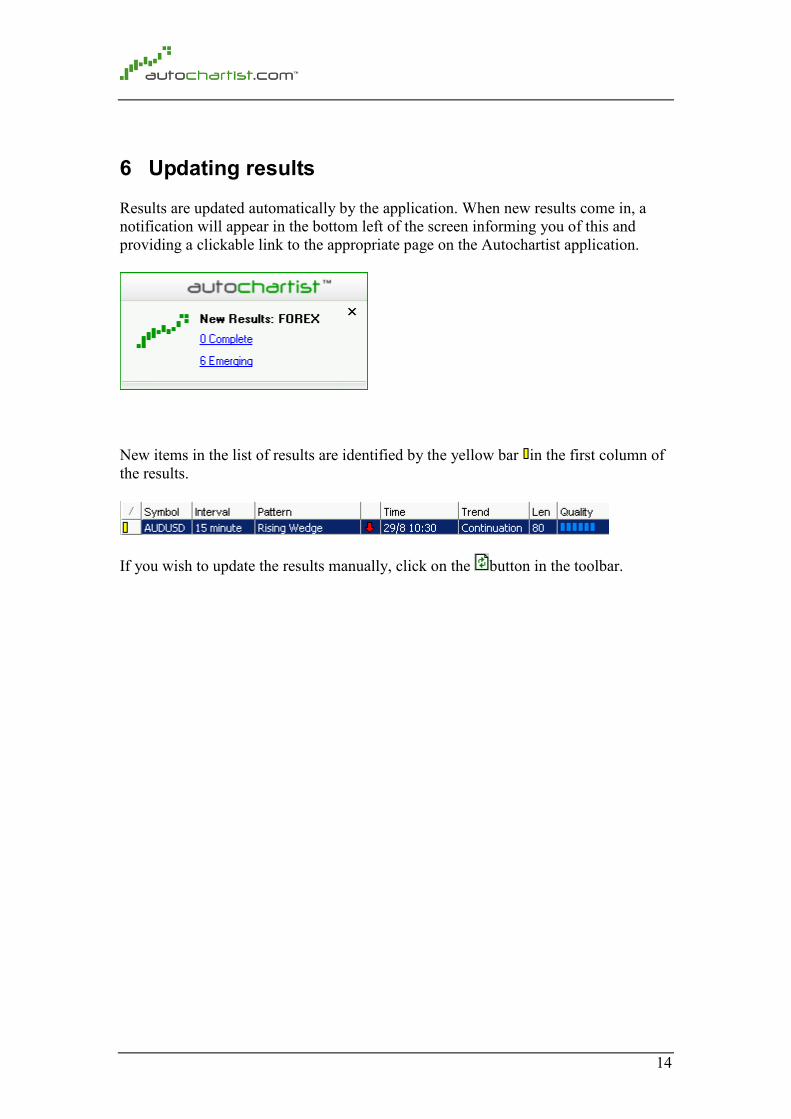
6 Updating results
Results are updated automatically by the application. When new results come in, a
notification will appear in the bottom left of the screen informing you of this and
providing a clickable link to the appropriate page on the Autochartist application.
New items in the list of results are identified by the yellow bar in the first column of
the results.
If you wish to update the results manually, click on the button in the toolbar.
15
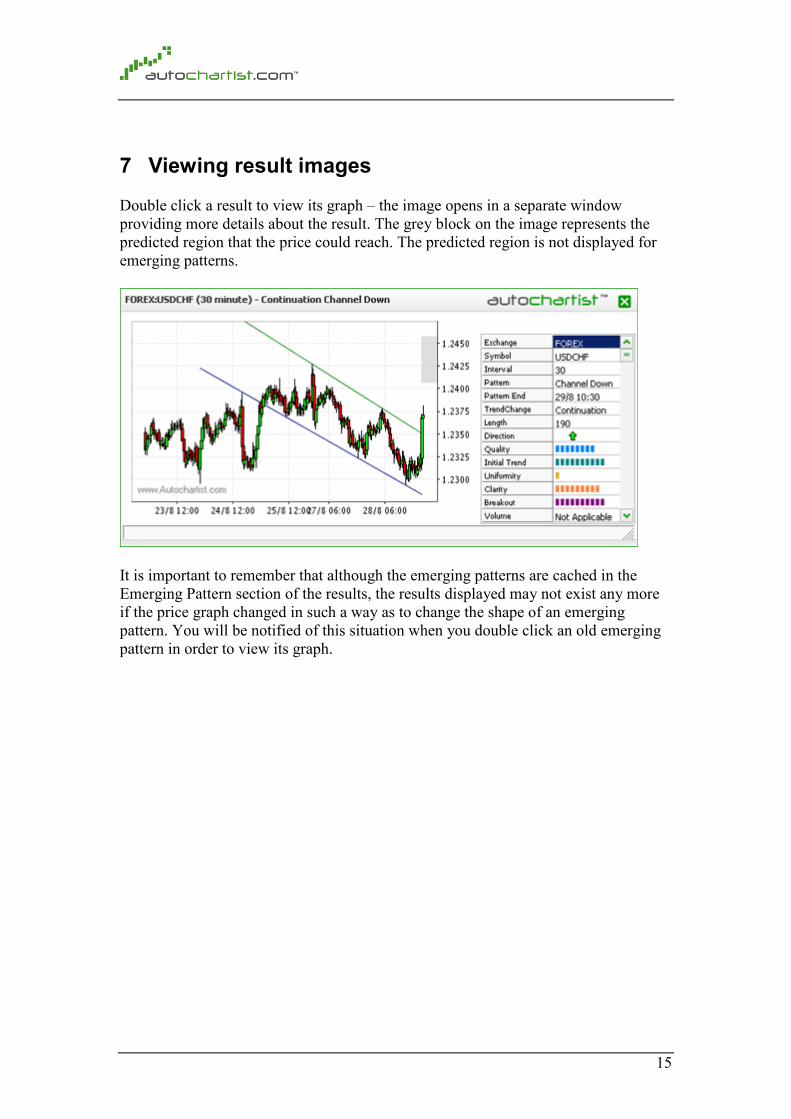
7 Viewing result images
Double click a result to view its graph – the image opens in a separate window
providing more details about the result. The grey block on the image represents the
predicted region that the price could reach. The predicted region is not displayed for
emerging patterns.
It is important to remember that although the emerging patterns are cached in the
Emerging Pattern section of the results, the results displayed may not exist any more
if the price graph changed in such a way as to change the shape of an emerging
pattern. You will be notified of this situation when you double click an old emerging
pattern in order to view its graph.

16
8 Deleting a search
To delete a search screen click on the Delete toolbar button . This will remove the
current search off the screen.
The application must have at least one active search screen, so if you want to
deactivate Autochartist completely, simply logoff by clicking the Logoff option on the
File menu.
17
9 Application settings
There are configuration settings that can be set on the application. Click on the
Options Setting menu item to bring up a settings window.
• Use separate window for each image – select this option if you want every
image that you double-click to open in a separate window.
• Complete Pattern Notifications – Settings for when a complete pattern has
been found:
o 1. Play Sound – select this option if you want the application to play an
audible sound when a complete pattern is found.
o 2. Show Window – select this option if you want the application to
display a popup window when a complete pattern is found.
• Emerging Pattern Notifications – Settings for when an emerging pattern has
been found:
o 1. Play Sound – select this option if you want the application to play an
audible sound when an emerging pattern is found.
o 2. Show Window – select this option if you want the application to
display a popup window when am emerging pattern is found.
• Notification Window Display – Sets the duration the notification popup
window is displayed when a new chart pattern is identified.
• Connect automatically – select this option if you want the application to
automatically connect to the Autochartist service when it is started.
• Connection Timeout – set the timeout that the application will use when
connecting to the Autochartist service. For dialup users this should be set high.
• Data Timeout – set the timeout that the application will use when downloading
information from the Autochartist service. For dialup users this should be set
high.
• Proxy Settings – If you make use of a proxy server, set the proxy connection
options in the Proxy section of the settings window. Please ask your network
administrator for help with these settings.