Embed Size (px)
Citation preview

DOC027.53.00792
LICO 500
USER MANUAL
March 2007 Edition 1
©Hach Lange GmbH, 2007. All rights reserved. Printed in Germany.sd/sk

2

Table of contents
Section 1 Specifications ........................................................................................................................................ 5
Section 2 General Information .............................................................................................................................. 72.1 Safety information .............................................................................................................................................. 7
2.1.1 Use of hazard information ......................................................................................................................... 72.1.2 Precautionary labels ................................................................................................................................. 72.1.3 Chemical and Biological Safety ................................................................................................................ 7
2.2 Overview of product ........................................................................................................................................... 8
Section 3 Installation ............................................................................................................................................. 93.1 Unpack the instrument ....................................................................................................................................... 93.2 Environment considerations ............................................................................................................................... 93.3 Power connections ........................................................................................................................................... 103.4 Interfaces ......................................................................................................................................................... 113.5 Cell compartments and cell adapter ................................................................................................................ 12
3.5.1 Cell compartments and adapter .............................................................................................................. 123.5.2 Installation of the cell adapter ................................................................................................................. 13
3.6 Beam path ........................................................................................................................................................ 14
Section 4 Start Up ................................................................................................................................................ 154.1 Power the instrument on and off ...................................................................................................................... 154.2 Language selection .......................................................................................................................................... 154.3 Self-Check ....................................................................................................................................................... 154.4 Characteristics in continuous operation ........................................................................................................... 16
Section 5 Standard Operations ........................................................................................................................... 175.1 Overview .......................................................................................................................................................... 17
5.1.1 Tips for the use of the touch screen ........................................................................................................ 175.1.2 Use of the alphanumeric keypad ............................................................................................................ 175.1.3 Main Menu .............................................................................................................................................. 18
5.2 Instrument Setup mode .................................................................................................................................... 195.2.1 Operator ID ............................................................................................................................................. 195.2.2 Sample ID ............................................................................................................................................... 205.2.3 Date and time .......................................................................................................................................... 225.2.4 Display and sound preferences .............................................................................................................. 225.2.5 Lamp control ........................................................................................................................................... 225.2.6 PC and printer ......................................................................................................................................... 24
5.2.6.1 Printer setup ............................................................................................................................... 245.2.6.2 PC setup ..................................................................................................................................... 265.2.6.3 Print data .................................................................................................................................... 27
5.2.7 Password ................................................................................................................................................ 285.2.7.1 Deactivate a password ............................................................................................................... 29
5.2.8 Select color ............................................................................................................................................. 305.3 Store, recall, send and delete data .................................................................................................................. 31
5.3.1 Store, recall, send and delete data from the color log and data log ........................................................ 315.3.1.1 Auto/manual data storage ........................................................................................................... 315.3.1.2 Recall stored data from the color log or the data log .................................................................. 315.3.1.3 Send data from the color log or the data log ............................................................................... 335.3.1.4 Delete stored data from the color log or the data log .................................................................. 35
5.3.2 Store, recall, send and delete data from wavelength scan and time course ........................................... 365.3.2.1 Data storage from wavelength scan or time course ................................................................... 365.3.2.2 Recall stored data from wavelength scan or time course ........................................................... 365.3.2.3 Send data from wavelength scan or time course ........................................................................ 375.3.2.4 Delete stored data from wavelength scan or time course ........................................................... 39
5.4 Sampling and sample preparation ................................................................................................................... 40
1

Table of Contents
5.5 Color measurement ......................................................................................................................................... 415.5.1 Take a color measurement ..................................................................................................................... 42
5.5.1.1 Touch-sensitive areas on the measurement window .................................................................. 435.5.1.2 Parameter setup options ............................................................................................................. 445.5.1.3 Change the color scale after a measurement ............................................................................. 455.5.1.4 Change the measuring range after a measurement ................................................................... 46
5.5.2 Take a Pharm. Eur. color measurement ................................................................................................. 465.5.3 Take a US Pharmacopoeia color measurement ..................................................................................... 505.5.4 Determine the Iodine color value ............................................................................................................ 505.5.5 Determine the Hazen color value (Pt-Co or APHA-method) ................................................................... 515.5.6 Determine the Gardner color value ......................................................................................................... 515.5.7 Determine the Klett color number ........................................................................................................... 515.5.8 Mineral oil color value (ASTM D 1500 and ISO 2049) ............................................................................ 515.5.9 Determine the Saybolt color number (ASTM D 156) .............................................................................. 525.5.10 AOCS Cc 13 e (Lovibond®) scale ........................................................................................................ 525.5.11 Determine the Yellowness-Index (ASTM D 1925) ................................................................................ 525.5.12 Hess-Ives color number ........................................................................................................................ 525.5.13 The ADMI color number ........................................................................................................................ 53
5.6 Color difference measurement ......................................................................................................................... 545.6.1 Take a color difference measurement .................................................................................................... 54
5.6.1.1 View graph/table/values .............................................................................................................. 565.6.2 Take a color difference measurement with stored reference values ...................................................... 575.6.3 Add a reference to the reference list ....................................................................................................... 58
5.7 Photometry ....................................................................................................................................................... 595.7.1 Single Wavelength (absorbance, concentration and transmittance measurements) .............................. 59
5.7.1.1 Set up single wavelength mode .................................................................................................. 605.7.1.2 Take single wavelength measurements (single reading) ............................................................ 625.7.1.3 Take single wavelength measurements (continuous readings) .................................................. 62
5.7.2 Multi-Wavelength mode – measurements at more than one wavelength ............................................... 625.7.2.1 Set the reading mode at different wavelengths .......................................................................... 625.7.2.2 Complete a measurement in the multi wavelength mode ........................................................... 65
5.7.3 Wavelength scan mode – recording of absorbance and transmission spectrums .................................. 655.7.3.1 Set up the wavelength scan ........................................................................................................ 665.7.3.2 Wavelength scan reading ........................................................................................................... 685.7.3.3 Work with reference scans ......................................................................................................... 70
5.7.4 Time course of absorbance/transmittance .............................................................................................. 715.7.4.1 Time course setup parameters ................................................................................................... 715.7.4.2 Time course scan reading .......................................................................................................... 735.7.4.3 Analysis of time course data ....................................................................................................... 745.7.4.4 Navigation of a time scan or a time scan analysis ...................................................................... 74
Section 6 Advanced Operations ......................................................................................................................... 756.1 System checks ................................................................................................................................................. 75
6.1.1 Instrument information ............................................................................................................................ 756.1.2 Upgrade of the instrument software ........................................................................................................ 766.1.3 Optical checks ......................................................................................................................................... 76
6.1.3.1 Verification kit ............................................................................................................................. 766.1.4 Output checks ......................................................................................................................................... 786.1.5 Lamp history ........................................................................................................................................... 78
6.1.5.1 Factory service ........................................................................................................................... 796.1.6 Service time ............................................................................................................................................ 796.1.7 Instrument backup .................................................................................................................................. 81
2

Table of Contents
Section 7 Maintenance ........................................................................................................................................ 857.1 Cleaning requirements ..................................................................................................................................... 85
7.1.1 Housing and cell compartment ............................................................................................................... 857.1.2 Display .................................................................................................................................................... 857.1.3 Cuvettes/sample cells ............................................................................................................................. 85
7.2 Lamp replacement ........................................................................................................................................... 867.3 Filter pad maintenance .................................................................................................................................... 88
7.3.1 Filter pad replacement ............................................................................................................................ 88
Section 8 Troubleshooting .................................................................................................................................. 91
Section 9 Replacement Parts .............................................................................................................................. 939.1 Replacement parts ........................................................................................................................................... 93
Section 10 Contact Information .......................................................................................................................... 95
Section 11 Warranty, liability and complaints ................................................................................................... 97
Index ...................................................................................................................................................................... 99
3

4

Section 1 Specifications
Specifications are subject to change without notice.
Performance specifications
Operating mode Color measurement, color difference measurement, Absorbance and Concentration
Colorimetric evaluation All color values calculated for standard illuminant C of ASTM E 308 and a 2°standard observer.
Source lamp Gas-filled Tungsten (visible)
Wavelength range 320–1100 nm
Wavelength accuracy ± 1.5 nm (wavelength range 340–900 nm)
Wavelength reproducibility ≤ 0.1 nm
Wavelength resolution 1 nm
Wavelength calibration Automatic
Wavelength range for color measurement 380 to 720 nm step 10 nm
Scanning speed ≥ 12 nm/s (in steps of 1nm)
Spectral bandwidth 5 nm
Photometric measuring range ± 3.5 Abs (wavelength range 340–900 nm)
Photometric accuracy5 m Abs at 0.0 to 0.5 Abs1% at 0.50 to 2.0 Abs
Photometric linearity< 0.5% to 2 Abs< = 1% at > 2 Abs with neutral glass at 546 nm
Stray light < 0.1% T at 340 nm with NaNO2
Data log500 color measurements, 50 color reference values, 500 photometric measurements, 20 wavelength scans, 20 time scans
Physical and environmental specifications
Width 368 mm (14.5 in.)
Height 144 mm (5.7 in.)
Depth 359 mm (14.1 in.)
Weight 6.4 kg (14.11 Ib)
Operating requirements 10–40 °C (50–104 °F), max. 80% relative humidity (non-condensing)
Storage requirements –40–60 °C (-40–140 °F) max. 80% relative humidity (non-condensing)
Additional technical data
Mains connection External power supply: 100-240V/50-60Hz (Input); 15V/30VA (output)
InterfacesUse only screened cables with maximum length of 3 meters.1 x USB type A1 x USB type B
Enclosure rating IP3X
Protection Class Class II
5

6
Section 2 General Information
2.1 Safety informationPlease read this entire manual before unpacking, setting up or operating this equipment. Pay attention to all danger, warning and caution statements. Failure to do so could result in serious injury to the operator or damage to the equipment.
To make sure that the protection provided by this equipment is not impaired, do not use or install this equipment in any manner other than that specified in this manual.
2.1.1 Use of hazard information
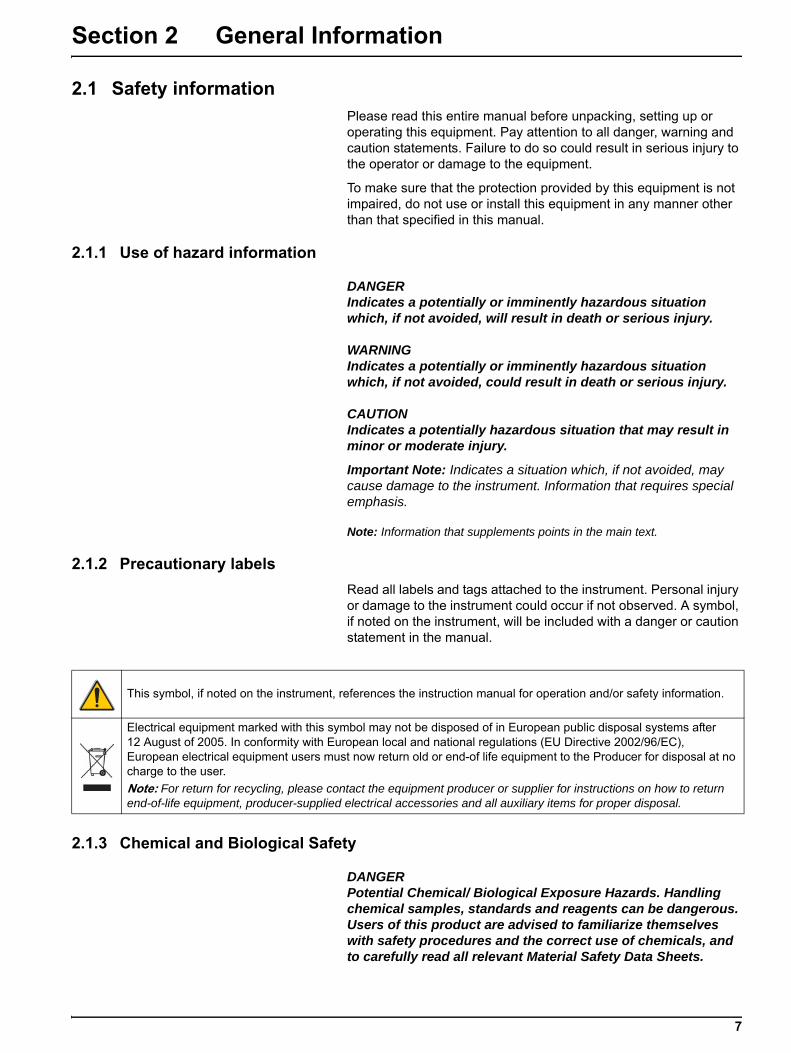
DANGERIndicates a potentially or imminently hazardous situation which, if not avoided, will result in death or serious injury.
WARNINGIndicates a potentially or imminently hazardous situation which, if not avoided, could result in death or serious injury.
CAUTIONIndicates a potentially hazardous situation that may result in minor or moderate injury.
Important Note: Indicates a situation which, if not avoided, may cause damage to the instrument. Information that requires special emphasis.
Note: Information that supplements points in the main text.
2.1.2 Precautionary labelsRead all labels and tags attached to the instrument. Personal injury or damage to the instrument could occur if not observed. A symbol, if noted on the instrument, will be included with a danger or caution statement in the manual.
2.1.3 Chemical and Biological Safety
DANGERPotential Chemical/ Biological Exposure Hazards. Handling chemical samples, standards and reagents can be dangerous. Users of this product are advised to familiarize themselves with safety procedures and the correct use of chemicals, and to carefully read all relevant Material Safety Data Sheets.
This symbol, if noted on the instrument, references the instruction manual for operation and/or safety information.
Electrical equipment marked with this symbol may not be disposed of in European public disposal systems after 12 August of 2005. In conformity with European local and national regulations (EU Directive 2002/96/EC), European electrical equipment users must now return old or end-of life equipment to the Producer for disposal at no charge to the user. Note: For return for recycling, please contact the equipment producer or supplier for instructions on how to return end-of-life equipment, producer-supplied electrical accessories and all auxiliary items for proper disposal.
7

General Information
Normal operation of this instrument may involve the use of hazardous chemicals or biologically harmful samples.
• The user must observe all cautionary information printed on the original solution containers and safety data sheet prior to their use.
• All waste solutions must be disposed in accordance with local and national law.
• The type of protective equipment must be selected according to the concentration and amount of the dangerous substance at the specific workplace.
2.2 Overview of productThe LICO 500 is a VIS spectrophotometer with a wavelength range of 320 to 1100 nm. The instrument comes with a complete set of application programs and multi-language support.
The LICO 500 contains the following application modes: Color scales (pre installed), Single Wavelength Mode, Multi-Wavelength Mode, Wavelength Scan and Time Course Mode.
The LICO 500 provides digital readouts in direct concentration units, absorbance or percent transmittance.
The LICO 500 can carry out an exact colorimetric evaluation in conformity with ISO/ASTM standards with just a single measurement and display the result in terms of traditional color systems such as Iodine, Hazen or Gardner color numbers.
Besides the 20 color indexes, transmittance and absorbance can be measured at individual wavelengths, so that the LICO 500 can also be universally used for analytical purposes in the laboratory.
8

Section 3 Installation
WARNINGElectrical and Fire Hazards. Use only the provided power supply. Only qualified personnel should conduct the tasks described in this section of the manual.
3.1 Unpack the instrumentThe LICO 500 comes packaged with the following items:
• LICO 500
• Dust cover
• External power supply, including 4 adapter for EU, UK, USA and AUS/China
• LICO 500 user manual
• Quick start guide LICO 500
Note: If any of these items are missing or damaged, contact the manufacturer or a sales representative immediatly.
3.2 Environment considerationsThe following conditions are necessary to make sure correct instrument operation and accurate results:
• Place the instrument firmly on an even surface. Do not push any objects under the instrument.
• Maintain an ambient temperature of 10 to 40 ºC (50 to 104 ºF) for proper instrument operation.
• The relative humidity should be less than 80%; moisture should not condense on the instrument.
• Leave at least a 15 cm (6 in.) clearance at the top and on all sides for air circulation to avoid overheating of electrical parts.
• Do not operate or store the instrument in extremely dusty, damp or wet locations.
• Keep the surface of the instrument, the cell compartment and all accessories clean and dry at all times. Splashes or spills on and in the instrument should be cleaned up immediately (see section 7.1 on page 85).
• After a continuous operating time of more than 24 hour without switching off the instrument we recommend to perform a new calibration with a distilled water cuvette/sample cell.
• After a continuous operating time of more than 7 days without switching off the instrument we recommend to switch off and on the instrument to perform a new system check with filter adjustment and lambda-calibration
Important Note: Protect the instrument from temperature extremes, including heaters, direct sunlight and other heat sources.
9

Installation
3.3 Power connectionsInstall the correct adapter plug on the supplied external power supply (Figure 1). Slide the adapter on until it "clicks" into position. Plug the external power supply cord into the connector on the back panel of the instrument, then plug the supply into a power outlet (100–240 V~ / 50–60 Hz). Press the power switch on the back of the instrument to initialize power (Figure 2 on page 11).
Figure 1 Power adapter1 Power supply with EU adapter plug installed 3 USA adapter plug2 UK adapter plug 4 AUS/China adapter plug
10

Installation
3.4 InterfacesThe LICO 500 has two USB interfaces as a standard feature, located on the back of the instrument (Figure 2). The USB Type A interface is used for communications with a printer, USB memory stick or keyboard. A USB memory stick is used to update instrument software.
The USB Type B interface is used for communications with a PC. The optional Hach Data Trans software (see Section 9 on page 93) must be installed on the PC for this use.
A USB hub may be used to connect several accessories at a time.
Note: USB cables must not be longer than 3 meters (10 feet).
These USB interfaces enable data and graphics to be output to a Printer and a PC and upgrade instrument software (see section 6.1.2 on page 76).
Figure 2 Interfaces1 USB type A 3 Plug in power supply2 USB type B 4 On/Off switch
11

Installation
3.5 Cell compartments and cell adapter
3.5.1 Cell compartments and adapterThe LICO 500 has two cell compartments (Figure 3). Only one cuvette/sample cell type at a time can be used for a measurement.
Cell compartment #1
• 11-mm round cuvettes/sample cellsFor measurements with 11mm round cuvettes/sample cells in cell compartment #1 insert the adapter Z into cell compartment #2.
Cell compartment #2Cell compartment #2 uses adapters to accommodate different cuvette/sample cell types.
• 50-mm rectangular cuvettes/sample cells (can be inserted directly into the cell compartment without using an adapter).
• Adapter Z: 10-mm square cuvettes/sample cells
Important Note: Be sure that the adapter Z is inserted proper into the cell compartment. Press the adapter down until it snap into the compartment.
Figure 3 Cell compartments1 Cell compartment #1 2 Cell compartment #2
12

Installation
3.5.2 Installation of the cell adapter1. Open the cell compartment.
2. Insert the adapter for measurements with the round cuvette/sample cell (11 mm) and/or 10 mm square cuvette/sample cell so the arrow on top of the adapter points to the left (Figure 4) and the orientation tab fits the groove in the compartment opening.
Note: The arrow on top of the adapter indicates the direction of the light beam path.
Figure 4 Cell adapter Z1 Adapter Z: 10 mm square cell adapter
13

Installation
3.6 Beam pathFigure 5 shows the beam path of the LICO 500.
Figure 5 Beam path1 Tungsten lamp 9 Filter wheel2 Entrance slit 10 Splitter mirror3 Heat-protection glass 11 Reference-element4 Grating 12 Cell compartment #25 LED 13 Lens6 Chopper 14 Measurement element7 Exit slit 15 Cell compartment #18 Lens
14

Section 4 Start Up
4.1 Power the instrument on and off
1. Plug external power supply into an electrical outlet.
2. Press the power switch on the back of the instrument to initialize power.
Note: Do not turn the instrument off and on in rapid succession. Always wait about 20 seconds before turning the instrument on again, otherwise the electronic and mechanical systems will be damaged.
4.2 Language selection
The LICO 500 software includes several language options. The first time the instrument is turned on, the language selection screen will appear.
1. Select the desired language.
2. Press OK to confirm. The self-check will start automatically.
Changing the language settingThe instrument functions in the selected language until the option is changed.
1. While turning the instrument on, touch the screen at any point until the list for selecting a language appears (about 30 seconds).
2. Select the required language.
3. Press OK to confirm. The self-check will start automatically.
4.3 Self-Check
Each time the instrument is powered, a series of diagnostic tests are performed automatically to make sure operation of major system components.
This procedure, which takes approximately two minutes, checks the system, lamp, filter adjustment, wavelength calibration and voltage. Each test which functions correctly is confirmed with a check mark.
Note: For further error messages during self-check, see Section 8 on page 91.
15

Start Up
The Main Menu is displayed when diagnostics are completed.
See section 5.1.3 Main Menu on page 18 for a detailed description.
4.4 Characteristics in continuous operation
After a continuous operating time of more than 24 hour without switching off the instrument we recommend to perform a new calibration with a distilled water cuvette/sample cell.
After a continuous operating time of more than 7 days without switching off the instrument we recommend to switch off and on the instrument to perform a new system check with filter adjustment and lambda-calibration.
16

Section 5 Standard Operations
5.1 Overview
5.1.1 Tips for the use of the touch screenThe entire screen is touch-activated. To make a selection, press the screen with a fingernail, fingertip, pencil eraser or a stylus. Do not press the screen with a sharp object, such as the tip of a ball point pen.
• Do not place anything on top of the screen, to prevent damage or scratching on the screen.
• Press keys, words or icons to select them.
• Use scroll bars to move up and down long lists very quickly. Press and hold the scroll bar, then move up or down to move through the list.
• Highlight an item from a list by pressing it once. When the item has been successfully selected, it will be displayed as reversed text (light text on a dark background).
5.1.2 Use of the alphanumeric keypad
This display is used to enter letters, numbers and symbols as needed when programming the instrument. Unavailable options are disabled (grayed out). The icons on the right and left of the screen are described in Table 1.
The central keypad changes to reflect the selected entry mode. Press a key repeatedly until the desired character appears on the screen. A space can be entered by using the underscore on the YZ_ key.
Note: A USB keyboard (with US keyboard layout) or a USB Barcode handset scanner can be used for input (see Section 9 on page 93).
Table 1 Alphanumeric keypad
Icon / key Description Function
ABC/abc Alphabetic When entering alphabetic characters (ex. user-entered units), this key allows to toggle between upper and lower case letters.
# % Symbols Punctuation, symbols and numerical sub- and superscripts may be entered.
123 Numeric For entering regular numbers.
CE Clear Entry Clear the entry.
Left Arrow Backspace Moves back one position. This deletes the character previously entered in the new position.
Right Arrow Advance Moves to the next space in an entry when two adjacent characters occur on the same key.
17

Standard Operations
5.1.3 Main Menu
A variety of modes may be selected from the Main Menu. Table 2 briefly describes each menu option.
Table 2 Main Menu options
Option Function
Color MeasurementThe COLOR MEASUREMENT mode is used to determine visual color values like Hazen, Gardner, Saybolt as well as three-dimentional absolute colorimetric values like CIE Lab, Hunter Lab or European Pharmacopoeia skale.
Color Difference Measurement
The COLOR DIFFERENCE MEASUREMENT mode is used to determine a quantitative color difference between a reference (R) and a sample (S) in the three-dimensional color space (CIE L*a*b* or Hunter Lab). In this mode, an additional reference memory for up to 50 references is available.
Photometry
SINGLE WAVELENGTH Single wavelength measurements are:Absorbance measurements: The light absorbed by the sample is measured in absorbance units. Transmittance measurements (%): The percentage of the light that passes through the sample and reaches the detector is measured.Concentration measurements: A concentration factor can be entered to enable the measured absorbance values to be converted into concentration values.MULTI WAVELENGTHIn the multi-wavelength mode, absorbance (Abs) or percentage transmittance (%T) is measured at up to four wavelengths and absorbance differences and absorbance relationships are calculated. Simple conversions into concentrations can also be carried out.TIME COURSEThe time scan records the absorbance or % transmittance at a wavelength over a defined time.WAVELENGTH SCANA wavelength scan shows how the light from a sample is absorbed over a defined wavelength spectrum.This function can be used to determine the wavelength at which the maximum absorbance value can be measured.The absorbance behavior is displayed graphically during the scan.
System Checks The system checks menu offers a number of options, including optical checks, output checks, lamp history, instrument update, service time and instrument backup.
Recall Data Stored data can be recalled, filtered, sent to Printer, Memory stick or PC and deleted.
Instrument Setup In this mode, user-specific or method-specific settings can be entered: Operator-ID, Sample-ID, Date & Time, Display & Sound, Lamp Control, PC & Printer, Password and Select Color.
18

Standard Operations
5.2 Instrument Setup mode
1. Select Instrument Setup in the Main Menu.
A selection of configuration options appear.
5.2.1 Operator IDUse this option to enter up to 30 sets of operator initials (up to five characters each). Also the color can assigned for each Operator ID. This feature helps record which operator measured each sample.
1. Press Operator ID in the Instrument Setup.
2. Press New to enter a new Operator ID.
3. Use the alphanumeric keypad to enter a new Operator ID.
4. Press OK to confirm.
Select one of the four preset color palette in the Select Color menu to assign to the Operator ID.
5. Select a color category to highlight the color for the display background.
Note: Press Cancel to select the default setting.
6. Press OK to confirm.
19

Standard Operations
Each operator is able to configure his own set of color scales for display and printout independent of the settings or configuration of other operators.
When the operator ID is changed from A to B the color scales for the display and printout also change.
7. Press Color Scale to display.
8. Select the color scales for the display. Scoll up or down for more available colors.
9. Press OK to confirm.
10. The display shows the selected Operator ID.
11. Press OK to return to Instrument Setup.
12. The selected Operator ID is activated.
Note: Press Delete to remove an Operator ID from the list.
Note: Alternatively, enter or change an Operator ID in measurement mode. In the results screen, press Options>More>Instrument Setup or if an Operator ID is already assigned, select the Operator ID symbol immediately in the results screen.
5.2.2 Sample IDUse this option to enter up to 100 Sample Identification tags (up to 13 characters each) into the instrument. Sample IDs can be used to specify the sample location or other sample specific information.
20

Standard Operations
1. Press Sample ID in the Instrument Setup.
2. Press New to enter a new Sample ID.
3. Use the alphanumeric keypad to enter a new Sample ID.
Note: If a USB Barcode handset scanner ( see Section 9 on page 93) is connected, Sample IDs can also be scanned.
4. Press OK to confirm.
5. To number the Sample IDs sequentially (e.g. Inflow (01 etc.)), select Add Number.
• Use the arrow keys to specify the first number of the sequence.
• Use the key between the arrow keys to enter the first number of the sequence using the alphanumeric keypad.
6. Press OK to return to Instrument Setup.
7. The Sample ID is activated. Each Sample ID is automatically numbered in ascending order after a measurement. The number is shown in parentheses behind the Sample ID.
Note: To remove a Sample ID, highlight the ID and press Delete.
Note: A Sample ID can be entered or changed in measurement mode. In the results screen, press Options>More>Instrument Setup. If a Sample ID is already assigned, select the Sample ID symbol in the results screen.
21

Standard Operations
5.2.3 Date and time
1. Press Date & Time in the Instrument Setup.
2. The date and time are subdivided over a number of fields. Press the appropriate field and use the arrow keys to change the value.
3. Press OK to return to Instrument Setup.
5.2.4 Display and sound preferences
1. Press Display & Sound in the Instrument Setup.
The following options will be displayed:
• Display Brightness—Adjusts the display brightness to suit lighting conditions.
• Screen touch—Activates//Deactivates a short beep each time the screen is pressed (Default:off).
• Reading done—Activates/Deactivates a sound when a reading is complete (Default: short beep every time a reading is complete).
• Timer—Adjusts the length of the timer sound. Select Short or Long. Long beeps are recommended for noisy environments.
2. Select Long to change the number of audio signals.
Use the alphanumeric keypad to enter/specify the number of audio signals (4–25).
Note: A high number of audio signals increases the duration of the tones and a small number of audio signals reduces the duration of the tones.
3. Press OK to confirm. The selected number of the audio signals sounds as a corresponding acoustic signal.
4. Press OK to return to Instrument Setup.
5.2.5 Lamp controlThe tungsten lamp produces light in the wavelength spectrum 320 to 1100 nm.
The life span of the halogen lamp depends on the burning duration. In order to extend the life span of the lamp, switch on the Lamp control:
22

Standard Operations
• If the instrument is not used during a longer period (1–12 hours).
• If the instrument will never be switched off.
1. Press Lamp Control in the Instrument Setup.
2. Select On to switch on the Lamp.
3. Select Save: in order to define a time interval for the burning time of the lamp.
4. Press the field below Save to select the lamp burning time.
5. Select the length of time the lamp will be switched on.
Note: After this period of time the lamp will automatical turn off, after no measurement has been made.
Note: The lamp will be restarted automatically for measurements.
6. Press OK to confirm.
23

Standard Operations
5.2.6 PC and printerThe LICO 500 is provided with 2 USB interfaces, which are located on the back of the instrument (see Figure 2 on page 11). These interfaces can be used for exporting data and graphics to a printer, updating data and for data communication to a personal computer. These interfaces can be used for the connection of a USB stick, an external USB keyboard or a USB Barcode handset scanner.
Note: A USB hub may be used to connect several accessories at a time.
A USB memory stick is used to upgrade data, see section 6.1.2 on page 76.
Important Note: A screened USB cable must not be longer than 3 m!
1. Press PC & Printer in the Instrument Setup.
A list with information about the connections opens.
5.2.6.1 Printer setup
For reasons of compatibility, the printer language must be HP PCL 3.
1. Press Printer.
2. Press Setup to display the Printer Setup screen.
Table 3 USB connector
USB Interfaces Description
USB (Type B) This USB interface is only intended for the LICO 500 to PC connection (with installation of the HACH Data Trans Software).
USB (Type A) This USB port can be used to connect a printer, a USB memory stick and keyboard.
24

Standard Operations
Printer Setup:
• Resolution: Font size
• Paper: Paper size
Note: If an optional Thermal Printer is connected, the function "Auto Send" on/off is available.
3. Select Auto-Send: On to send all measured data automatically to the Thermal printer.
Note: The option Auto-Send is not available for any other printer (e.g. ink jet printer).
4. Press Resolution to select the print quality.
Select between
• 100 dpi
• 150 dpi
• 300 dpi
5. Press OK to confirm.
Note: Press OK again to return to the Instrument Setup menu.
25

Standard Operations
6. Press Paper to select the paper size.
Select between
• Letter
• Legal
• Executive
• A4
7. Press OK to confirm.
Note: Press OK again to return to the Instrument Setup menu.
5.2.6.2 PC setup
1. Press PC.
2. Press Setup to display the PC Setup screen.
3. With Auto-Send ON selection each measurement result will be automaticly sent to a PC.
4. Select Remote to etablish a bi-directional PC connection to send and receive commands and data (reserved for advanced application).
26

Standard Operations
5.2.6.3 Print data
1. Press Recall Data in the Main Menu.
2. Select the data source, where the data to be printed are stored.
3. A list is displayed. Data can be filtered. For more information see 5.3.1.2 Recall stored data from the color log or the data log on page 31.
4. Press the Printer icon.
5. Highlight Single point or Filtered data or All data and press OK to confirm.
6. Sending Data is displayed until the data have been printed.
27

Standard Operations
5.2.7 PasswordThe Password menu contains a variety of security settings to control access to various functions. For example, prevent unauthorized changes to stored programs or instrument configurations.
1. Press Password in the Instrument Setup menu.
2. In order to highlight the Security List assign a password. Press Set Password.
3. Use the alphanumeric keypad to enter a new Password (up to 10 characters each) and press OK to confirm.
The access to the Security List is activated.
4. Press Security List to lock various functions for unauthorized users.
28

Standard Operations
5. Highlight the desired functions to control.
6. Confirm the Security List with OK to return to the Password menu.
7. Press On to highlight the new settings of the Security List.
8. Enter the new Password again to confirm.
9. Press OK to return to Instrument Setup.
Note: The alphanumeric keypad to the Password inquiry appears when a user tries to reach a locked setting.
5.2.7.1 Deactivate a password
1. Press Password in the Instrument Setup.
2. Use the alphanumeric keypad to enter the former Password and press OK to confirm.
3. Press Off to deactivate the settings of the Security List.
4. Press OK to return to Instrument Setup.
Note: Use this function to delete the former Password or to enter a new one.
29
Standard Operations
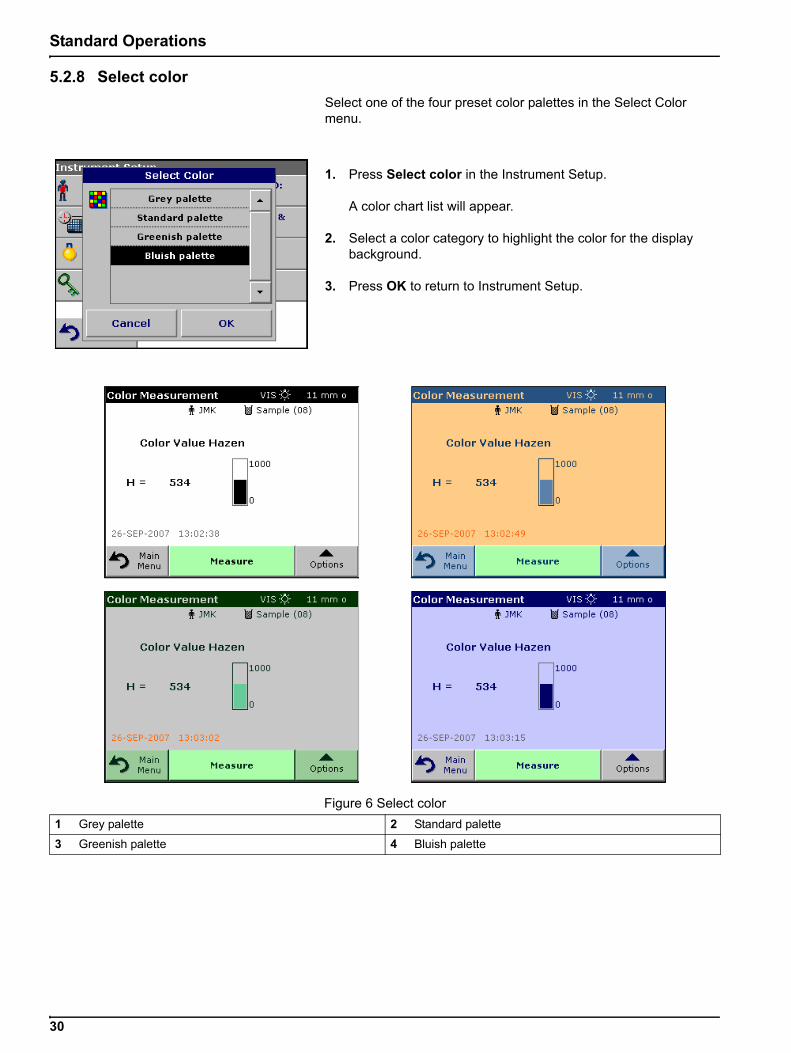
5.2.8 Select colorSelect one of the four preset color palettes in the Select Color menu.
1. Press Select color in the Instrument Setup.
A color chart list will appear.
2. Select a color category to highlight the color for the display background.
3. Press OK to return to Instrument Setup.
Figure 6 Select color1 Grey palette 2 Standard palette3 Greenish palette 4 Bluish palette
30

Standard Operations
5.3 Store, recall, send and delete data
The data log of the instrument is seperated in 4 segments:Color Log, Wavelength Scan, Time Course and Data Log.
The Color Log will store up to 500 color measurments taken in the Color Measurements and Color Difference Measurement modes.
The Wavelength Scan log will store up to 20 scans.
The Time Course log will store up to 20 time course data sets.
The Data Log will store 500 additional readings in the Photometry (Single Wavelength and Multi Wavelength mode).
A complete record of the analysis is stored, including the Date, Time, Results, Sample ID and Operator ID.
5.3.1 Store, recall, send and delete data from the color log and data log
5.3.1.1 Auto/manual data storageThe data storage parameter indicates whether data are to be stored automatically or manually (in which case the user has to decide which data to store).
1. Press Store: On/Off in the Options menu.
• Store On setting: All measurement data are stored automatically.
• Store Off setting: No measurement data are stored. However, this setting can be changed to Store On in the result display through Configuration. The reading currently shown in the display is then stored.
Note: When the instrument memory (data log) is full, the oldest data are automatically deleted allowing the new data to be stored.
5.3.1.2 Recall stored data from the color log or the data log
1. Press Recall Data in the Main Menu.
2. Press Color Log or Data Log.
A listing of the stored data is displayed.
3. Press Filter: On/Off.
31

Standard Operations
4. The function Filter Settings is used to search for specific items.
5. Highlight On to turn on the filters to select data by
• Sample ID
• Operator ID
• Start Date
• Color Scale
or any combination of the four.
6. Press OK to confirm the selection. The selected items are listed.
7. Press View Details to get more information.
8. Turn on the filter to select data by Color Scale.
9. Press Options and Graph Data.
10. A graphic trend of all color values stored in the selected period and color system is displayed. The trend shows a visual impression of the measured value process, e.g. during production supervision in the shift operation.
11. Press the arrow buttons on the right of the graph to move the dotted cursor line inside of the trend graph to the different measurement values. The color value of the marked measurement is shown on the left vertical axis and the date/time of this measurement is shown below the horizontal axis.
12. Press Control Limit.
32

Standard Operations
13. Highlight On to change the Upper Control Limit and the Lower Control Limit.
14. The middle Button represents the measuring points for the change-over.
5.3.1.3 Send data from the color log or the data log Data is sent from the data log as CSV (Comma Separated Value) files through a USB memory stick to a file named DATALOG. The file can then be processed using a spreadsheet program. The file name will be formatted as: DLYear_Month_Day_Hour_Minute_Second. CSV.
To send data to a Printer, see section 5.2.6.3 on page 27.
33

Standard Operations
1. Plug in the USB device (Figure 2 on page 11).
2. Press Recall Data from the Main Menu. Press Options and then the PC & Printer icon.
3. Select the data to send to the memory stick and press OK.
Note: The number in parenthesis is the total number of data sets assigned to this selection.
To send measurement data to a PC:The optional HACH Data Trans software must be installed on the PC for the subsequent to process for measurement data.
1. Press PC & Printer in the Instrument Setup.
2. Select PC.
3. Press Setup to display the PC Setup screen.
For further installation instructions, refer to the HACH Data Trans user manual.
4. Select Auto-Send: On to send all measured data automatically to the PC.
Note: If Auto-Send: Off is selected, the "PC & Printer" key must be pressed, in order to send data to the PC.
The remote function is only for monitoring the data transfer.
34

Standard Operations
5.3.1.4 Delete stored data from the color log or the data log
1. Press Recall Data in the Main Menu.
2. Press Color Log or Data Log, then Options>Delete.
3. Highlight Single Point or Filtered data or All data and press OK to confirm.
Note: The number in parentheses is the total number of data sets assigned to this selection.
35

Standard Operations
5.3.2 Store, recall, send and delete data from wavelength scan and time courseThe instrument can store 20 Wavelength Scans and 20 Time Course Data sets.The data can be stored manually at the user's discretion after viewing the data.
5.3.2.1 Data storage from wavelength scan or time course
1. Press Options then the Store icon after a reading is taken.
The Store Data list will be displayed.
2. Press Store to save the current scan to the highlighted numbered line. A scan can also be overwritten.
5.3.2.2 Recall stored data from wavelength scan or time course
1. Press Recall Data in the Main Menu.
a. Select Wavelength Scan or Time Course to recall data.
b. If a program is already in progress, press Options > More > Recall Data.
36

Standard Operations
2. Press Graph to look at the details.
Note: Press View Summary to return to the Recall Data list.
3. Press Table to look at the details.
Note: Press View Summary to return to the Recall Data list.
5.3.2.3 Send data from wavelength scan or time courseThere are two ways to recall sent data to a USB memory stick, printer or PC with Hach Data Trans.
Option1:
1. Press Recall Data in the Main Menu and then Wavelength Scan or Time Course.
2. Press Options and then the PC & Printer icon to send the data to a USB memory stick, to a printer or to a PC with Hach Data Trans.
37

Standard Operations
• When a printer is connected, select how to send the data to the printer (graph, table or both graph and table).
• When a USB memory stick is connected, the files will be automatically sent as CSV files (Comma Separated Value) to a file ”WLData“ (Wavelength Scan Data) or ”TCData“ (Time Course Data) to the USB memory stick.
The file name will be formatted as: ”ScanData_X.csv“ (Wavelength Scan Data) or ”TCData_X.csv” (Time Course Data).X = number of scans (1–20)
For further processing use a spreadsheet program.
Note: The advice ”Data already exist. Overwrite?“ appears when the files were already stored. Press OK to overwrite the stored data.
Option 2:
1. Press Wavelength Scan or Time Course and then Options>More>Send Data to send the data to a USB memory stick or to a printer.
• When a printer is connected, select how to send the data to the printer (graph, table or both graph and table).
• When a USB memory stick is connected, the files will be automatically sent as CSV files (Comma Separated Value) to a file ”WLData“ (Wavelength Scan Data) or ”TCData“ (Time Course Data).
The file name will be formatted as:”ScanData_Year_Month_Day_Hour_Minute_Second.CSV“ (Wavelength Scan Data) orThe file name will be formatted as:”TCYear_Month_Day_Hour_Minute_Second.CSV“ (Time Course Data).
For further processing use a spreadsheet program.
38

Standard Operations
5.3.2.4 Delete stored data from wavelength scan or time course
1. Press Recall Data from the Main Menu and then Wavelength Scan or Time Course or Options>More>Recall Data.
A listing of the stored data is displayed.
2. Highlight any data to delete.
3. Press Delete in the Options menu and press OK to confirm.
39

Standard Operations
5.4 Sampling and sample preparationTake a representative sample from the product you want to measure in accordance with DIN EN ISO 15528 (or ASTM D3925-02).
If the material shows any visual haziness, remove the haze by either filtration, centrifugation, heating, ultrasonic treatment or suitable means.
Heat partly solid samples before measuring in order to dissolve the solid material in the liquid. The preparation must not cause any chemical changes in the sample.
Make sure that during the measurement are no bubbles in the sample.
There are three cuvette/sample cell types available for color measurement with the LICO 500, differing by material (glass, PS and PMMA) and path length (10 mm,11 mm and 50 mm). Fill the cuvette/sample cell to approximately 2 cm. The light beam passes through the cuvette/sample cell around 0.5 cm to 1.5 cm above the base of the cuvette/sample cell.
The program calculates and displays Iodine, Hazen, Gardner, Saybolt, Klett and ASTM D 1500 color values automatically, taking into account the cuvette/sample cell type.
A dry thermostat is available for the 11 mm disposable round glass cuvettes/sample cells. The dry thermostat heats the cuvettes/sample cells to any temperature between ambiant and 150 °C.
Important Note: The samples must be clear and free of turbidities. If products in paste or solid form cannot be measured directly, the product must be melted before being transferred to the cuvettes/sample cells. Make sure the cuvettes/sample cells do not contain any air bubbles.
• Always hold the cuvette/sample cell close to the top, to make sure that there are no fingerprints in the measurement zone of the cuvette/sample cell. Use suitable transfer pipettes to introduce samples into the cuvettes/sample cells.
• Slowly add samples to the cuvettes/sample cells cells to make sure air bubbles do not form on the cuvette/sample cell wall and in the sample. Air bubbles will cause false readings.
• If air bubbles are entrapped, remove them by heat, vacuum, ultrasonic treatment or other suitable means.
• Clean the outside of the cuvettes/sample cells thoroughly before inserting them in the cell compartment.
Note: Before using disposable cuvettes/sample cells made by PS (Polystyrene) or PMMA (Polymethyl methacrylate) be sure that the cuvettes/sample cells will not be destroyed by samples, otherwise the cell compartment can be damaged.
40

Standard Operations
5.5 Color measurementProper sample preparation is extremely important for accurate color measurement. To make sure an accurate measurement is taken, refer to the following sample preparation guidelines:
• Always clean the glass cuvettes/sample cells immediately after use.
• Only use optically preferred samples for measurement. Make sure the cuvette/sample cell are clean and show no signs of opaqueness.
• Slowly fill the liquid into the cuvette/sample cell to prevent air bubbles in the sample.
• Refer to section 5.4 on page 40 for more sample and sampling preparation information.
The Color Measurement mode is used to determine absolute color values in the Hazen, Gardner, CIE Lab or European Pharmacopoeia ranges.
The LICO 500 uses an independent calibration data set for each type of cuvette/sample cell size (11 mm round vial and 50 mm rectangular cells).
It is possible to calibrate the instrument with one, two or three types of cuvettes/sample cells and to use these different cuvette/sample cell types in parallel.
For the use of the 10 mm square cuvette/sample cell and 11 mm round vials it is necessary to insert the adapter Z into the cell compartment #2. For measurements with 50 mm rectangular cuvettes/sample cells please remove the adapter.
41

Standard Operations
5.5.1 Take a color measurement
1. Press Color Measurement.
2. Insert a cuvette/sample cell with distilled water to calibrate.
Important Note: Carried out the calibration always very carefully, as a faulty calibration can cause inaccurate results to be obtained.
3. The calibration starts when the LICO 500 automatically recognizes the cuvette/sample cell. The type of cuvette/sample cell and the actual progress of calibration is shown in a seperat window.
4. After the calibration is done the screen shows an empty measurement window. In the upper right corner of the window the selected cuvette/sample cell size is displayed. The middle button changes to Measure and the color is changed to green.
42

Standard Operations
5. Insert the sample cuvette/cell.
6. The result of the color calculation is displayed.
Note: The control bar displayed on the right of the displayed result shows the relationship of the measurement result to the measuring range.
7. For the next measurement, remove the cuvette/sample cell and insert the next sample cuvette/cell or press Measure to measure the same sample again.
5.5.1.1 Touch-sensitive areas on the measurement window
On the screen are touch-sensitive areas where the user has immediate access to special software options.
Figure 7 Touch-sensitive areas on the measurement window1 Open Operator ID to change or add operator ID
(see section 5.2.1 on page 19 )5 Change Upper Limit of color range (see section
5.5.1.4 on page 46)2 Open Sample ID to change or add sample ID
(see section 5.2.2 on page 20)6 Change Lower Limit of color range (see section
5.5.1.4 on page 46)3 Open Select Color Scale and select scale for
display (see section 5.5.1.3 on page 45)7 Change Date & Time (see section 5.2.3 on page
22)4 Change the displayed color scale to the next color
system which is selected in the Operator ID color scale list for display. (see section 5.5.1.3 on page 45)
43

Standard Operations
5.5.1.2 Parameter setup optionsPress Option for Parameter Setup.
Table 4 Stored programs options
Options Description
More For further Options
Store: On With the STORE ON setting, all measurement data are stored automatically. With the STORE OFF setting, no measurement data are stored.
Send Data To send data to a printer, computer or USB memory stick (Type A)
Color Scale Select the color scale
View GraphView TableView Value
VIEW GRAPH show the spectral graph of the transmission or absorbance curve.Note: View Graph is activated after the first reading.
VIEW TABLE shows the spectral transmission values T% from 380 nm to 720 nm.
VIEW VALUES show the result of the last color calculation.
Scale & Units
UNITS: Select absorbance or transmittance.SCALE: In the automatic scaling mode, the y-axis is automatically adjusted so that the total scan is displayed.The manual scaling mode allows sections of the scan to be displayed.
Ph.Eur.: AutoEuropean PharmacopoeiaSelect AUTO or SPECIFIED SCALE
Send Data To send data to a printer, computer or USB memory stick (Type A)
Color Scales for Operator ID Configure the color scale for the display and for print.
44

Standard Operations
5.5.1.3 Change the color scale after a measurement
1. Press the touch-sensitive area 3, e.g. Color Value Hazen.
2. A list of all color scales is displayed.
3. Select the required scale.
4. Press OK to confirm.
5. The current result of the actual reading and all further measurements will be displayed in the selected color scale.
45

Standard Operations
5.5.1.4 Change the measuring range after a measurement
1. Press the upper or lower limit of the bar graph (touch-sensitive area 5 or 6).
2. Enter the new limit and press OK to confirm.
Note: It is only possible to change the limits inside the measuring range of the color scale. It is not possible to extend the range, e.g. to Hazen 2000.
The current result and all further measurements will be displayed with the new measuring range.
5.5.2 Take a Pharm. Eur. color measurement
The LICO 500 method of determining color in accordance with the European Pharmacopoeia (Ph.Eur) corresponds to the specifications in Chapter 2.2.2 of the pharmacopoeia "Degree of coloration of liquids ", in which a total of 37 color reference solutions (CRS) are defined for the hues yellow (Y1-Y7), greenish-yellow (GY1-GY7), brownish-yellow (BY1-BY7), brown (B1-B9) and red (R1-R7). Each color reference solution is unambiguously defined in the CIE Lab color space in terms of its brightness, hue and saturation.
There are two ways of color matching of a sample with the Ph.Eur. system:
• Automatic: The color of the solution is compared to the colors of the 37 color reference solutions. The identifier of the reference solution whose color is closest to that of the sample (i.e. the reference solution with the smallest color difference DE* to the sample) is displayed.
• Specified scale: A scale is specified (e.g. BY). The identifier of the reference solution whose color is closest to that of the sample within the specified scale (i.e. the reference solution with the smallest color difference DE* to the sample within the specified scale) is displayed.
If a scale is specified (e.g. BY scale), one of the following five signs is used to define the correlation between the measurement results and the scale (see Table 5).
Table 5 Specified scale
Sign Description
= equal The color number of the sample is equal to that of the reference solution
< less The color number of the sample is less than that of the reference solution
> greater The color number of the sample is greater than that of the reference solution
<> between The color number of the sample is between those of two reference solutions
->nearest The sample does not match any reference solution in this scale, but the indicated reference solution is nearest in color
46

Standard Operations
The .ΔL*,.Δa*and .Δb* values are the numerical differences between the L*,a* and b* values of the sample and those of the displayed PHARMA color solution. The measurements can be carried out with cuvettes/sample cells with path lengths of 10 mm,11 mm or 50 mm. The CIE L*a*b*values depend on the path length and are always related to the type of cuvette/sample cell employed. The longer the path length, the better the measuring accuracy.
1. Press Pharm.Eur. Color No.
2. Insert the sample cuvette/cell.
3. The result of the color calculation is displayed.
4. Press Auto BY3 (touch-sensitive area 8).
5. Select Auto.
6. Press Graph.
The additional color matching result of the Pharm. Eur. Color is displayed.
The upper value shows the actual option for the color matching calculation which can be Auto for matching in all 5 Pharm. Eur. Scales or B, BY, Y, GY or R for matching only inside of the selected color scale.
The lower entry shows the result of the color matching, e.g. brownish-yellow 3 (BY3) in this example.
The ΔLab* - values shows the color difference of the measured sample in relation to the Pharm. Eur. Color No. BY3.
The ΔE* - value shows the three dimensional color difference of the measured sample in relation to the Pharm. Eur. Color No. BY3.
7. Press Return to change the option for the color matching function.
8. Select Scale is displayed.
9. The option for color matching to a special scale can be changed.
47

Standard Operations
10. Graph offers a visualisation of the matching result in the selected matching option.
11. Depending on the scale selection the appropriate curve of the color scale will be displayed.
When option Auto is selected the a*, b* color locus of the measured sample will be displayed in all 5 color scales of the Pharm Eur.
12. Press Print to print the graph.
The CIE L*a*b* values depend on the path length of the cuvette/sample cell. Therefore the scale of the a*, b* axis in the graph depends also on the cuvette/sample cell size.
Graph for the greenish yellow scale GY.
Graph for the brownish scale B.
Graph for the brownish yellow scale BY.
48

Standard Operations
Graph for the yellow scale Y.
Graph for the red scale R.
If the CIE-L*a*b* color locus of the sample does not match any reference solution in a selected scale, the sign -> nearest will appear followed by the name of the reference solution with the lowest color difference ΔE*. In this case select Auto for a color matching in all scales to see which color scale and color reference solution is the closest to the sample color.
If the color locus of the sample is outside the graph of a standard scale, the error message Value outside! will be displayed above the graph.
49

Standard Operations
5.5.3 Take a US Pharmacopoeia color measurementThe LICO 500 method of determining color in accordance with the U.S. Pharmacopoeia corresponds to the specifications in Chapter 631 "Color and Achromicity " and Chapter 1061 "Color - Instrumental measurement ". A total of 20 color reference solutions (identified sequentially by the letters A to T) are defined in the U.S. Pharmacopoeia. The color of the measured sample is automatically correlated to the color reference solutions. This means that the color reference solution that is closest to the sample (i.e. the reference solution with the smallest color difference ΔE* to the color of the sample) is displayed. The ΔL*, Δa* and Δb* values give the quantitative differences between the L*,a* and b* values of the sample and those of the displayed USP solutions.
The measurements can be carried out with cuvettes/sample cells with a path length of 10 mm,11 mm or 50 mm. The use of a longer path lengths increase the accuracy associated with the measurement.
The CIE L*a*b* values depend on the path length and are always related to the type of cuvette/sample cell used.
1. Select US Pharmacopeia.
2. Insert the sample cuvette/cell.
3. The result of the color calculation is displayed.
The ΔLab* - values shows the color difference of the measured sample in relation to the nearest USP - Color standard which is shown above the color difference values (here color standard L).
The ΔE* - value shows the three dimensional color difference of the measured sample in relation to the USP Color standard L.
The touch-sensitive area around the matching result (touch-sensitive area 8) is active.
4. Press the area around the matching result. The color axis a*, b* and the loci of the sample (+) is displayed as well as the USP color standards.
5. Press Printer for printout or Return for exit the window.
5.5.4 Determine the Iodine color valueDIN 6162 defines the Iodine color value as mg of iodine per 100 mL of potassium iodide solution. Color matching with the Iodine color determines the depth of color of clear liquids like solvents, plasticisers, resins, oils and fatty acids, whose color is similar to that of a solution of iodine and potassium iodide of the same thickness.
50

Standard Operations
For iodine color values of less than or approximately 1, the determination of the Hazen value according to DIN-ISO 6271 is to be preferred. Sampling and preparation are described in section 5.4 on page 40 .The Iodine value can be accurately determined using an 11 mm round glass cuvette/sample cell.
5.5.5 Determine the Hazen color value (Pt-Co or APHA-method)The Hazen color value (ISO 6271, also known as "AHPA-method " or Platinum-Cobalt Scale) is defined as mg of platinum per 1 litre of solution. The Hazen parent solution is composed of 1.246 g of potassium hexachloroplatinate (IV) and 1.00 g of cobalt(II)chloride dissolved in 100 ml of hydrochloric acid and filled up to 1000 ml with distilled water.
The Hazen-color scale is used to evaluate the colors of nearly water-clear products. It has narrower gradations in the light yellow range than the Iodine scale and extends to water-clear color casts.
Note: Samples with Hazen values between 50 and 1000 can be measured with sufficient accuracy in 10 mm square and 11 mm round cuvettes/sample cells. Hazen values below 50 are measured in 50 mm cuvettes/sample cells. Hazen values below 10 are only be measured with the 50 mm cuvette/sample cell used for calibration, because nearly water-clear products can easily give faulty measuring results due to cuvette/sample cell tolerances.
5.5.6 Determine the Gardner color valueThe Gardner color value is defined in DIN-ISO 4630.The lighter Gardner color values (1 to 8) are based on potassium-chloroplatinate solutions, while the darker ones (9 to 18)are based on solutions of iron(III)chloride, cobalt(II)chloride and hydrochloric acid. The LICO 500 can determine Gardner values at all cuvette/sample cell path lengths (only values 0 to 4 in 50 mm cuvettes/sample cells).
The 10 mm and 11 mm cuvettes/sample cells provide sufficient accuracy.
5.5.7 Determine the Klett color numberThe Klett color number is used in the cosmetics industry to evaluate surfactants and detergents. The Klett color number is conventionally measured in 4 cm cuvettes/sample cells with a Summerson photometer, employing a blue filter (no.42).
The measuring range starts at Klett color number 0 and ends at Klett color number 1000.
The LICO 500 can measure the Klett color number with all types of cuvette/sample cell (10,11 and 50 mm), although the 50 mm cuvette/sample cell gives the highest precision. However, the measurement result is always calculated for the Klett 4 cm cuvette/sample cell and blue filter no.42.
5.5.8 Mineral oil color value (ASTM D 1500 and ISO 2049)The mineral oil color scale is used to evaluate the color of mineral oil products such as lubricating oils, fuel oil, diesel fuel and paraffin. The color scale starts at color value 0 for water-white, non-colored oils and ends at 8 for very dark brown oils. Substances are visually
51

Standard Operations
evaluated in multiples of 0.5 (0.5 1.0 1.5 etc.).The LICO 500 displays the results in multiples of 0.1. For samples whose color value is higher than 8,***is displayed.
Note: Because of the intensive color of the ASTM D 1500 color value, it is calculated only for 11 mm round or 10 mm square cuvettes/sample cells. No calculation is carried out for the 50 mm path length.
5.5.9 Determine the Saybolt color number (ASTM D 156)The Saybolt color scale is used to evaluate refined oil products such as petrol and kerosene, as well as for petroleum waxes and pharmaceutical white oils.
The Saybolt color properties are comparable to those of the Hazen scale (APHA). The Saybolt color scale starts at color number +30 (lightest color, equivalent to approximately 8 to 10 Hazen) and ends at -16 (strongest color, equivalent to approximately 350 Hazen).
Note: The measurements can be carried out with 10 mm,11 mm or 50 mm cuvette/sample cell path lengths. A longer path length increases the degree of accuracy associated with the measurements (50 mm recommended).
5.5.10 AOCS Cc 13 e (Lovibond®) scaleThe calculation of the Lovibond color values in the LICO 500 is derived from the AOCS Cc 13e or BS 684 -1.14 method and is based on the 5 1 /2 inch or 1 inch yellow/red values of the AF900/AF960 instruments. On the printout the 1" values are identified with 1.
5.5.11 Determine the Yellowness-Index (ASTM D 1925)The Yellowness Index is calculated and displayed in accordance with ASTM D 1925 for illuminant C and a 2 ° standard observer. This color value can be measured by using 10 mm,11mm or 50 mm cuvettes/sample cells.
The Yellowness Index is calculated as follows:
Y i = 100 * ( 1.277* X 1.059 * Z ) / Y
5.5.12 Hess-Ives color numberThe Hess-Ives color number is used in the cosmetics industry to evaluate the color of fat derivatives. It combines in one number the weighted color intensities that represent the red, green and blue fractions of the sample transmission spectrum at 3 wavelengths. It is defined in DGK 8 method no.F 050.2 and is calculated and displayed by the LICO 500 in accordance with this method. The Hess-Ives color number is calculated from:
H - I = ((R + G + B) * 6) / Pathlength
where R,G and B are the color components for the red (640 nm),
green (560 nm)and blue (464 nm)fractions. For R,G and B:
R = 43,45 * E640
G = 162,38 * E560
52

Standard Operations
B = 22,89 * (E460 + E470) / 2
5.5.13 The ADMI color numberThe ADMI color number is used to measure the color of water and wastewater having color characteristics significantly different from platinum-cobalt standards, as well as to those similar in hue to the standards.
The American Dye Manufacturers Institute (ADMI) has adopted the Platinum-Cobalt standard of the American Public Health Association (APHA) as the standard for color value. Although this standard is yellow, the ADMI method works for all hues.
The measurements can be carried out with 10 mm,11 mm or 50 mm cuvette/sample cell path lengths. A longer path length increases the degree of accuracy associated with the measurements (50 mm path length is recommended).
Turbid samples must be filtered prior to analysis.
53

Standard Operations
5.6 Color difference measurementThe color difference measurement mode is used to determine a quantitative color difference between a reference (R) and a sample (S) in the three-dimensional color space (CIE L*a*b* or Hunter Lab). In this mode, an additional reference memory for up to 50 references is available.
5.6.1 Take a color difference measurement
1. From the Main Menu, press Color Difference Measurement.
2. Insert a reference cuvette/cell.
3. The CIE-Lab Reference value of the sample is displayed.
4. Remove the reference cuvette/cell.
5. Insert the sample cuvette/cell or press Measure to measure the reference cuvette/cell once again.
6. The color values of the sample and the color differences between the sample and the reference are displayed.
54

Standard Operations
7. Press Option for Parameter Setup. Refer to Table 6 for more details on the stored program options.
Table 6 Stored programs options
Options Description
More For further Options
Store: On With the STORE ON setting, all measurement data are stored automatically. With the STORE OFF setting, no measurement data are stored.
Send Data To send data to a printer, computer or USB memory stick (Type A)
Color Scale Select the color scale
View GraphView TableView Value
VIEW GRAPH show the spectral graph of the transmission or absorbance curve.View Graph will be activated after the first reading.VIEW TABLE show the spectral transmission values T% from 380nm to 720nm.VIEW VALUES show the result of the last color calculation.
Scale & Units
UNITS: Select absorbance or transmittance.SCALE: In the automatic scaling mode, the y-axis is automatically adjusted so that the total scan is displayed.The manual scaling mode allows sections of the scan to be displayed.
Ph.Eur.: AutoEuropean PharmacopoeiaSelect AUTO or SPECIFIED SCALE
Select Reference Select stored reference data.
Send Data To send data to a printer, computer or USB memory stick (Type A)
Color Scales for Operator ID Configure the color scale to siplay resp. to print
Store Refernece Stored new reference data.
55

Standard Operations
5.6.1.1 View graph/table/values
1. Press Options>View Graph to display the transmission curve of the sample (black line) and the reference (red line) with the wavelength range from 380nm to 720nm on the x-axis and the %transmission on the y-axis. In the middle of the graph a dotted cursor line is displayed. Below the graphic, the transmission difference between reference and sample on the actual cursor position is displayed.
2. Press the appropriate button on the right screen to move the cursor line left or right or touch any position inside of the graph area. In the middle of the x-axis the wavelength at the actual cursor position is displayed.
3. Press Options > More > Scale & Units > %T. A graph is displayed showing the absorbance curve of the measurement. Below the graph, the absorption difference is displayed.
4. Press Options > View Table to switch to the table of the transmission values or absorbance value (depending on the selection in "Scale & Units").
There are three columns that show the wavelength 380 nm to 580 nm and the adequate transmission/absorbance.
Scroll down to show transmission and absorbance wavelengths to 720 nm.
56

Standard Operations
5. Press Options > View Values the color value of the sample is displayed.
5.6.2 Take a color difference measurement with stored reference values
1. Press Color Difference Measurement from the Main Menu,
2. Press Select Reference.
3. A list of available references is displayed.
4. Press the required reference.
5. Press Select reference to confirm.
6. Insert the sample cuvette/cell.
Important Note: For color difference measurement, it is absolutly necessary that the type of cuvette/sample cell used for sample measurment is identical to the type of cuvette/sample cell which was used for reference measurement.
57

Standard Operations
Example:
It is not possible to select a reference measured in 10 mm and perfom a difference measurment with 50 mm cuvette/sample cell.
5.6.3 Add a reference to the reference list
1. Press Color Difference Measurement from the Main Menu.
2. Insert a reference cuvette/cell.
3. Press Options > More > Store Reference. The Reference Data list is displayed.
4. Press a free reference number.
5. Press Store.
58

Standard Operations
5.7 Photometry
In the photometry mode, photometric measurements can be carried out as:
• Single wavelength measurements
• Multi wavelength measurements
• Time course
• Wavelength Scans
5.7.1 Single Wavelength (absorbance, concentration and transmittance measurements)The Single Wavelength mode can be used in three ways. For sample measurements at a single wavelength, the instrument can be programmed to measure the absorbance, % transmittance or concentration of the analyte.
Absorbance measures the amount of light absorbed by the sample, in units of Absorbance.
% transmittance measures the percent of the original light that passes through the sample and reaches the detector.
Turn the concentration factor on to select a specific multiplier for converting absorbance readings to concentration. In a graph of concentration versus the absorbance, the concentration factor is the slope of the line.
59

Standard Operations
5.7.1.1 Set up single wavelength modePress Single Wavelength in the Main Menu. Press Options for Parameter Setup. Table 7 describes the single wavelength setup options.
Table 7 Single wavelength setup options
Options Description
More For further Options
Store Off/On With the Store On setting, all measurement data are stored automatically. With the Store Off setting, no measurement data are stored.
% Trans/Abs To switch to % transmittance, concentration or absorbance readings
λ WavelengthTo enter the measurement wavelength. Use the alphanumeric keypad to enter the measurement wavelength. The entered wavelength must be in the range from 320–1100 nm.
Send Data To send data to a printer, PC or USB memory stick
Concentration Factor Multiplication factor for converting absorbance values into concentration values.
Concentration Resolution To select the position of the decimal point in the calculated concentration readings.
Reading Mode
Single Reading Mode: A reading is only displayed after a measurement has been carried out (press Read; standard setting) (see section 5.7.1.2 on page 62).Continuous Reading Mode: After the zero measurement, all readings are displayed automatically and continuously (see section 5.7.1.3 on page 62).
Recall Data Call up saved measurement data, wavelength scans or time courses, see section 5.3 on page 31.
Instrument Setup Basic data of the instrument, see section 5.2 on page 19.
60

Standard Operations
Concentration factor:
1. Press Concentration Factor: Off in the Options menu. Press On to highlight this feature.
2. Press the ”Factor“ key and use the alphanumeric keypad to enter the factor by which absorbance readings are to be multiplied. Press the ”Unit“ key to select the units for concentration measurements or to create a new unit.
3. Press OK to confirm.
Concentration resolution:
1. Press Concentration Resolution in the Options menu.
2. Select the resolution and press OK to confirm.
Reading mode:
1. To highlight the required mode, start by pressing Reading mode.
2. Select the required mode, then press OK, then Return to return to the result display.
61

Standard Operations
5.7.1.2 Take single wavelength measurements (single reading)
1. Insert the blank cuvette/cell into the cuvette/sample cell holder. Press Zero.
Note:The Read key is only active after the zero measurement has been completed.
2. Insert the sample cuvette/cell into the cuvette/sample cell holder. Press Read.
3. For data storage, see section 5.3.1 on page 31.
5.7.1.3 Take single wavelength measurements (continuous readings)
1. Insert the blank cuvette/cell into the cuvette/sample cell holder. Press Zero.
Note: In the reading mode ”Continuous“ only the Zero key is shown to start the reading. The reading sequence is started automatically.
2. Insert the sample cuvette/cell into the cuvette/sample cell holder.
3. Press Options and then the Store icon to store the displayed data in the Data Log.
Note: For data storage, see section 5.3.1 on page 31.
5.7.2 Multi-Wavelength mode – measurements at more than one wavelengthIn the multi-wavelength mode, absorbance values can be measured at up to four wavelengths and the results can be mathematically processed to obtain sums, differences and relationships.
Absorbance measures the amount of light absorbed by the sample, in units of Absorbance.
% Transmittance measures the percent of the original light that passes through the sample and reaches the detector.
Turning on the concentration factor allows selection of a specific multiplier for converting absorbance readings to concentration. In a graph of concentration versus the absorbance, the concentration factor is the slope of the line. Concentration is calculated using a single factor for each wavelength, which is input by the user.
5.7.2.1 Set the reading mode at different wavelengths Press Multi Wavelength in the Main Menu. Press Options for Parameter Setup. Table 8 on page 63 describes the multi wavelength setup options.
62

Standard Operations
λ / Absorbance formula:
1. Press Absorbance Formula.
2. The formula selected in the top key determines the number of wavelength and coefficent keys that will appear below. To change the absorbance formula, press the top key, select a formula from the displayed list and press OK. When a new formula is selected, the number of variables below changes to match.
The following formulas are available:
K 1 A 1 + K 2 A 2K 1 A 1 + K 2 A 2 + K 3 A 3K 1 A 1 + K 2 A 2 + K 3 A 3 + K 4 A 4K 1 A 1 / K 2 A 2(K 1 A 1 + K 2 A 2 ) / K 3 A 3
Table 8 Multi-wavelength setup options
Options Description
More For further Options
Store Off/On With the Store On setting, all measurement data are stored automatically. With the Store Off setting, no measurement data are stored.
% Trans/Abs To switch to % transmittance, concentration or absorbance readings
λ Wavelength To enter the measurement wavelength. Use the alphanumeric keypad to enter the measurement wavelength. The entered wavelength must be in the range from 320–1100 nm.
Send Data To send data to a printer, PC or USB memory stick
Concentration Factor Multiplication factor for converting absorbance values into concentration values.
Concentration Resolution To select the position of the decimal point in the calculated concentration readings.
Absorbance Formula Calculation basis for evaluating samples
Recall Data Call up saved measurement data, wavelength scans or time courses, see section 5.3 on page 31.
Instrument Setup Basic data of the instrument, see section 5.2 on page 19.
63

Standard Operations
(K 1 A 1 + K 2 A 2 ) / (K 3 A 3 + K 4 A 4 )
A 1 refers to the absorbance at wavelength 1
A 2 refers to the absorbance at wavelength 2, etc.
K 1 refers to the coefficient at wavelength 1
K 2 refers to the coefficient at wavelength 2, etc.
Coefficients can be set negative where subtraction is required.
3. To change a wavelength, press one of the ”λx:“ keys. Enter the desired wavelength coefficient into the numeric keypad.Press OK to confirm.
4. To change a coefficient, press one of the ”KX:“ keys. Enter the desired coefficient into the numeric keypad.Press OK to confirm.
Note: The instrument allows entry of up to 5 significant digits, with a maximum of 4 significant digits after the decimal point.
Concentration factor:
1. Press Concentration Factor: Off in the Options menu. Press On to highlight this feature.
2. Press the ”Factor“ key to enter the factor by which absorbance readings are to be multiplied. Press the ”Unit“ key to select the units for concentration measurements or to create a new unit.
3. Press OK to confirm.
Concentration resolution:
1. Press Concentration Resolution in the Options menu.
2. Select the resolution and press OK to confirm.
64

Standard Operations
5.7.2.2 Complete a measurement in the multi wavelength mode
1. Insert the blank cuvette/cell into the cuvette/sample cell holder. Press Zero.
Note: The Read key does not become active until the zero measurement has been completed.
2. Insert the sample cuvette/cell into the cuvette/sample cell holder. Press Read.
3. For data storage, see section 5.3.1 on page 31.
5.7.3 Wavelength scan mode – recording of absorbance and transmission spectrumsIn the wavelength scan mode, the absorbance of the light in a solution over a defined wavelength spectrum is measured.
The measurement results can be displayed as a curve, as percentage transmittance (%T) or as Absorbance (Abs). The collected data can be printed as a table or a curve.
The data are available for formatting changes. These include automatic scaling and zoom functions. Maximum and minimum values are determined and shown as a table.
The cursor can be moved to any point on the curve for the purpose of reading off the absorbance or transmittance value and the wavelength. The data associated with each data point can also be shown as a table.
65

Standard Operations
5.7.3.1 Set up the wavelength scanPress Wavelength Scan in the Main Menu. Press Options for Parameter Setup. Table 9 describes the parameter setup options.
Table 9 Wavelength scan setup options
Option Description
More For further Options
Store icon To store the scan data
Reference Off/On
From the displayed list of stored scans, a record is selected for use as a reference scan/superimposed scan. This can be highlighted or shown in the background in comparison with the actual measured scan.Note: This option is only available when there are stored scans with the same wavelength range and step.
λ To enter the wavelength spectrum and the scan interval
Select ViewEnables the user to switch the display back and forth between the scan data tables (wavelength/absorbance) and the graph of the curve.Note: Select View will be activated after the first reading.
Cursor Mode To select Track or Peak/Valley. The selection for this menu item determines to which points on the graph the cursor moves.
Send Data To send Data to a printer, computer or USB memory stick (Type A)
Integral: On/Off The integral gives the area and the derivative of the integral gives the original function
Scale & Units
Scale: In the automatic scaling mode, the y-axis is automatically adjusted so that the total scan is displayed. The manual scaling mode allows sections of the scan to be displayed. Units: Choice of absorbance or transmittance.
Recall Data Call up saved measurement data, wavelength scans or time courses, see section 5.3 on page 31.
Instrument Setup Basic data of the instrument, see section 5.2 on page 19.
66

Standard Operations
λ Setting wavelength
1. Press the λ key in the Options menu to select the wavelength range and the wavelength step.
2. Press the upper left key to open the numeric keypad and select the minimum wavelength. Press OK to confirm.
3. Press the upper right key to open the numeric keypad and select the maximum wavelength. Press OK to confirm.
Note: Do not select the same wavelength for minimum and maximum.
4. Highlight the required wavelength step.
Note: Scan recordings of high resolution data take a longer time than recordings of low resolution data.Selecting a larger step allows the instrument to scan faster, but decreases the resolution of the collected data.
5. According to the selected wavelength range, select the interval from the actively displayed wavelength steps. In summery maximally 780 measuring steps can be accomplished during a Scan.
Note: The maximum wavelength adjust automatically if the difference between the maximum and minimum wavelength is not a multiple of the interval.
6. Press OK to return to the scan mode. Selected parameters are displayed along the graph‘s x-axis.
Select view (displaying table)
1. Press Select View in the Options menu after a reading is taken.
2. A table with the results is displayed.
3. To return to the graph press Options and then View Graph.
67

Standard Operations
Cursor mode
1. Press Cursor Mode: Track in the Options menu.
2. The selection for this menu item determines what data are displayed in the table. Highlight Track or Peak/Valley.
3. Press OK to confirm.
4. Press Return to return to the scan mode.
IntegralThe Integral applies to the whole wavelength range of the scan.
1. Press Integral: Off in the Options menu.
2. Highlight On to show the Integral. To find the integral of other wavelength ranges, change the wavelength range and scan again.
3. Press OK to confirm.
4. Press Return to return to the scan mode.
Note: The Integral is shown instead of the date on the display.
Note: For the next scan measurement the setting for the Integral will be On.
Scale & units
1. Press Scale & Units.
2. Highlight the required units (Abs or %T).
3. Highlight Auto or Manual scaling on the graph´s y-axis .
Note: If manual scaling is selected, use the alphanumeric keypad to set the limits ymin. and ymax.. The graph is adjusted to display only the values in the selected range. If automatic scaling is selected, the instrument sets the limits automatically so that the total range can be displayed.
4. Press OK.
5. Press Return to return to the scan mode.
5.7.3.2 Wavelength scan readingAfter the scanning parameters have been selected, the baseline must be scanned. Changing any of the scanning parameters
68
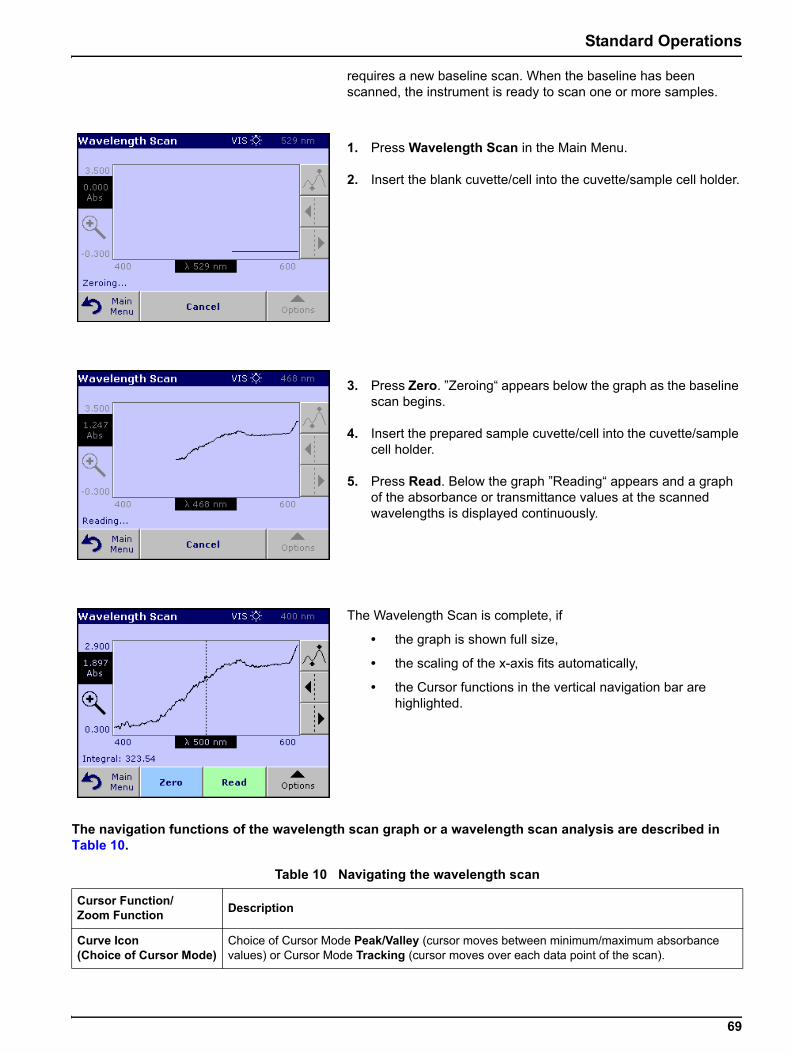
Standard Operations
requires a new baseline scan. When the baseline has been scanned, the instrument is ready to scan one or more samples.
1. Press Wavelength Scan in the Main Menu.
2. Insert the blank cuvette/cell into the cuvette/sample cell holder.
3. Press Zero. ”Zeroing“ appears below the graph as the baseline scan begins.
4. Insert the prepared sample cuvette/cell into the cuvette/sample cell holder.
5. Press Read. Below the graph ”Reading“ appears and a graph of the absorbance or transmittance values at the scanned wavelengths is displayed continuously.
The Wavelength Scan is complete, if
• the graph is shown full size,
• the scaling of the x-axis fits automatically,
• the Cursor functions in the vertical navigation bar are highlighted.
The navigation functions of the wavelength scan graph or a wavelength scan analysis are described in Table 10.
Table 10 Navigating the wavelength scan
Cursor Function/Zoom Function Description
Curve Icon(Choice of Cursor Mode)
Choice of Cursor Mode Peak/Valley (cursor moves between minimum/maximum absorbance values) or Cursor Mode Tracking (cursor moves over each data point of the scan).
69

Standard Operations
5.7.3.3 Work with reference scansThere are two options to work with Reference Scan:
First option:
1. Press Reference: Off in the Options menu to select another scan to display on the same screen with the current scan. Highlight the required scan number and press Highlight Reference.
Note: After selecting a reference scan the Reference: Off key in the Options menu turns into Reference: On.
Note: Only scans that have the same wavelength range and step can be displayed using the overlay option. This process can be repeated until all matching scans are displayed.
2. The reference curve is shown in orange. The absorbance or transmittance value and the associated wavelength are highlighted in grey.
Note: A black and an orange box are shown in the left corner of the display. The orange box relates to the reference scan and the black one relates to the current wavelength scan.
3. To complete the wavelength scan reading, see section 5.7.3.2 on page 68.
• The newly plotted wavelength scan curves and the absorbance or transmittance value are highlighted in black.
• In addition, the display shows the difference between the wavelength scan curve and the reference curve against the wavelength.
4. Press the black or orange small box in the left upper corner on the screen to switch between the actual wavelength scan and reference scan.
Arrow keys
The arrow keys are used (right/left) to move the cursor (depending on the selected mode) to the next data point. The data of the data point (wavelength/absorbance or transmittance value) are highlighted on the x and y axes. Note: Press any point on the curve to display the associated data.
Zoom Icon This function is used to magnify the section of the curve in the vicinity of the cursor. The original curve size can be restored by pressing the zoom icon again.
Table 10 Navigating the wavelength scan
Cursor Function/Zoom Function Description
70

Standard Operations
Second option:
1. Insert the blank cuvette/cell into the cuvette/sample cell holder. Press Zero.
2. Insert the sample cuvette/cell into the cuvette/sample cell holder. Press Read.
• The newly plotted wavelength scan curves are shown in black.
• The absorbance or transmittance value and the associated wavelength are highlighted in black.
3. Press Options and then Reference: Off in the Options menu to select another scan to display on the same screen with the current scan. Highlight the required scan number and press Highlight Reference.
Note: After selecting a reference scan the Reference: Off key in the Options menu turns into Reference: On.
Note: Only scans that have the same wavelength range and step can be displayed using the overlay option. This process can be repeated until all matching scans are displayed.
4. The reference curve is shown in orange. The absorbance or transmittance value and the associated wavelength are highlighted in orange.
• Additionally the difference of the extinction and/or transmission value between the two Scans (measured Scan and reference Scan) is indicated/highlighted at each position of the cursor.
Note: A black and an orange box are shown in the left corner of the display. The orange box relates to the reference scan and the black one relates to the current wavelength scan.
5. Press the black or orange small box in the left upper corner on the screen to switch between the actual wavelength scan and reference scan.
5.7.4 Time course of absorbance/transmittanceThe Time Course Mode is used to collect data in either absorbance or transmittance for a user-specified length of time. After the data are collected, they can be displayed in either graphic or tabular format.
5.7.4.1 Time course setup parametersPress Time Course mode in the Main Menu. Press Options to configure parameters. Table 11 describes the configure parameter options.
71

Standard Operations
Time & interval:
1. Press Time & Interval in the Options menu.
2. Input the total time and the reading time and press OK to confirm.
Note: In total 500 measuring steps are possible. To select a total time and a time interval that would cause this number of measurements to be exceeded, the time interval is defined automatically and the OK key is inactivated.
Table 11 Time course setup options
Option Description
More For further Options
Store icon To store the scan data
Time & Interval To input the total time for data collection and the time interval between the collection of data points
λ To input the wavelength setting
View Table To display readings in absorbance, transmittance or concentration. This can be changed after sample data are collected
Scale & Units
Scale: In the automatic scaling mode, the y-axis is automatically adjusted so that the total scan is displayed. The manual scaling mode allows sections of the scan to be displayed. Units: Choice of absorbance or transmittance.
Send Data To send Data to a printer, computer or USB memory stick (Type A)
Recall Data Call up saved measurement data, wavelength scans or time courses, see section 5.3 on page 31.
Instrument Setup Basic data of the instrument, see section 5.2 on page 19.
72

Standard Operations
Scale & units:
1. Press Scale & Units in the Options menu.
2. Highlight Abs or %T as the required units.
3. Highlight Auto or Manual scaling on the graph´s y-axis.
Note: If manual scaling is selected, use the alphanumeric keypad to set the limits ymin. and ymax.. The graph is adjusted to display only the values in the selected range. If automatic scaling is selected, the instrument sets the limits automatically so that the total range can be displayed.
4. Press OK to confirm.
5. Press Return to return to the scan mode.
5.7.4.2 Time course scan reading
After the parameters have been selected, the instrument must be blanked, then the sample can be analyzed.
1. Insert the blank cuvette/cell into the cuvette/sample cell holder. Press Zero. The blank reading is shown on the display.
2. Insert the sample cuvette/cell into the cuvette/sample cell holder. Press Read. Start collecting time course (kinetic) data.
Note:During the measurement the Zero and Read keys change to Mark and Stop.
• Select Mark to mark the next data point collected. This mark is not used by the instrument, but is available for the user and may indicate a significant event, such as the addition of a sample or other reagent. The mark is also shown in the table.
• Select Stop to end the sample readings.
73

Standard Operations
5.7.4.3 Analysis of time course data
The Time Course Program is complete, if
• the sound is turned on, the instrument beeps when the readings are done
• the graph is shown fullsize,
• the x-axis is scaled automatically,
• the Cursor functions in the vertical navigation bar are highlighted.
5.7.4.4 Navigation of a time scan or a time scan analysisAfter a time scan has been completed, the time and the absorbance/transmittance data are displayed as a curve.
Where the cursor is positioned on the curve, the elapsed time up to this point and the corresponding absorbance are highlighted. The navigation functions of a time scan or time scan analysis are described in Table 12.
Table 12 Navigating the time scan
Cursor Function/Zoom Function Description
Curve Icon(Choice of Cursor Mode)
Delta mode: A second cursor is highlighted. The position of the fixed cursor was previously defined in Cursor Mode Single. Use the active cursor to select any point on the measurement curve. The difference to the fixed cursor is shown on the curve. The delta values are correspondingly highlighted and displayed on the x and y axes.The gradient of the curve and the correlation coefficient (r2) between the cursor points in the Delta mode are shown under the curve.Cursor Mode Single: The cursor moves to each selected measurement point of the scan.
Arrow keys
The arrow keys (right/left) are used to move the cursor (depending on the selected mode) to the next data point. The data of the data point (wavelength/absorbance or transmittance value) are highlighted on the x and y axes.Note: Press any point on the curve to display the associated data.
Zoom Icon This function is used to magnify the section of the curve in the vicinity of the cursor. The original curve size can be restored by pressing the zoom icon again.
74

Section 6 Advanced Operations
6.1 System checks
1. Press System Checks in the Main Menu.
The System Checks menu contains instrument information and various performance tests.
6.1.1 Instrument information
1. Press Instrument Information in the System Checks menu.
2. The model, serial number and software version are displayed.
75

Advanced Operations
6.1.2 Upgrade of the instrument software
To obtain the software for the update from the Internet at www.hach-lange.com.
1. Go to http://www.hach-lange.com
2. Select the country and go to Download>Software.
3. Enter LICO 500 in ”Search for documents“.
4. Locate the appropriate download and follow the prompts for saving the file(s) to the USB memory stick (Section 9 on page 93) or to the PC.
5. Unpack the ZIP file and save the files to the USB memory stick.
6. Press Instrument Update in the System Checks menu.
7. Connect the USB memory stick to the USB interface (type A) on the instrument, see section 3.4 on page 11.
8. Press OK. The link is established automatically and the software is updated.
9. Press OK to return to the System Checks menu.
Note: When the instrument software has been updated, a prompt to restart the instrument is displayed.
6.1.3 Optical checks1. Press Optical Checks in the System Checks menu.
The Optical Checks menu for checking the wavelength accuracy, stray light and photometric accuracy.
An test filter set (Verification Kit) (Section 9 on page 93) containing four precision glass filters, target values and instructions is available as an aid for carrying out comprehensive in-house instrument checks.
6.1.3.1 Verification kitThe Verification Kit (see Section 9 on page 93) is designed for periodic monitoring of scattered light, photometric accuracy and the wavelength accuracy of the spectrophotometers.
When results exceed allowable tolerances (given in the quality control certificate to the test record), contact the manufacturer.
76

Advanced Operations
1. Press Nominal Values.
2. Press Edit.
An automatic menu guidance queries values (filters, wavelength, nominal values and tolerances) given in the quality control certificate, to the following specifications:
• Stray Light
• Photometrical accuracy
• Wavelength accuracy
3. Press OK when all values are entered and the overview is displayed.
4. Press Verification.
5. Insert the adapter Z (Figure 4 on page 13 ) in cell compartment #2.
77

Advanced Operations
6. Remove any cuvettes/sample cells from the cell compartment and press Start.
7. Insert the different filter in the given order one after the other. Press Next after inserting a filter.
After the last measurement the results are displayed.
8. Press PC & Printer icon to send the data to a USB memory stick, PC or to a printer.
The files will be stored automatically as CSV file (Comma Seperated Value). The file name will be formatted as “Verification.csv“.
6.1.4 Output checksIf a printer is connected a test printing of the current screen will be printed.
6.1.5 Lamp historyThe Lamp History menu provides the amount of time that the lamp has been on (Hours).
78

Advanced Operations
After a lamp is replaced, the display of the total operating time is reset to 0.
1. Press Lamp History in the System Checks menu.
2. Press Reset VIS and the Visible Lamp will be reset.
3. Press OK to return to System Checks.
6.1.5.1 Factory service
The Factory Service menu is password protected. This menu is not intended for customer use.
6.1.6 Service timeIn order to make sure a regular inspection, an automatic memory reference for the service times can be entered. After switching the instrument on this memory reference will be activated and indicated at the appropriate time.
1. Press Service Time in the System Checks menu.
2. Select On and then Last Service to enter the date of the last inspection.
3. Press OK to confirm.
79

Advanced Operations
4. Select Next Service to determine a specific period of time up to the next inspection.
5. Press OK to confirm.
If the next service is due, the message "Next service is due!" is displayed after switching on the instrument.
6. Press OK to return to the Main Menu.
Contact the manufacturer to arrange an appointment for the next service.
80

Advanced Operations
6.1.7 Instrument backupBefore the next service date the Instrument Backup menu offers the possibility to store all programs, measuring data, Operator ID, Sample ID, passwords and all adjustable data on a USB stick.
1. Press Instrument Backup in the System Checks menu.
2. Connect the USB memory stick (section 3.4 on page 11).
3. Press Store to start a Backup.
Note: If the USB stick is not connected, the message "Please insert USB Memory" is displayed. Connect a USB stick, in order to store the data. Press OK to confirm and press Store again.
Note: If the Backup was already stored before, the message "Data already exists. Overwrite?" is displayed. Press OK to overwrite the data.
81

Advanced Operations
If the file was stored the message Instrument Backup is stored to USB stick will be displayed.
4. Press OK to return to the System Checks menu.
Restore backup data:Important Note: All current data will be overwritten when restoring the Backup file!
1. Press Instrument Backup in the System Checks menu.
2. Connect the USB memory stick containing the Backup (section 3.4 on page 11).
3. Press Restore to pass back the data.
Note: If the USB stick is not connected, the message "Please insert USB Memory" is displayed. Connect a USB stick, in order to store the data. Press OK to confirm and press Restore again.
82

Advanced Operations
4. Press OK to confirm after the message “Instrument Backup from S/N XXXXXXX. Restore?“ is displayed.
5. After the backup start the instrument again.
83

84

Section 7 Maintenance
CAUTIONPotential Chemical, Biological Eye and Skin Hazards.Only qualified personnel should conduct the tasks described in this section of the manual.
Important Note: Remove any cuvettes/sample cells that are still in the instrument and dispose of cuvettes/sample cells or its contents using an approved disposal method.
7.1 Cleaning requirementsCAUTIONPotential Pinch, Eye, Burn and Chemical Hazards.Always disconnect power from the instrument before attempting any cleaning operations.
Important Note: Under no circumstances should the instrument, display or the accessories be cleaned with solvents such as white spirit, acetone, etc.
7.1.1 Housing and cell compartment• Clean the enclosure, cuvette/sample cell compartments and all
accessories with a soft damp cloth. A mild soap solution can also be used. Do not get excess water in the cuvette/sample cell compartments. Do not insert a brush or sharp object into Cell Compartment #1 to avoid damaging the mechanical components.
• Dry the cleaned parts carefully with a soft cotton cloth.
7.1.2 Display• Take care not to scratch the display. Do not touch the screen
with ball pens, pencils or similar pointed objects.
• Clean the display with a soft, lint-free and oil-free cotton cloth. Diluted window cleaner liquid can also be used.
7.1.3 Cuvettes/sample cellsCAUTIONPotential Chemical/ Biological Exposure Hazards.Use proper laboratory practices whenever there is a risk of chemical exposure.
1. After performing a procedure, clean glass cuvettes/sample cells with cleaning agents.
2. Afterwards, rinse the cuvettes/sample cells several times with tap water and then thoroughly with deionized water.
Important Note: Glass cuvettes/sample cells that have been used for organic solvents (such as chloroform, benzene, toluene, etc.) must be rinsed with acetone before being treated with cleaning agents. In addition, another rinse with acetone is necessary as a final treatment step before the cuvettes/sample cells are dried.
85

Maintenance
7.2 Lamp replacement
CAUTIONTo avoid a possible electric shock, disconnect the instrument from the power source before servicing the lamp.
1. Switch the instrument off.
2. Unplug the power cord.
WARNINGBurn Hazard. Wait until the lamp cools down. Contact with the hot lamp can cause burns.
3. Use a screwdriver to remove the cover from the back of the instrument (the screws may be slotted or cross-head).
4. Remove the cover.
5. Carefully fold the fan forward (see instrument label 1).
86

Maintenance
WARNINGBurn Hazard. Wait until the lamp cools down. Contact with the hot lamp can cause burns.
6. Push down on the pressure spring (see instrument label 2).
7. Remove the halogen lamp and the plug panel (see instrument label 3).
Important Note: Hold the lamp by the fitting only. Avoid touching the glass, as substances on the skin can bake onto the lamp bulb and thus accelerate the ageing process of the lamp.
8. Plug a new halogen lamp to the panel.
9. Insert the halogen lamp with the half rounded part pointing up.
10. Press the plug with slight pressure into the direction of the halogen lamp and push the pressure spring up, so that it will engage.
11. Fold the fan again, so that it engages.
12. Use a screwdriver to screw the back cover to the instrument.
13. Plug in the power supply.
14. Reset the Lamp History, see section 6.1.5 on page 78.
87

Maintenance
7.3 Filter pad maintenanceTo determine when the filter pad needs to be replaced, inspect the filter pad every 3–6 months (in a relatively dust-free environment, this interval can be longer).
1. Remove any cuvettes/sample cells and cell adapter from the cell compartment.
2. Turn the instrument off.
3. Unplug the power cord.
4. Lift the instrument and check the color of the filter pad. Replace the filter pad if is dark gray or black.
7.3.1 Filter pad replacement
5. Turn the instrument over and place it on a soft surface.
6. Use a screwdriver (standard or cross-head) to open the filter grid (Figure 8, item 1).
7. Lift the filter grid (Figure 8, item 1).
88

Maintenance
8. Remove the old filter pad (Figure 8, item 3) and replace it with a new one.
9. Screw the grid back in place.
10. Carefully stand the instrument upright.
11. Plug the instrument in.
Figure 8 Base of LICO 500 with filter grid1 Filter grid 3 Filter pad2 Phillips screw
89

90
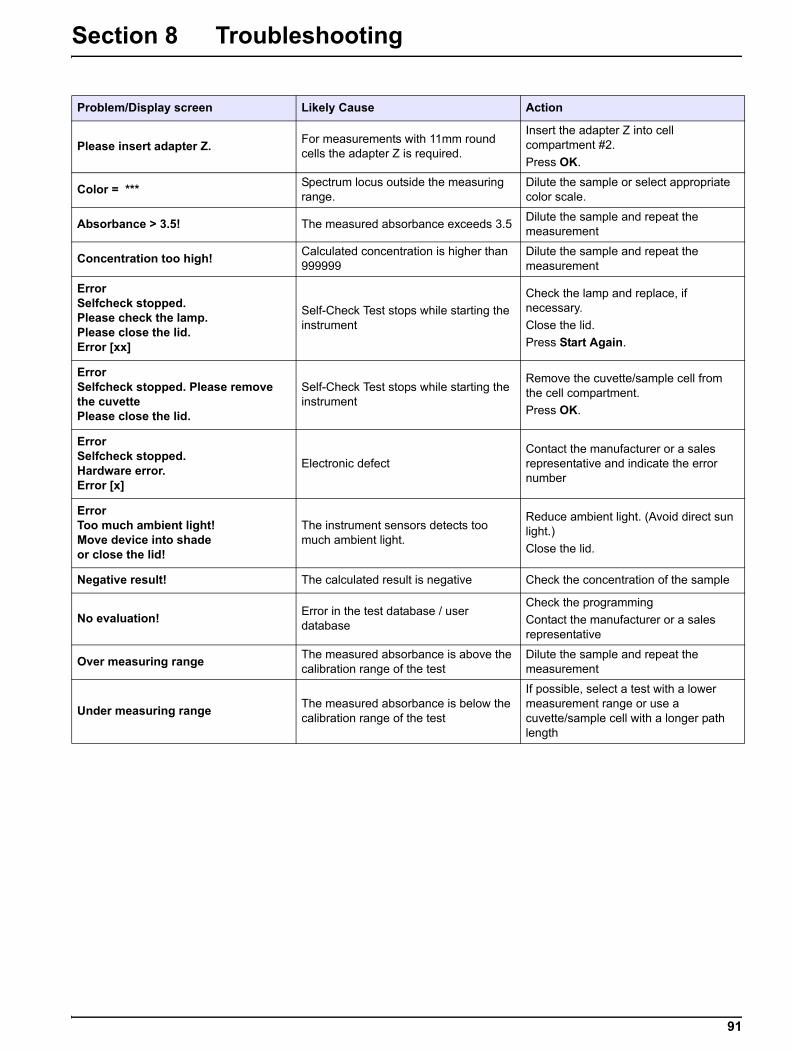
Section 8 Troubleshooting
Problem/Display screen Likely Cause Action
Please insert adapter Z. For measurements with 11mm round cells the adapter Z is required.
Insert the adapter Z into cell compartment #2.Press OK.
Color = *** Spectrum locus outside the measuring range.
Dilute the sample or select appropriate color scale.
Absorbance > 3.5! The measured absorbance exceeds 3.5 Dilute the sample and repeat the measurement
Concentration too high! Calculated concentration is higher than 999999
Dilute the sample and repeat the measurement
ErrorSelfcheck stopped.Please check the lamp.Please close the lid.Error [xx]
Self-Check Test stops while starting the instrument
Check the lamp and replace, if necessary. Close the lid. Press Start Again.
ErrorSelfcheck stopped. Please remove the cuvettePlease close the lid.
Self-Check Test stops while starting the instrument
Remove the cuvette/sample cell from the cell compartment.Press OK.
ErrorSelfcheck stopped.Hardware error.Error [x]
Electronic defectContact the manufacturer or a sales representative and indicate the error number
ErrorToo much ambient light!Move device into shadeor close the lid!
The instrument sensors detects too much ambient light.
Reduce ambient light. (Avoid direct sun light.) Close the lid.
Negative result! The calculated result is negative Check the concentration of the sample
No evaluation! Error in the test database / user database
Check the programmingContact the manufacturer or a sales representative
Over measuring range The measured absorbance is above the calibration range of the test
Dilute the sample and repeat the measurement
Under measuring range The measured absorbance is below the calibration range of the test
If possible, select a test with a lower measurement range or use a cuvette/sample cell with a longer path length
91

92

Section 9 Replacement Parts
9.1 Replacement parts
Description Catalog No.
Tungsten Lamp LZV565Adapter Z LZM353Power supply, external LZV610Power line EU LZV739Power line UK LZV740Power line USA LZV741Power line China/Australia LZV742
USB-Memory Stick LZV568
USB-Interface Cable (1 m) LZV567USB-Keyboard (keyboard layout: US) LZV582USB-Barcode Scanner (hand-held scanner) LZV566Hach Data Trans (PC software for data transfer) LZY274Certified test filter set for self-checks (Verification Kit) 4 precision glass filters with nominal values LZM339Dust cover HYH020Filter pad A23766Thermo printer PD 24, power line EU, USB cable, 1 roll of paper 5835900.00Thermo printer PD 24, power line UK, USB cable, 1 roll of paper 5835900.82Thermo printer PD 24, power line CH, USB cable, 1 roll of paper 5835900.51Certified Testing solution set " Addista-color", consisting of 6 certified test solutions LZM282Round cuvettes/sample cells 11 mm, glass, disposable, pk/500 LYY621Rectangular cuvette/sample cell 50 x 10 mm, plastic , disposable, pK/50 LZM130Rectangular cuvette/sample cell 50 x 10 mm with caps, plastic , disposable, pK/10 LZP341Rectangular cuvette/sample cell 50 x 10 mm, glass, pK/1 LZP167Rectangular cuvette/sample cell 10 x 10 mm, glass, pk/3 LZP045
93

94

Section 10 Contact Information
HACH LANGE GMBHWillstätterstraße 11D-40549 DüsseldorfTel. +49 (0)2 11 52 88-320Fax +49 (0)2 11 52 [email protected]
HACH LANGE LTDPacific WaySalfordGB-Manchester, M50 1DLTel. +44 (0)161 872 14 87Fax +44 (0)161 848 73 [email protected]
HACH LANGE LTDUnit 1, Chestnut RoadWestern Industrial EstateIRL-Dublin 12Tel. +353(0)1 46 02 5 22Fax +353(0)1 4 50 93 [email protected]
DR. BRUNO LANGE GES. MBHIndustriestraße 12A-3200 ObergrafendorfTel. +43 (0)27 47 74 12Fax +43 (0)27 47 42 [email protected]
DR. BRUNO LANGE AGJuchstrasse 1CH-8604 HegnauTel. +41(0)44 9 45 66 10Fax +41(0)44 9 45 66 [email protected]
HACH LANGE FRANCE S.A.S.33, Rue du BallonF-93165 Noisy Le GrandTél. +33 (0)1 48 15 68 70Fax +33 (0)1 48 15 80 [email protected]
HACH LANGE SAMotstraat 54B-2800 MechelenTél. +32 (0)15 42 35 00Fax +32 (0)15 41 61 [email protected]
DR. LANGE NEDERLAND B.V.Laan van Westroijen 2aNL-4003 AZ TielTel. +31(0)344 63 11 30Fax +31(0)344 63 11 [email protected]
HACH LANGE APSÅkandevej 21DK-2700 BrønshøjTel. +45 36 77 29 11Fax +45 36 77 49 [email protected]
HACH LANGE ABVinthundsvägen 159ASE-128 62 SköndalTel. +46 (0)8 7 98 05 00Fax +46 (0)8 7 98 05 [email protected]
HACH LANGE S.R.L.Via Riccione, 14I-20156 MilanoTel. +39 02 39 23 14-1Fax +39 02 39 23 [email protected]
HACH LANGE S.L.U.Edif. Arteaga CentrumC/Larrauri, 1C- 2ª Pl.E-48160 Derio/VizcayaTel. +34 94 657 33 88Fax +34 94 657 33 [email protected]
HACH LANGE LDAAv. do Forte nº8Fracção MP-2790-072 CarnaxideTel. +351 214 253 420Fax +351 214 253 [email protected]
HACH LANGE SP.ZO.O.ul. Opolska 143 aPL-52-013 WrocławTel. +48 (0)71 342 10-83Fax +48 (0)71 342 [email protected]
HACH LANGE S.R.O.Lešanská 2a/1176CZ-141 00 Praha 4Tel. +420 272 12 45 45Fax +420 272 12 45 [email protected]
HACH LANGE S.R.O.Roľnícka 21SK-831 07 Bratislava – VajnoryTel. +421 (0)2 4820 9091Fax +421 (0)2 4820 [email protected]
HACH LANGE KFT.Hegyalja út 7-13.H-1016 BudapestTel. +36 (06)1 225 7783Fax +36 (06)1 225 [email protected]
HACH LANGE S.R.L.Str. Leonida, nr. 13Sector 2RO-020555 BucurestiTel. +40 (0) 21 201 92 43Fax +40 (0) 21 201 92 [email protected]
HACH LANGE8, Kr. Sarafov str.BG-1164 SofiaTel. +359 (0)2 963 44 54Fax +359 (0)2 866 04 [email protected]
HACH LANGE SUANALİZ SİSTEMLERİ LTD.ŞTİ.Hilal Mah. 75. SokakArman Plaza No: 9/ATR-06550 Çankaya/ANKARATel. +90 (0)312 440 98 98Fax +90 (0)312 442 11 [email protected]
HACH LANGE D.O.O.Fajfarjeva 15SI-1230 DomžaleTel. +386 (0)59 051 000Fax +386 (0)59 051 [email protected]
ΗΑCH LANGE E.Π.Ε.Αυλίδος 27GR-115 27 ΑθήναΤηλ. +30 210 7777038Fax +30 210 [email protected]
HACH LANGE E.P.E.27, Avlidos strGR-115 27 AthensTel. +30 210 7777038Fax +30 210 [email protected]
95

96

Section 11 Warranty, liability and complaints
The manufacturer warrants that the product supplied is free of material and manufacturing defects and undertakes the obligation to repair or replace any defective parts at zero cost.
The warranty period for instruments is 24 months. If a service contract is taken out within 6 months of purchase, the warranty period is extended to 60 months.
With the exclusion of the further claims, the supplier is liable for defects including the lack of assured properties as follows: all those parts that can be demonstrated to have become unusable or that can only be used with significant limitations due to a situation present prior to the transfer of risk, in particular due to incorrect design, poor materials or inadequate finish will be improved or replaced, at the supplier's discretion. The identification of such defects must be notified to the supplier in writing without delay, however at the latest 7 days after the identification of the fault. If the customer fails to notify the supplier, the product is considered approved despite the defect. Further liability for any direct or indirect damages is not accepted.
If instrument-specific maintenance and servicing work defined by the supplier is to be performed within the warranty period by the customer (maintenance) or by the supplier (servicing) and these requirements are not met, claims for damages due to the failure to comply with the requirements are rendered void.
Any further claims, in particular claims for consequential damages cannot be made.
Consumables and damage caused by improper handling, poor installation or incorrect use are excluded from this clause.
97

98

Index
AAbsorbance Formula ............................................... 63ADMI color number .................................................. 53Alphanumeric keypad .............................................. 17APHA-method .......................................................... 51ASTM D 1500 .......................................................... 51ASTM D 156 ............................................................ 52ASTM D 1925 .......................................................... 52Audio signals ........................................................... 22CCell adapter Z .......................................................... 13Color Difference Measurement ................................ 18color log ................................................................... 31Color Measurement ................................................. 18Color selection ......................................................... 30Complaints ............................................................... 97Concentration Factor ............................ 60, 61, 63, 64Concentration Resolution ..................... 60, 61, 63, 64Cursor Mode ...................................................... 66, 68Cuvettes/cells .......................................................... 85DData ......................................................................... 31
deleting ..................................................31, 35, 36recalling ....................................................... 31, 36sending ........................................................ 31, 36storing .......................................................... 31, 36
Data Log .................................................................. 31Data Storage ............................................................ 36Date and Time ......................................................... 22DIN 6162 .................................................................. 50DIN-ISO 2049 .......................................................... 51DIN-ISO 4630 .......................................................... 51DIN-ISO 6271 .......................................................... 51Display .........................................................17, 30, 85Display and Sound ................................................... 22Disposal ..................................................................... 8EEuropean Pharmacopoeia ....................................... 46FFactory Service ........................................................ 79Filter Settings ........................................................... 32GGardner color value ................................................. 51HHazard Information .................................................... 7Hazen color value .................................................... 51Hess-Ives color number ........................................... 52IInstrument Backup ............................................. 81, 82Instrument Information ............................................. 75Instrument Setup ..................... 18, 19, 60, 63, 66, 72Interfaces ........................................................... 11, 24Internet ..................................................................... 76Iodine color value ..................................................... 50
KKlett color number .................................................... 51LLamp, see VIS-LampLanguage ................................................................. 15Liability ..................................................................... 97Lovibond scale ......................................................... 52MMain Menu ............................................................... 18Maintenance ............................................................ 85Marking .................................................................... 73Mineral oil color value .............................................. 51Multi Wavelength ............................18, 62, 63, 64, 65OOperator ID
deleting .............................................................. 20Optical Checks ......................................................... 76Output Checks ......................................................... 78Overview of Product/Function .................................... 8PPassword ................................................................. 28
activating ........................................................... 28deactivating ....................................................... 29
PC and Printer ................................................... 24, 27Pharmacopoeia
European ........................................................... 46US ..................................................................... 50
Photometry ............................................................... 18Printer Setup ............................................................ 24Printing data ............................................................. 27Programm overview ................................................. 18RReading Mode ..............................................60, 61, 62Recall Data .............................. 18, 36, 60, 63, 66, 72Reference .......................................................... 57, 58Reference Scan .................................................66, 70SSafety Information ...................................................... 7Sample ID ................................................................ 20
creating .............................................................. 20deleting .............................................................. 21
Sample preparation .................................................. 40Sampling .................................................................. 40Saybolt color number ............................................... 52Scale & Units ........................................ 66, 68, 72, 73Security List ............................................................. 28Select View .............................................................. 67Self-Check ............................................................... 15Send Data ....................................................33, 66, 72Service Time ............................................................ 79Single Wavelength ................................ 18, 59, 60, 62Software ................................................................... 76Spezifications ............................................................. 5Stored Data .............................................................. 31Stored Programs ...................................................... 59System Check ....................................................15, 79
99

System Checks ........................ 18, 75, 76, 78, 79, 81TTime & Interval ......................................................... 72Time Course ................18, 36, 37, 38, 39, 71, 72, 74Time Course Scan Reading ..................................... 73Timer ........................................................................ 22Touch Screen .......................................................... 17Touch-sensitive area ............................................... 43Troubleshooting ....................................................... 91UUnpacking the instrument .......................................... 9Update ..................................................................... 76VVerification Kit .......................................................... 76View Table ............................................................... 72VIS-Lamp
Lamp ControlLamp History ..................................................... 78
WWarranty .................................................................. 97Wavelength ..................................................59, 60, 63Wavelength Range .................................................. 67Wavelength Scan .. 18, 36, 37, 38, 39, 65, 66, 67, 69Wavelength setting .................................................. 72Wavelength spectrum .............................................. 66YYellowness-Index ..................................................... 52
100