Embed Size (px)
Citation preview
ELEKTRONIKA IR ELEKTROTECHNIKA, ISSN 1392–1215, VOL. 20, NO. 4, 2014
1Abstract—This paper describes the implementation of the P-Q capability diagram into the existing monitoring system forthe 247 MVA synchronous turbo generator installed in athermal power plant. The paper also addresses features,characteristics and uniqueness of the existing monitoringsystem as well as the modeling considerations required for thedevelopment of a P-Q diagram. This enables better insight intothe operational limits which ensures better utilization of thesynchronous generator. The proposed approach andmethodology can be used for the implementation of the userreal-time P-Q diagram whose limits change dynamically inaccordance with operating conditions when the generatoroperates on the grid.
Index Terms—Electric machines, measurement system,monitoring system, P-Q diagram, synchronous generator.
I. INTRODUCTION
Synchronous generators are an essential part of the powersystems. The expansion of their capabilities represents agreat contribution in several different fields. For example,from the ecological point of view, capability expansionmeans that there is no need to build additional “not sogreen” power sources such as thermal power plants. If morepower can be generated with the same generators in theexisting power plants, it would certainly help to gain enoughpower and energy in the power system. Of course, thisapproach depends on parameters of a particular powersystem. The main advantage comes from the generation ofadditional active power. Expansion of capabilities is alsopossible in the reactive part, especially in the capacitive area(i.e. under excitation). Benefits of that kind of expansioncome from a better voltage regulation which is positive fromthe system stability point of view. In order to achieve thedescribed properties an adequate measurement systemshould be installed on the synchronous generator or theexisting one should be modified in order to measure andmonitor some specific physical quantities. Those measuredquantities can be used to refine the analytical model of thesynchronous generator to produce a relevant real time P-Qdiagram plot. The real time user P-Q diagram is specific fora particular generator and changes with the change of the
Manuscript received September 27, 2013; accepted January 16, 2014.
operating point.
II. THE MEASUREMENT SYSTEM
Measurement and monitoring systems are well-known andjustified from the economical point of view, especially forlarge electric machines [1]. That kind of systems monitoressential physical quantities such as bearing vibrations,bearing oil pressure, temperature, etc. However, today’scondition monitoring systems may include monitoring ofmany types of different physical quantities which areembedded in one monitoring system [2]–[13]. Monitoringsystems can also be incorporated in more sophisticateddiagnosis systems as in [14], [15] or in this case into the userP-Q capability diagram.
Research on the real-time user P-Q diagram was made intwo Croatian power plants: the Vinodol hydro power plant(hereinafter HPP Vinodol) and the Plomin2 thermal powerplant (hereinafter TPP Plomin2). HPP Vinodol has threegenerators with rated power of 35 MVA per unit. Probeswere installed on all three generators and measurementswere made with a temporary measurement system.
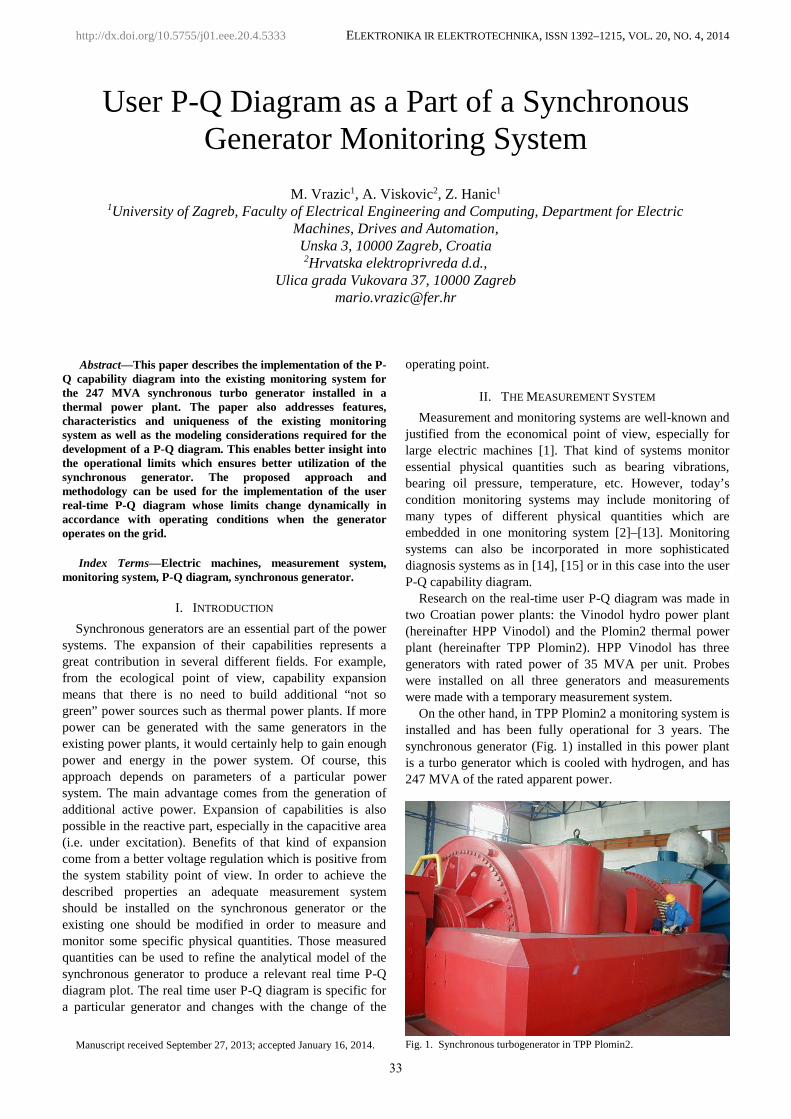
On the other hand, in TPP Plomin2 a monitoring system isinstalled and has been fully operational for 3 years. Thesynchronous generator (Fig. 1) installed in this power plantis a turbo generator which is cooled with hydrogen, and has247 MVA of the rated apparent power.
Fig. 1. Synchronous turbogenerator in TPP Plomin2.
User P-Q Diagram as a Part of a SynchronousGenerator Monitoring System
M. Vrazic1, A. Viskovic2, Z. Hanic1
1University of Zagreb, Faculty of Electrical Engineering and Computing, Department for ElectricMachines, Drives and Automation,Unska 3, 10000 Zagreb, Croatia2Hrvatska elektroprivreda d.d.,
Ulica grada Vukovara 37, 10000 [email protected]
http://dx.doi.org/10.5755/j01.eee.20.4.5333
33
ELEKTRONIKA IR ELEKTROTECHNIKA, ISSN 1392–1215, VOL. 20, NO. 4, 2014
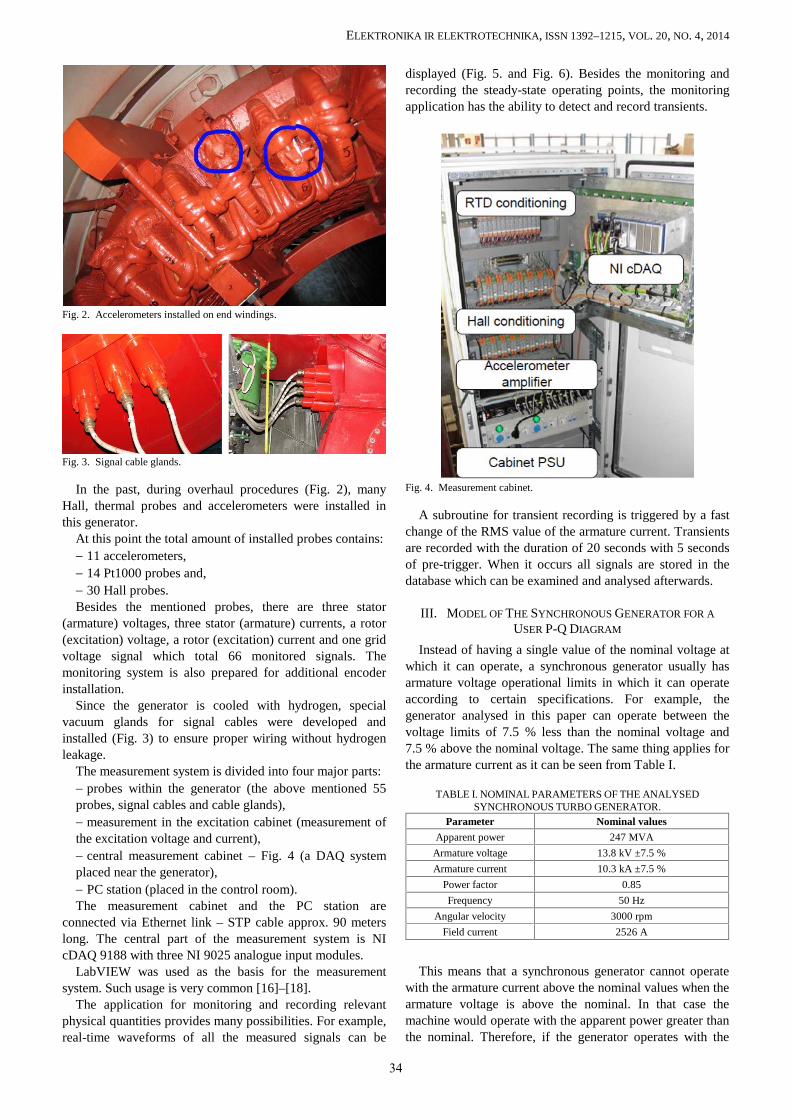
Fig. 2. Accelerometers installed on end windings.
Fig. 3. Signal cable glands.
In the past, during overhaul procedures (Fig. 2), manyHall, thermal probes and accelerometers were installed inthis generator.
At this point the total amount of installed probes contains: 11 accelerometers, 14 Pt1000 probes and, 30 Hall probes.Besides the mentioned probes, there are three stator
(armature) voltages, three stator (armature) currents, a rotor(excitation) voltage, a rotor (excitation) current and one gridvoltage signal which total 66 monitored signals. Themonitoring system is also prepared for additional encoderinstallation.
Since the generator is cooled with hydrogen, specialvacuum glands for signal cables were developed andinstalled (Fig. 3) to ensure proper wiring without hydrogenleakage.
The measurement system is divided into four major parts: probes within the generator (the above mentioned 55probes, signal cables and cable glands), measurement in the excitation cabinet (measurement ofthe excitation voltage and current), central measurement cabinet – Fig. 4 (a DAQ systemplaced near the generator), PC station (placed in the control room).The measurement cabinet and the PC station are
connected via Ethernet link – STP cable approx. 90 meterslong. The central part of the measurement system is NIcDAQ 9188 with three NI 9025 analogue input modules.
LabVIEW was used as the basis for the measurementsystem. Such usage is very common [16]–[18].
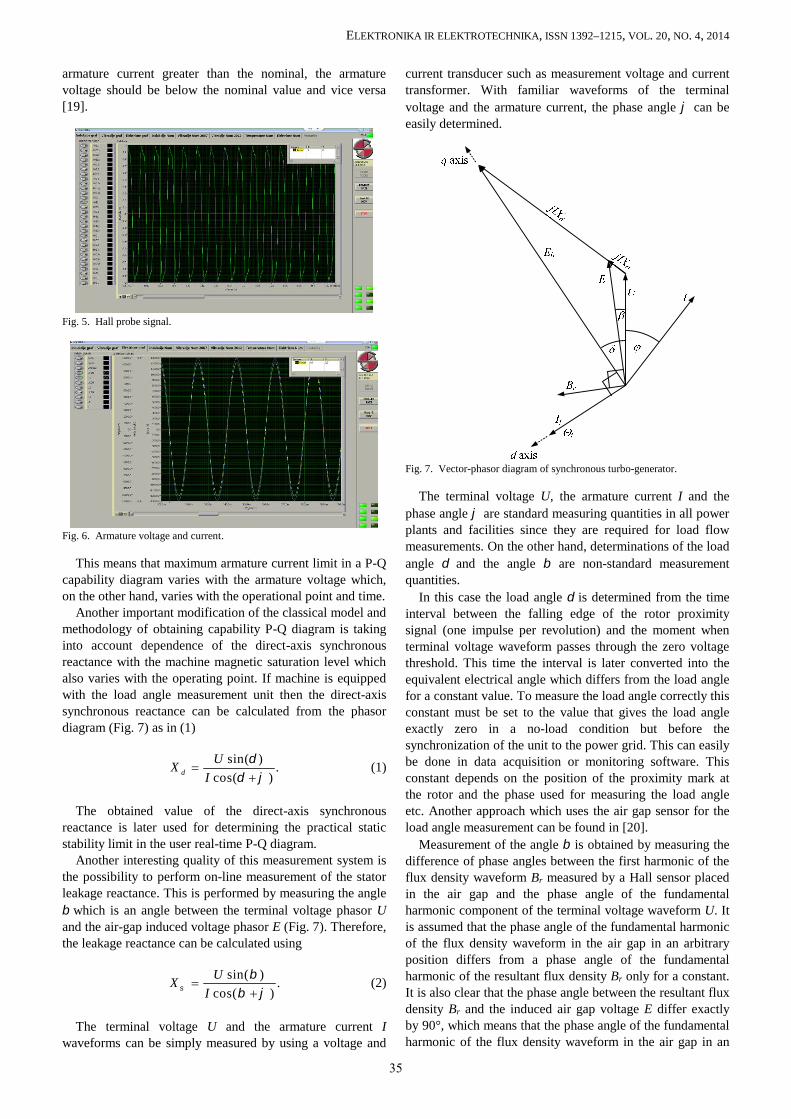
The application for monitoring and recording relevantphysical quantities provides many possibilities. For example,real-time waveforms of all the measured signals can be
displayed (Fig. 5. and Fig. 6). Besides the monitoring andrecording the steady-state operating points, the monitoringapplication has the ability to detect and record transients.
Fig. 4. Measurement cabinet.
A subroutine for transient recording is triggered by a fastchange of the RMS value of the armature current. Transientsare recorded with the duration of 20 seconds with 5 secondsof pre-trigger. When it occurs all signals are stored in thedatabase which can be examined and analysed afterwards.
III. MODEL OF THE SYNCHRONOUS GENERATOR FOR AUSER P-Q DIAGRAM
Instead of having a single value of the nominal voltage atwhich it can operate, a synchronous generator usually hasarmature voltage operational limits in which it can operateaccording to certain specifications. For example, thegenerator analysed in this paper can operate between thevoltage limits of 7.5 % less than the nominal voltage and7.5 % above the nominal voltage. The same thing applies forthe armature current as it can be seen from Table I.
TABLE I. NOMINAL PARAMETERS OF THE ANALYSEDSYNCHRONOUS TURBO GENERATOR.
Parameter Nominal valuesApparent power 247 MVA
Armature voltage 13.8 kV ±7.5 %Armature current 10.3 kA ±7.5 %
Power factor 0.85Frequency 50 Hz
Angular velocity 3000 rpmField current 2526 A
This means that a synchronous generator cannot operatewith the armature current above the nominal values when thearmature voltage is above the nominal. In that case themachine would operate with the apparent power greater thanthe nominal. Therefore, if the generator operates with the
34
ELEKTRONIKA IR ELEKTROTECHNIKA, ISSN 1392–1215, VOL. 20, NO. 4, 2014
armature current greater than the nominal, the armaturevoltage should be below the nominal value and vice versa[19].
Fig. 5. Hall probe signal.
Fig. 6. Armature voltage and current.
This means that maximum armature current limit in a P-Qcapability diagram varies with the armature voltage which,on the other hand, varies with the operational point and time.
Another important modification of the classical model andmethodology of obtaining capability P-Q diagram is takinginto account dependence of the direct-axis synchronousreactance with the machine magnetic saturation level whichalso varies with the operating point. If machine is equippedwith the load angle measurement unit then the direct-axissynchronous reactance can be calculated from the phasordiagram (Fig. 7) as in (1)
sin( ) .cos( )dUX
I
(1)
The obtained value of the direct-axis synchronousreactance is later used for determining the practical staticstability limit in the user real-time P-Q diagram.
Another interesting quality of this measurement system isthe possibility to perform on-line measurement of the statorleakage reactance. This is performed by measuring the anglewhich is an angle between the terminal voltage phasor Uand the air-gap induced voltage phasor E (Fig. 7). Therefore,the leakage reactance can be calculated using
sin( ) .cos( )UX
I
(2)
The terminal voltage U and the armature current Iwaveforms can be simply measured by using a voltage and
current transducer such as measurement voltage and currenttransformer. With familiar waveforms of the terminalvoltage and the armature current, the phase angle can beeasily determined.
Fig. 7. Vector-phasor diagram of synchronous turbo-generator.
The terminal voltage U, the armature current I and thephase angle are standard measuring quantities in all powerplants and facilities since they are required for load flowmeasurements. On the other hand, determinations of the loadangle and the angle are non-standard measurementquantities.
In this case the load angle is determined from the timeinterval between the falling edge of the rotor proximitysignal (one impulse per revolution) and the moment whenterminal voltage waveform passes through the zero voltagethreshold. This time the interval is later converted into theequivalent electrical angle which differs from the load anglefor a constant value. To measure the load angle correctly thisconstant must be set to the value that gives the load angleexactly zero in a no-load condition but before thesynchronization of the unit to the power grid. This can easilybe done in data acquisition or monitoring software. Thisconstant depends on the position of the proximity mark atthe rotor and the phase used for measuring the load angleetc. Another approach which uses the air gap sensor for theload angle measurement can be found in [20].
Measurement of the angle is obtained by measuring thedifference of phase angles between the first harmonic of theflux density waveform Br measured by a Hall sensor placedin the air gap and the phase angle of the fundamentalharmonic component of the terminal voltage waveform U. Itis assumed that the phase angle of the fundamental harmonicof the flux density waveform in the air gap in an arbitraryposition differs from a phase angle of the fundamentalharmonic of the resultant flux density Br only for a constant.It is also clear that the phase angle between the resultant fluxdensity Br and the induced air gap voltage E differ exactlyby 90°, which means that the phase angle of the fundamentalharmonic of the flux density waveform in the air gap in an
35
ELEKTRONIKA IR ELEKTROTECHNIKA, ISSN 1392–1215, VOL. 20, NO. 4, 2014
arbitrary position differs from the phase angle of thefundamental harmonic of the air gap voltage E for aconstant. Therefore, measuring the difference of the phaseangles between the first harmonic component of the fluxdensity waveform at the arbitrary position in the air gap andthe phase angle of fundamental harmonic component of theterminal voltage waveform will differ from the correct valueof the angle for a constant, as it can be seen from Fig. 7.
0.2 0.3 0.4 0.5 0.6 0.7 0.81.6
1.65
1.7
1.75
1.8
1.85
I, p.u.
X d, p.u
.
Measured Xd
Linear aproximation
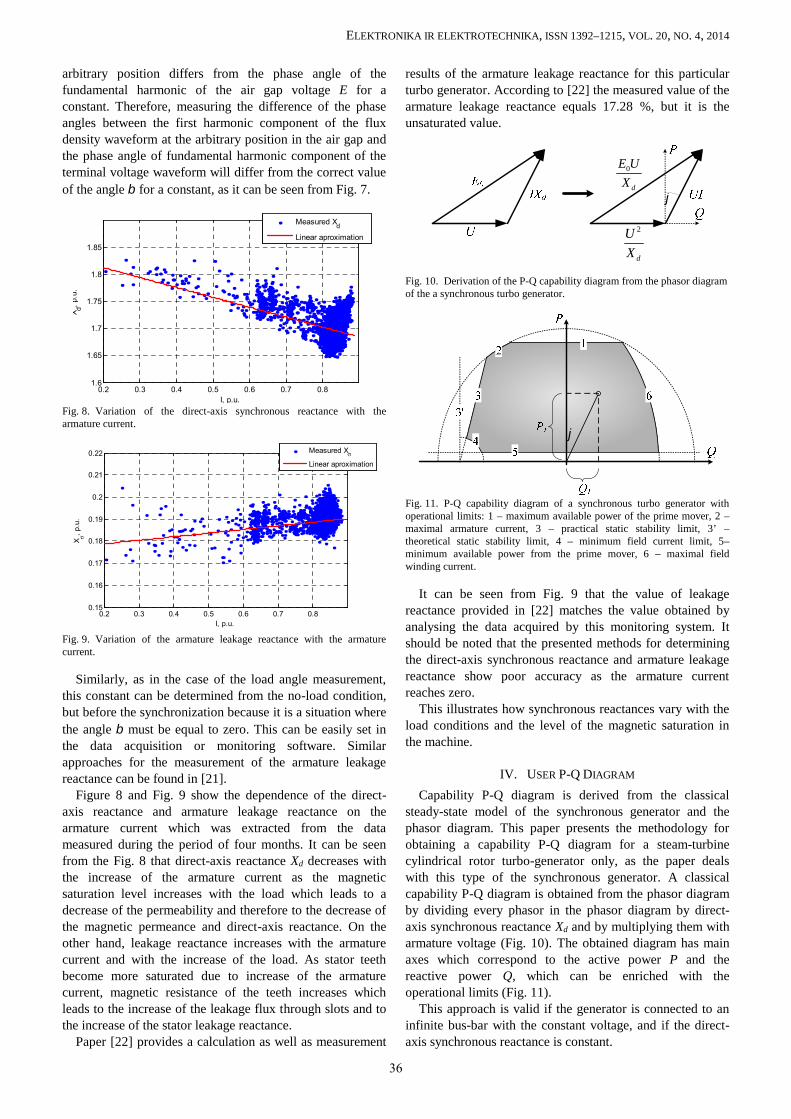
Fig. 8. Variation of the direct-axis synchronous reactance with thearmature current.
0.2 0.3 0.4 0.5 0.6 0.7 0.80.15
0.16
0.17
0.18
0.19
0.2
0.21
0.22
I, p.u.
X , p
.u.
Measured XLinear aproximation
Fig. 9. Variation of the armature leakage reactance with the armaturecurrent.
Similarly, as in the case of the load angle measurement,this constant can be determined from the no-load condition,but before the synchronization because it is a situation wherethe angle must be equal to zero. This can be easily set inthe data acquisition or monitoring software. Similarapproaches for the measurement of the armature leakagereactance can be found in [21].
Figure 8 and Fig. 9 show the dependence of the direct-axis reactance and armature leakage reactance on thearmature current which was extracted from the datameasured during the period of four months. It can be seenfrom the Fig. 8 that direct-axis reactance Xd decreases withthe increase of the armature current as the magneticsaturation level increases with the load which leads to adecrease of the permeability and therefore to the decrease ofthe magnetic permeance and direct-axis reactance. On theother hand, leakage reactance increases with the armaturecurrent and with the increase of the load. As stator teethbecome more saturated due to increase of the armaturecurrent, magnetic resistance of the teeth increases whichleads to the increase of the leakage flux through slots and tothe increase of the stator leakage reactance.
Paper [22] provides a calculation as well as measurement
results of the armature leakage reactance for this particularturbo generator. According to [22] the measured value of thearmature leakage reactance equals 17.28 %, but it is theunsaturated value.
0
d
E UX
2
d
UX
Fig. 10. Derivation of the P-Q capability diagram from the phasor diagramof the a synchronous turbo generator.
Fig. 11. P-Q capability diagram of a synchronous turbo generator withoperational limits: 1 – maximum available power of the prime mover, 2 –maximal armature current, 3 – practical static stability limit, 3’ –theoretical static stability limit, 4 – minimum field current limit, 5–minimum available power from the prime mover, 6 – maximal fieldwinding current.
It can be seen from Fig. 9 that the value of leakagereactance provided in [22] matches the value obtained byanalysing the data acquired by this monitoring system. Itshould be noted that the presented methods for determiningthe direct-axis synchronous reactance and armature leakagereactance show poor accuracy as the armature currentreaches zero.
This illustrates how synchronous reactances vary with theload conditions and the level of the magnetic saturation inthe machine.
IV. USER P-Q DIAGRAM
Capability P-Q diagram is derived from the classicalsteady-state model of the synchronous generator and thephasor diagram. This paper presents the methodology forobtaining a capability P-Q diagram for a steam-turbinecylindrical rotor turbo-generator only, as the paper dealswith this type of the synchronous generator. A classicalcapability P-Q diagram is obtained from the phasor diagramby dividing every phasor in the phasor diagram by direct-axis synchronous reactance Xd and by multiplying them witharmature voltage (Fig. 10). The obtained diagram has mainaxes which correspond to the active power P and thereactive power Q, which can be enriched with theoperational limits (Fig. 11).
This approach is valid if the generator is connected to aninfinite bus-bar with the constant voltage, and if the direct-axis synchronous reactance is constant.
36

ELEKTRONIKA IR ELEKTROTECHNIKA, ISSN 1392–1215, VOL. 20, NO. 4, 2014
Fig. 12. User P-Q capability diagram as a part of measurement monitoring system for a synchronous turbo generator.
However, in practice the infinite bus-bar assumption is notvalid because of the armature voltage variation with theoperational point due to non-negligible impedance of thepower network, which is valid especially for large units.Moreover, the assumption of a constant direct-axessynchronous reactance is also not valid. As today’s machinesare designed with a certain amount of the magneticsaturation due to economic reasons, the magnetic saturationlevel also varies with the machine’s operational point.
It is clear from this analysis that some modifications of theclassical synchronous machine model and the methodologyfor obtaining a P-Q diagram should be made in order todescribe variations of the direct-axis synchronous reactanceand armature voltage.
Since this monitoring measurement system measures a lotof quantities such as the terminal voltage and the direct-axisreactance Xd it can be used to expand a classical static P-Qcapability diagram to a user P-Q capability diagram which isupdated in real-time. This means that the user P-Q capabilitydiagram takes into account changes of parameters and allnonlinearities which arise from particular operating pointssuch as magnetic saturation level or magnetic hysteresiswhich has an impact on the operational area of thesynchronous turbo generator. This means that this approachenables better and more reliable determination of theoperational limits of the synchronous turbo generator. It isespecially important for the practical static stability limit inthe under-excitement capacitive area which is the mainprerequisite for a successful trade of a reactive power as itenables reliable operation in the under-excited capacitiveregime. Further efforts can be made by using anotherapproach in the synchronous generation excitation controlsystem to achieve reliable operation in the under excitation
capacitive regime.Based on the model and methodology explained in the
previous section a user P-Q diagram is implemented anddesigned in the LabView software environment and hasalready been in operation for two years. Figure 12 shows auser P-Q diagram implemented into the monitoringmeasurement system. All operational limits are updated inreal-time. It can also be seen from Fig. 12 that theapplication shows all other relevant electric quantities suchas the terminal voltage, the armature current, power of allphases, frequency etc.
V. CONCLUSIONS
The user P-Q diagram proved to be very useful to powerplant personnel as well as to system dispatchers. Right now,dispatchers use, at best, static P-Q diagrams of aggregateswhich usually do not take into consideration transformers.Dispatchers need real time information in relation to powerplant capabilities in order to increase availability, especiallyin case of emergency. This research proved that aggregatesare not utilized to their full potential. In order to fully utilizethe aggregates, a non-standard measurement system shouldbe installed to read all important quantities which should beused together with the machine model to obtain a reliablereal-time user P-Q diagram. The same measurement systemcan be used for monitoring or an existing monitoring systemcan be extended with the implementation of a real-time userP-Q diagram.
Therefore, the implementation of user P-Q diagrams canbe easily paid off within one year. It shows the benefits ofthe installation and usage of the real time user P-Q diagramsboth from the economical and practical point of view.
37

ELEKTRONIKA IR ELEKTROTECHNIKA, ISSN 1392–1215, VOL. 20, NO. 4, 2014
REFERENCES
[1] D. Siyambalapitiya, P. Mclaren, “Reliability improvement andeconomic benefits of online monitoring systems for large inductionmachines”, IEEE Trans. Industry Applications, vol. 26, no. 6,pp. 1018–1025, 1990. [Online]. Available: http://dx.doi.org/10.1109/28.62371
[2] P. Tavner, J. Penman, Condition monitoring of electrical machines,Research Studies Press, 1987.
[3] T. Fortin, F. Duffeau, “Large generator vibration monitoring”, EighthInt. Conf. Electrical Machines and Drives, 1997, pp.155–159.[Online]. Available: http://dx.doi.org/10.1049/cp:19971058
[4] I. Colak, I. Garip, S. Sagiroglu, S. Bayhan, “Remote monitoring ofthe load characteristics of synchronous generators”, Int. Conf. PowerEngineering, Energy and Electrical Drives (POWERENG 2011),2011, pp. 1–4. [Online]. Available: http://dx.doi.org/10.1109/PowerEng.2011.6036526
[5] S. Gopinath, “Effectiveness of auxiliary system monitoring &continuous hydrogen scavenging operation on hydrogen-cooledgenerator at power plant”, 3rd Int. Conf. Energy and Environment,(ICEE 2009), pp. 151–160, 2009.
[6] B. Lloyd, “Condition monitoring of hydro generators”, IEEE PowerEngineering Society Summer Meeting, vol. 2, pp. 996–999, 1999.
[7] J. F. Lyes, T. E. Goodeve, H. Sedding, “Parameters required tomaximize a thermoset hydro-generator stator winding life. Part II-monitoring, maintenance”, IEEE Trans. on Energy Conversion,vol. 9, no. 3, pp. 628–635, 1994. [Online]. Available:http://dx.doi.org/10.1109/60.326484
[8] W. Yang, P. J. Tavner, M. R. Wilkinson, “Condition monitoring andfault diagnosis of a wind turbine synchronous generator drive train”,Renewable Power Generation, IET , vol. 3, no. 1, pp. 1–11, 2009.[Online]. Available: http://dx.doi.org/10.1049/iet-rpg:20080006
[9] S. Nandi, H. Toliyat, X. Li, “Condition monitoring and faultdiagnosis of electrical motors-a review”, IEEE Trans. EnergyConversion, vol. 20, no. 4, pp. 719–729, 2005. [Online]. Available:http://dx.doi.org/10.1109/TEC.2005.847955
[10] Y. Han, Y. Song, “Condition monitoring techniques for electricalequipment-a literature survey”, IEEE Trans. Power Delivery, vol. 18,no. 1, pp. 4–13, 2003. [Online]. Available: http://dx.doi.org/10.1109/TPWRD.2002.801425
[11] Li, Zhixiong, et al. “Condition monitoring and fault diagnosis formarine diesel engines using information fusion techniques”,Elektronika ir Elektrotechnika (Electronics and ElectricalEngineering), vol. 7, pp. 109–112, 2012.
[12] H. Grimmelius, P. Meiler, H. Maas, B. Bonnier, J. Grevink, R. vanKuilenburg, “Three state-of-the-art methods for conditionmonitoring”, IEEE Trans. Industrial Electronics, vol. 46, no. 2,pp. 407–416, 1999. [Online]. Available: http://dx.doi.org/10.1109/41.753780
[13] R. Bayindir, S. Vadi, “Real-Time Monitoring and Control of theParameters of an Induction Motor”, Elektronika ir Elektrotechnika(Electronics and Electrical Engineering), vol. 19, no. 10, 2013.
[14] L. Collamati, F. Filippetti, G. Franceschini, S. Pirani, C. Tassoni,“Induction machine stator fault on-line diagnosis based on labviewenvironment”, in 8th Mediterranean IEEE Electrotechnical Conf.,(MELECON 1996), 1996, pp. 495–498.
[15] P. Podsiadly, B. Swiercz, S. Wroblewski, “Mobile remote controlapplication for power generators vibration monitoring”, 16th Int.Conf. Mixed Design of Integrated Circuits & Systems, (MIXDES2009), pp. 163–166, 2009.
[16] C. Wang, R. Gao, “A virtual instrumentation system for integratedbearing condition monitoring”, IEEE Trans. Instrumentation andMeasurement, vol. 49, no. 2, pp. 325–332, 2000. [Online]. Available:http://dx.doi.org/10.1109/19.843072
[17] Q. Tang, Z. Teng, S. Guo, Y. Wang, “Design of power qualitymonitoring system based on labview”, Int. IEEE Conf. in MeasuringTechnology and Mechatronics Automation, (ICMTMA 2009), vol. 1,2009, pp. 292–295.
[18] P. Yin, M. Chilukuri, “Remote power quality monitoring and analysissystem using labview software”, in IEEE Instrumentation andMeasurement Technology Conf. (I2MTC 2009), 2009, pp. 279–283.
[19] I. Ilic, Z. Maljkovic, I. Gasparac, M. Pavlica, D. Ilic Zubovic, V.Jaric, A. Viskovic, R. Belobrajic, “Methodology for determining theactual pq diagram of a hydrogenerators”, Journal of Energy, vol. 56,no. 2, pp. 141–181, 2007.
[20] M. Despalatovic, M. Jadric, B. Terzic, J. Macan, “On-linehydrogenerator power angle and synchronous reactancesdetermination based on air gap measurement”, in IEEE PowerSystems Conf. and Exposition, (PES 2004), 2004, pp. 753–758.
[21] M. Despalatovic, M. Jadric, B. Terzic, “Determination ofsynchronous generator armature leakage reactance based on air gapflux density signal”, Automatika, pp. 129–135, 2007.
[22] D. Ban, D. Zarko, I. Mandic, “Turbogenerator end-winding leakageinductance calculation using a 3-D analytical approach based on thesolution of Neumann integrals”, IEEE Trans. Energy Conversion,vol. 20, no. 1, pp. 98–105, 2005. [Online]. Available:http://dx.doi.org/ 10.1109/TEC.2004.837300
38


![Opis pr]edmiotu: Elektrotechnika II · 26.09.2013 Karta predmiotu - Elektrotechnika II 3/4 praktycznym E. …](https://img.pdfslide.net/doc/110x75/5e5ce9c7b3fcb83bdd3644c2/opis-predmiotu-elektrotechnika-ii-26092013-karta-predmiotu-elektrotechnika.jpg)