Embed Size (px)
Citation preview
User’s Guide
Version 1.0
September 28, 2007

ii
This is the preface.

Contents
1 What Is VisTrails? 1
2 Getting Started 32.1 Installation . . . . . . . . . . . . . . . . . . . . . . . . . . . . . . . . . . . . . . 32.2 Quick Start . . . . . . . . . . . . . . . . . . . . . . . . . . . . . . . . . . . . . . 32.3 Manipulating VisTrails Files . . . . . . . . . . . . . . . . . . . . . . . . . . . . . 52.4 VisTrails Basics . . . . . . . . . . . . . . . . . . . . . . . . . . . . . . . . . . . . 52.5 VisTrails Interaction . . . . . . . . . . . . . . . . . . . . . . . . . . . . . . . . . 6
3 Creating and Modifying Workflows 73.1 Working with Modules . . . . . . . . . . . . . . . . . . . . . . . . . . . . . . . . 73.2 Adding and Deleting Modules . . . . . . . . . . . . . . . . . . . . . . . . . . . . 73.3 Connecting Modules . . . . . . . . . . . . . . . . . . . . . . . . . . . . . . . . . 83.4 Changing Module Parameters . . . . . . . . . . . . . . . . . . . . . . . . . . . . 93.5 Configuring Module Ports . . . . . . . . . . . . . . . . . . . . . . . . . . . . . . 103.6 Basic Modules . . . . . . . . . . . . . . . . . . . . . . . . . . . . . . . . . . . . . 10
4 Interacting with the Version Tree 124.1 Version Tree View . . . . . . . . . . . . . . . . . . . . . . . . . . . . . . . . . . . 124.2 Adding and Deleting Tags . . . . . . . . . . . . . . . . . . . . . . . . . . . . . . 134.3 Adding Version Annotations . . . . . . . . . . . . . . . . . . . . . . . . . . . . . 144.4 Navigating Versions . . . . . . . . . . . . . . . . . . . . . . . . . . . . . . . . . . 144.5 Comparing Versions . . . . . . . . . . . . . . . . . . . . . . . . . . . . . . . . . . 14
5 The Spreadsheet 165.1 The Spreadsheet Layout . . . . . . . . . . . . . . . . . . . . . . . . . . . . . . . 165.2 Using the Spreadsheet . . . . . . . . . . . . . . . . . . . . . . . . . . . . . . . . 17
5.2.1 Interactive Mode . . . . . . . . . . . . . . . . . . . . . . . . . . . . . . . 175.2.2 Editing Mode . . . . . . . . . . . . . . . . . . . . . . . . . . . . . . . . . 18
5.3 Saving a Spreadsheet . . . . . . . . . . . . . . . . . . . . . . . . . . . . . . . . . 195.4 Creating a Customized Cell Widget . . . . . . . . . . . . . . . . . . . . . . . . . 20
iii

iv CONTENTS
6 Querying the Version Tree 216.1 Query By Example . . . . . . . . . . . . . . . . . . . . . . . . . . . . . . . . . . 216.2 Textual Queries . . . . . . . . . . . . . . . . . . . . . . . . . . . . . . . . . . . . 226.3 Query Results . . . . . . . . . . . . . . . . . . . . . . . . . . . . . . . . . . . . . 24
7 Parameter Exploration 257.1 Creating a Parameter Exploration . . . . . . . . . . . . . . . . . . . . . . . . . . 257.2 Spreadsheet Integration . . . . . . . . . . . . . . . . . . . . . . . . . . . . . . . 287.3 Examples . . . . . . . . . . . . . . . . . . . . . . . . . . . . . . . . . . . . . . . 28
7.3.1 Isosurfaces . . . . . . . . . . . . . . . . . . . . . . . . . . . . . . . . . . . 297.3.2 Resampling . . . . . . . . . . . . . . . . . . . . . . . . . . . . . . . . . . 297.3.3 Animation . . . . . . . . . . . . . . . . . . . . . . . . . . . . . . . . . . . 30
8 Using Bookmarks 33
9 Connecting to a Database 349.1 Setup . . . . . . . . . . . . . . . . . . . . . . . . . . . . . . . . . . . . . . . . . . 34
9.1.1 Setting up the database . . . . . . . . . . . . . . . . . . . . . . . . . . . 349.1.2 Setting up VisTrails . . . . . . . . . . . . . . . . . . . . . . . . . . . . . 35
9.2 Opening from a database . . . . . . . . . . . . . . . . . . . . . . . . . . . . . . . 359.3 Saving to a database . . . . . . . . . . . . . . . . . . . . . . . . . . . . . . . . . 369.4 Known Issues . . . . . . . . . . . . . . . . . . . . . . . . . . . . . . . . . . . . . 37
10 Using Analogies to Update Workflows 38
11 Writing VisTrails Packages 3911.1 Introduction . . . . . . . . . . . . . . . . . . . . . . . . . . . . . . . . . . . . . . 3911.2 Wrapping Command-line tools . . . . . . . . . . . . . . . . . . . . . . . . . . . . 44
11.2.1 Class Mixins . . . . . . . . . . . . . . . . . . . . . . . . . . . . . . . . . . 4411.2.2 Package Configuration . . . . . . . . . . . . . . . . . . . . . . . . . . . . 4511.2.3 Temporary File Management . . . . . . . . . . . . . . . . . . . . . . . . 47
11.3 Interpackage Dependencies . . . . . . . . . . . . . . . . . . . . . . . . . . . . . . 4811.4 Requirements . . . . . . . . . . . . . . . . . . . . . . . . . . . . . . . . . . . . . 5011.5 Interaction with Caching . . . . . . . . . . . . . . . . . . . . . . . . . . . . . . . 5011.6 Advanced: Wrapping a big API . . . . . . . . . . . . . . . . . . . . . . . . . . . 50
12 Advanced Topics: Module Execution and Caching 51
13 Example: Web Services 5213.1 Enabling the webServices Package . . . . . . . . . . . . . . . . . . . . . . . . . . 5213.2 Creating a new vistrail . . . . . . . . . . . . . . . . . . . . . . . . . . . . . . . . 5213.3 Adding modules to the workflow . . . . . . . . . . . . . . . . . . . . . . . . . . . 53

CONTENTS v
13.4 Module customization and parameterization . . . . . . . . . . . . . . . . . . . . 5413.5 Connecting modules . . . . . . . . . . . . . . . . . . . . . . . . . . . . . . . . . 5613.6 Executing the workflow . . . . . . . . . . . . . . . . . . . . . . . . . . . . . . . . 57
14 Example: ITK 5814.1 Introduction to ITK . . . . . . . . . . . . . . . . . . . . . . . . . . . . . . . . . 5814.2 Preparing ITK . . . . . . . . . . . . . . . . . . . . . . . . . . . . . . . . . . . . 58
14.2.1 Downloading ITK . . . . . . . . . . . . . . . . . . . . . . . . . . . . . . . 5814.2.2 Building the ITK Libraries . . . . . . . . . . . . . . . . . . . . . . . . . . 59
14.3 ITK and VisTrails . . . . . . . . . . . . . . . . . . . . . . . . . . . . . . . . . . 6014.3.1 ITK Package Organization . . . . . . . . . . . . . . . . . . . . . . . . . . 6114.3.2 Reading DICOM Volumes . . . . . . . . . . . . . . . . . . . . . . . . . . 6214.3.3 Volume Processing With ITK and VisTrails . . . . . . . . . . . . . . . . 6214.3.4 Volume Processing With ITK and VisTrails . . . . . . . . . . . . . . . . 6214.3.5 Visualizing the results . . . . . . . . . . . . . . . . . . . . . . . . . . . . 63
15 Frequently Asked Questions 6415.1 Running workflows . . . . . . . . . . . . . . . . . . . . . . . . . . . . . . . . . . 6415.2 Building workflows . . . . . . . . . . . . . . . . . . . . . . . . . . . . . . . . . . 6515.3 Spreadsheet . . . . . . . . . . . . . . . . . . . . . . . . . . . . . . . . . . . . . . 6515.4 Integrating your software into VisTrails . . . . . . . . . . . . . . . . . . . . . . . 6615.5 VTK . . . . . . . . . . . . . . . . . . . . . . . . . . . . . . . . . . . . . . . . . . 66

vi CONTENTS

Chapter 1
What Is VisTrails?
VisTrails is a new system that provides data and process management support for exploratorycomputational tasks. It combines features of workflow and visualizations systems. Similar toworkflow systems, it allows the combination of loosely-coupled resources, specialized libraries,and grid and Web services; and similar to some visualization systems it provides a mechanismfor parameter exploration and comparison of different results. But unlike these, VisTrails wasdesigned to manage exploratory processes, in which, computational tasks evolve over time asa user iteratively adjusts them while formulating and testing hypotheses. A key distinguishingfeature of VisTrails is a comprehensive provenance infrastructure that maintains detailed historyinformation about the steps followed in the course of an exploratory task. VisTrails leveragesthis information to provide novel operations and user interfaces that streamline this process.
Important Features. One of our main uses for VisTrailshas been exploratory visualization,but the system is much more general, and contains many other features. Additional featurethat might be relevant include:
• Flexible Provenance Architecture. VisTrails transparently tracks changes made to work-flows, all the steps followed in the exploration. The system can optionally track run-timeinformation about the execution of workflows (e.g., who executed a module, on which ma-chine, elapsed time etc.). VisTrails also provides a flexible annotation framework wherebyusers can specify application-specific provenance information.
• Querying and Re-using History. The provenance information is stored in a structure way.Users have a choice of using a relational database (e.g., MySQL and IBM DB2) or XMLfiles in the file system. The system provides flexible and intuitive query interfaces throughwhich users can explore and re-use provenance information. Users can formulate simplekeyword-based and selection queries (e.g., find a visualization created by a given user)as well as structured queries (e.g., find visualizations that apply simplification before anisosurface computation for irregular grid data sets).
1

2 CHAPTER 1. WHAT IS VISTRAILS?
• Support for collaborative exploration. The system can be configured with a databasebackend that can be used as a shared repository. It also provides a synchronizationfacility that allows users to collaborate asynchronously and in a disconnected fashion—users can check in and check out changes, akin to a version control system (e.g., SVN–http://subversion.tigris.org).
• Extensibility. VisTrails provides a very simple plugin functionality that can be used todynamically add packages and libraries. Neither changes to the user interface nor re-compilation of the system are necessary. Because VisTrails is written in Python, theintegration of Python-wrapped libraries is straightforward. For example, a single line inthe VisTrails start-up file is needed to import all of VTK’s classes.
• Scalable Derivation of Data Products and Parameter Exploration. A series of operationsis supported by VisTrails for the simultaneous generation of multiple data products,including an interface that allows users to specify sets of values for different parametersin a workflow. The results of a parameter exploration can be displayed side by side in theVisTrails Spreadsheet for easy comparison.
• Task Creation by Analogy. Analogies are supported as first-class operations to guide semi-automated changes to multiple workflows, without requiring users to directly manipulateor edit the workflow specifications.
Obtaining the Software. Visit http://www.vistrails.org to access the VisTrails community Website. Here you will find information including instructions for obtaining the software, onlinedocumentation, video tutorial, and pointers to papers and presentations.
VisTrails is written in Python and it uses the multi-platform Qt library for its user interface.The system available as open source—it is released under the GPL 2.0 license. The pre-compiledversions for Windows, Mac OS X, and Linux, come with an installer and include a numberof packages, including VTK, matplotlib, and Image Magick. Additional packages, includingpackages written by users, are also available (e.g., ITK, Matlab, Metro). It is easy to add newpackages using the VisTrails plugin infrastructure.

Chapter 2
Getting Started
The VisTrails system is distributed both as source code and pre-built binaries, and instructionsfor obtaining either can be found at our website: http://www.vistrails.org. Because the systemis written in Python using a Qt interface, it can be run on most architectures that supportthese two components, even if a pre-built binary is not available for your system. Section 2.1provides instructions to guide you through installation procedures, and Section 2.2 gives a quickorientation and serves as a jumping off point to exploring the different features of VisTrails.
2.1 Installation
To obtain a copy of VisTrails, please see our website: http://www.vistrails.org. There, you will findbinaries for Windows (tested on XP and Vista) and Mac OS X (tested on 10.4.x). In addition,there are instructions for obtaining a binary version for Ubuntu Linux. If you do not haveone of these systems or would prefer to install VisTrails from source, you can also downloadthe source. If you decide to install from source, please follow the instructions on the websiteas there are a few dependencies that you will need to make sure are installed. We encouragefirst-time users to download a binary version.
After obtaining a copy of VisTrails, installation is system-dependent, but both of the Win-dows and Mac OS X binaries come with installers that should be familiar to most users. Inaddition to the base VisTrails system, these installers also include a number of packages includ-ing VTK and matplotlib. For other versions, you should be able to install VisTrails to its owndirectory with the same set of packages. Again, refer to the website for specific instructions orhelp with installation.
2.2 Quick Start
Starting VisTrails is mildly system dependent. On Windows and Mac OS X, it requires clickingon the VisTrails application icon. In general, however, it is possible to start VisTrails on any
3

4 CHAPTER 2. GETTING STARTED
(a) VisTrails Builder Window (b) VisTrails Spreadsheet Window
Figure 2.1: Default View Upon Starting VisTrails
system by navigating to the directory where “vistrails.py” lives (usually the root directory ofyour installation) and executing the command:
python vistrails.py
Depending on a number of factors, it can take a few seconds for the system to start up.As VisTrails loads, you may see some messages that detail the packages being loaded andinitialized. This is normal operation, but if the system fails to load, these messages will provideinformation that may help you understand why. After everything has loaded, you will seethe VisTrails Builder window as shown in Figure 2.1(a). If you have enabled the VisTrailsSpreadsheet, you will also see a second window like that in Figure 2.1(b). (Note that thespreadsheet is enabled by default.)
(see Section 2.3) (see Section 2.5) (see Chapters 3,4,6,7) (see Section 2.5)
Figure 2.2: The VisTrails toolbar
The VisTrails toolbar serves to help users navigate the various modes and functions Vis-Trails provides. As illustrated by Figure 2.2, the left side of the toolbar contains standardfile manipulation buttons, and the next section provides buttons for execution and undo/redofunctionality. The four buttons in the middle section serve to switch between different modesto manipulate, query, and explore workflows. The right-most buttons allow the user to togglebetween different ways of navigating around the current canvas.

2.3. MANIPULATING VISTRAILS FILES 5
2.3 Manipulating VisTrails Files
To open a VisTrails file, or vistrail, you can either click the open button in the toolbar or selectOpen from the File menu. This brings up a standard file dialog where you can select a vistrailto open. Vistrails are identified by the “.vt” file extension. Opening a vistrail adds a tab tothe builder window where each tab represents a different vistrail. Clicking a tab switches thecurrent vistrail. Vistrails can also be stored in a database, enabling a central repository forworkflows. See Chapter 9 for more details about this feature.
To close a vistrail, you can either choose the Close option from the File menu or click thered ‘X’ button on the upper right side of the builder window. If the vistrail has not been saved,you will asked if you wish to save your work. To save a vistrail, there is both a button and amenu item in the File menu. If you would like to save the vistrail with a different name or ina different location, you can use the Save As option.
2.4 VisTrails Basics
If you are already familiar with workflows and workflow systems, you can skip this paragraph.In general, a workflow is a way to structure a complex computational process that may in-volve a variety of different resources and services. Instead of trying to keep track of multipleprograms, scripts, and their dependencies, workflows abstract the details of computations anddependencies into a graph consisting of computational modules and connections between thesemodules.
VisTrails exhibits an interface for building workflows that is similar to many existing work-flow systems. As such, it allows users to interactively create workflows using a extensible libraryof modules and a connection protocol thats helps a user determine how to connect modules.Users drag modules from a list of available modules to a workflow canvas to add them to a work-flow. Each module has a set of input and output ports, and outputs from one module can beconnected to inputs of another module, assuming that the types match. For more informationon building workflows in VisTrails, see Chapter 3.
In addition to providing an interface for manipulating individual workflows, VisTrails con-tains a number of features that function on a collection of workflows. A vistrail is a collectionof related workflows. As you explore different computational approaches or visualization tech-niques, a workflow may evolve in a lot of directions. VisTrails captures all of these changesautomatically and transparently. Thus, you can revisit a previous version of a workflow andmodify it without worrying about saving intermediate versions. This history is displayed bythe VisTrails Version Tree, and different ways of interacting with this tree are discussed inChapter 4.
With a collection of workflows, one of the necessary tasks is to search for specific workflows.The criteria for these searches may vary from finding workflows modified within a specific timeframe to finding workflows that contain a specific module. Because of the version history that

6 CHAPTER 2. GETTING STARTED
VisTrails captures, these tasks are natural to implement and query. VisTrails has two methodsfor querying workflows, a simple text-based query language and a query-by-example canvasthat allows users to build exactly the workflow structure they are looking for. Both of thesetechniques are described in Chapter 6.
The fourth button that toggles between the different modes in VisTrails allows users toexplore workflows by running the same workflow with different parameters. Parameter Ex-ploration provides an intuitive interface for computing workflows with parameters that varyin multiple dimensions. When coupled with the VisTrails Spreadsheet, parameter explorationallows you to quickly compare results and discover optimal parameter settings. See Chapter 7for specific information on using Parameter Exploration.
2.5 VisTrails Interaction
The Execute button serves as the “play” button for each of the modes describes above. In boththe Builder and Version Tree, it executes the current workflow. For querying, it executes thequery, and in parameter exploration, it executes the workflow for each of the possible parametersettings. The undo and redo buttons function in the standard way, but note that these actionsare implicitly switching between different versions of a workflow. Thus, you will notice that asyou undo or redo a change to a workflow, the selected version in the version tree changes.
For all modes except Parameter Exploration, the center pane of VisTrails is a canvas whereyou can manipulate the current workflow, version tree, or query workflow. The buttons onthe right side of the toolbar allow you to channge the default behavior of the standard mousebutton (the left button for most multiple button mice). You can choose the behavior to selectitems in the scene, pan around the scene, or zoom in and out of the scene by selecting the givenbutton. In addition, if you are using a mouse with multiple buttons, the right button will zoom,and the middle button will pan. To use the zoom functionality, click and drag up to zoom outand drag down to zoom in.

Chapter 3
Creating and Modifying Workflows
3.1 Working with Modules
In VisTrails, modules are represented by a rectangle in the Pipeline view of the Builder.The name of the module is shown in bold letters in the middle of the rectangle. The inputand output ports for the module are denoted by small squares on the top and bottom of themodule, respectively. Modules are connected together to define the dataflow using curved blacklines that go from output to input ports between modules. Each module may have also haveadjustable parameters that can be viewed when a module is selected. Modules can be connected,disconnected, added, and deleted from a workflow.
As an example of building workflows, we will modify a basic VTK workflow by replacingone module with another in the final workflow of the “vtk book 3rd p189.vt” vistrail. Afteropening this vistrail, you will need to click on the Pipeline button in the toolbar to edit theworkflow.
3.2 Adding and Deleting Modules
A list of available modules is displayed hierarchically in the Modules container on the left sideof the VisTrails Builder. A core set of basic modules are always distributed with the VisTrailssystem. Other packages, such as VTK, are also distributed, but are not necessary for VisTrailsand thus can be disabled on startup (see Chapter 11). Depending on the number of packagesimported on startup, the number of modules to select from can be difficult to navigate. Thus,a simple search box is provided at the top of the container to narrow the displayed results. Toadd a module to the workflow, simply drag the text from the Module container to the workflowcanvas.
Modules and connections may be selected in multiple ways and are denoted by a yellowhighlight. Besides directly left clicking on the object, a box selection is available by left clickingand dragging over the modules and connections. Multiple selection can be performed with the
7

8 CHAPTER 3. CREATING AND MODIFYING WORKFLOWS
(a) (b)
Figure 3.1: (a) The vtkCylinder module is added to the canvas, (b) the vtkQuadric moduleis deleted and the connection replaced.
box selection as well as by right clicking on multiple objects with the ‘Shift’ key pressed.There are several ways to manipulate selected modules in the workflow canvas. Moving
them is performed by dragging a selected module using the left mouse button. Deleting selectedmodules is performed by pressing the ‘Delete’ key. The modules and connections can also becopied and pasted using the Edit menu, or with ‘Ctrl-c’ and ‘Ctrl-v’, respectively.
In our running example, type “vtkCylinder” into the search box of the Module container.As the letters are typed, the list filters the available modules to match the query. Selectthis module and drag the text onto an empty space in the canvas. This module will replacethe vtkQuadric module in our example. Thus, select the vtkQuadric module in the canvasand press the ‘Delete’ key. This removes the module along with any connections it has (seeFigure 3.1).
3.3 Connecting Modules
Modules are connected in VisTrails through the input and output ports at the top and bottomof the module, respectively. By hovering the mouse over the box that defines a port, the nameand data type are shown in a small tooltip. To connect two ports from different modules,start by left clicking inside one port, then dragging the mouse to the other. The connectionline will automatically snap to the ports in a module that have a matching datatype. Sincemultiple ports may match, hovering the mouse over the port to confirm the desired match maybe necessary. Once a suitable match is found, releasing the left mouse button will create theconnection. Note, a connection will only be made if the input and output port’s data typesmatch. To disconnect a connection between modules, the line between the modules can beselected and deleted with the ‘Delete’ key.
Returning to our example, the new module vtkCylinder needs to be connected to thevtkSampleFunction module as the previous data source was. Place the cursor over the onlyoutput port on the vtkCylinder module, located on the bottom right. A tooltip should appear

3.4. CHANGING MODULE PARAMETERS 9
(a) (b) (c) (d)
Figure 3.2: (a)(c) The module methods interface is shown with a change of the SetRadius
parameter to 1.0 and 0.25. (b)(d) The results of the changes are displayed on execution.
that reads “Output port self (vtkCylinder)”. Left click on the port and drag the mouse over thevtkSampleFunction module. The connection should snap to the fourth input port from the left.Hovering the mouse over this port shows a tooltip that read “Input port SetImplicitFunction(vtkImplicitFunction)”. Release the mouse button to complete the connection between thesetwo modules (see Figure 3.1). To check for a valide dataflow, execute the workflow and see ifthe results appear in the spreadsheet.
3.4 Changing Module Parameters
The parameters for a module can be accessed in the Methods container located on the rightside of the Builder. When a module is selected from the canvas, the corresponding methods aredisplayed. As with the Modules container, a search box is provided to quickly find a desiredmethod. By default, the Builder only manages methods with set parameters. To check the setparameters, a Set Methods container is available below the Methods container. Changing aparameter can be performed directly in the Set Methods container. To set a parameter for thefirst time, click on the corresponding method and drag it into the Set Methods container, thenenter the parameters directly into the text boxes. To remove a set parameter, simply select themethod in the Set Methods container and press the ‘Delete’ key.
To perform a parameter change with our example, select the vtkCylinder module in thecanvas. The methods are shown hierarchically in the Methods container. Find the SetRadius
method and select it, then drag the highlighted text from the Methods container into the Set
Methods container below. The result is a SetRadius box with a Float text input. Enter0.25 into the text box and press the ‘Enter’ key. By executing the workflow, the modifiedvisualization appears in the spreadsheet. Figure 3.2 shows the interface and results of theparameter explorations.

10 CHAPTER 3. CREATING AND MODIFYING WORKFLOWS
(a) (b)
Figure 3.3: (a) The vtkCylinder module is configured to show an additional GetRadius port,which is then connected to a StandardOutput module. (b) The module configuration windowallows the hidden ports to be displayed.
3.5 Configuring Module Ports
For convenience, all the inputs and outputs of a module are not always shown in the canvasas ports. The ports that are shown by default are defined using an option when defining themethod signatures of a package. To access the full list of ports, the module configurationwindow is used. This is opened by selecting the triangle at the top right of a module to opena popup menu and selecting the Edit Configuration menu item, or alternatively by pressing‘Ctrl-E’ when a module is selected. The window shows a list of input and output ports andallows the user to toggle any additional ports to enable. When the configuration is complete,the new ports will appear on a module with a circle icon instad of the normal square. Thesenew ports can then be used for connections in the same way as the others.
As an example of configuring a module port, in our previous example select the vtkCylindermodule in the canvas and press ‘Ctrl-E’. In the newly opened configuration window, check thebox for the GetRadius port, then click OK to close the window. A new circle port should appearon the module. Next, add a new StandardOutput module from the basic modules and connectthe output port for GetRadius with the input port of StandardOutput. Upon execution, thevalue 0.25 is now output to the console. Figure 3.3 shows the new workflow together with themodule configuration window.
3.6 Basic Modules
In addition to the modules provided by external libraries, VisTrails provides a few basic modulesfor convenience and to facilitate the coupling of multiple packages in one workflow. Thesemodules mostly consist of basic data types in Python and some manipulators for them. Inaddition, file manipulation modules are provided to read files from disk and write files to disk.
Because every Python operation cannot be represented as a module, the PythonSource

3.6. BASIC MODULES 11
(a) (b)
Figure 3.4: (a) A PythonSource module can be used to directly insert scripts into the workflow.(b) The configuration window for PythonSource allows multiple input and output ports to bespecified along with the Python code that is to be executed.
module is provided to allow users to write Python statements to be executed as part of aworkflow. By pressing ‘Ctrl-E’ when a PythonSource module is selected in the canvas, aconfiguration window is opened. This window allows the user to specify custom input andoutput ports as well as directly enter Python source to be executed in the workflow.
To demonstrate a PythonSource module, we return to our example. Instead of using aStandardOutput module as above, we will output the center of the cylinder using Python.First, add a PythonSource module to the canvas and remove the StandardOutput module.Select the PythonSource module and press ‘Ctrl-E’ to edit the configuration. In the newlyopened configuration window, create a new input port named “center” of type Float. Next, inthe source window enter:
print center
then select OK to close the window. Finally, connect the GetRadius output of the vtkCylinder
module to the new input port of PythonSource. Upon execution, the radius of the cylinderis printed to the console as before. Figure 3.4 shows the new workflow together with thePythonSource configuration window.

Chapter 4
Interacting with the Version Tree
4.1 Version Tree View
The History button on the VisTrails Toolbar lets users interact with a workflow history. Itconsists of a tree view in the center and the Properties tool window on the right for queryingand managing version properties. Versions are displayed as ellipses in the tree view where theroot of the tree is displayed at the top of the view. The nodes of the tree correspond to aversion of a workflow while an edge between two nodes indicates that one was derived from theother.
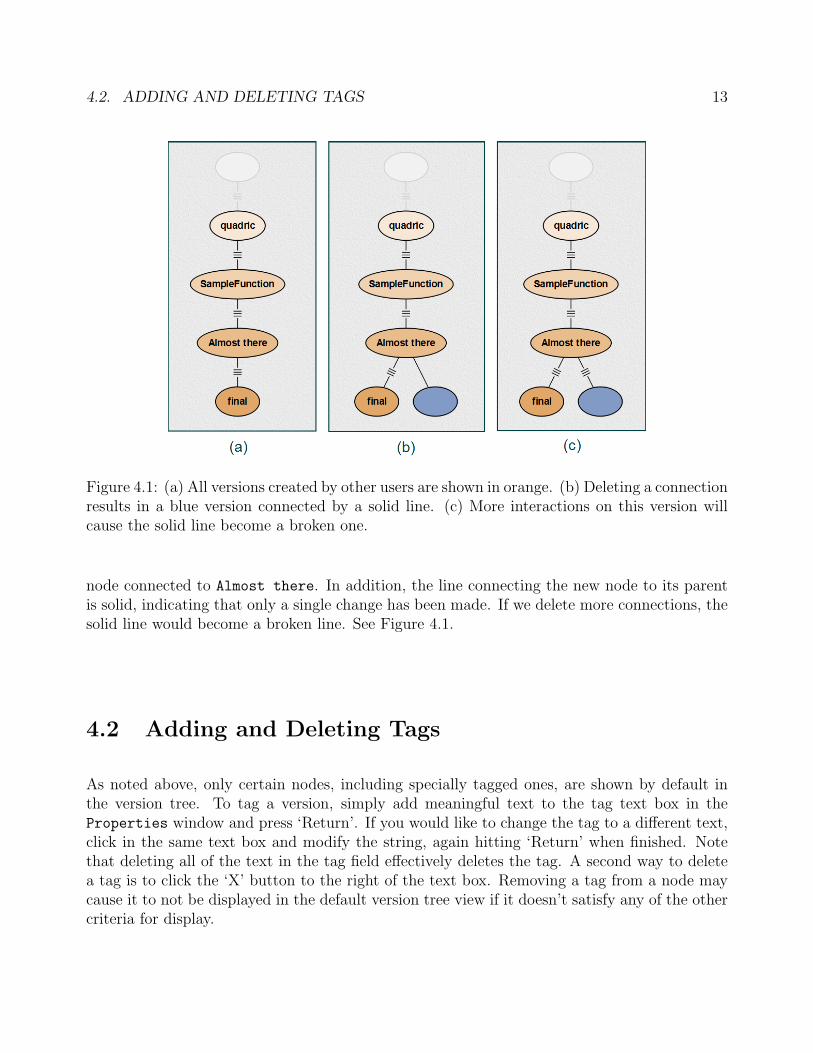
By default, only nodes that are leaves, have more than one child node, are specially tagged,and the current version, will be displayed. The nodes are displayed as colored ellipses, andare either blue or orange. A blue color denotes that the corresponding version was createdby the current user while orange nodes were created by other users. The brightness of eachnode indicates how recently a version was created; brighter nodes were created more recentlythan dimmer ones. Each node may also have a tag that describes the version, and this tag isdisplayed in the center of the ellipse of the corresponding version.
All of the versions are connected to each other by either solid or broken lines. A solid lineindicates that the child node is a direct descendant of the parent node, meaning the user hasmade only a single change from the older version to the newer version. Likewise, a brokenline indicates that more than one change has been made, but the intermediate versions havenot been tagged. Because most non-trivial changes to a workflow take more than action, mostedges in a the version tree will be shown as these broken lines.
To see an example of a version tree, load the example vistrail “vtk book 3rd p189.vt”. Allversions will be shown in orange unless your username happens to be “emanuele”. Recall thatthis tree displays the structure of changes to a workflow so let’s make some changes to see theireffect on the version history. In the History view, select the node tagged Almost there, andthen click on the Pipeline button to switch to a view of the workflow. Select a connectionand delete it. Now, switch back to the History view, and notice that there is a new child
12
4.2. ADDING AND DELETING TAGS 13
Figure 4.1: (a) All versions created by other users are shown in orange. (b) Deleting a connectionresults in a blue version connected by a solid line. (c) More interactions on this version willcause the solid line become a broken one.
node connected to Almost there. In addition, the line connecting the new node to its parentis solid, indicating that only a single change has been made. If we delete more connections, thesolid line would become a broken line. See Figure 4.1.
4.2 Adding and Deleting Tags
As noted above, only certain nodes, including specially tagged ones, are shown by default inthe version tree. To tag a version, simply add meaningful text to the tag text box in theProperties window and press ‘Return’. If you would like to change the tag to a different text,click in the same text box and modify the string, again hitting ‘Return’ when finished. Notethat deleting all of the text in the tag field effectively deletes the tag. A second way to deletea tag is to click the ‘X’ button to the right of the text box. Removing a tag from a node maycause it to not be displayed in the default version tree view if it doesn’t satisfy any of the othercriteria for display.

14 CHAPTER 4. INTERACTING WITH THE VERSION TREE
4.3 Adding Version Annotations
In addition to the tag field, the Properties window also displays information about the userwho created the selected version and when that version was created. At the top of the windowis a field for querying a vistrail, and this functionality is described in detail in Chapter 6. Thefinal piece of the window is the Notes field which allows users to store notes or annotationsrelated to a version. As with tags, adding notes to a version is as easy as selecting the desiredversion and modifying the text field. Notes are automatically saved when you save the vistrailfile.
4.4 Navigating Versions
Besides clicking on nodes of a version tree, you can also use the Undo and Redo buttons to changeversions. Because the version tree captures all changes to a workflow, undo and redo not onlyrevert or reinstate changes to a workflow, but also change the currently selected version in theversion tree. More precisely, undoing a change in a workflow is exactly the same as selectingthe parent of the current node in the version tree. Note that because the current version isalways shown in the version tree, undo and redo provide an effective way to navigate betweentwo nodes connected with a broken line.
4.5 Comparing Versions
While selecting versions in the History view and using the Pipeline view to examine eachversion is extremely useful, it can be cumbersome when trying to compare two different versions.To help with such a comparison, VisTrails provides a the Version Difference mechanism forquickly comparing two versions. There are two ways to compute this difference. The first is toselect two versions in the tree and choose Execute Version Difference from the Run menu.The easier method is to drag one version onto the other.
After either method, a Visual Diff window will open (see Figure 4.2). The difference isdisplayed in a manner that is very similar to the pipeline view, but modules and connectionsare colored based on similarity. Dark gray indicates those modules and connections that areshared between the two versions; orange and blue show modules and connections that exist inone workflow and not the other; and light gray modules are those where parameters betweenthe two versions differ. Clicking the Legend button will bring up a window to remind you whateach color corresponds to. For a module that is colored light gray, clicking on the Parameter
Changes button will bring up a window that shows the difference in parameters for that module.
Figure 4.2 shows the result of comparing the z-spaced and textureMapper versions inthe “lung.vt” example. To try out this feature, click and drag the z-space version to thetextureMapper version. Note that the cursor icon will change to a green plus when the drag

4.5. COMPARING VERSIONS 15
Figure 4.2: A Visual Diff showing the difference between version z-space and versiontextureMapper.
is valid. After the diff appears, click on the Parameter Changes button, and then click on thevtkRenderer module to see the parameter differences. We can see that one of the changes fromz-space to textureMapper was to add a black background.

Chapter 5
The Spreadsheet
As described in Section 4.5, VisTrails has a powerful built-in mechanism to compare workflows.However, this comparison shows changes in the design of the workflows, and we are often alsointerested in differences in the results of workflows. The VisTrails Spreadsheet provides a simple,flexible, and extensible interface to display and compare results from workflows. Coupled withthe version differences, users can explore the evolution of their workflows.
The Spreadsheet package is installed with VisTrails by default, and it can display a variety ofdata ranging from VTK renderings to webpages without additional configuration. In addition tothe included types of viewers, users can create and register additional viewers using customizedcell widgets (see Section 5.4).
5.1 The Spreadsheet Layout
As should be expected, the VisTrails Spreadsheet consists of one or more sheets, each with acustomizable number of rows and columns. Users can add additional sheets either by clickingthe New Sheet button in the Spreadsheet toolbar or choosing the menu item with the samename from the Main menu. Similarly, a sheet can be deleted by clicking the ‘X’ button in thelower-right corner or choosing the Delete Sheet menu item.
To modify the layout for the active sheet, you can both change the number of rows andcolumns and resize individual cells. The number of rows is controlled by the left spinner in thetoolbar and the number of columns by the right one. To resize a given row or column, clickand drag on one edge of the row or column header. In addition, you can resize an individualcell by moving the mouse to lower-right corner of the cell until the cursor changes and clickingand dragging to the desired size (see Figure 5.2(d)). Note that this will affect the entire layout,compressing or expanding rows and columns to generate or fill space for resized cell.
16

5.2. USING THE SPREADSHEET 17
Figure 5.1: The VisTrails Spreadsheet
5.2 Using the Spreadsheet
Currently, there are two operating modes in the Spreadsheet: Interactive Mode and EditingMode. Interactive Mode allows users to view and interact with the spreadsheet cells whileEditing Mode provides operations for manipulating cells. The modes can be toggled by theView menu or their corresponding keyboard shortcuts (‘Ctrl-Shift-I’) and ‘Ctrl-Shift-E’).
5.2.1 Interactive Mode
In Interactive Mode, users can interact directly with the viewer for an individual cell, interactwith multiple cells at once, or change the layout of the sheet. Because cells can differ in theircontents, interacting with a cell changes based on the type of data displayed. For example, ina VTKCell, a user can rotate, pan, and zoom in or out using the mouse.
In a sheet, a cell can be both active and selected. There can only be one active cell, andthat cell is highlighted by a yellow border. Clicking on any cell will make it active. This activecell will respond to keyboard shortcuts as well as mouse clicks and drags. In constrast to theactive cell, one or more cells can be selected, and the active cell need not be selected. Toselect multiple cells, either click on a row or column heading to toggle selection or ‘Ctrl’-clickto add or remove a cell from the group of selected cells. The backgrounds of selected cells are

18 CHAPTER 5. THE SPREADSHEET
Figure 5.2: Different states of a spreadsheet cell. (a) inactive and unselected (b) active andunselected (c) active and selected (d) an active cell with its toolbar and resizer
highlighted using the system’s selection color. See Figure 5.2 for examples of the different cellstates.
Depending on the cell type, additional controls may appear in the toolbar when a cell isactivated. These controls affect only the active cell, and change for different cell types. Asshown by Figure 5.2(d), an ImageViewerCell adds controls for resizing, flipping, and rotatingthe image in the active cell.
Arranging Cells
As described in Section 5.1, cells can be resized by either resizing rows, columns, or an individualcell. In addition to resizing, a row or column can be moved by clicking on its header and draggingit along the header bar to the desired position. See Section 5.2.2 for instructions on moving aspecific cell to a different location.
Synchronizing Cells
Often, when a group of cells all display results from similar workflows, it is useful to interactwith all of these cells at the same time. For example, for a group VTKCells, it is instructive torotate or zoom in on multiple cells at once and compare the results. For this reason, if a groupof cells is selected, mouse and keyboard events for a single cell of the selection are propogatedto each of the other selected cells. Currently, this feature only works for VTKCells, but we planto add this to other cell types as well. An example of this functionality is shown in Figure 5.3.
5.2.2 Editing Mode
Editing Mode provides more operations to layout and organize spreadsheet cells. In this mode,the view for each cell is frozen and overlaid with additional information and controls (seeFigure 5.4). The top of the overlay displays information about which vistrail, version, and type

5.3. SAVING A SPREADSHEET 19
Figure 5.3: When selecting all cells, interacting with one VTK cell (A1) causes the other twoVTK cells (B1 and B2) to change their camera to the same position.
of execution were used to generate the cell. The bottom piece of the overlay contains a varietyof controls to manipulate the cell depending on the its state.
Cells can be moved or copied to different locations on the spreadsheet by clicking anddragging the appropriate icons (Move or Copy) for a given cell to its desired location. To movea cell to a location on a different sheet, drag the icon over the target sheet tab to bring thatsheet into focus first and then drop it at the desired location. If you move a cell to an already-occupied cell, the contents of the two cells will be swapped. See Figure 5.4 for an example ofswappng two cells.
If a cell was generated via parameter exploration (see Chapter 7), the Create Version
button will be available to save the workflow that generated the result back to the vistrail.Clicking this button modifies the vistrail from which the cell was generated by adding a newversion with the designated parameter settings. Thus, if go back to the History mode of theVisTrails Builder for that vistrail, you will find that a new version has been added to the versiontree.
5.3 Saving a Spreadsheet
Warning: This is currently an experimental feature and as such is not robust. If you renameor move the vistrails used by the saved spreadsheet, the spreadsheet will not load correctly.
Because spreadsheets can include several workflow executions or parameter explorations,

20 CHAPTER 5. THE SPREADSHEET
Figure 5.4: The spreadsheet in Editing Mode. (a) All cell widgets are replaced with an in-formation widget (b) Two cells are swapped after drag and drop the ’Move’ icon from A1 toB1
it is helpful to be able to save the layout of the current spreadsheet. To save a spreadsheet,simply choose the Save menu item from the Main menu, and complete the dialog. After savinga spreadsheet, you can reopen it using the Open menu item.
5.4 Creating a Customized Cell Widget
Incomplete: This section will be added at a later date. Check the web site for more informationor contact the developers for more information.

Chapter 6
Querying the Version Tree
VisTrails is designed for manipulating collections of workflows, and an integral part of this designis the ability to quickly search through these collections. VisTrails provides two methods forquerying vistrails and workflows. The first is a query-by-example interface which allows usersto build query workflows and search for those with similar structures and parameters, and thesecond is a textual interface with a straightforward syntax. For each interface, the results areemphvisual: each matching version is highlighted in the History view, and if the query involvesspecific workflow characteristics, any matching entities are also highlighted in the Pipeline viewfor the current version.
6.1 Query By Example
One of the problems faced when trying to query a collection of workflows is the fact thatstructure is important. Suppose that you want to find only workflows where two modules areused in sequence. Instead of trying to translate this into a text-based syntax, it is easier toconstruct this relationship. VisTrails provides such an interface which mirrors the Pipeline
view, allowing users to construct a (partial) workflow to serve as the search criteria.
To use the Query by Example interface, click on the Query button on the toolbar. Thisview is extremely similar to the Pipeline view and pipelines can be built in a similar manner.Just like the Pipeline view, modules are added by dragging them from the list on the left sideof the window, connections are added by clicking and dragging from a port on one module to acorresponding port on another module, and parameters can be edited on the right-side of thewindow. One major difference between the Pipeline view and the Query view is that you canuse comparison operations in parameter values. For example, instead of searching for a pipelinethat contains a Float with a value of 4.5, you can search for a pipeline that contains a Floatwith a value ‘< 4.5’ or ‘> 4.5’. Figure 6.1 shows an example pipeline that has been built inthe query builder.
Note that Query by Example provides the capability to iteratively refine searches by adding
21

22 CHAPTER 6. QUERYING THE VERSION TREE
Figure 6.1: Example pipeline in query mode.
more criteria. For example, a user interested in workflows that contain a certain module mayfind that such a query returns too many results. That user can refine the query to only findthose workflows where the given module has a parameter setting that falls in a given range.
After constructing a pipeline, click the Execute button to begin the query. This buttonwill be available as long as the query window is not empty. Executing the query will bringyou back to the History view where the matching versions are displayed. Section 6.3 providesinformation on interacting with query results.
6.2 Textual Queries
There are many ways to search for versions in the version tree using texutal queries, but theyall rely on a simple text box for input. Begin a search by activating the History view. Thesearch box is in the Properties subwindow, and can be identified by the magnifying glass iconnext to it. If you enter query text, VisTrails will attempt to match logical categories, but ifyour query is more specific, VisTrails has special syntax to markup the query. Figure 6.2 showsan example query. To execute a query, simply press the ‘Return’ key after typing your query.
Table 6.1 lists the different ways to markup a query. Note that you can search by user nameto see which changes a particular user has made and also by date to see which changes weremade in a specific time frame. When searching by date, you can search for all changes beforeor after a given date or an amount of time relative to the present. If searching for changesbefore or after a specific date, the date can be entered in a variety of formats. The simplestis ‘day month year ’, but if the year is omitted, the current year is used. The month may bespecified by either name or numerical value. For example ‘before: 18 November 2004’ is a

6.2. TEXTUAL QUERIES 23
(a) (b)
Figure 6.2: (a) Query results in history view and (b) the Results in pipeline view.
Figure 6.3: A query made to find any changes made before Feb 19.

24 CHAPTER 6. QUERYING THE VERSION TREE
Search Type Syntax
User name user: user name
Annotation notes: phrase
Tag name: version tag
Datebefore: date | relative timeafter: date | relative time
Table 6.1: Syntax for querying specific information using textual queries.
valid query. If searching by relative time, you can prepend the amount of time relative to thepresent including the units to ‘ago’. An example of this type of query is ‘after: 30 minutes
ago’. The available units are seconds, minutes, hours, days, months, or years.You can concatenate simple search statements to create a compound search to search across
different criteria or for a specific range. For example, to search for workflows whose tag includes‘brain’ and were created by the user ‘johnsmith’, the query would be ‘name: brain user:
johnsmith’. To search for all workflows created between April 1 and June 1, the query wouldbe ‘after: April 1 before: June 1’.
6.3 Query Results
After executing either a query by example or a textual query, the matching versions are high-lighted in the version tree. In addition, there is a button named Reset Query in the lower-leftof the version tree that allows you to reset the query, returning the view to normal. For queriesby example, if you click on a specific matching version and change to the Pipeline view,the matching structure will also be highlighted. Figure 6.2 shows the results of the query byexample in Figure 6.1 in both the History and Pipeline views.
While in the History view, you can select two different ways of viewing search results.The magnifying glass icon to the left of the textual search box contains a dropdown menuwith two options: “Search” and “Refine”. The first displays results by simply highlighting thematching nodes while the second condenses the tree to show only the versions that match. Forlarge vistrails, this second method can help you determine relationships between the matchingversions more easily.
In addition, VisTrails keeps track of the most recent textual queries, and repeating thesequeries can be accomplished by selecting the recent query from the dropdown menu attachedto the search box. You can also clear recent searches using this menu. Finally, the ‘X’ buttonnext to the search box will reset the query and restore the normal view of the version tree.

Chapter 7
Parameter Exploration
While exploring workflows, one critical task is tweaking parameter values to improve simulationsor visualizations. VisTrails contains an integrated parameter exploration interface that allowusers to thoroghly explore the parameter space and quickly identify their desired settings. Bybinding parameters to a range of values, users can generate a collection of results without havingto tediously edit the workflow.
VisTrails Parameter Exploration is Spreadsheet-aware so users can map the intermediateresults from explorations to cells of the Spreadsheet. Because the Spreadsheet provides a multi-view, gridded, interface that makes efficient use of screen space, users can quickly compare theresults of different parameter settings. The changes in parameters can be displayed across rows,columns, and sheets. In addition, parameters can be explored across timesteps, and displayedin the Spreadsheet as animatations. This could be used, for example, to show how pathologicaltissues and tumors are affected by radiation treatment in a series of scans.
7.1 Creating a Parameter Exploration
Before beginning to explore parameters, make sure that the workflow that you wish to exploreis active. See Chapter 4 for information on selecting a specific workflow. To access VisTrailsParameter Exploration, click on the Exploration button in the VisTrails toolbar.
The Parameter Exploration window (shown in Figure 7.1) is centered around a tabularenvironment where the exploration parameters can be setup. On the right side of the window,there are a variety of panels that control aspects of the exploration (see Figure 7.4: the Set
Methods panel contains the list parameters that can be be explored; the Annotated Pipeline
panel displays the workflow to be explored an helps resolve ambiguities for parameter set-tings, and the Spreadsheet Virtual Cell aids users in laying out exploration results in thespreadsheet.
The columns headings of the main exploration window control how parameter values areinterpolated. The five controls on the to right side determine, from left to right, exploration in
25

26 CHAPTER 7. PARAMETER EXPLORATION
Figure 7.1: Parameter Exploration Window
Figure 7.2: Setting values for parameter exploration.
the ‘x’ direction, the ‘y’ direction, the ‘z’ direction, time, and no direction. The spinner nextto each of these controls the number of parameter values to be explored in that direction, andfor each parameter, you can select one of the directons to explore that parameter’s values.
To add parameters to an exploration, simply drag the corresponding method from the Set
Methods panel to the center canvas. To reduce clutter, this panel only shows the methods forwhich parameters were assigned values in the Pipeline view. See Chapter 3 for instructionson adding methods and parameters to a module.
After dragging a method to the exploration canvas, you can, for each parameter, set thecollection of values to be explored and the direction in which to explore. See Figure 7.2 foran example. The collection of values can be set by linear interpolation, a list of values, or auser-defined function. You can choose the desired method from the drop-down menu on theright side of the parameter heading. For linear interpolation, the starting and ending valuesmust be specified; for a list, the entire comma-separated list must be specified, and for a user-defined function, a Python function must be specified. For the list and user-defined functions,you can access an editor via the ‘...’ button. See Figure 7.3 for an example. In addition, you

7.1. CREATING A PARAMETER EXPLORATION 27
(a) (b)
Figure 7.3: Editors for (a) lists of values, and (b) user-defined functions.
(a) (b) (c)
Figure 7.4: The right panels of the Parameter Exploration window. The numbered red circlesdistinguish duplicate modules, and the cells in (c) determine the layout for spreadsheet results.
can manually enter a list using Python notation; for example, [30, 36, 45, 75]. To set thedirection in which to explore a given parameter, simply select the radio button in the columnfor the specified direction. Note that choosing the final column disables exploration for thatparameters.
In both the Set Methods and Annotated Pipeline panels, you may see numbered redcircles. See Figure 7.4 for an example of this behavior. These circles appear when there is morethan module of a given type in a workflow. For each type satisfying this criteria, the instancesare numbered and displayed so that you can identify which part of the pipeline a module in theSet Methods panel corresponds to.
To run a parameter exploration, click the Execute button in the VisTrails toolbar or selectExecute Parameter Exploration from Run menu.

28 CHAPTER 7. PARAMETER EXPLORATION
Figure 7.5: Results of the Virtual Cell arrangement.
7.2 Spreadsheet Integration
As stated earlier, the Spreadsheet provides integrated support for parameter explorations. Eachof the directions of exploration corresponds to a visual dimension in the spreadsheet: the ‘x’direction corresponds to columns; the ‘y’ direction to rows; the ‘z’ direction to sheets; and timeto animations. However, when a workflow already outputs to more than one cell, you can layoutthe group of cells as it will be replicated during the exploration. For example, given a workflowwith 2 output cells and an exploration for three parameter values in the ‘x’ direction, theresulting spreadsheet could be 1× 6 or 2× 3. The Spreadsheet Virtual Cell panel controlsthe layout of the pattern. Drag and drop cells to position them. See Figures 7.4(c) and 7.5 foran example.
7.3 Examples
To demonstrate the power of parameter exploration, we conclude this chapter with a couple ofdetailed examples. For these examples, make sure that the Spreadsheet is installed and enabled(see Chapter 5).

7.3. EXAMPLES 29
(a) (b)
Figure 7.6: Parameter Exploration of (a) two and (b) four isovalues as displayed in the Spread-sheet
7.3.1 Isosurfaces
One important task in visualization is finding isosurfaces that capture interesting features. Inthe this example, we’ll look at determining the interfaces between different types of tissuecaptured by CT scans. To begin, load the “terminator.vt” vistrail, select the “isosurface” nodein the version tree, and switch to parameter exploration. From the Set Methods panel, clickand drag the SetValue method of the vtkContourFilter module to the center view.
We’d like to compare different values for the isosurfaces so change the start and end valuesto “30” and “75”. Since side-by-side visualization will look better on most monitors, select theradio button below the ‘x’ dimension control, and increase the value of the control to 2 (seeFigure 7.2). Execute the exploration and switch to the Spreadsheet to view the results. Theyshould match Figure 7.6(a).
While these two isovalues show interesting features, we may wish to examine other interme-diate isosurfaces. To do so, switch back to the main VisTrails window and increase the numberof results to generate in the ‘x’ direction to four. VisTrails will calculate the intermediate valuesvia linear interpolation, and your execution of this new exploration should match Figure 7.6(b).
7.3.2 Resampling
The next example uses both X and Y dimension combo boxes to change the values of twoparameters at the same time in the same spreadsheet. For this we will add the modulevtkImageResample to the pipeline insert it between vtkStructuredPointsReader and vtkContourFilter
and connect the output of the reader to input of the resampler and the output of the resamplerto the input of the contour filter. Finally, select the vtkImageResample module and add theSetAxisMagnificationFactor method with parameter values 0 and 0.2. See Chapter 3 for
30 CHAPTER 7. PARAMETER EXPLORATION
reminders on how to accomplish these tasks.After modifying the workflow, switch back to the Exploration view, and add drag the
SetValue and SetAxisMagnificationFactor methods to the exploration table. Set the iso-values as in the previous example, but set the range of the second parameter of the magnificationfactor to start at at 0.2 and end at 1.0. Also, set the magnification factor to vary over the ‘y’direction. Finally, set the exploration to generate 16 results, four in the ‘x’ direction, and fourin the ‘y’ direction. Your exploration setup should match Figure 7.7(a), and after executing,you should see a result that resembles Figure 7.7(b). Notice that the isosurface changes fromleft to right while the images have less artifacts as the magnification factor approaches 1.0 fromtop to bottom.
7.3.3 Animation
To create an animation, we’ll use the same “terminator.vt” example (make sure that you havethe “Isosurface” version selected). Follow the same steps as in the Isosurface example, butthis time, use the range from 30 to 80 (again using linear interpolation) and select time as thedimension to explore, setting the number of results to generate to 7. See Figure 7.8(a) to checkyour settings. After executing, the Spreadsheet will show a single cell, but if you select thatcell, you will be able to click the Play button in the toolbar. You should see an animationwhere each frame is the result of choosing a different isovalue. A sample frame is displayed inFigure 7.8(b).

7.3. EXAMPLES 31
(a) Setting up parameter exploration
(b) Resulting spreadsheet
Figure 7.7: Using parameter exploration with two parameters

32 CHAPTER 7. PARAMETER EXPLORATION
(a) Setting up parameter exploration
(b) One frame from the resulting animation
Figure 7.8: Animations with parameter exploration

Chapter 8
Using Bookmarks
33

Chapter 9
Connecting to a Database
As an environment for collaborative scientific exploration, VisTrails supports both stand-alone,file-based storage and relational storage of vistrails. With a relational database supportingVisTrails, users can easily collaborate on projects without copying files back and forth. At thesame time, a user who wishes to work without being connected to a database can save theirwork locally to files. Finally, VisTrails can import and export to both types of storage so a usercan import a vistrail from the database, save it locally as a file on their laptop, make and savechanges, and export those changes back to the database. Remember that because the completeworkflow evolution is always saved, users will never step on each others’ feet.
By default, VisTrails works with local files stored in the “.vt” format (essentially compressedXML). You can save the uncompressed XML by saving the file with a “.xml” extension. Whensaving a vistrail, the system displays a standard save dialog. These files have a version associatedwith them so when the schema for these files may change, VisTrails will be able import olderversions. The current version of the XML schema can be found in the distribution at:
db/versions/v0_8_0/schemas/xml/vistrail.xsd
where v_8_0 is the current version.
9.1 Setup
As described earlier, VisTrails supports relational storage as well as file-based storage. Cur-rently, VisTrails has been tested with the MySQL system, but we plan to support most standardrelational systems.
9.1.1 Setting up the database
Before using VisTrails with a relational system, you must have a database system installedand have access to create, access, and modify that database. If you are planning to deploy for
34

9.2. OPENING FROM A DATABASE 35
institution-wide access, you should consult your system administrator to determine the correctconfiguration. The schema for relational VisTrails system can be found in the distribution at
db/versions/v0_8_0/schemas/sql/vistrails.sql
where v0_8_0 is the current version. This schema contains a sequence of SQL commands thatdefine the tables needed for storing vistrails.
After you or someone else has created the database for the vistrails, you will need thefollowing information:
1. hostname: the name or IP of the machine that stores the database (localhost if it isyour own machine)
2. port : the port that you connect to the database on
3. user : the username that should be used to access and modify the vistrails database
4. password : the password for the account corresponding to the given user
5. database name: the name of the database where the vistrails are to be stored.
9.1.2 Setting up VisTrails
If you would are planning to use the database for most of your work, you can switch VisTrailsto open vistrails from the database by default. To do so, open the Preferences window, andcheck the “Read/Write to database by default” box in the General Configuration tab. Youcan switch the default back to a file-based interaction by unchecking this box.
9.2 Opening from a database
If you have set VisTrails to use a relational database by default (see Section 9.1.2), you will beable to open a vistrail by either selecting Open from the File menu or clicking the button withthe same name on the toolbar. Otherwise, you should choose the Import item from the File
menu. You should see a dialog like the one pictured in Figure 9.1(a).If you have already connected to databases using VisTrails, you should see a list of them in
the left column of the dialog. If not, you will need to add one. To do so, click the plus icon inthe lower-left corner. This will bring up a dialog like that shown in Figure 9.1(b), and to setup aconnection, you will need the database connection information outlined in Section 9.1.1. Afterfilling in that information, you can test the connection by clicking the Test button. If the testsucceeds, click the Create button to add the database to the available sources for vistrails.
The database you wish to use should now be listed in the left column. Clicking on that rowwill query the database for a list of vistrails available from the database and display them in
36 CHAPTER 9. CONNECTING TO A DATABASE
(a) (b)
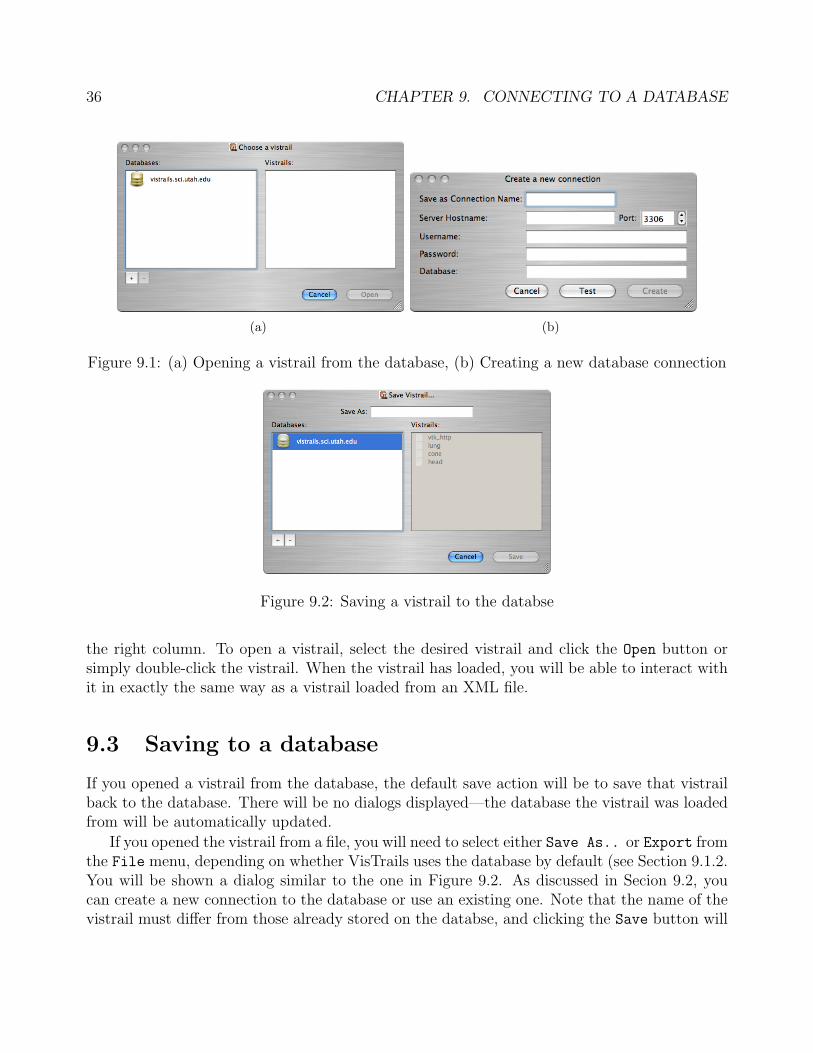
Figure 9.1: (a) Opening a vistrail from the database, (b) Creating a new database connection
Figure 9.2: Saving a vistrail to the databse
the right column. To open a vistrail, select the desired vistrail and click the Open button orsimply double-click the vistrail. When the vistrail has loaded, you will be able to interact withit in exactly the same way as a vistrail loaded from an XML file.
9.3 Saving to a database
If you opened a vistrail from the database, the default save action will be to save that vistrailback to the database. There will be no dialogs displayed—the database the vistrail was loadedfrom will be automatically updated.
If you opened the vistrail from a file, you will need to select either Save As.. or Export fromthe File menu, depending on whether VisTrails uses the database by default (see Section 9.1.2.You will be shown a dialog similar to the one in Figure 9.2. As discussed in Secion 9.2, youcan create a new connection to the database or use an existing one. Note that the name of thevistrail must differ from those already stored on the databse, and clicking the Save button will

9.4. KNOWN ISSUES 37
persist the changes to the database.
9.4 Known Issues
Currently, saving a vistrail to the database will overwrite the vistrail currently stored on thedatabase. However, we plan to add synchronization soon so that all explorations are captured.Thus, be aware that if two users have the same vistrail loaded from the database at the sametime, and both users save their changes, only the second user’s changes will be captured.

Chapter 10
Using Analogies to Update Workflows
38

Chapter 11
Writing VisTrails Packages
11.1 Introduction
VisTrails provides a plugin infrastructure to integrate user-defined functions and libraries.Specifically, users can incorporate their own visualization and simulation codes into pipelinesby defining custom modules. These modules are bundled in what we call packages. A VisTrailspackage is simply a collection of Python classes stored in one or more files, respecting someconventions that will be described shortly. Each of these classes will represent a new module.In this chapter, we will build progressively more complicated modules. Note that even thougheach section introduces a specific large feature of the VisTrails package mechanism, new smallfeatures are highlighted and explained as we go along. Because of this, we recommend at leastskimming through the entire chapter at least once.
Let us start with a minimal complete example of a very simple calculator:
1 import core.modules.module_registry2 from core.modules.vistrails_module import Module, ModuleError
3 version = "0.9.0"
4 name = "PythonCalc"
5 identifier = "edu.utah.sci.vistrails.pythoncalc"
6 class PythonCalc(Module):7 """PythonCalc is a module that performs simple arithmetic operations on8 its inputs."""
9 def compute(self):
10 v1 = self.getInputFromPort("value1")
11 v2 = self.getInputFromPort("value2")
12 result = self.op(v1, v2)13 self.setResult("value", result)
39

40 CHAPTER 11. WRITING VISTRAILS PACKAGES
14 def op(self, v1, v2):
15 op = self.getInputFromPort("op")16 if op == ’+’: return v1 + v217 elif op == ’-’: return v1 - v218 elif op == ’*’: return v1 * v219 elif op == ’/’: return v1 / v220 else: raise ModuleError(self, "unrecognized operation: ’%s’" % op)
21 ###############################################################################
22 def initialize(*args, **keywords):
23 # We’ll first create a local alias for the module registry so that24 # we can refer to it in a shorter way.25 reg = core.modules.module_registry.registry
26 reg.addModule(PythonCalc)
27 reg.addInputPort(PythonCalc, "value1",28 (core.modules.basic_modules.Float, ’the first argument’))29 reg.addInputPort(PythonCalc, "value2",30 (core.modules.basic_modules.Float, ’the second argument’))31 reg.addInputPort(PythonCalc, "op",32 (core.modules.basic_modules.String, ’the operation’))33 reg.addOutputPort(PythonCalc, "value",34 (core.modules.basic_modules.Float, ’the result’))
To try this out in VisTrails, save the file above in your packages directory as pythoncalc.py.Then, click on Edit and then Preferences. A dialog similar to what is shown in Figure 11.1should appear. Select the pythonCalc package, then click on Enable... This should move thepackage to the Enabled packages list. Close the dialog. The package and module should nowbe visible in the VisTrails builder.
Now create a workflow similar to what is shown in Figure 11.2. When executed, thisworkflow will print the following on your terminal:
1 7.0
Let’s now examine how this works. The first two lines simply import required components.Then, we have three lines that give VisTrails meta-information about the package. version issimply information about the package version. This might be tied to the underlying library ornot. The only recommended guideline is that compatibility is not broken across minor releases,but this is not enforced in any way. name is a human-readable name for the package.

11.1. INTRODUCTION 41
Figure 11.1: All available packages can be enabled and disabled with the VisTrails preferencesdialog.

42 CHAPTER 11. WRITING VISTRAILS PACKAGES
Figure 11.2: A simple workflow that uses PythonCalc, a user-defined module.

11.1. INTRODUCTION 43
Choosing a good identifier The most important meta-data, however, is the package iden-tifier, stored in identifier. This is a string that must be globally unique across all packages,not only in your system, but in any possible system. We recommend using an identifier similarto Java’s package identifiers. These look essentially like regular DNS names, but the word orderis reversed. This makes sorting on the strings a lot more meaningful. You should generally gofor institution.project.creatorusername for a package related to a certain project fromsome institution, and institution.creatorname for a personally developed package. If youare wrapping third-party functionality, do not use their institution’s DNS, use your own. Therationale for this is that the third party itself might decide to create their VisTrails package,and you do not want to introduce conflicts.
Line 6 is where we actually start defining a new module. Every VisTrails module correspondsto a Python class that ultimately derives from Module, a class defined in core.modules.vistrails module.A new module must implement a compute method that takes no extra parameters, such as onLine 9. This method represents the actual computation that happens in a module. This com-putation typically involves getting the necessary input and generating the output. We will nowsee how that works.
Line 10 shows how to extract input from a port. Specifically, we’re getting the values passedto input ports value1 and value2. We then perform some operation with these values, andneed to report the output on an output port, so that it is available for downstream modules.This is done on Line 13, where the result is set to port value.
Let us now look more carefully at the remainder of the class definition. Notice that develop-ers are allowed to define extra helper methods (Line 14). These methods can naturally use theports API. The other important feature of op(self, v1, v2) is error checking. PythonCalc
requires a string that represents the operation to be performed with the two numbers. If thestring is invalid, it signals an error, by simply raising a Python exception ModuleError thatis provided in core.modules.vistrails module. This exception expects two parameters: themodule that generated the exception (typically self) and a string describing the error, whichwill be presented to the user.
That is all that it takes in terms of module behavior. The rest of the code is meant tointeract with VisTrails, and let the system know about the modules and ports being exposed.To do that, users must provide an function in the main body of the package file (the functionstarting on Line 22). The first thing is usually to register the module itself, such as on Line26. Then, we need to tell VisTrails about the input and output ports we want to expose.Input ports are set with the addInputPort method in the registry, and output ports, withaddOutputPort. These calls take three parameters. The first parameter is the module you’readding a new port to. The second one is simply the name of the port, and the third one isa description of the parameter. In simple cases, this is just a pair, where the first element isa VisTrails module representing the module type being passed, and the second element is astring describing it. Later, we will see how to pass more complicated data types. Notice thatthe types being used are VisTrails modules (Line 30), and not Python types.

44 CHAPTER 11. WRITING VISTRAILS PACKAGES
This is it — you have successfully created a new package and modules. From now on, wewill look at more complicated examples, and more advanced features of the package mechanism.
11.2 Wrapping Command-line tools
Many existing programs are readily available through a command-line interface. Also, manyexisting workflows are usually first implemented through scripts, which work primarily withcommand-line tools. This section describes how to wrap command-line applications so theycan be used with VisTrails. We will use as a running example the afront package, which wrapsafront, a program to generate 3D triangle meshes1. This package is available by default ona VisTrails install. We will wrap the basic functionality in three different modules: Afront,MeshQualityHistogram and AfrontIso.
11.2.1 Class Mixins
Each of these modules will be implemented by a Python class, and they will all invoke theafront binary. Afront is the base execution module, and AfrontIso requires extra parameterson top of the original ones. Because of this, we will implement AfrontIso as a subclassof Afront. MeshQualityHistogram, however, requires entirely different parameters, and soshould not be a subclass of Afront. Our package will look something like this, then:
1 from core.modules.vistrails_module import Module2 ... # other import statements
3 name = "Afront"4 version = "0.1.0"5 identifier = "edu.utah.sci.cscheid"
6 class Afront(Module):7 def compute(self):8 ... # invokes afront
9 class AfrontIso(Afront):10 def compute(self):11 ... # invokes afront with additional parameters
12 class MeshQualityHistogram(Module):13 def compute(self):14 ... # invokes afront with completely different parameters
1Afront is available at http://afront.sourceforge.net

11.2. WRAPPING COMMAND-LINE TOOLS 45
15 def initialize():16 ...
It should be clear that all three modules share some functionality (invoking afront), butnot all. We would like to avoid duplicate code, but there is not a single class where we canimplement the base code. The solution is to create a mixin class, where we implement thenecessary functionality, and then inherit from both classes. In the following snippets, we willhighlight the changes in the code.
1 from core.modules.vistrails_module import Module, ModuleError2 from core.system import list2cmdline3 import os
4 class AfrontRun(object):5 _debug = False6 def run(self, args):7 cmd = [’afront’, ’-nogui’] + args8 cmdline = list2cmdline(cmd)9 if self._debug:
10 print cmdline11 os.system(cmdline)12 if result != 0:13 raise ModuleError(self, "Execution failed")
14 class Afront(Module, AfrontRun):15 ...
16 class MeshQualityHistogram(Module, AfrontRun):17 ...
Now every module in the afront package has access to run(). The other new feature inthis snippet is list2cmdline, which turns a list of strings into a command line. It does thisin a careful way (protecting arguments with spaces, for example). Notice that we use a call toa shell (os.system()) to invoke afront. This is frequently the easiest way to get third-partyfunctionality into VisTrails.
11.2.2 Package Configuration
There are two obvious shortcomings to the way run() is implemented. First, the code assumesafront is available in the system path, which might not be true in practice. Second, thedebugging variable is inaccessible to the interface, where it would be really handy. VisTrails
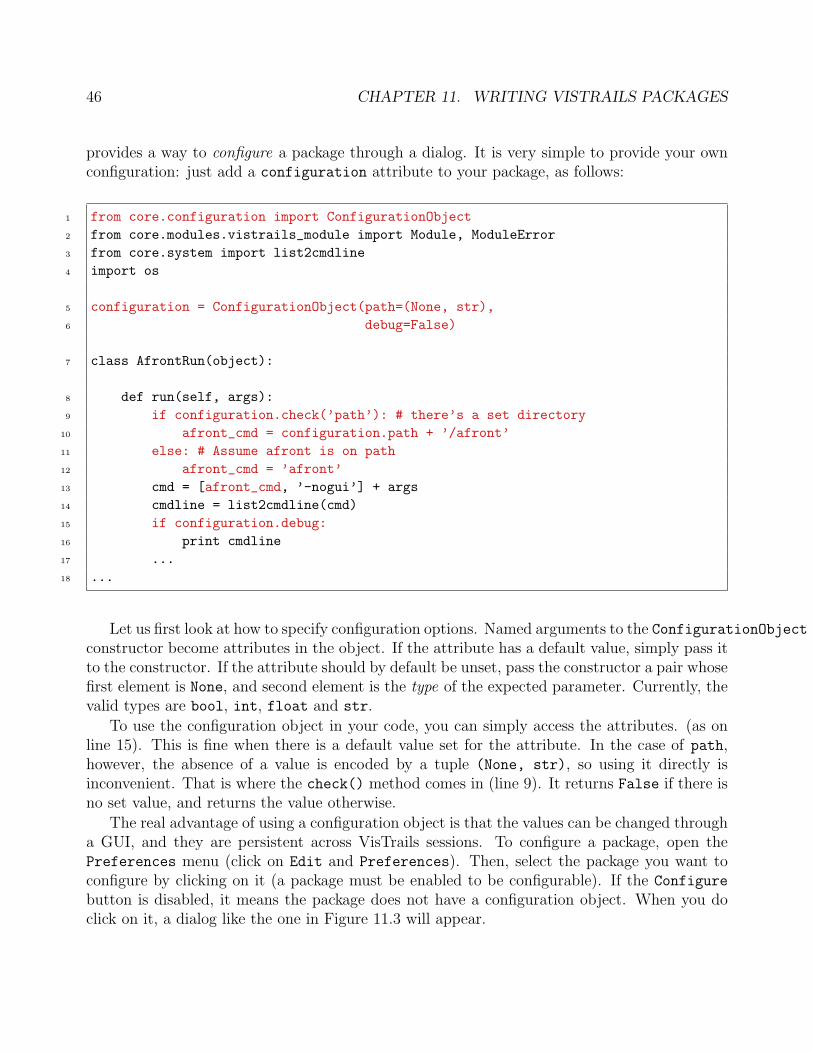
46 CHAPTER 11. WRITING VISTRAILS PACKAGES
provides a way to configure a package through a dialog. It is very simple to provide your ownconfiguration: just add a configuration attribute to your package, as follows:
1 from core.configuration import ConfigurationObject2 from core.modules.vistrails_module import Module, ModuleError3 from core.system import list2cmdline4 import os
5 configuration = ConfigurationObject(path=(None, str),6 debug=False)
7 class AfrontRun(object):
8 def run(self, args):9 if configuration.check(’path’): # there’s a set directory
10 afront_cmd = configuration.path + ’/afront’11 else: # Assume afront is on path12 afront_cmd = ’afront’13 cmd = [afront_cmd, ’-nogui’] + args14 cmdline = list2cmdline(cmd)15 if configuration.debug:16 print cmdline17 ...18 ...
Let us first look at how to specify configuration options. Named arguments to the ConfigurationObjectconstructor become attributes in the object. If the attribute has a default value, simply pass itto the constructor. If the attribute should by default be unset, pass the constructor a pair whosefirst element is None, and second element is the type of the expected parameter. Currently, thevalid types are bool, int, float and str.
To use the configuration object in your code, you can simply access the attributes. (as online 15). This is fine when there is a default value set for the attribute. In the case of path,however, the absence of a value is encoded by a tuple (None, str), so using it directly isinconvenient. That is where the check() method comes in (line 9). It returns False if there isno set value, and returns the value otherwise.
The real advantage of using a configuration object is that the values can be changed througha GUI, and they are persistent across VisTrails sessions. To configure a package, open thePreferences menu (click on Edit and Preferences). Then, select the package you want toconfigure by clicking on it (a package must be enabled to be configurable). If the Configure
button is disabled, it means the package does not have a configuration object. When you doclick on it, a dialog like the one in Figure 11.3 will appear.
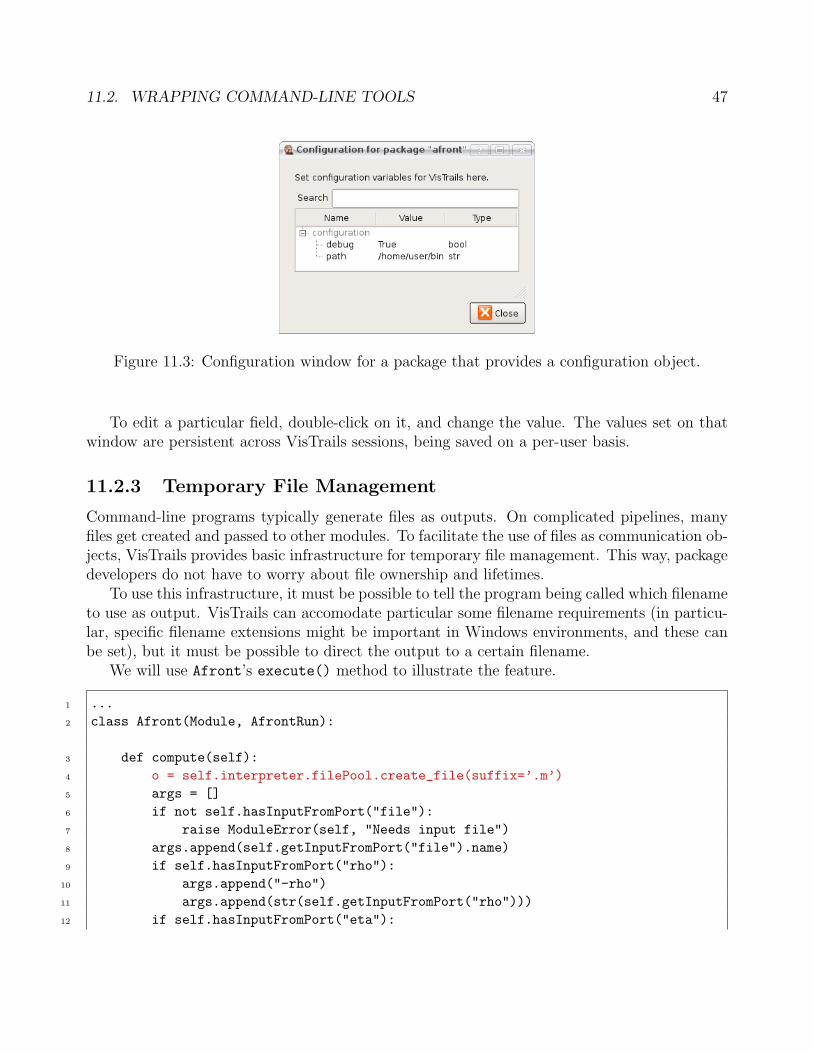
11.2. WRAPPING COMMAND-LINE TOOLS 47
Figure 11.3: Configuration window for a package that provides a configuration object.
To edit a particular field, double-click on it, and change the value. The values set on thatwindow are persistent across VisTrails sessions, being saved on a per-user basis.
11.2.3 Temporary File Management
Command-line programs typically generate files as outputs. On complicated pipelines, manyfiles get created and passed to other modules. To facilitate the use of files as communication ob-jects, VisTrails provides basic infrastructure for temporary file management. This way, packagedevelopers do not have to worry about file ownership and lifetimes.
To use this infrastructure, it must be possible to tell the program being called which filenameto use as output. VisTrails can accomodate particular some filename requirements (in particu-lar, specific filename extensions might be important in Windows environments, and these canbe set), but it must be possible to direct the output to a certain filename.
We will use Afront’s execute() method to illustrate the feature.
1 ...2 class Afront(Module, AfrontRun):
3 def compute(self):4 o = self.interpreter.filePool.create_file(suffix=’.m’)5 args = []6 if not self.hasInputFromPort("file"):7 raise ModuleError(self, "Needs input file")8 args.append(self.getInputFromPort("file").name)9 if self.hasInputFromPort("rho"):
10 args.append("-rho")11 args.append(str(self.getInputFromPort("rho")))12 if self.hasInputFromPort("eta"):

48 CHAPTER 11. WRITING VISTRAILS PACKAGES
13 args.append("-reduction")14 args.append(str(self.getInputFromPort("eta")))15 args.append("-outname")16 args.append(o.name)17 args.append("-tri")18 self.run(args)19 self.setResult("output", o)20 ...
Line 4 shows how to create a temporary file during the execution of a pipeline. There area few new things happening, so let us look at them one at a time. Every module holds areference to the current interpreter, the object responsible for orchestrating the execution of apipeline. This object has a filePool, which is what we will use to create a pipeline, throughthe create file method. This method takes optionally a named parameter suffix, whichforces the temporary file that will be created to have the right extension.
The file pool returns an instance of basic modules.File, a module that is provided by thebasic VisTrails packages. There are two important things you should know about File. First,it has a name attribute that stores the name of the file it represents. In this case, it is the nameof the recently-created temporary file. This allows you to safely use this file when calling ashell, as can be seen on Line 16. The other important feature is that it can be passed directlyto an output port, so that this file can be used by subsequent modules. This is shown on Line19.
Accomodating badly-designed programs Even though it is considered bad design to notallow the specification of output filename, there exist programs that do so. In this case, apossible workaround is to execute the command-line tool, and move the generated file to thename given by VisTrails.
11.3 Interpackage Dependencies
When creating more sophisticated VisTrails packages, you might want to create a new mod-ule that requires a module from another package. For example, using modules from differentpackages as input ports, or even subclassing modules from other packages require managing ofinterpackage dependencies. VisTrails needs to know about these, so packages can be initializedin the correct order. To specify these dependencies, you should add a python callable nameddependencies to your package. We will start with a simple situation where new input andoutput ports are added to PythonCalc, one that uses modules in a different package:
1 ...

11.3. INTERPACKAGE DEPENDENCIES 49
2 class PythonCalc(Module):
3 def compute(self):4 ...
5 # Computes values for SciPy matrices as well6 if self.hasInputFromPort("mat1"):7 m1 = self.getInputFromPort("mat1")8 m2 = self.getInputFromPort("mat2")9 self.setResult("mat_value", self.mat_op(m1, m2))
10 def mat_op(self, v1, v2):11 reg = core.modules_module_registry.registry12 Matrix = reg.getDescriptorByName(’Matrix’).module13 result = Matrix()14 result.matrix = self.op(m1.matrix, m2.matrix)15 return result
16 ...
17 def dependencies():18 return ["SciPy"]
19 def initialize():20 ...21 Matrix = reg.getDescriptorByName(’Matrix’).module
22 reg.addInputPort(PythonCalc, "mat1", (Matrix, ’first matrix’))23 reg.addInputPort(PythonCalc, "mat2", (Matrix, second matrix’))24 reg.addOutputPort(PythonCalc, "value", (Matrix, matrix result))
Let us look at the first new call on Line 6. hasInputFromPort can be used for optionalports : ports that only used when there are connections attached to it. If there is one suchconnection, we get the inputs from both ports, and call mat op. This method will perform thenecessary conversion to native SciPy matrices before calling op.

50 CHAPTER 11. WRITING VISTRAILS PACKAGES
11.4 Requirements
11.5 Interaction with Caching
11.6 Advanced: Wrapping a big API
In the future, there will be a walkthrough of the VTK package wrapping mechanism.

Chapter 12
Advanced Topics: Module Executionand Caching
51

Chapter 13
Example: Web Services
In this chapter, you will learn how to invoke web services from within VisTrails workflows.We will build a simple workflow that invokes a few web services and publishes a web pagewith the results. The web services we will use are provided by The Chemical Informaticsand Cyberinfrastructure Collaboratory (CICC) at Indiana University and can be found athttp://www.chembiogrid.org/products/index.html.
13.1 Enabling the webServices Package
The first thing we need to do after starting VisTrails is to enable the “webServices” packageon the Preferences pane.
Open the Preferences panel (On Windows and Linux, it is located under the Edit menu,and on the Mac, it is under the VisTrails menu), and select the tab named Module Packages
(see Figure 13.1). On the Disabled packages list, select webServices and click on Enable.Now select webServices on the Enabled packages list and click on Configure. A new
window will appear and you will be able to add a ‘;’-separated list of web services urls. SelectwsdlList and click on the Value field. You can type the web services urls you want. For ourexample, we need the following two urls:
http://rguha.ath.cx:8080/pws/services/Structure?wsdl;
http://rguha.ath.cx:8080/cdkws/services/StructureDiagram?wsdl
Click on Close. Then you are required to disable and enable the package again so the urlscan be loaded. After that, close the Preferences window.
13.2 Creating a new vistrail
After configuring the webServices package properly, you will see that there will be a tabwebServices in your Modules panel (see Figure 13.2(a)). The webService package will generate
52

13.3. ADDING MODULES TO THE WORKFLOW 53
Figure 13.1: webServices package information shown on VisTrails Preferences Pane.
a module for each published method in a web service. If you do not already have a new vistrailsopen, that is the right time to create a new one.
13.3 Adding modules to the workflow
At this point, we should start adding modules to our workflow.
If you have the web services list visible in your Modules panel, click on “getSmilesByCID”and drag it to the Pipeline view area. Otherwise, use the search capability: in the Search fieldof the Modules panel (the leftmost pane of the Builder Window), type in “getSmilesByCID”.You will notice that a module under the webServices branch will be selected. Now you canadd it by clicking-and-dragging it over the Pipeline view area represented by the darkergrey canvas on the Builder Window. This module gets the SMILES 1 corresponding to acompound ID. We need to add more modules that will process the output provided by thegetSmilesByCID module, including another web service module that will obtain the 2D diagramof the compound. In the same way described above, add the following modules (the number inparenthesis represents the number of modules you should add):
• PythonSource(2)
• getDiagram(1)
• RichTextCell(1)
1Simplified Molecular Input Line Entry System. Specification for unambiguously describing the structure ofchemical molecules using short ASCII strings.

54 CHAPTER 13. EXAMPLE: WEB SERVICES
(a) (b) (c)
Figure 13.2: (a) The webServices tab is added to the Modules panel after modifying vistraisstartup.py file (b) All the modules necessary for building the workflow were added to theworkflow (c) the version tree after tagging the current version
After adding these modules, our workflow should be similar to the one shown in Figure 13.2(b).
The modules were added to the pipeline view, but remain unconnected. This is a goodpoint for us to save our work. First we will name this pipeline as modules. To do that, we needto switch to the version tree view by selecting the Version Tree tab in the top pane on theright of the buider window. In the vtinterfaceVersion Tag field type in “modules” and click onchange. Your version tree should now look similar to the one in Figure 13.2(c).
Now we save our work by clicking on the Save button (the third from left to right on theBuilder Toolbar) or pressing ‘Ctrl+S’ (‘Command+S’ on Mac). Give a name to your file, suchas “chembiogrid webservice.xml”. Then we can go back to the pipeline view by selecting thePipeline tab.
13.4 Module customization and parameterization
Each module box has a set of input ports, located in the upper-left hand corner of the box, anda set of output ports, located in its lower-right hand corner. They will be used to pipe databetween modules. You may have noticed that the PythonSource module does not contain anyinput or output port. This module is designed to contain any piece of Python code. So we, aspipeline builders, must define the input and the output ports and include the piece of code tomanipulate the inputs and generate outputs. We are going to use this module to process databetween the web services and to create our html page.

13.4. MODULE CUSTOMIZATION AND PARAMETERIZATION 55
First, open the configuration window of the top most PythonSource module by clicking onthe arrow on the top-right corner of the module box and select Edit Configuration (pleaserefer to Chapter 3 for more information on PythonSource).
Add one input port, “data” of type String (the same output type of getSmilesByCID
module) and add an output port called “smiles” also of type String (the same input type ofgetDiagram).
Now type the following code in the text area and click “OK” when you are done:
smiles = data[0]
The getSmilesByCID module returns an array of strings encoded in a String object. ThegetDiagram module, on the other hand, expects a single “smiles”. So we need to extract onlyone element of the array and pipe it through the getDiagram module (later you can add anotheroutput port and pipe the other smiles to another getDiagram module.
Now we will customize the other PythonSource. Open its Configuration Window and addan input port, “diagram” of type String (the same output type of the getDiagram module).Also, add an output port, htmlFile of type File and type the following piece of code in thetext area:
import base64image = base64.decodestring(diagram)f = self.interpreter.filePool.create_file(".jpg")my_file = open(str(f.name), ’wb’)my_file.write(image)my_file.close()text = ’<HTML><TITLE>Compound Summary</TITLE><BODY BGCOLOR="#FFFFFF">’text += ’<TABLE WIDTH="100%" BORDER="1" BGCOLOR="#FFFFFF" %CELLPADDING="4"> ’text += ’<TR><TD VALIGN="TOP"><P><IMG SRC="’text += f.name + ’"></TD>’text += ’<TD>Name:<B>: Caffeine </B><BR>’text += "A methylxanthine naturally occurring in some beverages and "text += "also used as a pharmacological agent. Caffeine’s most notable "text += "pharmacological effect is as a central nervous system stimulant,"text += " increasing alertness and producing agitation.</TD></TR></TABLE>"output = self.interpreter.filePool.create_file()my_file = open(str(output.name), ’w’)my_file.write(text)my_file.close()self.setResult("htmlFile",output)
The PythonSource Configuration Window should look similar to the one shown on Fig-ure 13.3.
We also need to set a few parameters in order to getSmilesByCID to work properly.getSmilesByCID receives a compound ID. Caffeine’s CID is 2519.

56 CHAPTER 13. EXAMPLE: WEB SERVICES
Figure 13.3: The code for decoding the image and generating the html file.
The getDiagram also needs parameters to be set. Provide the following values: “height”:250, “width”: 250, and “scale”: 1.0. Please refer to Chapter 3 for details on how to setparameters.
Let’s give the name “parameters set” to this pipeline. Repeat the steps we performed aboveto change a version tag and save your pipeline.
13.5 Connecting modules
Now that we have all the modules necessary to process our data, we must connect them properlyto fully form our processing pipeline. Each module box has a set of input ports, located in theupper-left hand corner of the box, and a set of output ports, located in its lower-right handcorner. In order to connect two modules together, click-and-drag the appropriate output boxcontained in the module to the module using it as its input. For modules that have more thanone input/output, you can see the type of each individual port when hovering the mouse (as atooltip). VisTrails will also snap a connection to matching ports.
So, for example, by clicking and dragging the output port of the getSmilesByCID module tothe input port of PythonSource module, a connection will be made between the two modules.

13.6. EXECUTING THE WORKFLOW 57
Figure 13.4: The html report generated by our pipeline.
This connection is indicated by a solid black line. Now we must continue connecting ourpipeline. Add the following connections in the same way described above:
• The output port of PythonSource to the input port “smiles” of getDiagram
• The output port of getDiagram to the input port of PythonSource
• The output port of PythonSource to the input port “File” of RichTextCell
Name this version “connections” and you are ready to execute this pipeline.
13.6 Executing the workflow
The workflow is now ready to be visualized. As we have a RichTextCell module, pressing theExecute current pipeline button will send the current pipeline with the current parametersto the VisTrails Spreadsheet, resulting on an image similar to Figure 13.4.

Chapter 14
Example: ITK
14.1 Introduction to ITK
The Insight Toolkit, or ITK [1], is an open-source software system designed to support theVisible Human Project [2]. ITK is under continual development, being updated to employcutting-edge segmentation and registration algorithms for multiple dimensions.
In order to fascilitate the implementation of processing mechanisms specific to the medicalimaging community, ITK provides a robust set of general purpose image processing tools. Theseimage processing tools are available to users through the standard ITK Filter interface [3].Although ITK is implemented in C++, through the use of CMake 1 and CableSwig 2, thefunctionality of ITK is made available to languages such as TCL, Java, and Python.
14.2 Preparing ITK
At the time of this writing, the latest stable release of ITK is 3.2.0In order to incorporate the functionality of ITK into the VisTrails system, it first must
be built and installed. In the following sections, we will describe in detail the process ofdownloading, building, and installing ITK and all the required components needed to use it.
14.2.1 Downloading ITK
ITK can be downloaded in either source tarballs or via public CVS access to the ITK sourcerepository. The following instructions take advantage of the CVS source repository; however,source tarballs can be downloaded from:
• http://www.itk.org/HTML/Download.php
1CMake cross-platform make system. http://www.cmake.org.2CableSwig Interface generator. http://www.itk.org/HTML/CableSwig.html
58

14.2. PREPARING ITK 59
These instructions can be found, in part, at the ITK website 3. To use CVS, you musthave a CVS client installed on your system. To download the ITK library, issue the followingcommands:
cvs -d :pserver:[email protected]:/cvsroot/Insight login
password: insight
cvs -d :pserver:[email protected]:/cvsroot/Insight co Insight
Change directory into the newly created Insight/Utilities directory and issue the followingcommand:
cvs -d :pserver:[email protected]:/cvsroot/CableSwig co CableSwig
This checkout includes CableSwig in the ITK system allowing it to be built automaticallyduring compilation of ITK itself.
14.2.2 Building the ITK Libraries
ITK requires CMake to be installed and available on your system. CMake can be found at:
• http://www.cmake.org
As of ITK version 3.2.0, CMake version 2.4.6 or greater must be used to prevent compilationerrors. In order to simplify updating ITK to later versions of the software, we perform an out-of-source build. To do this, we first create a directory outside the Insight directory created forus during the CVS checkout process.
mkdir itkcd itk
We now run cmake, or the GUI-based version ccmake, in this directory.
ccmake ../Insight
Note: The above command assumes that the Insight directory exists at the same level asthe itk directory that we just created.
The following advanced CMake variables must be set to the appropriate values:
3ITK website. http://www.itk.org

60 CHAPTER 14. EXAMPLE: ITK
CMake Variable ValueBUILD SHARED LIBS ON
INSTALL WRAP ITK COMPATIBILITY ONITK CSWIG PYTHON OFF
ITK USE REVIEW ONUSE WRAP ITK ON
WRAP ITK PYTHON ON
Note: Some CMake variables are only available based on the state of others. If a variable ismissing from the list, set what is visible and re-configure, this will often allow you to see andset additional parameters.
After generating the appropriate files and exiting ccmake, the standard build process canbe completed. In Linux variants and Mac:
makesudo make install
On Windows, the build process is governed by the type of project or Makefile CMakegenerated.
Note: It is possible to use ITK without installing it. To do this, the environment variablesLD LIBRARY PATH and PYTHONPATH must be set to the appropriate build directories:
LD LIBRARY PATH=/Path To itk/binPYTHONPATH=/Path To itk/Wrapping/WrapITK/Python
At this point, ITK is build and installed. To validate this, open a Python shell and issuethe following commands:
>>> import itk>>> itk.Image[itk.US,2]
The above commands should both complete without error. The WrapITK implementationused to wrap ITK for use in Python lazily instantiates required classes. This means that even ifthe import succeeds, the instantiation of the above itk.Image class may fail. This is particularlycommon if the envornment LD LIBRARY PATH is incorrectly set.
14.3 ITK and VisTrails
When built and installed with the appropriate Python bindings included, ITK can be used fromVisTrails through the ITK package. ITK is a third-party package and is not included in thegeneral VisTrails distribution. However, like many third-party packages, it is accessible fromthe VisTrails homepage:

14.3. ITK AND VISTRAILS 61
(a) (b) (c)
Figure 14.1: (a) The VisTrails ITK Package Structure Overview (b) The ITK Package Sup-ported PixelTypes (c) The ITK Package Filter Structure
http://www.vistrails.org
Please Note: The VisTrails ITK package is not a complete wrapping of all ITK functionalityat the time of this writing. If you would like to contact the author regarding the wrappedfunctionality, please do so through the e-mail address on the VisTrails homepage.
The VisTrails ITK package is under continual development with the latest versions beingannounced on the vistrails homepage. After downloading the package and extracting it inaccordance with the posted instructions, the following line should be added to the startup.pyfile:
addPackage(’itk’)
Upon starting VisTrails, the ITK package modules will be made available to the BuilderWindow.
14.3.1 ITK Package Organization
The ITK VisTrails package loosely mimics the ITK functionality hierarchy. The package’s toplevel consists of base classes, containers, and file readers as shown in Figure 14.1. Also availableat the top level is the PixelType module and the specific types used to create and executeITK-based pipelines.
Currently, the ITK Image Filters are organized into functional groups. The five filter types,as show in Figure 14.1, are:
• Feature Extraction Filters
• Image Intensity Filters
• Segmentation Filters
• Image Selection Filters

62 CHAPTER 14. EXAMPLE: ITK
• Image Smoothing Filters
All filter types currently have at least one representative ITK filter wrapped and usablefrom within the VisTrails environment.
14.3.2 Reading DICOM Volumes
ITK includes DICOM support through the GDCM libraries 4. It is worthwhile to note at thistime that these libraries are currently not a complete implementation of the DICOM standard.
DICOM volumes can be integrated into VisTrails through the use of either the GDCM-Reader or DICOMReader modules in the ITK package. For the rest of this example, we willuse the GDCMReader module as it’s performace is slightly higher than the DICOMReaderimplementation.
Figure 14.2 shows the use of the GDCMReader module. In order to properly read a DICOMvolume, the GDCMReader must be supplied with the dimension of the volume to be readand the directory containing the series to read. By default, WrapITK supports two- andthree-dimensional volumes. In order to include support for higher dimensions, the appropriateWrapITK variable must be set using cmake.
14.3.3 Volume Processing With ITK and VisTrails
Typically, DICOM volumes are written with no 16-bit unsigned shorts. Unfortunately, mostsystems allow the display of only 8-bit values. Because of the higher precision inherent inDICOM data, it is often preferable to perform any computation, segmentation, or processingon the data prior to rescaling in order to utilize as much information as possible.
14.3.4 Volume Processing With ITK and VisTrails
Those familiar with the ITK libraries know that ITK image filters are typically templated basedon the dimensionality of the data being processed as well as the data type being processed. InVisTrails, these parameters are handled through the use of PixelType Modules. Although anyITK Filter wrapped in VisTrails can accept any of these PixelTypes, the underlying imple-mentation may not be compatible with the input PixelType. Using PixelTypes incompatiblewith the underlying filter implementations is the most frequent cause of error when executingotherwise functional pipelines in VisTrails.
When processing volumes, it is often necessary to extract a single slice from the volumeat different stages of the processing pipeline. This is possible in VisTrails through the useof the ExtractImageFilter. Given a volume, a Region, and Dimensionality information, theExtractImageFilter can extract a single slice from the data volume that can be used in further
4Grass roots DiCoM Project. http://www.creatis.insa-lyon.fr/Public/Gdcm/

14.3. ITK AND VISTRAILS 63
Figure 14.2: VisTrails workflow utilizing ITK to extract a single slice from a DICOM volume.The slice is chosen by first forming a Region to extract. The result is viewed through the useof standard VisTrails Spreadsheet modules.
processing, previewing the results, or writing to disk. An example workflow that extract a slicefrom a DICOM volume can be seen in Figure 14.2.
14.3.5 Visualizing the results
Although ITK’s processing filters and the DICOM standard both support 16-bit processingand storage, many image viewers are capable of displaying in only 8-bit resolution using theUnsignedChar PixelType. Since the output of an ITK processing workflow is an image, itmakes sense to view it as such. This means that we are required to both remap the data valuesin the image to 8-bits as well as perform a casting operation to change the data type fromunsigned shorts to unsigned chars. These operations are performed through the use of theRescaleIntensityImageFilter and the CastImageFilter. Figure 14.2 demonstrates the use of theRescaleIntensityImageFilter and the CastImageFilter in conjunction with the ImageToFile andImageViewerCell Modules to view the resulting slice in the VisTrails Spreadsheet.

Chapter 15
Frequently Asked Questions
15.1 Running workflows
How can I run a workflow using the command line? Call vistrails using the followingoptions:
python vistrails.py -l -b path_to_vistrails_file -w pipeline
Using the command line, we’d like to execute a workflow multiple times, withslightly different parameters, and create a series of output files. Is this possible?Starting in rev 444, we can change parameters that have an alias through the command line.
For example, offscreen pipeline in offscreen.xml always creates the file called image.png. Ifyou want generate it with a different filename:
python vistrails.py -l -b ../examples/offscreen.xml \
-w offscreen -a"filename=other.png"
filename in the example above is the alias name assigned to the parameter in the valuemethod inside the String module. When running a pipeline from the command line, VisTrailswill try to start the spreadsheet automatically if the pipeline requires it. For example, thisother execution will also start the spreadsheet:
python vistrails.py -l -b ../examples/head.xml -w aliases \
-a"isovalue=30,Diffuse_Color_R=0.8,Diffuse_Color_G=0.4,Diffuse_Color_B=0.2"
I can load a vistrail, and the version tree shows up fine. However, no pipelinesappear when I click on a version. What gives? THIS ANSWER IS OUT OFDATE. PLEASE REFER TO CHAPTER 11. The most likely reason is that the vistrailuses a package that is not registered with VisTrails. You need to identify the needed packageand add it to your .vistrails/startup.py. A single line like the following should be enough:
64

15.2. BUILDING WORKFLOWS 65
addPackage(’enter_package_name_here’)
Some packages might need more information. For example:
addPackage(’afront’,executable_path=’/path/to/afront’)
Refer to the package documentation for details. The one inconvenient step is that currentlythere’s no automated way to describe what is the missing package. We’re working on thisfeature for future releases.
15.2 Building workflows
Is there a way to give each widget a ”display name” in addition to the modulename at the center of the widget? Yes, but it is not easily accessible from the GUI andit definitely needs to be more intuitive. For now, we use the annotation value of key ” desc ”as a module label. If you want to set a PythonSource label, you have to select the module.Then click on the Annotation tab, and add a key named ” desc ”, whatever value you set tothis key will be the label. We are currently working on a new interface for this functionality.
15.3 Spreadsheet
Below, “pipeline” is a version number or a tag.
How can I save an image from the spreadsheet? While having the focus on a spreadsheetcell press ”Ctrl” (on Windows) and select the camera to take a snapshot. The system willprompt you for the location and file name where it should be saved. The other icons can beused for saving multiple images that can be used for generating an animation on demand.
Is it possible to save the complete state of the spreadsheet? Yes, the spreadsheet hasa “Save As” functionality.
Can I view multiple sheets at the same time? Yes. Each sheet on the spreadsheet canbe displayed as a dock widget separated from the main spreadsheet window by dragging its tabname out of the tab bar at the bottom of the spreadsheet.
Then, how can I put back a separated sheet? A sheet can be docked back to the mainwindow by dragging it back to the tab bar or double-click on its title bar.
How can I order sheets on the spreadsheet? This can be done by dragging the sheetname on the bottom top bar and drop it to the right place.

66 CHAPTER 15. FREQUENTLY ASKED QUESTIONS
Can I control where a cell will be placed on the spreadsheet window? By default,an unoccupied cell on the active sheet will be chosen to display the result. However, you canspecify exactly in the pipeline where a spreadsheet cell will be placed by using CellLocationand SheetReference. CellLocation specifies the location (row and column) of a cell when con-necting to a spreadsheet cell (VTKCell, ImageViewerCell, ...). Similarly, a SheetReferencemodule (when connecting to a CellLocation) will specify which sheet the cell will be put ongiven its name, minimum row size and minimum column size. There is an example of this inexamples/vtk.xml (select the version below Double Renderer).
15.4 Integrating your software into VisTrails
How can I integrate my own program into VisTrails? The easiest way is to create apackage. Writing a package is often very simple, see Chapter 11 for detailed instructions.
How do modules deal with multiple inputs in a same port? For compatibility reasons,we do need to allow multiple connections to an input port. However, most package developersshould never have to use this, and so we do our best to hide it. The default behavior for gettinginputs from a port, then, is to always return a single input. If on your module you need multipleinputs connected to a single port, use the ’forceGetInputListFromPort’ method. It will returna list of all the data items coming through the port. The VTK package uses this feature, solook there for usage examples (packages/vtk/base widget.py)
Are there mechanisms for attaching widgets to different modules/parameters?Right now, we have a mechanism for putting a specific widget for an input port. For ex-ample, if a port is SetColor(red, green, blue), we can put a color wheel widget there. Or wecan also replace the SetFileName port with a File Widget. However, this is not per parameter(only per port). We are currently working on this problem.
15.5 VTK
Given a VTK visualization, how can I generate a webpage from it? Check out thehtml pipeline in offscreen.xml.
I’m trying to use VTK, but there doesn’t seem to be any output. What is wrong?To use VTK on VisTrails, you need a slightly different way of connecting the renderer mod-ules. Instead of using the standard RenderWindow/RenderWindowInteractor infrastructure,you simply connect the renderer to a VTKCell. The examples directory in the distribution hasseveral VTK examples that illustrate.

Bibliography
[1] T. S. Yoo, M. J. Ackerman, W. E. Lorensen, W. Schroeder, V. Chalana, S. Aylward,D. Metaxes, and R. Whitaker, “Engineering and algorithm design for an image processingAPI: A technical report on ITK - The Insight Toolkit,” Proceedings of Medicine MeetsVirtual Reality, pp. 586–592, 2002.
[2] R. A. Banvard, “The visible human project image data set from inception to completionand beyond,” Proceedings of CODATA, 2002.
[3] L. Ibanez, W. Schroeder, L. Ng, and J. Cates, The ITK Software Guide, 2nd ed., Kitware,Inc. ISBN 1-930934-15-7, http://www.itk.org/ItkSoftwareGuide.pdf, 2005.
67

Index
ConfigurationObject, 46
animation, 25, 30
builder, 7–11
closevistrail, 5
connectionsadding, 8definition, 5selecting, 7
database, 34–37issues, 37opening from, 35saving to, 36setup, 34
diff, see versions, comparing
execute, 6
history, 12
installation, 3
legend, 14
methods, 9Module registry
addInputPort, 39, 43addModule, 39, 43addOutputPort, 39, 43
modules, 7ModuleError, 39, 43adding, 7, 53
basic, 10connecting, 8definition, 5deleting, 8parameters, 9ports, 10, 49selecting, 7writing new, 39
notes, 14
openfrom a database, 5vistrail, 5
packages, 39filePool, 47initialize, 39, 43configuration, 45, 52dependencies, 48temporary files, 47wrapping command-line tools, 44
pan, 6parameter exploration, 25–30
adding parameters, 26directions, 25running, 27setting values, 26spreadsheet, see spreadsheet, parameter ex-
plorationparameters
changing, 9, 55differences, 14exploring, see parameter exploration
68

INDEX 69
ports, 8adding, 10deleting, 10
PythonSource, 10, 54, 55
queries, 21–24by example, 21textual, 22viewing results, 24
redo, 6, 14refine, 24
savevistrail, 5
search, 24select, 6spreadsheet, 16–20
cells, 16, 17columns, 16layout, 16modes, 17
editing, 18interactive, 17
parameter exploration, 25, 28RichTextCell, 57rows, 16saving, 19sheets
adding, 16deleting, 16
virtual cell, 28
tab, 5tags, 12
adding, 13deleting, 13
toolbar, 4
undo, 6, 14
versions, 12–15annotations, 14
comparing, 14navigating, 14viewing, 12
vistraildefinition, 5
visual diff, see versions, comparing
web services, 52workflow, 5
zoom, 6