Embed Size (px)
Citation preview

iBaan Decision Manager Business Templates
User's Guide for BAAN IVcInventory 2.0

A publication of:
Baan Development B.V.P.O.Box 1433770 AC BarneveldThe Netherlands
Printed in the Netherlands
© Baan Development B.V. 2001.All rights reserved.
The information in this documentis subject to change withoutnotice. No part of this documentmay be reproduced, stored ortransmitted in any form or by anymeans, electronic or mechanical,for any purpose, without theexpress written permission ofBaan Development B.V.
Baan Development B.V.assumes no liability for anydamages incurred, directly orindirectly, from any errors,omissions or discrepanciesbetween the software and theinformation contained in thisdocument.
Document Information
Code: U7598A USGroup: User DocumentationEdition: ADate: April, 2001
i
User's Guide for BAAN IVc Inventory 2.0
1 Overview of iBaan Decision Manager 1-1Definitions, acronyms, and abbreviations 1-4
2 BAAN IVc Inventory 2.0 Business Template 2-1Introduction 2-1Inventory data warehouse content 2-2Universe 2-2Inventory OLAP Cubes 2-4Inventory transaction analysis cube 2-4Inventory on Hand Analysis cube 2-6
3 Examples 3-1Inventory transaction analysis 3-1Inventory On-Hand Analysis 3-4
Table of contents
Table of contents
User's Guide for BAAN IVc Inventory 2.0ii
User's Guide for BAAN IVc Inventory 2.0iii
iBaan Decision Manager is a decision-support solution that you can use to extractand analyze key data from your business management system and obtain theinformation that you need to support your decisions and to take measures in timeto avoid bottlenecks in your business processes. For example, you can useDecision Manager for various types of sales performance analyses, productionperformance analyses, and inventory data analyses.
For each area that you want to analyze, the Business Content defines what data isextracted from the source system and how Decision Manager presents the data toyou for further analyses. If you install Decision Manager, the Business Content ispredefined for a number of areas.
This manual describes the BAAN IVc Inventory business template version 2.0.The business template is developed for Decision Manager 2.1. This manualdescribes what data you can use for performance analyses of the various aspectsof Inventory, and provides some examples of business management questionsthat can be answered by a specific type of analysis.
Chapter 1, �Overview of iBaan Decision Manager,� briefly describes theDecision Manager concepts and components and explains the function of theBusiness Contents in the Decision Manager solution.
Chapter 2, �Business Content for Inventory,� provides a functional description ofthe data that is available for the analysis of your Inventory performance.
Chapter 3, �Examples,� describes some example analyses that you can carry outbased on the Business Content for Inventory.
For a more technical description of the Business Content for Inventory, refer tothe online metadata.
About this document
About this document
User's Guide for BAAN IVc Inventory 2.0iv

User's Guide for BAAN IVc Inventory 2.01-1
iBaan Decision Manager is a decision-support solution that you can use to:
� Extract key data from your business management system.� Store the data into a data warehouse and OLAP databases.� Analyze the data.� Present the analysis in the form of reports and graphs.
For each area that you want to analyze, for example, sales, or production, theBusiness Content defines what data is extracted from the source system, how thedata is stored in the data warehouse, and how the information is made availablefor the analysis.
The Business Content consists of:
� Extraction, Transformation, and Loading (ETL) scripts.� OLAP cubes.� Universes.
This chapter briefly explains the various Decision Manager concepts andcomponents related to the business content.
ETL ScriptsThe ETL scripts extract the data from the source systems, transform the data intouseful information for decision-making, and load the information in a datawarehouse. After loading, the data warehouse contains the required fact anddimension data for analysis.
FactsFacts reflect the events in your business that you want to analyze. The factsconsist of the dynamic data that Decision Manager extracts from your BAANdatabase, such as order quantities, delivery dates, invoiced amounts, andcompleted orders.
DimensionsDimensions represent a point of view from which you can analyze the data. Thedimensions consist of comparatively static data, or master data, such ascustomers, suppliers, warehouses, and time, that is related to the facts. Forexample Warehouse dimension to analyze which warehouses issue most, ornone, of the goods.
1 Overview of iBaan Decision Manager
Overview of iBaan Decision Manager
User's Guide for BAAN IVc Inventory 2.01-2
Data warehouseThe fact data and dimension data is stored in fact tables and dimension tables in adata warehouse. The ETL scripts update the data in the warehouse with the datafrom the live database.
Before you can use either the Baan OLAP Client or Business Objects Reportingto analyze the data, you must process the data warehouse data must to preparethe data for analysis. You can process this data in two ways:
� Build and process OLAP cubes.� Design Universes.
OLAP cubesThe OLAP cubes contain a combination of fact data and dimension data, as wellas the results of computations such as totals, average numbers, and percentages.To access the OLAP cubes, you can use the OLAP client, as well as the BusinessObject reporting tool.
iBaan OLAP NavigatorYou can use the iBaan OLAP Navigator to view the data in the OLAP cubesfrom various angles. You can apply formulas, filters, graphs, and so on to thedata in OLAP cubes to obtain information about trends, causes of events,exceptions, and other interesting facts. For instructions on how to use the OLAPNavigator, refer to the OLAP Client User Guide.
UniversesA Universe is an extra layer through which you can access the data in the datawarehouse using the Business Objects Reporting environment. The Universeconsists of objects that are mapped on the data in the data warehouse. You canbuild queries on the data warehouse through the Universe and present the resultsin reports compiled by Business Objects Reporting.

Overview of iBaan Decision Manager
User's Guide for BAAN IVc Inventory 2.01-3
Business Objects ReportingYou can use Business Objects Reporting to access and print reports of theinformation in a data warehouse and in the OLAP cubes. The available BusinessObjects Reporting user manuals describe how you can define queries to analyzethe data and to build reports.
The following figure (see Figure 1-1) shows how the various Decision Managercomponents are related to each other.
Data-warehouse
BAAN IVInventory
OLAPcube Universe
OLAPNavigator
Business ObjectsReporting
Figure 1-1 High-level Decision Manager architecture overview.
Overview of iBaan Decision Manager
User's Guide for BAAN IVc Inventory 2.01-4
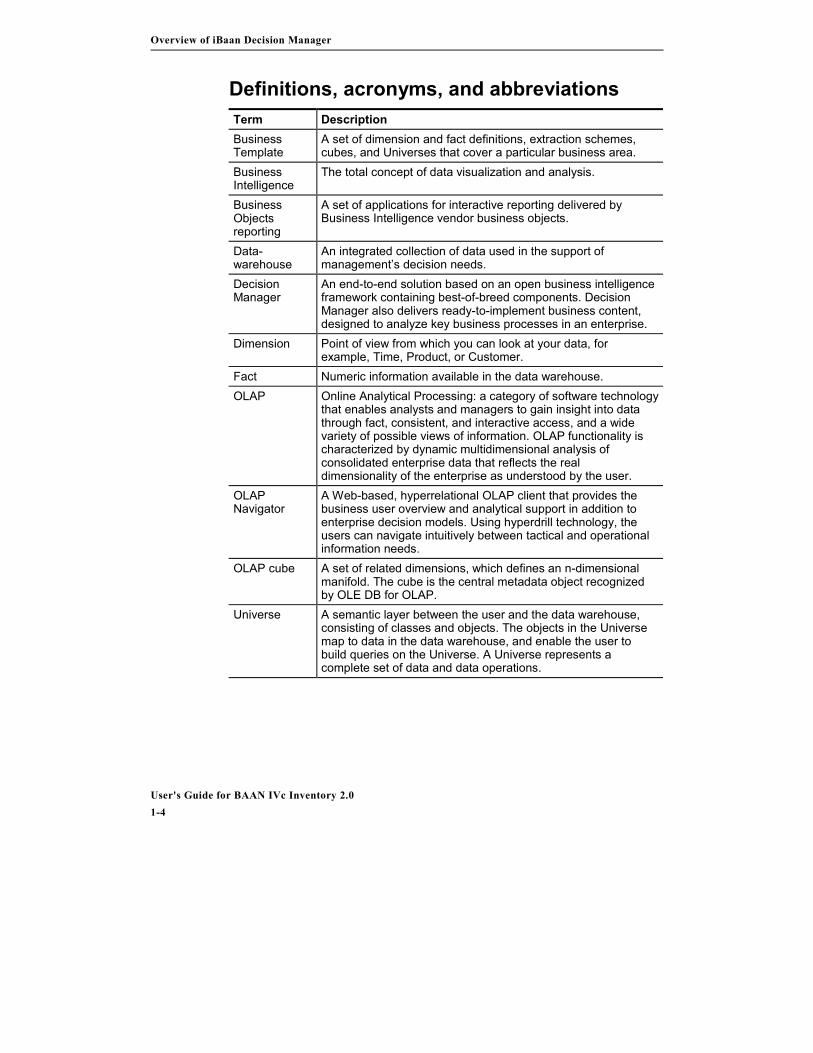
Definitions, acronyms, and abbreviationsTerm DescriptionBusinessTemplate
A set of dimension and fact definitions, extraction schemes,cubes, and Universes that cover a particular business area.
BusinessIntelligence
The total concept of data visualization and analysis.
BusinessObjectsreporting
A set of applications for interactive reporting delivered byBusiness Intelligence vendor business objects.
Data-warehouse
An integrated collection of data used in the support ofmanagement�s decision needs.
DecisionManager
An end-to-end solution based on an open business intelligenceframework containing best-of-breed components. DecisionManager also delivers ready-to-implement business content,designed to analyze key business processes in an enterprise.
Dimension Point of view from which you can look at your data, forexample, Time, Product, or Customer.
Fact Numeric information available in the data warehouse.OLAP Online Analytical Processing: a category of software technology
that enables analysts and managers to gain insight into datathrough fact, consistent, and interactive access, and a widevariety of possible views of information. OLAP functionality ischaracterized by dynamic multidimensional analysis ofconsolidated enterprise data that reflects the realdimensionality of the enterprise as understood by the user.
OLAPNavigator
A Web-based, hyperrelational OLAP client that provides thebusiness user overview and analytical support in addition toenterprise decision models. Using hyperdrill technology, theusers can navigate intuitively between tactical and operationalinformation needs.
OLAP cube A set of related dimensions, which defines an n-dimensionalmanifold. The cube is the central metadata object recognizedby OLE DB for OLAP.
Universe A semantic layer between the user and the data warehouse,consisting of classes and objects. The objects in the Universemap to data in the data warehouse, and enable the user tobuild queries on the Universe. A Universe represents acomplete set of data and data operations.
User's Guide for BAAN IVc Inventory 2.02-1
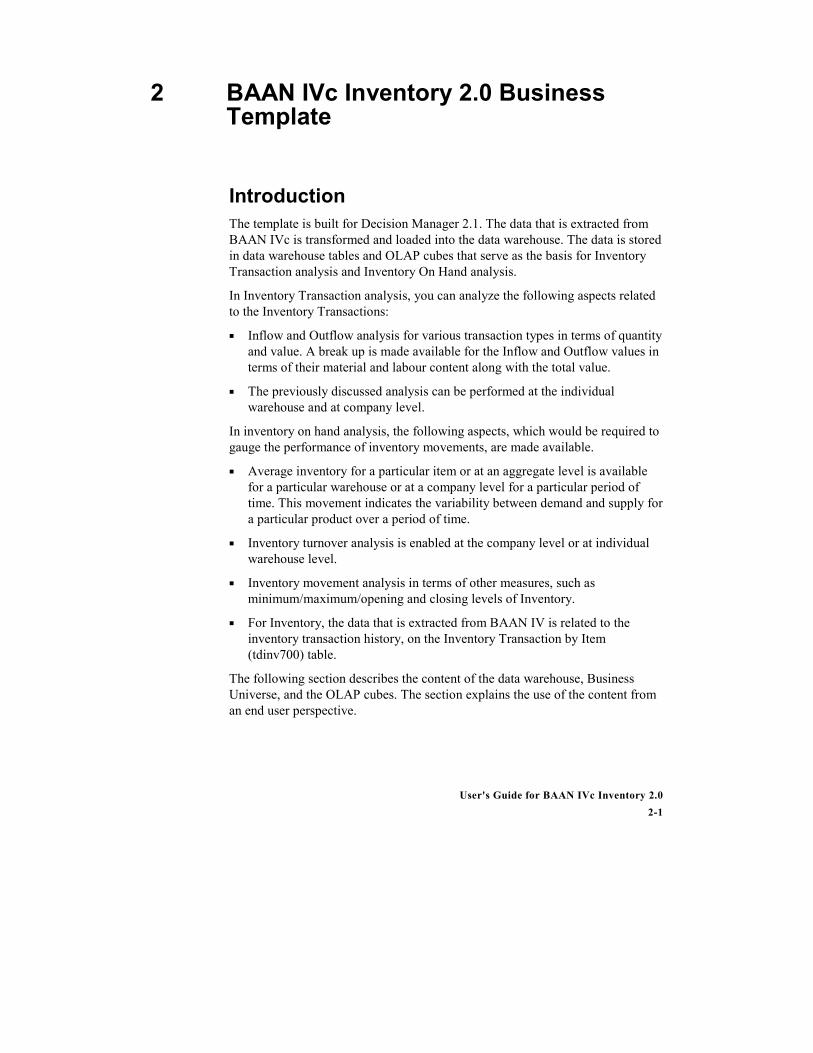
IntroductionThe template is built for Decision Manager 2.1. The data that is extracted fromBAAN IVc is transformed and loaded into the data warehouse. The data is storedin data warehouse tables and OLAP cubes that serve as the basis for InventoryTransaction analysis and Inventory On Hand analysis.
In Inventory Transaction analysis, you can analyze the following aspects relatedto the Inventory Transactions:
� Inflow and Outflow analysis for various transaction types in terms of quantityand value. A break up is made available for the Inflow and Outflow values interms of their material and labour content along with the total value.
� The previously discussed analysis can be performed at the individualwarehouse and at company level.
In inventory on hand analysis, the following aspects, which would be required togauge the performance of inventory movements, are made available.
� Average inventory for a particular item or at an aggregate level is availablefor a particular warehouse or at a company level for a particular period oftime. This movement indicates the variability between demand and supply fora particular product over a period of time.
� Inventory turnover analysis is enabled at the company level or at individualwarehouse level.
� Inventory movement analysis in terms of other measures, such asminimum/maximum/opening and closing levels of Inventory.
� For Inventory, the data that is extracted from BAAN IV is related to theinventory transaction history, on the Inventory Transaction by Item(tdinv700) table.
The following section describes the content of the data warehouse, BusinessUniverse, and the OLAP cubes. The section explains the use of the content froman end user perspective.
2 BAAN IVc Inventory 2.0 BusinessTemplate
BAAN IVc Inventory 2.0 Business Template
User's Guide for BAAN IVc Inventory 2.02-2
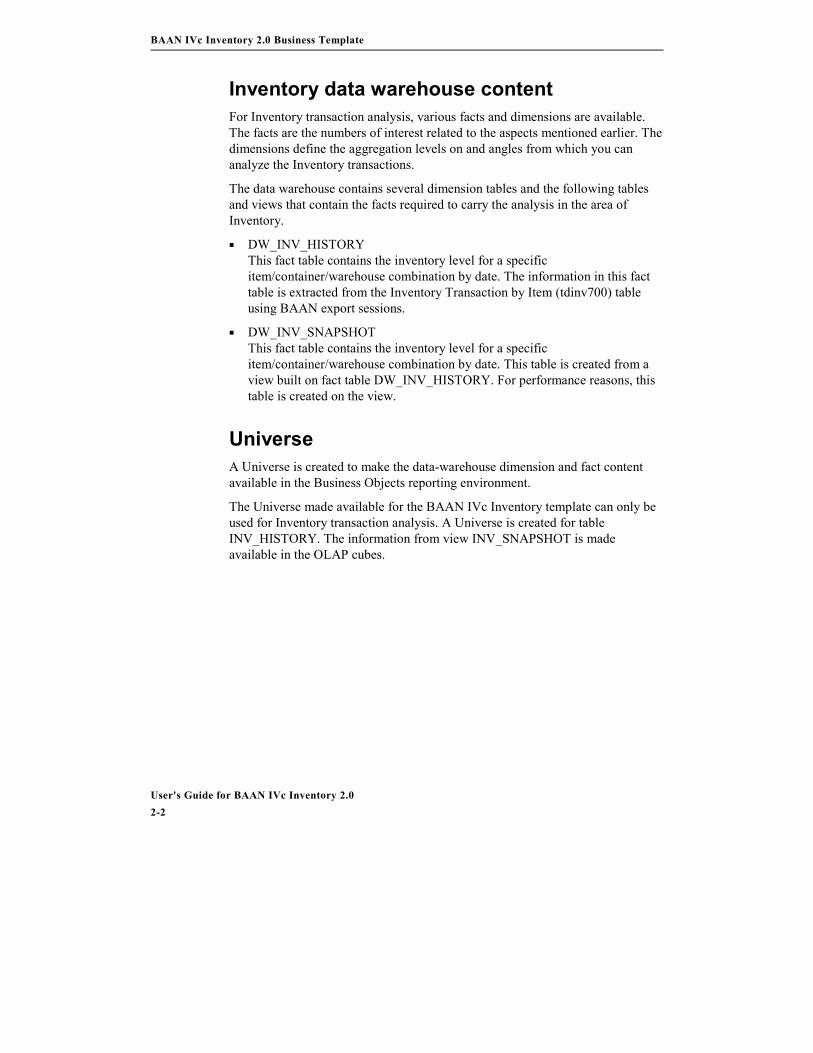
Inventory data warehouse contentFor Inventory transaction analysis, various facts and dimensions are available.The facts are the numbers of interest related to the aspects mentioned earlier. Thedimensions define the aggregation levels on and angles from which you cananalyze the Inventory transactions.
The data warehouse contains several dimension tables and the following tablesand views that contain the facts required to carry the analysis in the area ofInventory.
� DW_INV_HISTORYThis fact table contains the inventory level for a specificitem/container/warehouse combination by date. The information in this facttable is extracted from the Inventory Transaction by Item (tdinv700) tableusing BAAN export sessions.
� DW_INV_SNAPSHOTThis fact table contains the inventory level for a specificitem/container/warehouse combination by date. This table is created from aview built on fact table DW_INV_HISTORY. For performance reasons, thistable is created on the view.
UniverseA Universe is created to make the data-warehouse dimension and fact contentavailable in the Business Objects reporting environment.
The Universe made available for the BAAN IVc Inventory template can only beused for Inventory transaction analysis. A Universe is created for tableINV_HISTORY. The information from view INV_SNAPSHOT is madeavailable in the OLAP cubes.

BAAN IVc Inventory 2.0 Business Template
User's Guide for BAAN IVc Inventory 2.02-3
The following table describes the measures that are available in the Universe forreporting:
Measure DescriptionQuantity_In Quantity received in a warehouse or company as a
result of a particular transaction type. The quantityis expressed in inventory unit.If a container is selected as one of the dimensionand if the user desires to have the information interms of container unit, then a customizedBusiness Object report must be prepared using thecontainer conversion factor measure provided inthe Universe.
Material_Value_In Material value component associated withQuantity_In explained previously.
Operation_Value_In Operation value component associated withQuantity_In explained earlier.
Total_Value_In Total value of Quantity_In based on the standardcost price of an item.
Quantity_Out Quantity dispatched from a warehouse or acompany as a result of a particular transactiontype. This quantity is expressed in inventory unit.If you select container as one of the dimensionsand if the user wants to have the information interms of container unit, then a customizedBusiness Object report must be prepared using theContainer conversion factor measure provided inthe Universe.
Material_Value_Out Material value component associated withQuantity_Out explained previously.
Operation_Value_Out Operation value component associated withQuantity_Out explained earlier.
Total_Value_Out Total value of Quantity_Out based on the standardcost price of an Item.
Container conversionfactor
Conversion factor to convert quantity in Inventoryunit to container unit.For example, one can = 10 lit.Conversion factor will be reflected as 10 in theInventory transaction table.
BAAN IVc Inventory 2.0 Business Template
User's Guide for BAAN IVc Inventory 2.02-4
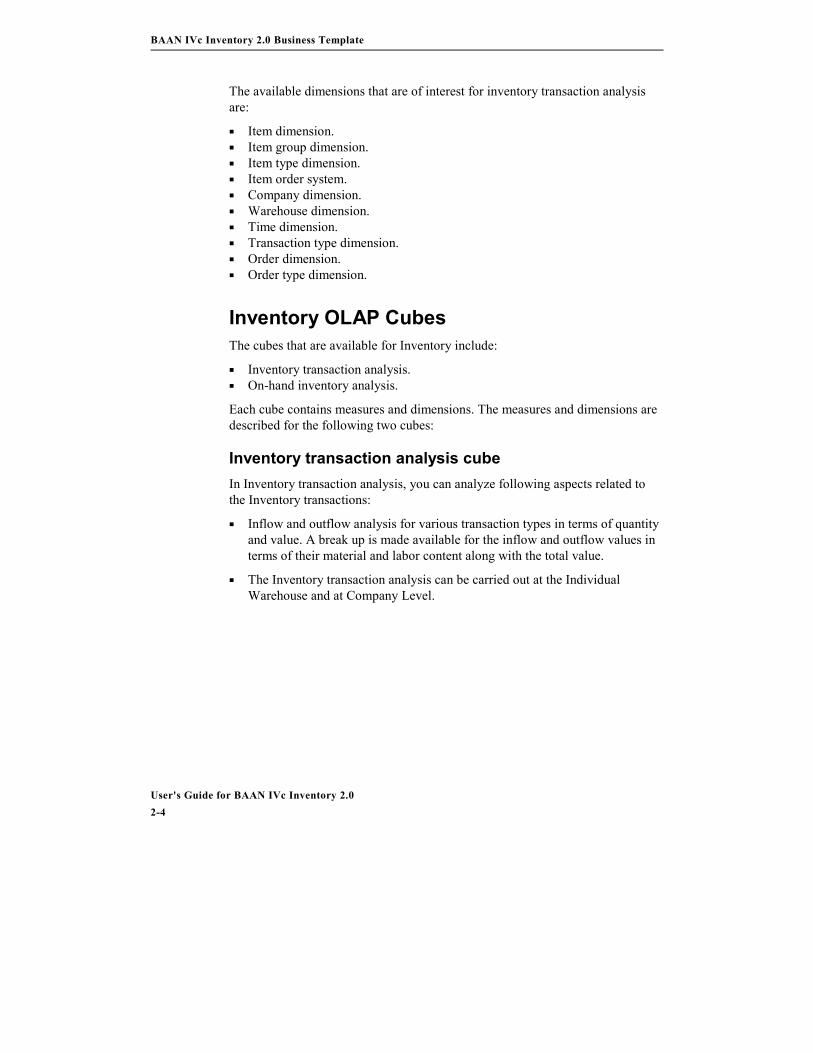
The available dimensions that are of interest for inventory transaction analysisare:
� Item dimension.� Item group dimension.� Item type dimension.� Item order system.� Company dimension.� Warehouse dimension.� Time dimension.� Transaction type dimension.� Order dimension.� Order type dimension.
Inventory OLAP CubesThe cubes that are available for Inventory include:
� Inventory transaction analysis.� On-hand inventory analysis.
Each cube contains measures and dimensions. The measures and dimensions aredescribed for the following two cubes:
Inventory transaction analysis cubeIn Inventory transaction analysis, you can analyze following aspects related tothe Inventory transactions:
� Inflow and outflow analysis for various transaction types in terms of quantityand value. A break up is made available for the inflow and outflow values interms of their material and labor content along with the total value.
� The Inventory transaction analysis can be carried out at the IndividualWarehouse and at Company Level.
BAAN IVc Inventory 2.0 Business Template
User's Guide for BAAN IVc Inventory 2.02-5
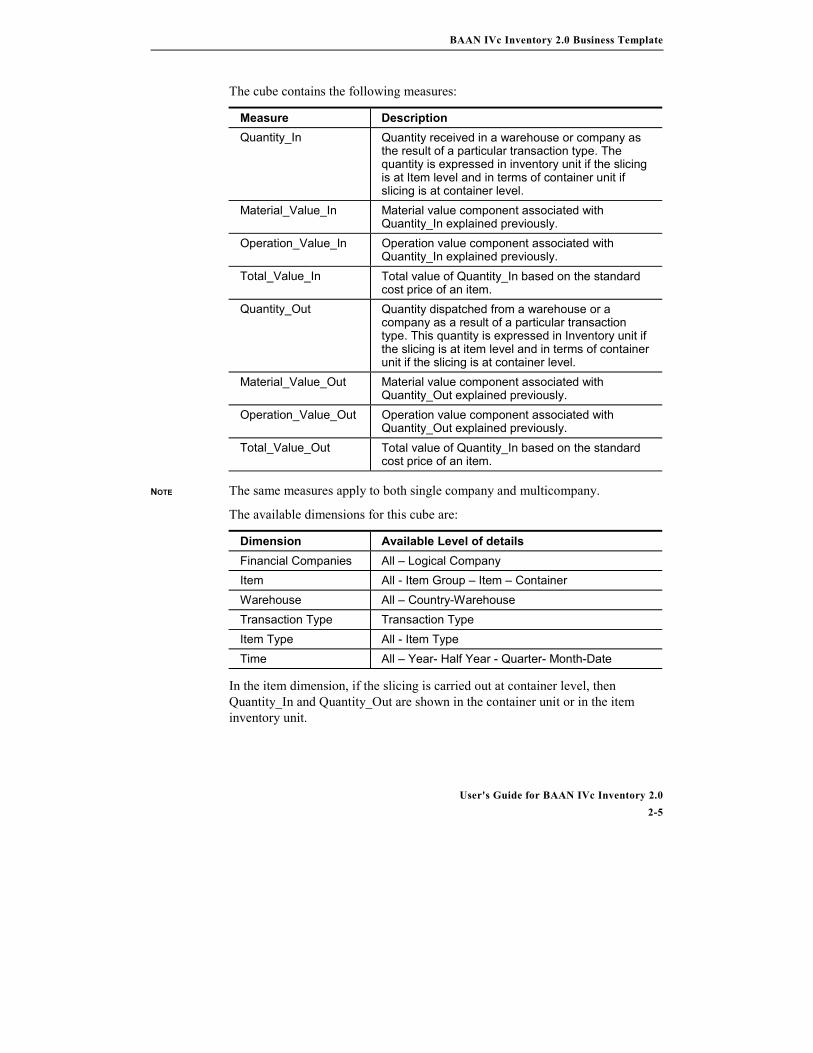
The cube contains the following measures:
Measure DescriptionQuantity_In Quantity received in a warehouse or company as
the result of a particular transaction type. Thequantity is expressed in inventory unit if the slicingis at Item level and in terms of container unit ifslicing is at container level.
Material_Value_In Material value component associated withQuantity_In explained previously.
Operation_Value_In Operation value component associated withQuantity_In explained previously.
Total_Value_In Total value of Quantity_In based on the standardcost price of an item.
Quantity_Out Quantity dispatched from a warehouse or acompany as a result of a particular transactiontype. This quantity is expressed in Inventory unit ifthe slicing is at item level and in terms of containerunit if the slicing is at container level.
Material_Value_Out Material value component associated withQuantity_Out explained previously.
Operation_Value_Out Operation value component associated withQuantity_Out explained previously.
Total_Value_Out Total value of Quantity_In based on the standardcost price of an item.
The same measures apply to both single company and multicompany.
The available dimensions for this cube are:
Dimension Available Level of detailsFinancial Companies All � Logical CompanyItem All - Item Group � Item � ContainerWarehouse All � Country-WarehouseTransaction Type Transaction TypeItem Type All - Item TypeTime All � Year- Half Year - Quarter- Month-Date
In the item dimension, if the slicing is carried out at container level, thenQuantity_In and Quantity_Out are shown in the container unit or in the iteminventory unit.
NOTE
BAAN IVc Inventory 2.0 Business Template
User's Guide for BAAN IVc Inventory 2.02-6
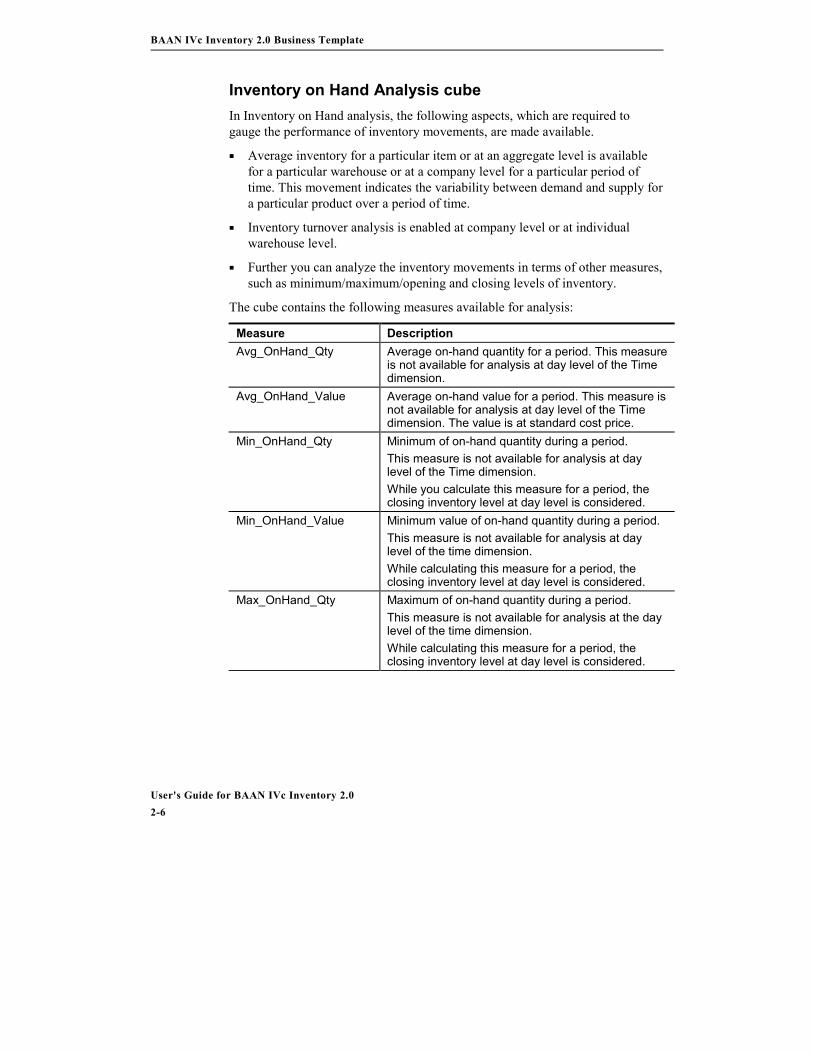
Inventory on Hand Analysis cubeIn Inventory on Hand analysis, the following aspects, which are required togauge the performance of inventory movements, are made available.
� Average inventory for a particular item or at an aggregate level is availablefor a particular warehouse or at a company level for a particular period oftime. This movement indicates the variability between demand and supply fora particular product over a period of time.
� Inventory turnover analysis is enabled at company level or at individualwarehouse level.
� Further you can analyze the inventory movements in terms of other measures,such as minimum/maximum/opening and closing levels of inventory.
The cube contains the following measures available for analysis:
Measure DescriptionAvg_OnHand_Qty Average on-hand quantity for a period. This measure
is not available for analysis at day level of the Timedimension.
Avg_OnHand_Value Average on-hand value for a period. This measure isnot available for analysis at day level of the Timedimension. The value is at standard cost price.
Min_OnHand_Qty Minimum of on-hand quantity during a period.This measure is not available for analysis at daylevel of the Time dimension.While you calculate this measure for a period, theclosing inventory level at day level is considered.
Min_OnHand_Value Minimum value of on-hand quantity during a period.This measure is not available for analysis at daylevel of the time dimension.While calculating this measure for a period, theclosing inventory level at day level is considered.
Max_OnHand_Qty Maximum of on-hand quantity during a period.This measure is not available for analysis at the daylevel of the time dimension.While calculating this measure for a period, theclosing inventory level at day level is considered.

BAAN IVc Inventory 2.0 Business Template
User's Guide for BAAN IVc Inventory 2.02-7
Max_OnHand_Value Maximum value of on-hand quantity during a period.This measure is not available for analysis at daylevel of the time dimension.While calculating this measure for a period, theclosing inventory level at day level is considered.
Opening_Balance_Qty The on-hand quantity of last day of previous periodOpen_Balance_Value The on-hand value of the last day of the previous
periodClosing_Balance_Qty The on-hand quantity of the last day of the current
periodClosing_Balance_Value The on-hand value of the last day of the current
periodInventory_Turnover This value is defined as the rate at which the
inventory moves through the warehouse or from thecompany.This value is defined as the ratio of annualized valueof consumption of Inventory by the average value ofinventory during a period.This value is calculated as:(Total_Value_Out *Periods_For_Year)/(Avg_OnHand_Value for thatPeriod)The values are based on the standard cost price.To compute the annual consumption, the numeratorof the ratio is a product of total value and periods foryear, for example, if the total value out is for a monththan Periods for year corresponds to 12.Total value out is the summation of values of alltransactions that cause an effect of outflow ofmaterial at a warehouse level, as defined bytransaction type.When the Inventory turnover ratio is calculated for aparticular warehouse, then Total Value Out is usedto compute the Inventory turnover ratio.OR(Total Value Out Co* Periods for year)/(Avg_OnHand_Value for that Period)Total value out co is the total value out at companylevel. This value basically excludes all those outflowtransactions, which are a result of materialmovement between warehouses.If the Inventory turnover ratio is calculated for acompany, then Total Value Out Co. is used forcomputing the Inventory turnover ratio.
BAAN IVc Inventory 2.0 Business Template
User's Guide for BAAN IVc Inventory 2.02-8
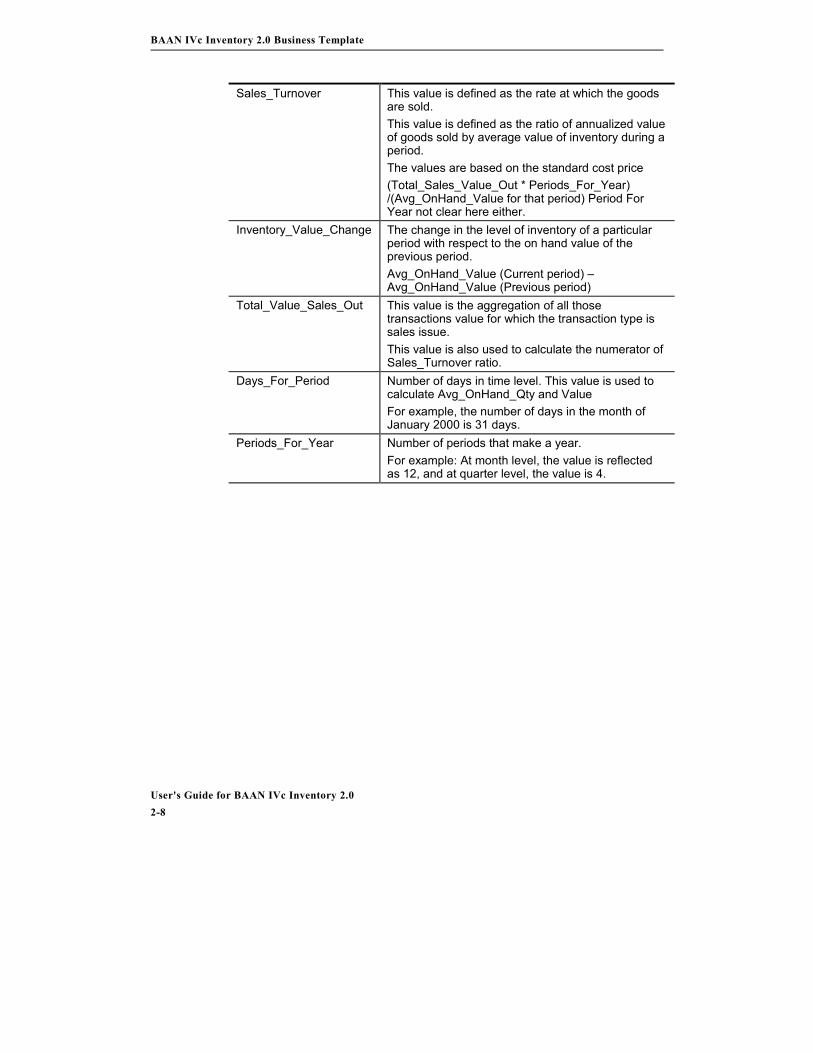
Sales_Turnover This value is defined as the rate at which the goodsare sold.This value is defined as the ratio of annualized valueof goods sold by average value of inventory during aperiod.The values are based on the standard cost price(Total_Sales_Value_Out * Periods_For_Year)/(Avg_OnHand_Value for that period) Period ForYear not clear here either.
Inventory_Value_Change The change in the level of inventory of a particularperiod with respect to the on hand value of theprevious period.Avg_OnHand_Value (Current period) �Avg_OnHand_Value (Previous period)
Total_Value_Sales_Out This value is the aggregation of all thosetransactions value for which the transaction type issales issue.This value is also used to calculate the numerator ofSales_Turnover ratio.
Days_For_Period Number of days in time level. This value is used tocalculate Avg_OnHand_Qty and ValueFor example, the number of days in the month ofJanuary 2000 is 31 days.
Periods_For_Year Number of periods that make a year.For example: At month level, the value is reflectedas 12, and at quarter level, the value is 4.
BAAN IVc Inventory 2.0 Business Template
User's Guide for BAAN IVc Inventory 2.02-9
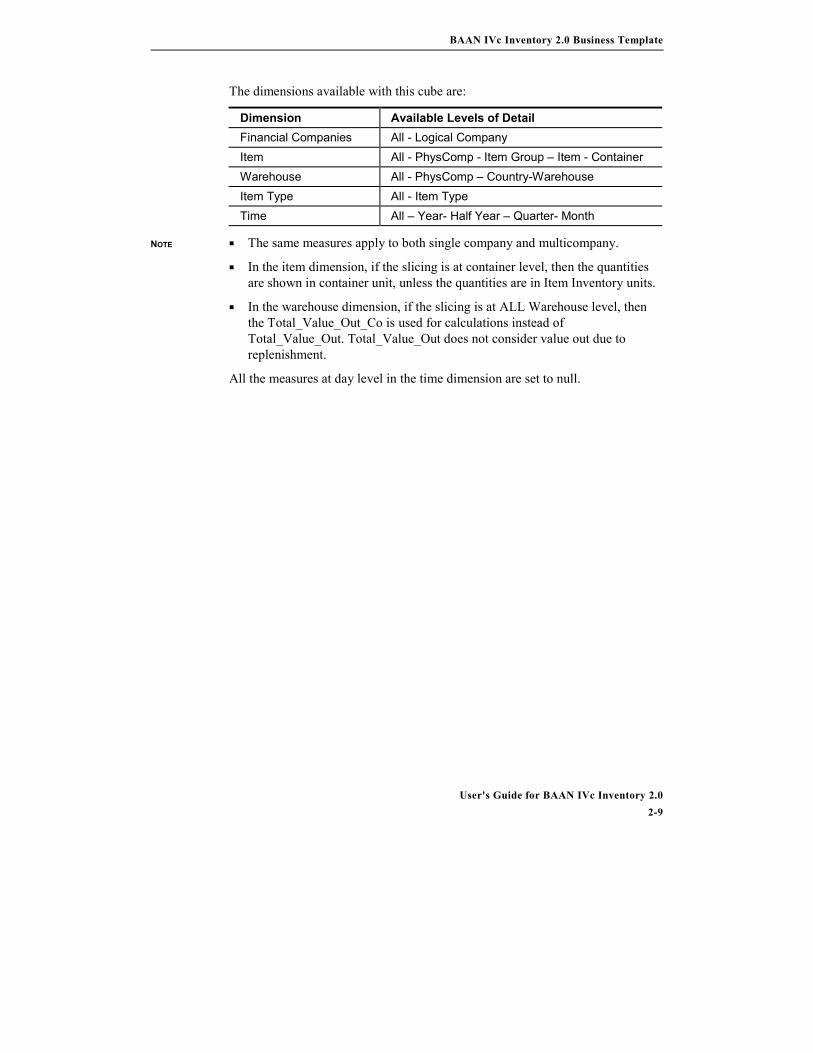
The dimensions available with this cube are:
Dimension Available Levels of DetailFinancial Companies All - Logical CompanyItem All - PhysComp - Item Group � Item - ContainerWarehouse All - PhysComp � Country-WarehouseItem Type All - Item TypeTime All � Year- Half Year � Quarter- Month
� The same measures apply to both single company and multicompany.
� In the item dimension, if the slicing is at container level, then the quantitiesare shown in container unit, unless the quantities are in Item Inventory units.
� In the warehouse dimension, if the slicing is at ALL Warehouse level, thenthe Total_Value_Out_Co is used for calculations instead ofTotal_Value_Out. Total_Value_Out does not consider value out due toreplenishment.
All the measures at day level in the time dimension are set to null.
NOTE
BAAN IVc Inventory 2.0 Business Template
User's Guide for BAAN IVc Inventory 2.02-10
User's Guide for BAAN IVc Inventory 2.03-1
This chapter describes some analyses that you can carry out based on thebusiness content described in the previous chapter.
The following examples show the capabilities of the business content forInventory. Thanks to the flexibility of the OLAP environment and the reportingenvironment, you clarify several issues with the help of the business content.Because these environments work with the notion of dimensions extensively, youcan easily produce information on the level you want.
The Universe enables the user to create both single and multicompany reports.Standard, the report will contain data from multiple companies. With respect toamounts, make sure to use the DWC measures in a multicompany report. Tocreate a single company report, select the Company number selected object in thequery panel. When you run a query or refresh a report, this automaticallyprompts the user to select a company number from a list. The report will thenonly contain data for the selected company. The selected company number thenappears in the report.
Inventory transaction analysisObviously, a business user is interested in the analysis of inflow and outflowmovements of Inventory for various transaction types in terms of quantity andvalue. A break up is made available for the inflow and outflow values in terms oftheir material and labor content along with the total value.
Depending on the transaction type, you can perform the following analyses:
� Purchase Receipt Analysis.You can reflect and compare the purchase receipts made for a particular itemor item groups over a period of time. This analysis is possible if you slice ontransaction type Purchase receipt, and select the Total_Value_In measure. Tocarry out this analysis at warehouse level, you can slice on a particularwarehouse, or select all warehouses for which the values of Purchase receiptsat company level are available.
This analysis enables the user to focus on those items or item groups forwhich there was a high value of receipts during a period, for example, a list oftop 10 items for the items� receipt values.
3 Examples

Examples
User's Guide for BAAN IVc Inventory 2.03-2
If you use the Business Object reporting tool, to drill down at order level, youcan slice on Dimension Object Order.
Alternatively, if you select the Total_Value_Out measure, you can analyzethe movement of purchase returns.
� Production Receipt analysis.You can reflect and compare the production receipts made for a particularitem or item groups over a period of time. To perform this analysis, you canslice on transaction type Production receipt, and select the Total_Value_Inmeasure. You can also analyze the material and labour components of thesereceipts over a period of time.
� Production + Purchase receipt analysis.You can source a particular component from external vendors, or supply thecomponent by the in-house manufacturing facility. As was discussedpreviously, the user can have separate reports for purchase and productionreceipts or a Business Object report for the aggregated value of receipts for anitem or item group at warehouse or company level for a particular period.
The following figure (see Figure 3-1) is an example of the production +purchase receipt analysis using Business Object reporting.
Figure 3-1 Example of Production + Purchase Receipt Analysis

Examples
User's Guide for BAAN IVc Inventory 2.03-3
� Inventory adjustment order analysis.Applies to a user interested in details of Inventory adjustments that havetaken place over a period of time. The user might want a list, for example, ofthe top 10 or 20 items for which inventory adjustment exist in a particularperiod. This analysis is available if you select the dimension, transaction typeinventory adjustment, and measure as Total_Value_Out / Total_Value_In.
In addition, if you select the dimension order in the Business Object report,the user can use order number and position number to retrieve the reasoncode associated with the Inventory adjustment order from the Baan database.
� Sales Issue Analysis.This analysis can provide the user with the sales issue for an item or a rangeof item over a period of time. To make this information available, you canselect the transaction type sales issue. You can select theMaterial_Value_Out, Labour_Value_Out, andTotal_Value_Out measures.This information is available at company level or warehouse level.
If you select the measures related to inflow, you can carry out a sales returnanalysis.
� Production issue analysis.This analysis provides the user with the production issue for an item or arange of item over a period of time. To make this information available, youcan select the transaction type production issues. You can select theMaterial_Value_Out, Operation_Value_Out, and Total_Value_Out measures.This information is available at company level or warehouse level.
� Demand and supply variability analysis.You can compare the measure related to inflow and outflow of varioustransaction types. The following example shows how the OLAP cube is usedto compare and analyze the measure for transaction type of purchase receiptand production issue
Similarly, you can compare various transaction types such as sales issue andproduction receipt.
Examples
User's Guide for BAAN IVc Inventory 2.03-4
Inventory On-Hand AnalysisThe important element of aggregate inventory control is measuring the inventoryperformance.
The performance of an organization in terms of Inventory management can bemeasured by:
� Comparing the actual inventory with the budgeted values, which in term arearrived at keeping in mind the company�s inventory policy. The budgetedvalues are currently not available in the data warehouse, therefore, you cannotcompare the values with the actual values.
� Comparing the inventory levels for consecutive periods and parallel periods.
� Computing measures of inventory performance such as turnover rates whichis defined as the ratio annual cost of consumption by average value ofinventory during a period larger turnover usually means a better performance.
The inventory turnover ratio is calculated for several categories of Inventoriessuch as:
− Raw Material: Ratio of annualized value of consumption of componentsdivided by the average value of inventory. This provides an idea ofrelative performance of inventory of components compared to that of thecomponents� consumption.
− Finished goods: Ratio of annualized cost of goods sold by the averageinventory investment. This ratio provides an idea of relative performanceof the inventory compared to that of sales.
� Time period coverage of current inventory investment.Days of supplies available. This can actually be computed from the same dataused to compute the inventory turnover. Cost of goods sold for a year12,000,000 and the average inventory investment is 4,000,000. The sales turnover ratio is 3.0.
Days of supplies available can be then computed as 365/3 =122 days ofsupply.
Examples
User's Guide for BAAN IVc Inventory 2.03-5
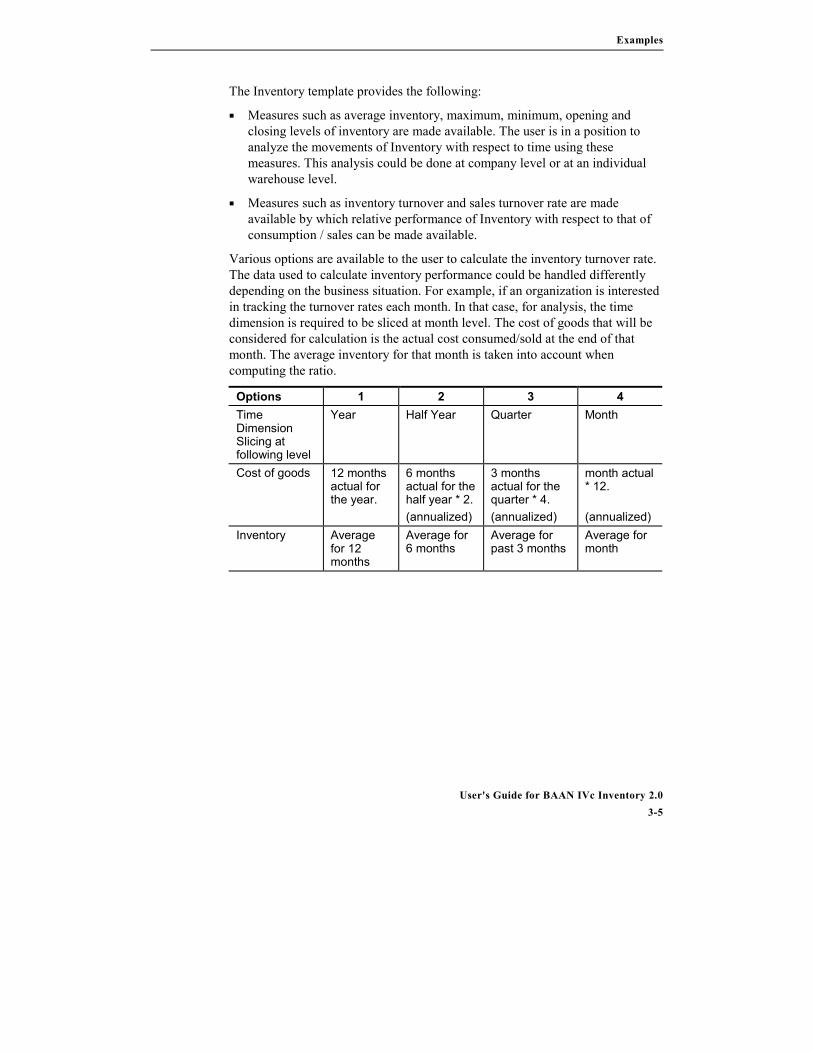
The Inventory template provides the following:
� Measures such as average inventory, maximum, minimum, opening andclosing levels of inventory are made available. The user is in a position toanalyze the movements of Inventory with respect to time using thesemeasures. This analysis could be done at company level or at an individualwarehouse level.
� Measures such as inventory turnover and sales turnover rate are madeavailable by which relative performance of Inventory with respect to that ofconsumption / sales can be made available.
Various options are available to the user to calculate the inventory turnover rate.The data used to calculate inventory performance could be handled differentlydepending on the business situation. For example, if an organization is interestedin tracking the turnover rates each month. In that case, for analysis, the timedimension is required to be sliced at month level. The cost of goods that will beconsidered for calculation is the actual cost consumed/sold at the end of thatmonth. The average inventory for that month is taken into account whencomputing the ratio.
Options 1 2 3 4TimeDimensionSlicing atfollowing level
Year Half Year Quarter Month
Cost of goods 12 monthsactual forthe year.
6 monthsactual for thehalf year * 2.(annualized)
3 monthsactual for thequarter * 4.(annualized)
month actual* 12.
(annualized)Inventory Average
for 12months
Average for6 months
Average forpast 3 months
Average formonth

Examples
User's Guide for BAAN IVc Inventory 2.03-6
The template provides the user absolute measures of the inventory performanceand also provides the measures of relative performance.
Figure 3-2 Example of the calculation for sales turnover
The previous figure illustrates the calculation for sales turnover for Item group =STEEL, for the months of Q3 of 1999.
Sales_Turnover (month 07) = 25000 * 12 / 42741.94 = 7.02
The user can clearly see that a buildup of inventory occurs from month 7through 9, however, a sudden dip in sales occurs for month 9, which is clearlyreflected in the Sales_Turnover ratio.

Examples
User's Guide for BAAN IVc Inventory 2.03-7
In the previous example, the management exercises inventory control by trackingthe performance measure on a monthly basis. If the same calculation is carriedout on a quarterly basis, then Sales_Turnover would be equal toTotal_Value_Sales_Out_Hc (at quarter level) * 4 / Avg_OnHand_Value (atquarter level).
Figure 3-3 Example of calculation of sales turnover
The previous figure is an example to illustrate the calculation ofInventory_Turnover for a component belonging to an Item_Group, LABELS.
As seen from above, the drop in the Inventory_Turnover ratio indicates a drop inthe consumption of the component.
Management of an organization must exercise caution when comparing theinventory performance data to other companies. The reason is that the othercompanies might not use the same methods to calculate their Inventory turnoverrate. In addition, the operations, finances, management, and staff will differ. Theother companies� needs to supply the product to customers at a given servicelevel might differ from your own.
The turnover rate calculations are not the only measurements of success. Thesecalculations are indicators of trend in inventory.

Examples
User's Guide for BAAN IVc Inventory 2.03-8