Embed Size (px)
Citation preview
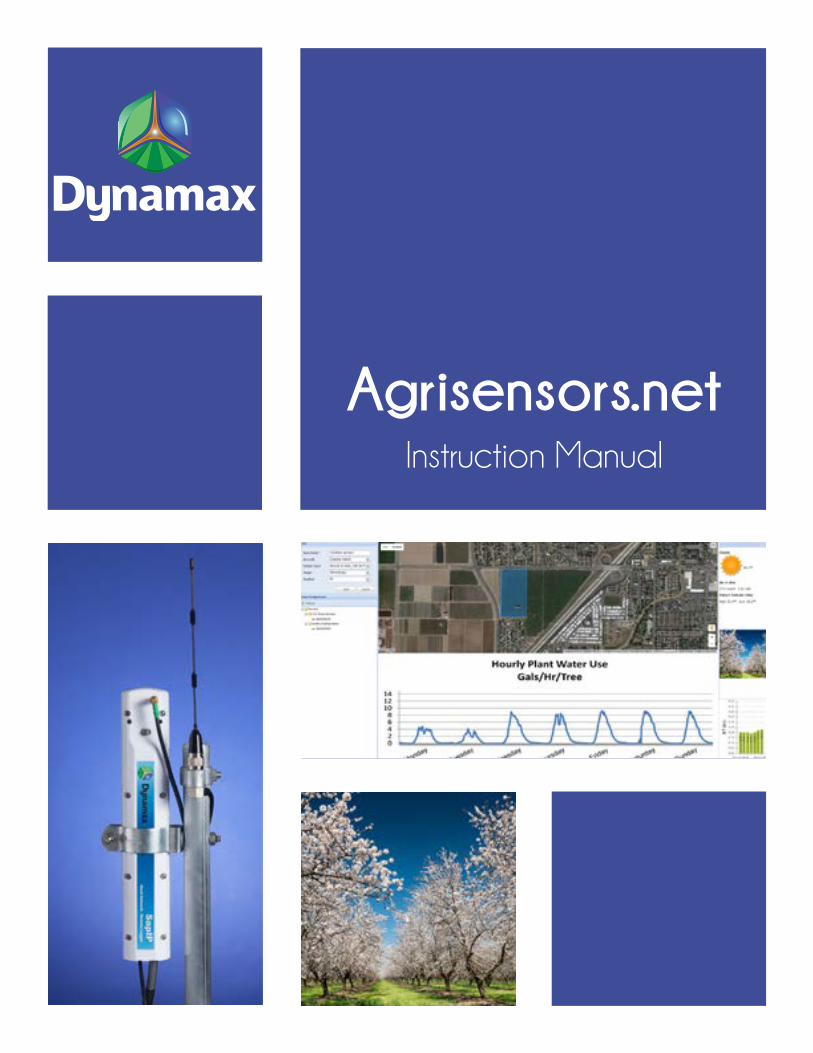
Agrisensors.netInstruction Manual
Agrisensors.net
Dynamax, Inc
Agrisensors.net Customer Instructions Manual
This manual provides Dynamax’s SapIP customers with a basic outline of how to correctly navigate around the Agrisensors.net web page.
Instructions on how to use each feature of the website are broken down into subsections and placed within the tab(s) they are found.
Created: 7/31/2015 Updated: 3/22/2017
Version 1.5
Instructions Manual Agriensensors.net
Page 1 Dynamax, Inc.
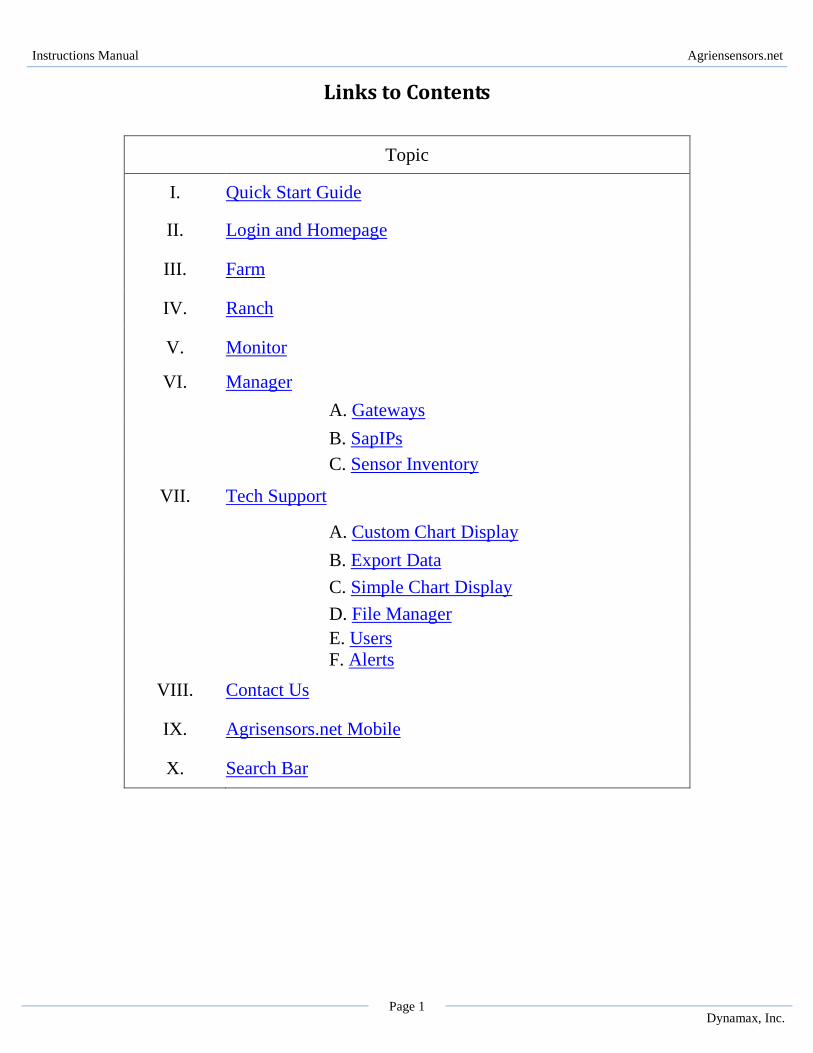
Links to Contents
Topic
I. Quick Start Guide
II. Login and Homepage
III. Farm
IV. Ranch
V. Monitor
VI. Manager A. Gateways B. SapIPs C. Sensor Inventory
VII. Tech Support
A. Custom Chart Display B. Export Data C. Simple Chart Display D. File Manager
E. Users F. Alerts
VIII. Contact Us
IX. Agrisensors.net Mobile
X. Search Bar
Instructions Manual Agriensensors.net
Page 2 Dynamax, Inc.
Quick Start Guide -The first section of this document contains methods to quickly access a client’s data which has been calculated by Agrisensors.net. This data will be displayed as a chart or set of charts within each SapIP unit. Furthermore, this section also includes general steps to access each account’s gateways’, SapIPs’, and sensors’ settings.
A. Accessing Charts -Being able to both quickly and efficiently access data within the Agrisensors.net web portal may be the most important set of instructions found within this document. The steps below provide an outline of how to correctly navigate to each SapIP within a client’s account. By navigating to a SapIP’s homepage, the customer will have the ability to view a chart or set of charts that have been associated to that SapIP. These charts populate certain measurements that have been calculated by that SapIP, and into data that is both understandable and presentable in a graphical format.
1. Navigating to a SapIP’s Homepage -Below lists the first set of steps that are required to open a specific SapIP’s webpage. These steps can be generally used to gain access to all of a client’s SapIP’s within their specific account.
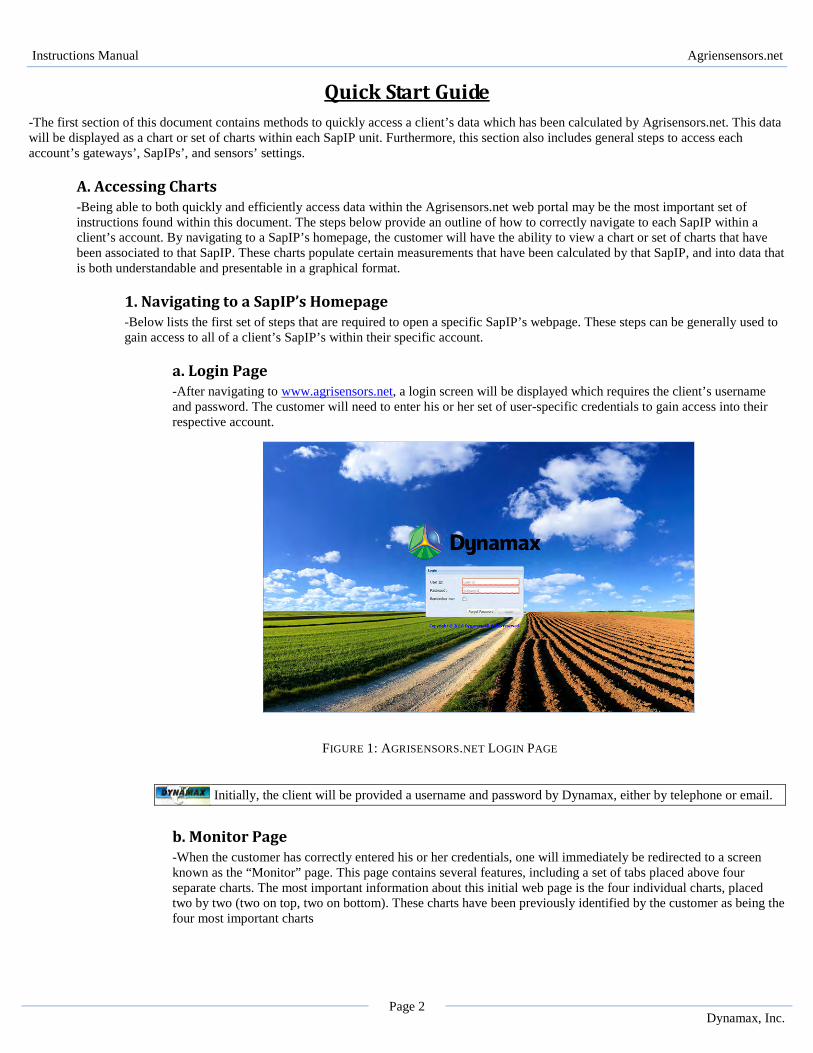
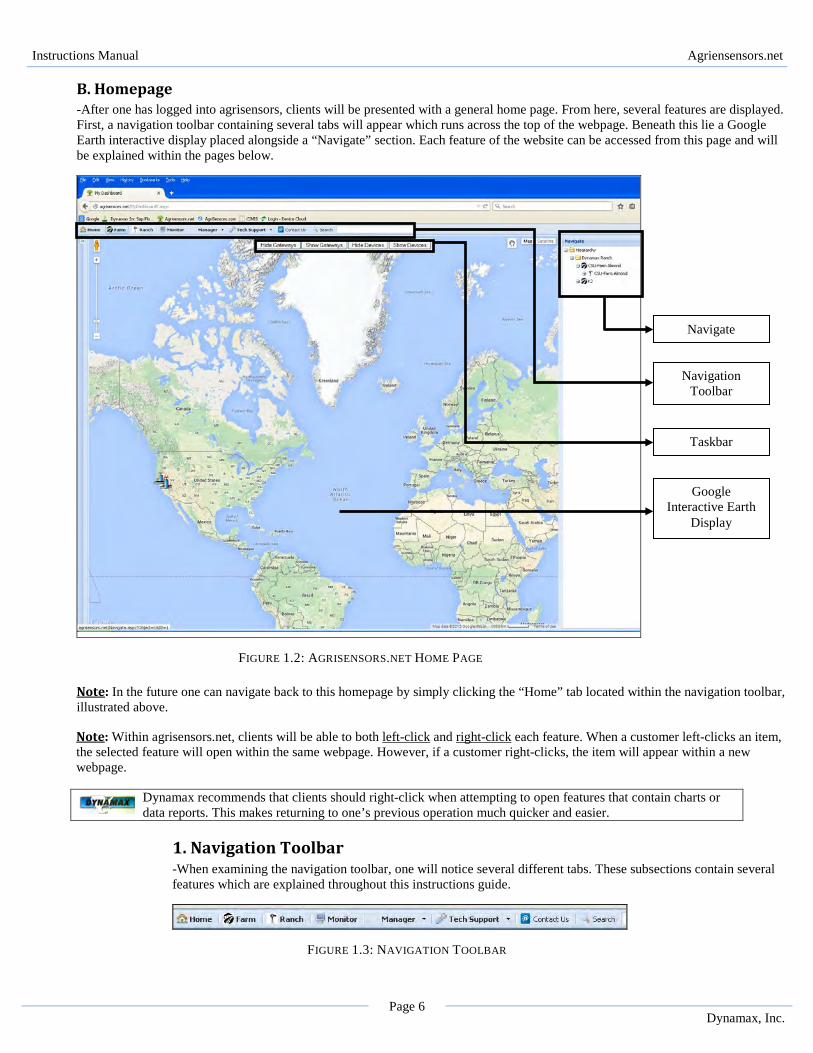
a. Login Page -After navigating to www.agrisensors.net, a login screen will be displayed which requires the client’s username and password. The customer will need to enter his or her set of user-specific credentials to gain access into their respective account.
FIGURE 1: AGRISENSORS.NET LOGIN PAGE
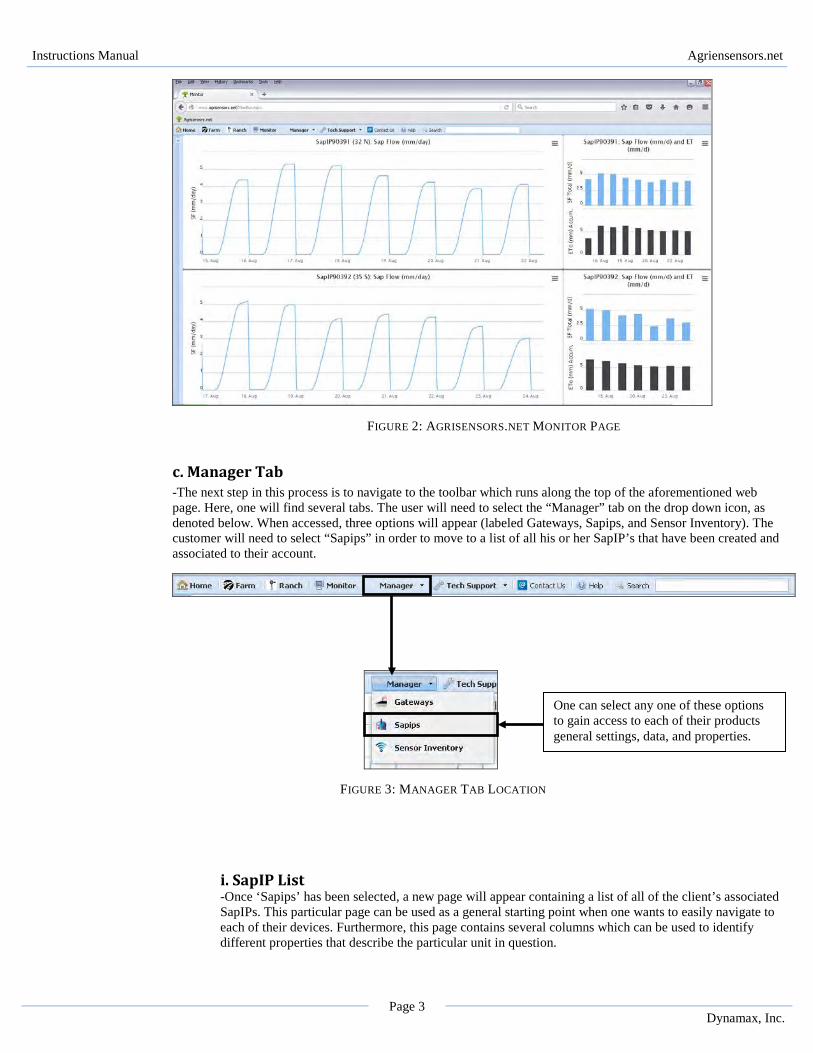
b. Monitor Page -When the customer has correctly entered his or her credentials, one will immediately be redirected to a screen known as the “Monitor” page. This page contains several features, including a set of tabs placed above four separate charts. The most important information about this initial web page is the four individual charts, placed two by two (two on top, two on bottom). These charts have been previously identified by the customer as being the four most important charts
Initially, the client will be provided a username and password by Dynamax, either by telephone or email.
Instructions Manual Agriensensors.net
Page 3 Dynamax, Inc.
FIGURE 2: AGRISENSORS.NET MONITOR PAGE
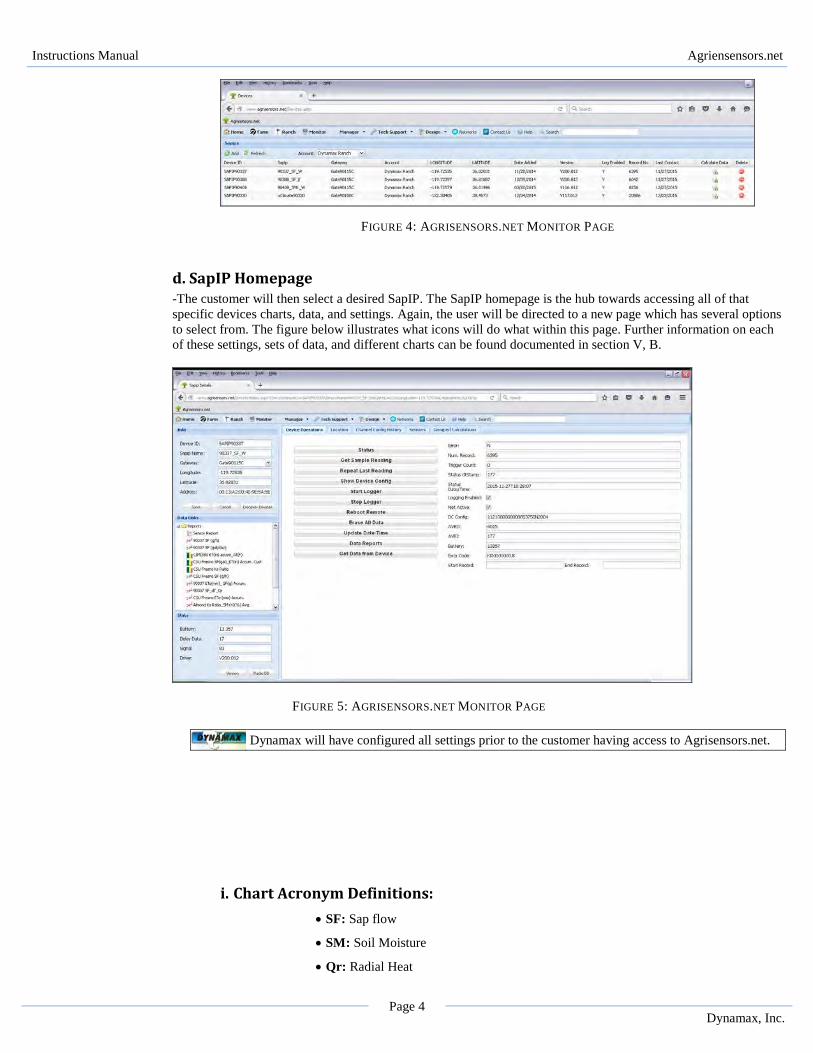
c. Manager Tab -The next step in this process is to navigate to the toolbar which runs along the top of the aforementioned web page. Here, one will find several tabs. The user will need to select the “Manager” tab on the drop down icon, as denoted below. When accessed, three options will appear (labeled Gateways, Sapips, and Sensor Inventory). The customer will need to select “Sapips” in order to move to a list of all his or her SapIP’s that have been created and associated to their account.
FIGURE 3: MANAGER TAB LOCATION
i. SapIP List -Once ‘Sapips’ has been selected, a new page will appear containing a list of all of the client’s associated SapIPs. This particular page can be used as a general starting point when one wants to easily navigate to each of their devices. Furthermore, this page contains several columns which can be used to identify different properties that describe the particular unit in question.
One can select any one of these options to gain access to each of their products general settings, data, and properties.
Instructions Manual Agriensensors.net
Page 4 Dynamax, Inc.
FIGURE 4: AGRISENSORS.NET MONITOR PAGE
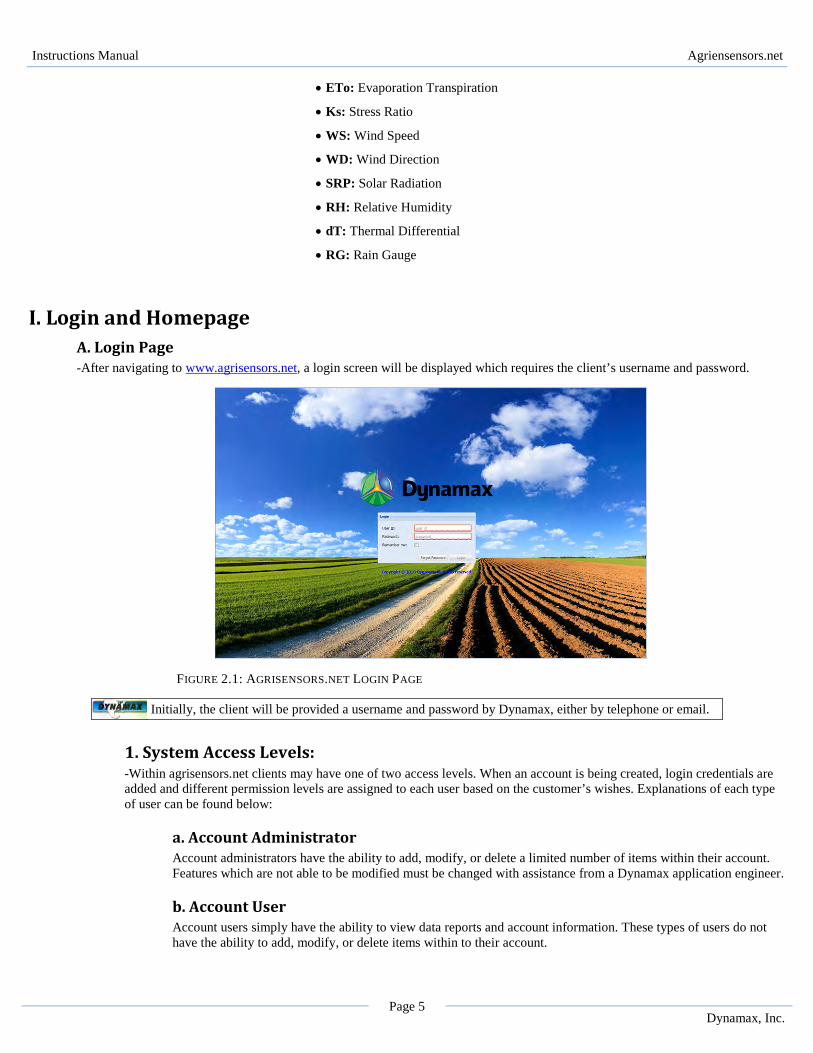
d. SapIP Homepage -The customer will then select a desired SapIP. The SapIP homepage is the hub towards accessing all of that specific devices charts, data, and settings. Again, the user will be directed to a new page which has several options to select from. The figure below illustrates what icons will do what within this page. Further information on each of these settings, sets of data, and different charts can be found documented in section V, B.
FIGURE 5: AGRISENSORS.NET MONITOR PAGE
i. Chart Acronym Definitions: • SF: Sap flow
• SM: Soil Moisture
• Qr: Radial Heat
Dynamax will have configured all settings prior to the customer having access to Agrisensors.net.
Instructions Manual Agriensensors.net
Page 5 Dynamax, Inc.
• ETo: Evaporation Transpiration
• Ks: Stress Ratio
• WS: Wind Speed
• WD: Wind Direction
• SRP: Solar Radiation
• RH: Relative Humidity
• dT: Thermal Differential
• RG: Rain Gauge
I. Login and Homepage A. Login Page -After navigating to www.agrisensors.net, a login screen will be displayed which requires the client’s username and password.
FIGURE 2.1: AGRISENSORS.NET LOGIN PAGE 1. System Access Levels:
-Within agrisensors.net clients may have one of two access levels. When an account is being created, login credentials are added and different permission levels are assigned to each user based on the customer’s wishes. Explanations of each type of user can be found below:
a. Account Administrator Account administrators have the ability to add, modify, or delete a limited number of items within their account. Features which are not able to be modified must be changed with assistance from a Dynamax application engineer.
b. Account User Account users simply have the ability to view data reports and account information. These types of users do not have the ability to add, modify, or delete items within to their account.
Initially, the client will be provided a username and password by Dynamax, either by telephone or email.
Instructions Manual Agriensensors.net
Page 6 Dynamax, Inc.
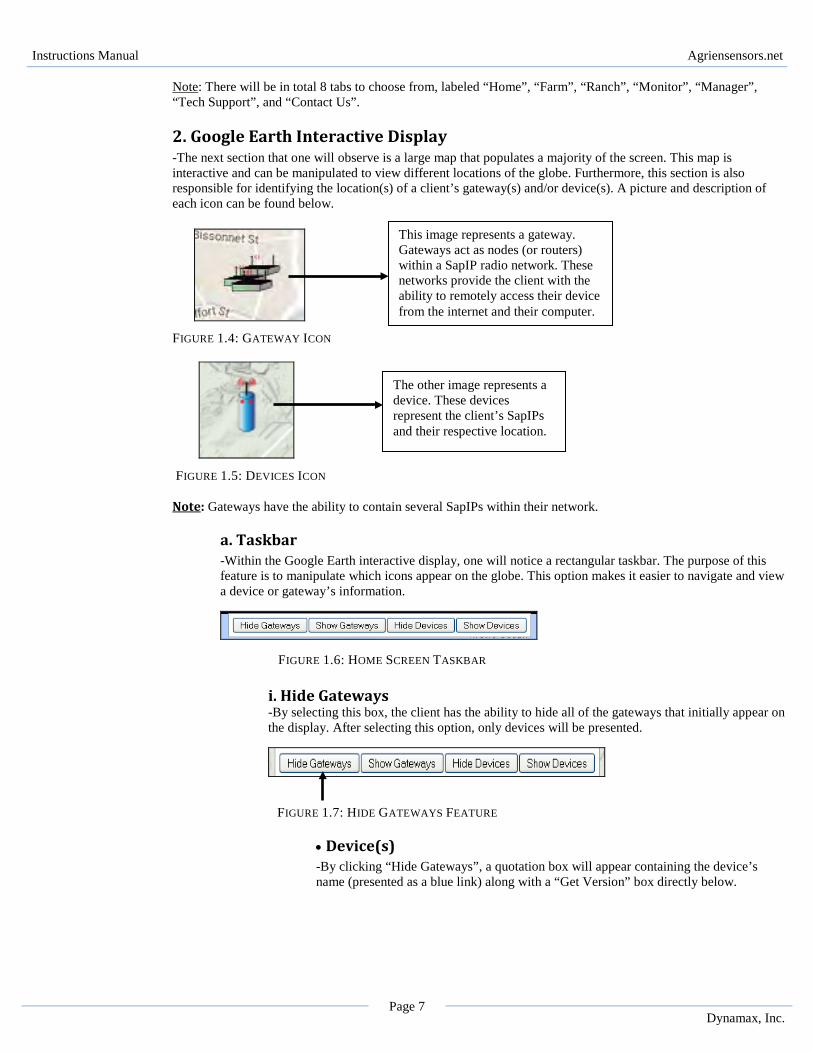
B. Homepage -After one has logged into agrisensors, clients will be presented with a general home page. From here, several features are displayed. First, a navigation toolbar containing several tabs will appear which runs across the top of the webpage. Beneath this lie a Google Earth interactive display placed alongside a “Navigate” section. Each feature of the website can be accessed from this page and will be explained within the pages below.
FIGURE 1.2: AGRISENSORS.NET HOME PAGE
Note: In the future one can navigate back to this homepage by simply clicking the “Home” tab located within the navigation toolbar, illustrated above.
1. Navigation Toolbar -When examining the navigation toolbar, one will notice several different tabs. These subsections contain several features which are explained throughout this instructions guide.
FIGURE 1.3: NAVIGATION TOOLBAR
Dynamax recommends that clients should right-click when attempting to open features that contain charts or data reports. This makes returning to one’s previous operation much quicker and easier.
Navigate
Navigation Toolbar
Google Interactive Earth
Display
Taskbar
Note: Within agrisensors.net, clients will be able to both left-click and right-click each feature. When a customer left-clicks an item, the selected feature will open within the same webpage. However, if a customer right-clicks, the item will appear within a new webpage.
Instructions Manual Agriensensors.net
Page 7 Dynamax, Inc.
Note: There will be in total 8 tabs to choose from, labeled “Home”, “Farm”, “Ranch”, “Monitor”, “Manager”, “Tech Support”, and “Contact Us”.
2. Google Earth Interactive Display -The next section that one will observe is a large map that populates a majority of the screen. This map is interactive and can be manipulated to view different locations of the globe. Furthermore, this section is also responsible for identifying the location(s) of a client’s gateway(s) and/or device(s). A picture and description of each icon can be found below.
FIGURE 1.4: GATEWAY ICON
FIGURE 1.5: DEVICES ICON
Note: Gateways have the ability to contain several SapIPs within their network.
a. Taskbar -Within the Google Earth interactive display, one will notice a rectangular taskbar. The purpose of this feature is to manipulate which icons appear on the globe. This option makes it easier to navigate and view a device or gateway’s information.
FIGURE 1.6: HOME SCREEN TASKBAR
i. Hide Gateways -By selecting this box, the client has the ability to hide all of the gateways that initially appear on the display. After selecting this option, only devices will be presented.
FIGURE 1.7: HIDE GATEWAYS FEATURE
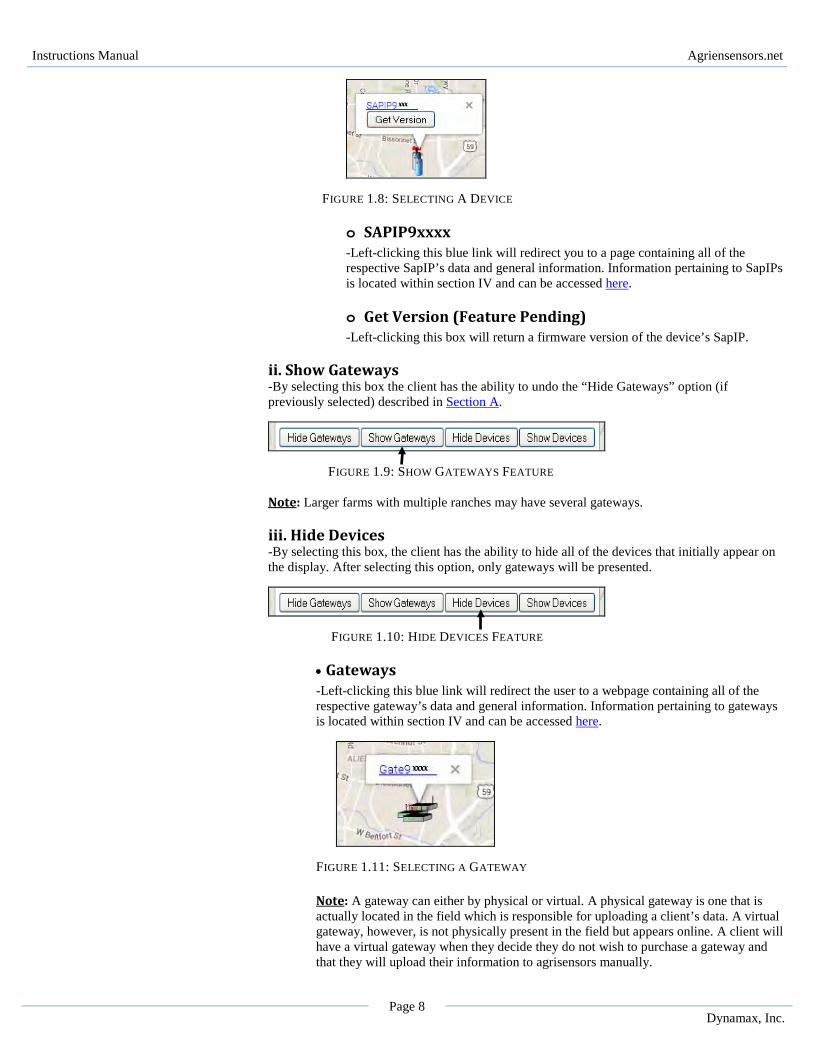
• Device(s) -By clicking “Hide Gateways”, a quotation box will appear containing the device’s name (presented as a blue link) along with a “Get Version” box directly below.
This image represents a gateway. Gateways act as nodes (or routers) within a SapIP radio network. These networks provide the client with the ability to remotely access their device from the internet and their computer.
The other image represents a device. These devices represent the client’s SapIPs and their respective location.
Instructions Manual Agriensensors.net
Page 8 Dynamax, Inc.
FIGURE 1.8: SELECTING A DEVICE
o SAPIP9xxxx -Left-clicking this blue link will redirect you to a page containing all of the respective SapIP’s data and general information. Information pertaining to SapIPs is located within section IV and can be accessed here.
o Get Version (Feature Pending) -Left-clicking this box will return a firmware version of the device’s SapIP.
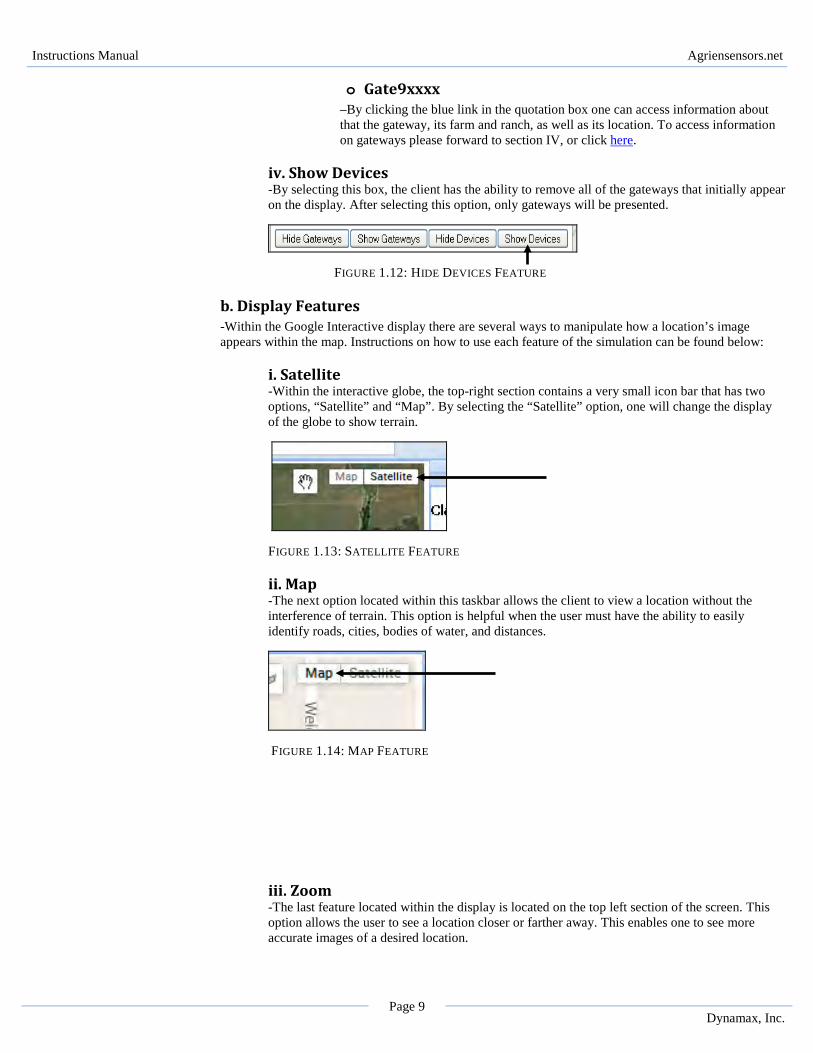
ii. Show Gateways -By selecting this box the client has the ability to undo the “Hide Gateways” option (if previously selected) described in Section A.
FIGURE 1.9: SHOW GATEWAYS FEATURE Note: Larger farms with multiple ranches may have several gateways.
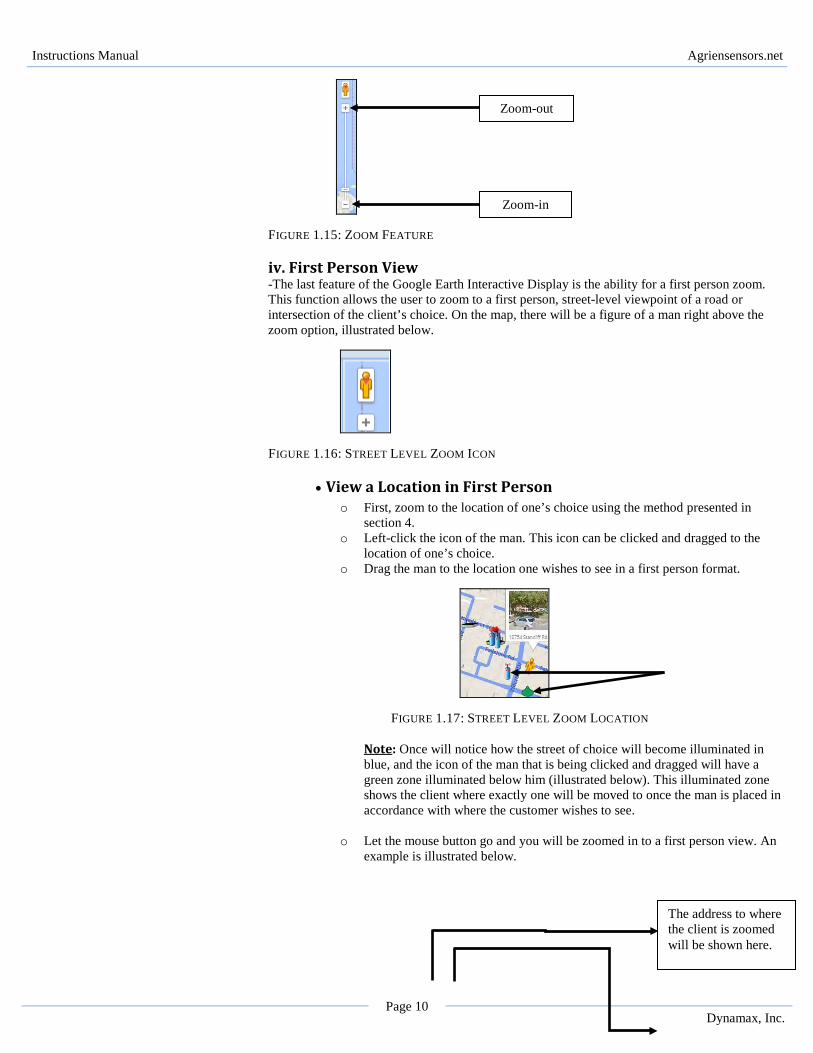
iii. Hide Devices -By selecting this box, the client has the ability to hide all of the devices that initially appear on the display. After selecting this option, only gateways will be presented.
FIGURE 1.10: HIDE DEVICES FEATURE
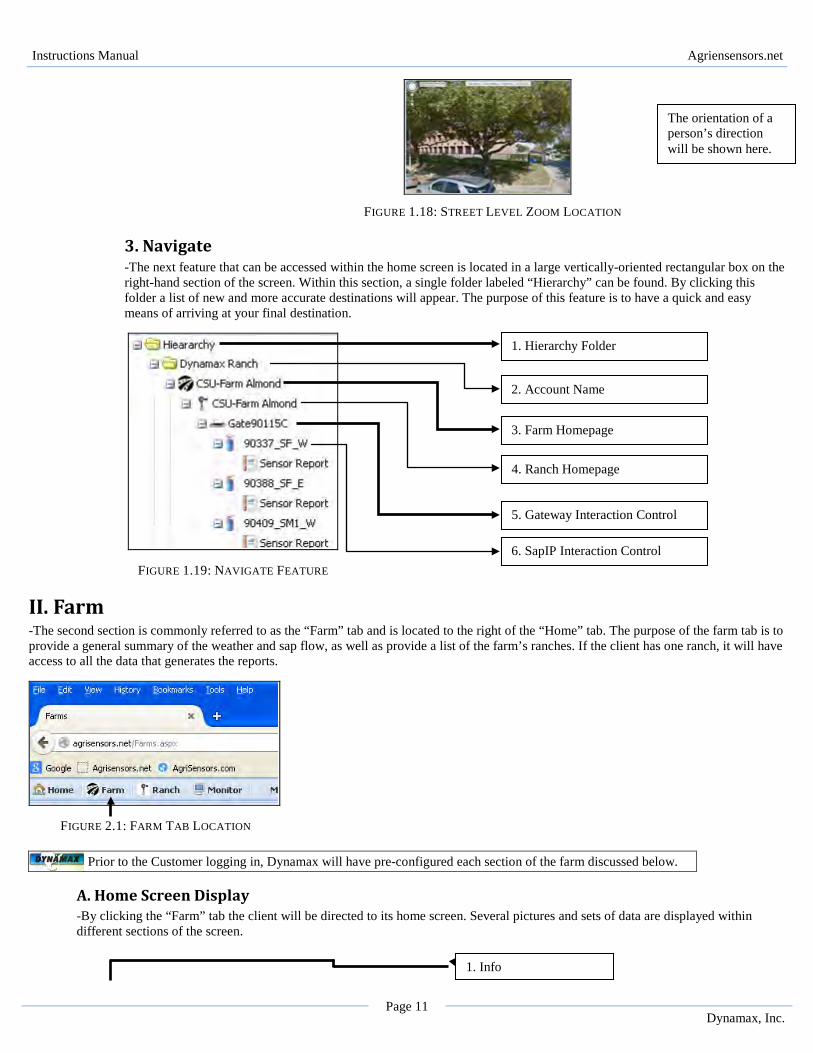
• Gateways -Left-clicking this blue link will redirect the user to a webpage containing all of the respective gateway’s data and general information. Information pertaining to gateways is located within section IV and can be accessed here.
FIGURE 1.11: SELECTING A GATEWAY
Note: A gateway can either by physical or virtual. A physical gateway is one that is actually located in the field which is responsible for uploading a client’s data. A virtual gateway, however, is not physically present in the field but appears online. A client will have a virtual gateway when they decide they do not wish to purchase a gateway and that they will upload their information to agrisensors manually.
Instructions Manual Agriensensors.net
Page 9 Dynamax, Inc.
o Gate9xxxx –By clicking the blue link in the quotation box one can access information about that the gateway, its farm and ranch, as well as its location. To access information on gateways please forward to section IV, or click here.
iv. Show Devices -By selecting this box, the client has the ability to remove all of the gateways that initially appear on the display. After selecting this option, only gateways will be presented.
FIGURE 1.12: HIDE DEVICES FEATURE
b. Display Features -Within the Google Interactive display there are several ways to manipulate how a location’s image appears within the map. Instructions on how to use each feature of the simulation can be found below:
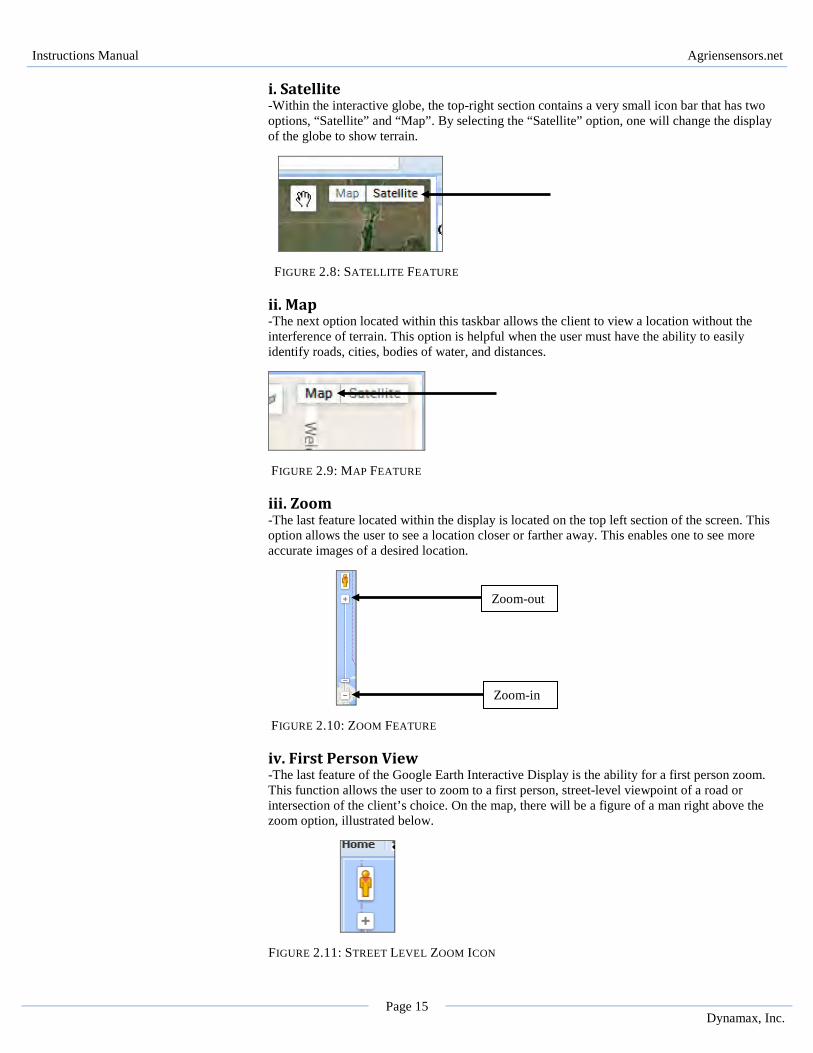
i. Satellite -Within the interactive globe, the top-right section contains a very small icon bar that has two options, “Satellite” and “Map”. By selecting the “Satellite” option, one will change the display of the globe to show terrain.
FIGURE 1.13: SATELLITE FEATURE ii. Map -The next option located within this taskbar allows the client to view a location without the interference of terrain. This option is helpful when the user must have the ability to easily identify roads, cities, bodies of water, and distances.
FIGURE 1.14: MAP FEATURE
iii. Zoom -The last feature located within the display is located on the top left section of the screen. This option allows the user to see a location closer or farther away. This enables one to see more accurate images of a desired location.
Instructions Manual Agriensensors.net
Page 10 Dynamax, Inc.
FIGURE 1.15: ZOOM FEATURE iv. First Person View -The last feature of the Google Earth Interactive Display is the ability for a first person zoom. This function allows the user to zoom to a first person, street-level viewpoint of a road or intersection of the client’s choice. On the map, there will be a figure of a man right above the zoom option, illustrated below.
FIGURE 1.16: STREET LEVEL ZOOM ICON
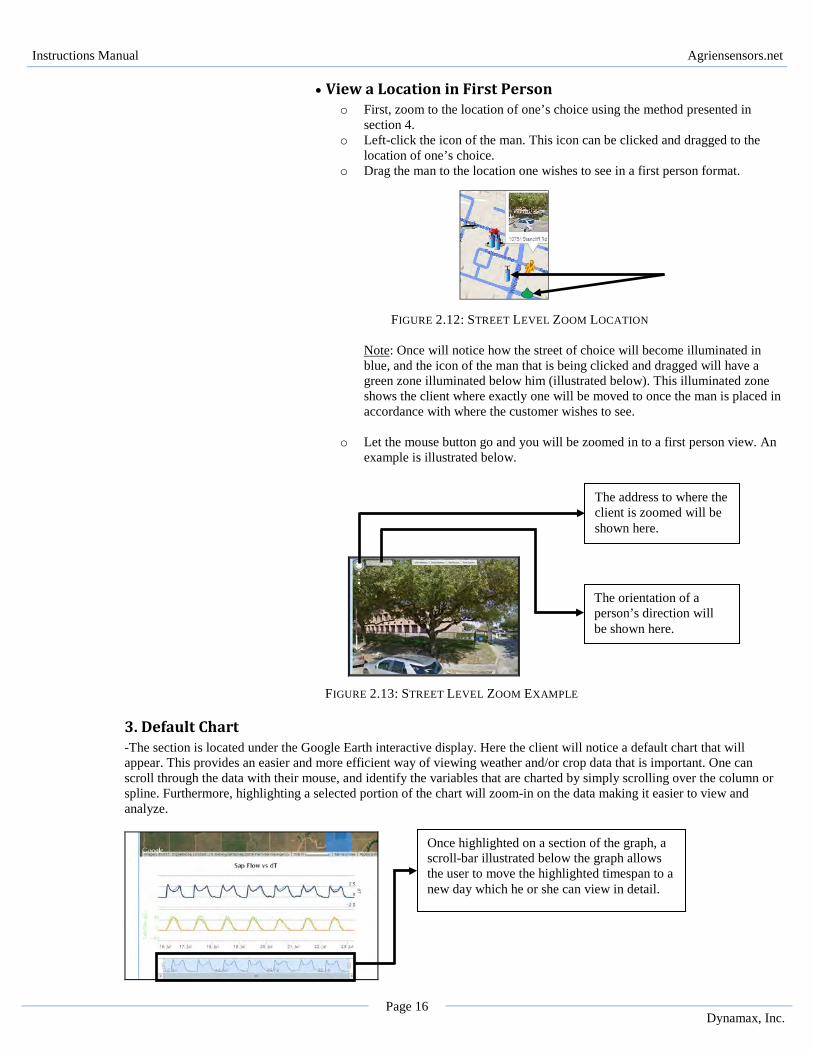
• View a Location in First Person o First, zoom to the location of one’s choice using the method presented in
section 4. o Left-click the icon of the man. This icon can be clicked and dragged to the
location of one’s choice. o Drag the man to the location one wishes to see in a first person format.
FIGURE 1.17: STREET LEVEL ZOOM LOCATION
Note: Once will notice how the street of choice will become illuminated in blue, and the icon of the man that is being clicked and dragged will have a green zone illuminated below him (illustrated below). This illuminated zone shows the client where exactly one will be moved to once the man is placed in accordance with where the customer wishes to see.
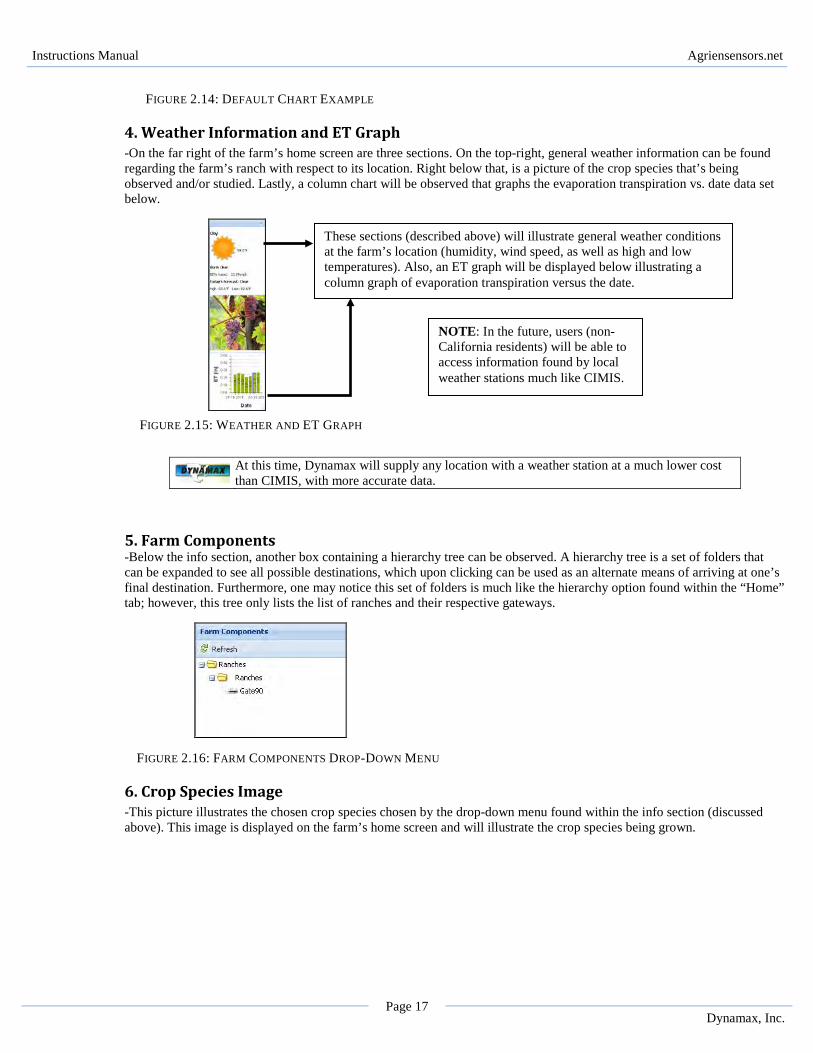
o Let the mouse button go and you will be zoomed in to a first person view. An
example is illustrated below.
Zoom-out
Zoom-in
The address to where the client is zoomed will be shown here.
Instructions Manual Agriensensors.net
Page 11 Dynamax, Inc.
FIGURE 1.18: STREET LEVEL ZOOM LOCATION
3. Navigate -The next feature that can be accessed within the home screen is located in a large vertically-oriented rectangular box on the right-hand section of the screen. Within this section, a single folder labeled “Hierarchy” can be found. By clicking this folder a list of new and more accurate destinations will appear. The purpose of this feature is to have a quick and easy means of arriving at your final destination.
FIGURE 1.19: NAVIGATE FEATURE
II. Farm -The second section is commonly referred to as the “Farm” tab and is located to the right of the “Home” tab. The purpose of the farm tab is to provide a general summary of the weather and sap flow, as well as provide a list of the farm’s ranches. If the client has one ranch, it will have access to all the data that generates the reports.
FIGURE 2.1: FARM TAB LOCATION
A. Home Screen Display -By clicking the “Farm” tab the client will be directed to its home screen. Several pictures and sets of data are displayed within different sections of the screen.
Prior to the Customer logging in, Dynamax will have pre-configured each section of the farm discussed below.
1. Info
1. Hierarchy Folder
2. Account Name
4. Ranch Homepage
3. Farm Homepage
5. Gateway Interaction Control 6. SapIP Interaction Control
The orientation of a person’s direction will be shown here.
Instructions Manual Agriensensors.net
Page 12 Dynamax, Inc.
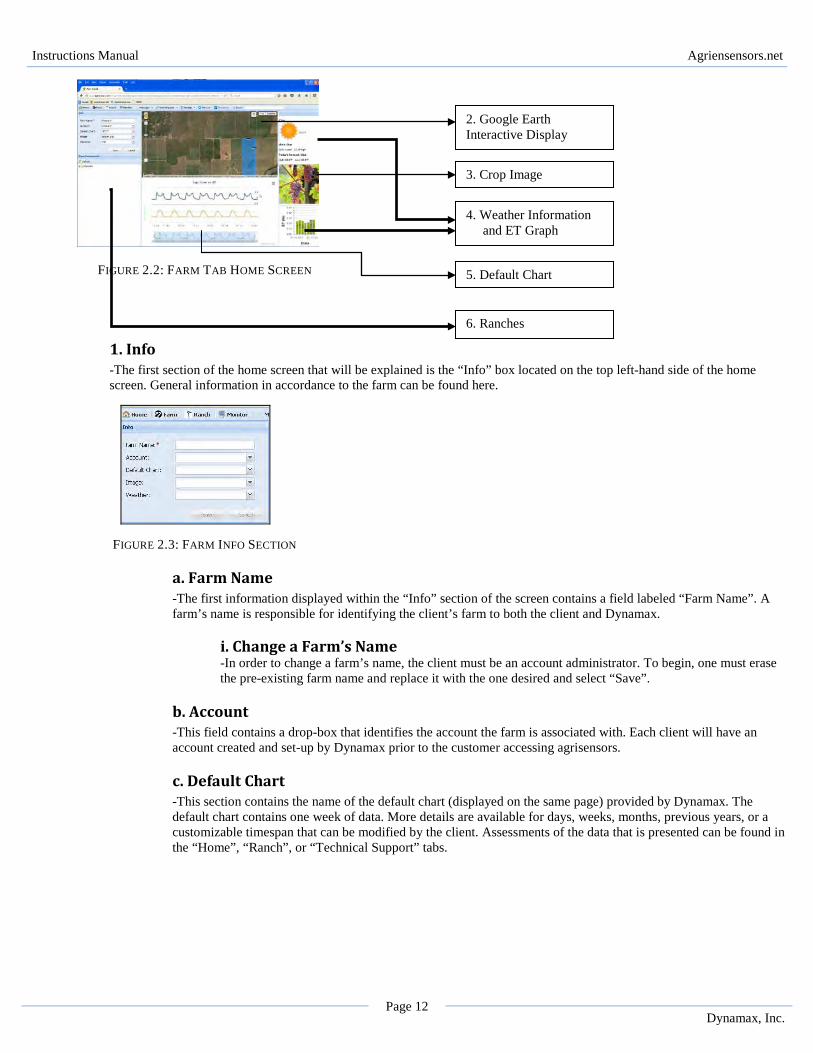
FIGURE 2.2: FARM TAB HOME SCREEN
1. Info -The first section of the home screen that will be explained is the “Info” box located on the top left-hand side of the home screen. General information in accordance to the farm can be found here.
FIGURE 2.3: FARM INFO SECTION
a. Farm Name -The first information displayed within the “Info” section of the screen contains a field labeled “Farm Name”. A farm’s name is responsible for identifying the client’s farm to both the client and Dynamax.
i. Change a Farm’s Name -In order to change a farm’s name, the client must be an account administrator. To begin, one must erase the pre-existing farm name and replace it with the one desired and select “Save”.
b. Account -This field contains a drop-box that identifies the account the farm is associated with. Each client will have an account created and set-up by Dynamax prior to the customer accessing agrisensors.
c. Default Chart -This section contains the name of the default chart (displayed on the same page) provided by Dynamax. The default chart contains one week of data. More details are available for days, weeks, months, previous years, or a customizable timespan that can be modified by the client. Assessments of the data that is presented can be found in the “Home”, “Ranch”, or “Technical Support” tabs.
6. Ranches
2. Google Earth Interactive Display
3. Crop Image
4. Weather Information and ET Graph
5. Default Chart
Instructions Manual Agriensensors.net
Page 13 Dynamax, Inc.
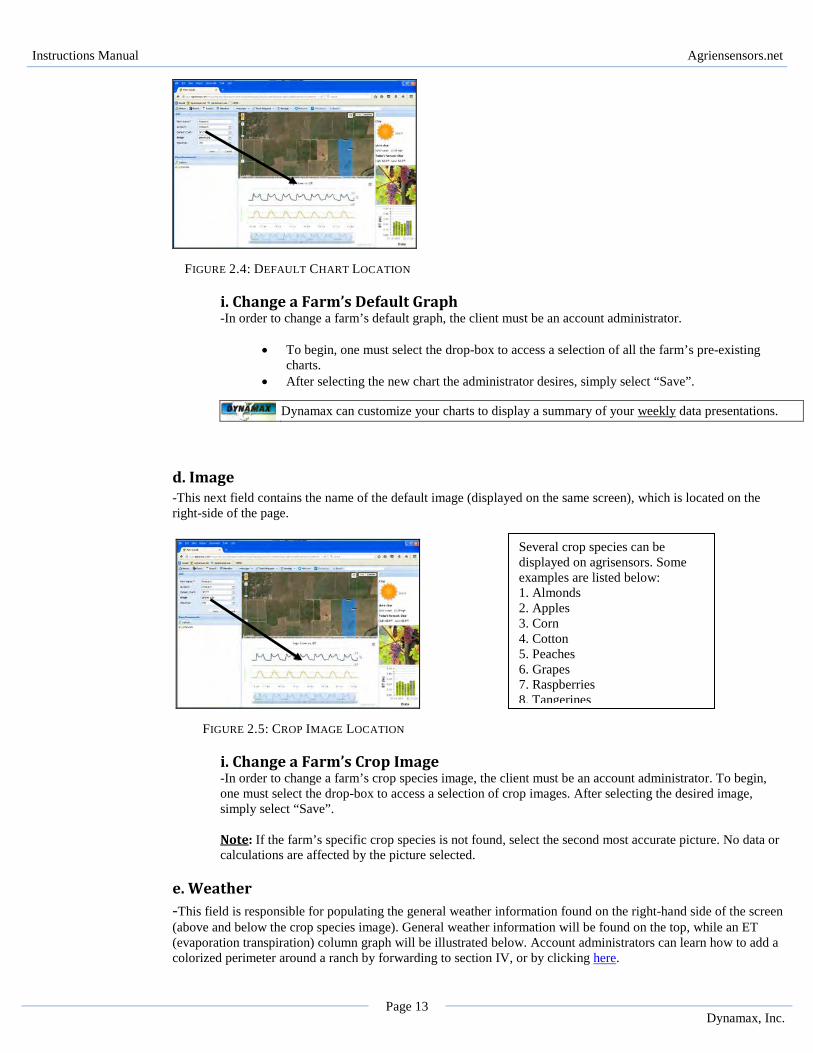
FIGURE 2.4: DEFAULT CHART LOCATION
i. Change a Farm’s Default Graph -In order to change a farm’s default graph, the client must be an account administrator.
• To begin, one must select the drop-box to access a selection of all the farm’s pre-existing charts.
• After selecting the new chart the administrator desires, simply select “Save”.
d. Image -This next field contains the name of the default image (displayed on the same screen), which is located on the right-side of the page.
FIGURE 2.5: CROP IMAGE LOCATION
i. Change a Farm’s Crop Image -In order to change a farm’s crop species image, the client must be an account administrator. To begin, one must select the drop-box to access a selection of crop images. After selecting the desired image, simply select “Save”. Note: If the farm’s specific crop species is not found, select the second most accurate picture. No data or calculations are affected by the picture selected.
e. Weather -This field is responsible for populating the general weather information found on the right-hand side of the screen (above and below the crop species image). General weather information will be found on the top, while an ET (evaporation transpiration) column graph will be illustrated below. Account administrators can learn how to add a colorized perimeter around a ranch by forwarding to section IV, or by clicking here.
Dynamax can customize your charts to display a summary of your weekly data presentations.
Several crop species can be displayed on agrisensors. Some examples are listed below: 1. Almonds 2. Apples 3. Corn 4. Cotton 5. Peaches 6. Grapes 7. Raspberries 8. Tangerines
Instructions Manual Agriensensors.net
Page 14 Dynamax, Inc.
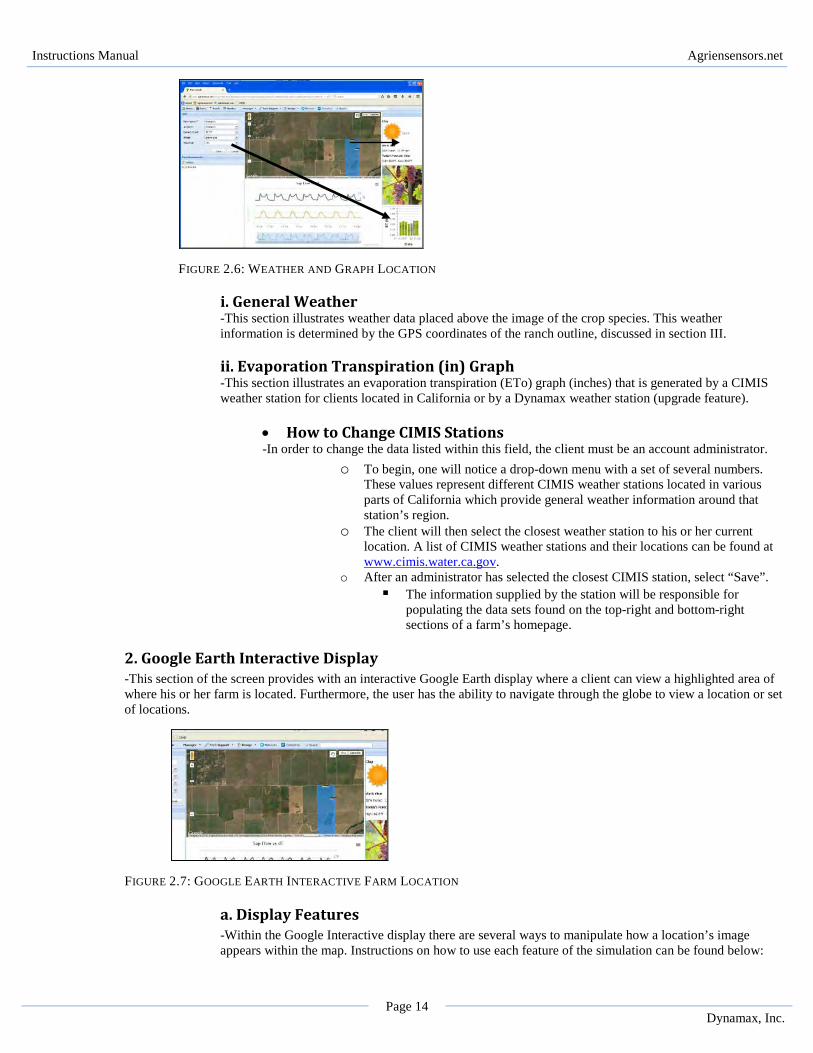
FIGURE 2.6: WEATHER AND GRAPH LOCATION
i. General Weather -This section illustrates weather data placed above the image of the crop species. This weather information is determined by the GPS coordinates of the ranch outline, discussed in section III. ii. Evaporation Transpiration (in) Graph -This section illustrates an evaporation transpiration (ETo) graph (inches) that is generated by a CIMIS weather station for clients located in California or by a Dynamax weather station (upgrade feature).
• How to Change CIMIS Stations -In order to change the data listed within this field, the client must be an account administrator.
o To begin, one will notice a drop-down menu with a set of several numbers. These values represent different CIMIS weather stations located in various parts of California which provide general weather information around that station’s region.
o The client will then select the closest weather station to his or her current location. A list of CIMIS weather stations and their locations can be found at www.cimis.water.ca.gov.
o After an administrator has selected the closest CIMIS station, select “Save”. The information supplied by the station will be responsible for
populating the data sets found on the top-right and bottom-right sections of a farm’s homepage.
2. Google Earth Interactive Display -This section of the screen provides with an interactive Google Earth display where a client can view a highlighted area of where his or her farm is located. Furthermore, the user has the ability to navigate through the globe to view a location or set of locations.
FIGURE 2.7: GOOGLE EARTH INTERACTIVE FARM LOCATION
a. Display Features -Within the Google Interactive display there are several ways to manipulate how a location’s image appears within the map. Instructions on how to use each feature of the simulation can be found below:
Instructions Manual Agriensensors.net
Page 15 Dynamax, Inc.
i. Satellite -Within the interactive globe, the top-right section contains a very small icon bar that has two options, “Satellite” and “Map”. By selecting the “Satellite” option, one will change the display of the globe to show terrain.
FIGURE 2.8: SATELLITE FEATURE ii. Map -The next option located within this taskbar allows the client to view a location without the interference of terrain. This option is helpful when the user must have the ability to easily identify roads, cities, bodies of water, and distances.
FIGURE 2.9: MAP FEATURE
iii. Zoom -The last feature located within the display is located on the top left section of the screen. This option allows the user to see a location closer or farther away. This enables one to see more accurate images of a desired location.
FIGURE 2.10: ZOOM FEATURE iv. First Person View -The last feature of the Google Earth Interactive Display is the ability for a first person zoom. This function allows the user to zoom to a first person, street-level viewpoint of a road or intersection of the client’s choice. On the map, there will be a figure of a man right above the zoom option, illustrated below.
FIGURE 2.11: STREET LEVEL ZOOM ICON
Zoom-out
Zoom-in
Instructions Manual Agriensensors.net
Page 16 Dynamax, Inc.
• View a Location in First Person o First, zoom to the location of one’s choice using the method presented in
section 4. o Left-click the icon of the man. This icon can be clicked and dragged to the
location of one’s choice. o Drag the man to the location one wishes to see in a first person format.
FIGURE 2.12: STREET LEVEL ZOOM LOCATION
Note: Once will notice how the street of choice will become illuminated in blue, and the icon of the man that is being clicked and dragged will have a green zone illuminated below him (illustrated below). This illuminated zone shows the client where exactly one will be moved to once the man is placed in accordance with where the customer wishes to see.
o Let the mouse button go and you will be zoomed in to a first person view. An
example is illustrated below.
FIGURE 2.13: STREET LEVEL ZOOM EXAMPLE
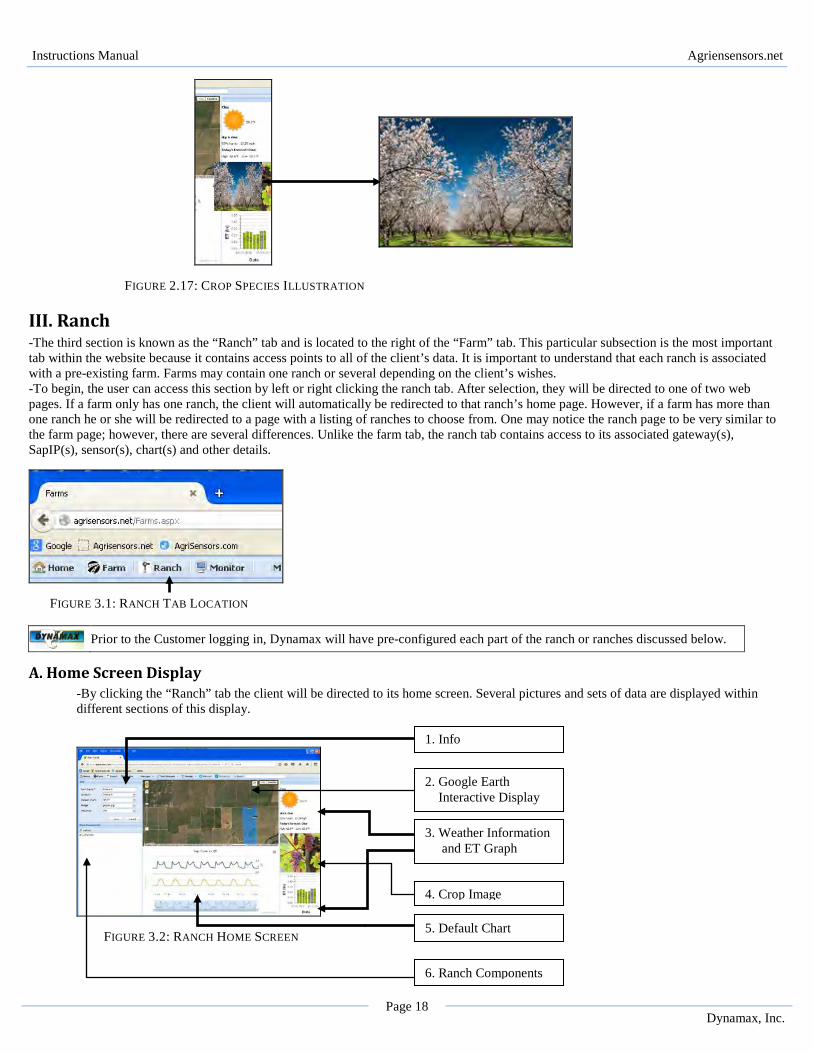
3. Default Chart -The section is located under the Google Earth interactive display. Here the client will notice a default chart that will appear. This provides an easier and more efficient way of viewing weather and/or crop data that is important. One can scroll through the data with their mouse, and identify the variables that are charted by simply scrolling over the column or spline. Furthermore, highlighting a selected portion of the chart will zoom-in on the data making it easier to view and analyze.
Once highlighted on a section of the graph, a scroll-bar illustrated below the graph allows the user to move the highlighted timespan to a new day which he or she can view in detail.
The address to where the client is zoomed will be shown here.
The orientation of a person’s direction will be shown here.
Instructions Manual Agriensensors.net
Page 17 Dynamax, Inc.
FIGURE 2.14: DEFAULT CHART EXAMPLE
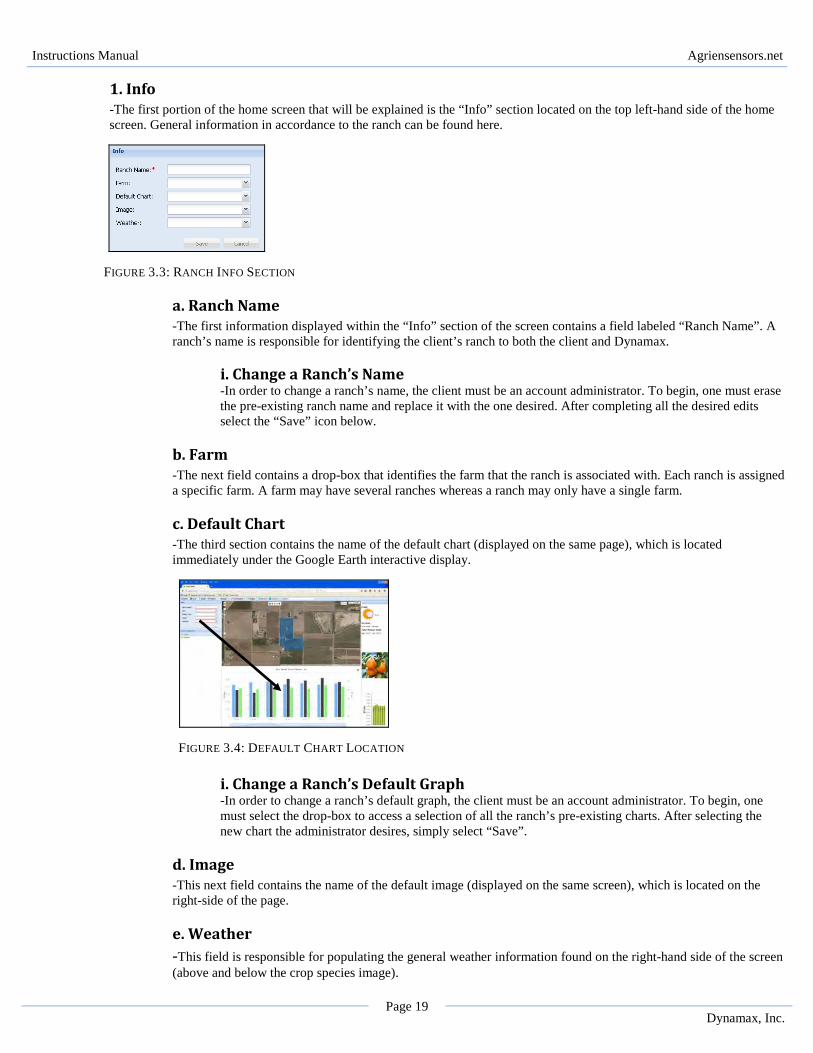
4. Weather Information and ET Graph -On the far right of the farm’s home screen are three sections. On the top-right, general weather information can be found regarding the farm’s ranch with respect to its location. Right below that, is a picture of the crop species that’s being observed and/or studied. Lastly, a column chart will be observed that graphs the evaporation transpiration vs. date data set below.
FIGURE 2.15: WEATHER AND ET GRAPH
5. Farm Components -Below the info section, another box containing a hierarchy tree can be observed. A hierarchy tree is a set of folders that can be expanded to see all possible destinations, which upon clicking can be used as an alternate means of arriving at one’s final destination. Furthermore, one may notice this set of folders is much like the hierarchy option found within the “Home” tab; however, this tree only lists the list of ranches and their respective gateways.
FIGURE 2.16: FARM COMPONENTS DROP-DOWN MENU
6. Crop Species Image -This picture illustrates the chosen crop species chosen by the drop-down menu found within the info section (discussed above). This image is displayed on the farm’s home screen and will illustrate the crop species being grown.
At this time, Dynamax will supply any location with a weather station at a much lower cost than CIMIS, with more accurate data.
These sections (described above) will illustrate general weather conditions at the farm’s location (humidity, wind speed, as well as high and low temperatures). Also, an ET graph will be displayed below illustrating a column graph of evaporation transpiration versus the date.
NOTE: In the future, users (non-California residents) will be able to access information found by local weather stations much like CIMIS.
Instructions Manual Agriensensors.net
Page 18 Dynamax, Inc.
FIGURE 2.17: CROP SPECIES ILLUSTRATION
III. Ranch -The third section is known as the “Ranch” tab and is located to the right of the “Farm” tab. This particular subsection is the most important tab within the website because it contains access points to all of the client’s data. It is important to understand that each ranch is associated with a pre-existing farm. Farms may contain one ranch or several depending on the client’s wishes. -To begin, the user can access this section by left or right clicking the ranch tab. After selection, they will be directed to one of two web pages. If a farm only has one ranch, the client will automatically be redirected to that ranch’s home page. However, if a farm has more than one ranch he or she will be redirected to a page with a listing of ranches to choose from. One may notice the ranch page to be very similar to the farm page; however, there are several differences. Unlike the farm tab, the ranch tab contains access to its associated gateway(s), SapIP(s), sensor(s), chart(s) and other details.
FIGURE 3.1: RANCH TAB LOCATION
A. Home Screen Display -By clicking the “Ranch” tab the client will be directed to its home screen. Several pictures and sets of data are displayed within different sections of this display.
FIGURE 3.2: RANCH HOME SCREEN
Prior to the Customer logging in, Dynamax will have pre-configured each part of the ranch or ranches discussed below.
2. Google Earth Interactive Display
1. Info
3. Weather Information and ET Graph
4. Crop Image
5. Default Chart
6. Ranch Components
Instructions Manual Agriensensors.net
Page 19 Dynamax, Inc.
1. Info -The first portion of the home screen that will be explained is the “Info” section located on the top left-hand side of the home screen. General information in accordance to the ranch can be found here.
FIGURE 3.3: RANCH INFO SECTION
a. Ranch Name -The first information displayed within the “Info” section of the screen contains a field labeled “Ranch Name”. A ranch’s name is responsible for identifying the client’s ranch to both the client and Dynamax.
i. Change a Ranch’s Name -In order to change a ranch’s name, the client must be an account administrator. To begin, one must erase the pre-existing ranch name and replace it with the one desired. After completing all the desired edits select the “Save” icon below.
b. Farm -The next field contains a drop-box that identifies the farm that the ranch is associated with. Each ranch is assigned a specific farm. A farm may have several ranches whereas a ranch may only have a single farm.
c. Default Chart -The third section contains the name of the default chart (displayed on the same page), which is located immediately under the Google Earth interactive display.
FIGURE 3.4: DEFAULT CHART LOCATION
i. Change a Ranch’s Default Graph -In order to change a ranch’s default graph, the client must be an account administrator. To begin, one must select the drop-box to access a selection of all the ranch’s pre-existing charts. After selecting the new chart the administrator desires, simply select “Save”.
d. Image -This next field contains the name of the default image (displayed on the same screen), which is located on the right-side of the page.
e. Weather -This field is responsible for populating the general weather information found on the right-hand side of the screen (above and below the crop species image).
Instructions Manual Agriensensors.net
Page 20 Dynamax, Inc.
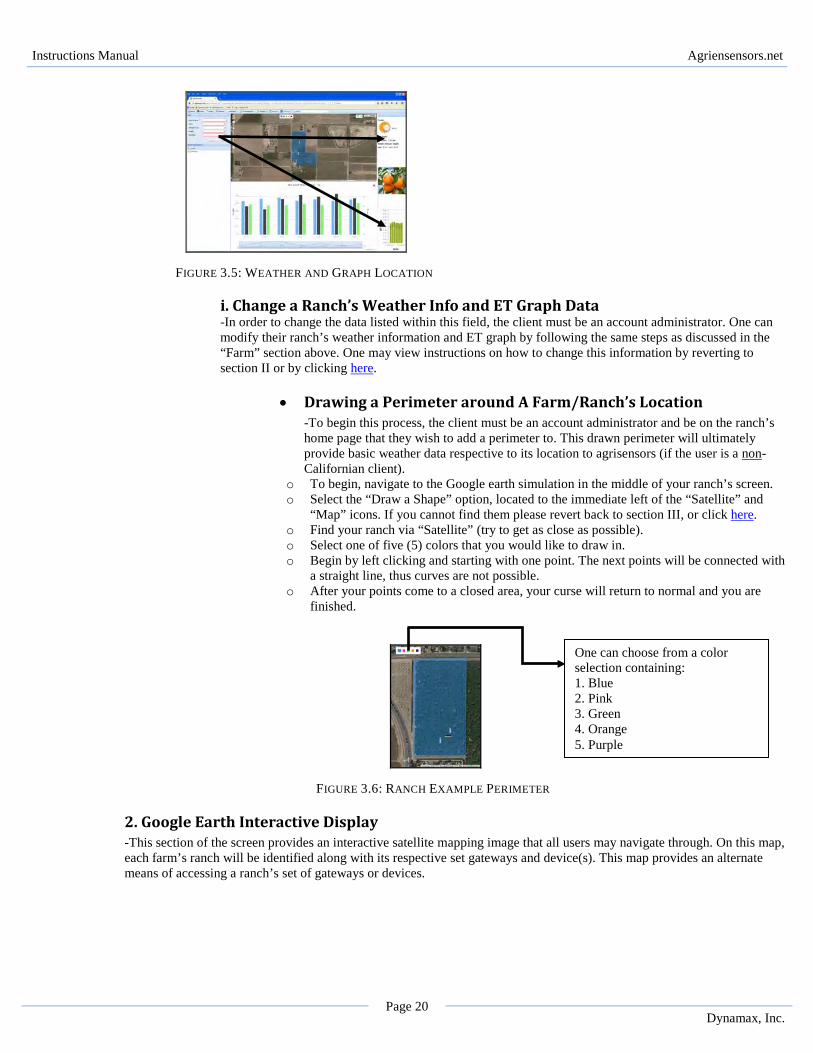
FIGURE 3.5: WEATHER AND GRAPH LOCATION
i. Change a Ranch’s Weather Info and ET Graph Data -In order to change the data listed within this field, the client must be an account administrator. One can modify their ranch’s weather information and ET graph by following the same steps as discussed in the “Farm” section above. One may view instructions on how to change this information by reverting to section II or by clicking here.
• Drawing a Perimeter around A Farm/Ranch’s Location -To begin this process, the client must be an account administrator and be on the ranch’s home page that they wish to add a perimeter to. This drawn perimeter will ultimately provide basic weather data respective to its location to agrisensors (if the user is a non-Californian client).
o To begin, navigate to the Google earth simulation in the middle of your ranch’s screen. o Select the “Draw a Shape” option, located to the immediate left of the “Satellite” and
“Map” icons. If you cannot find them please revert back to section III, or click here. o Find your ranch via “Satellite” (try to get as close as possible). o Select one of five (5) colors that you would like to draw in. o Begin by left clicking and starting with one point. The next points will be connected with
a straight line, thus curves are not possible. o After your points come to a closed area, your curse will return to normal and you are
finished.
FIGURE 3.6: RANCH EXAMPLE PERIMETER
2. Google Earth Interactive Display -This section of the screen provides an interactive satellite mapping image that all users may navigate through. On this map, each farm’s ranch will be identified along with its respective set gateways and device(s). This map provides an alternate means of accessing a ranch’s set of gateways or devices.
One can choose from a color selection containing: 1. Blue 2. Pink 3. Green 4. Orange 5. Purple
Instructions Manual Agriensensors.net
Page 21 Dynamax, Inc.
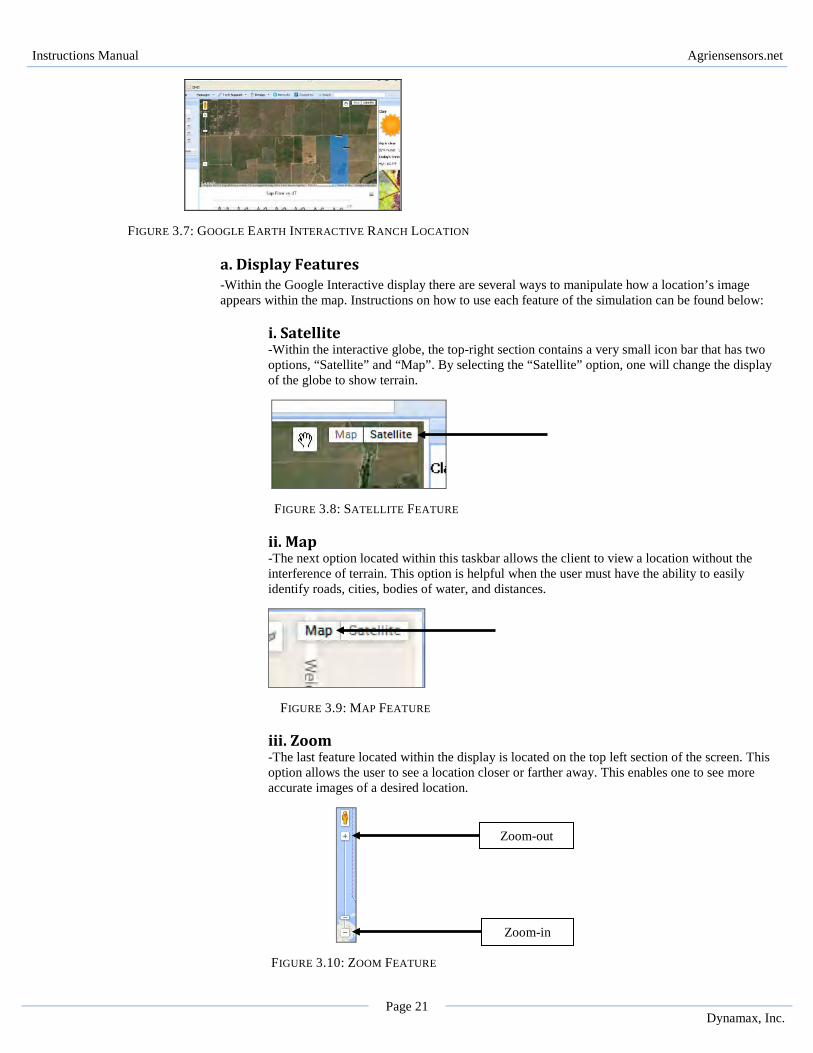
FIGURE 3.7: GOOGLE EARTH INTERACTIVE RANCH LOCATION
a. Display Features -Within the Google Interactive display there are several ways to manipulate how a location’s image appears within the map. Instructions on how to use each feature of the simulation can be found below:
i. Satellite -Within the interactive globe, the top-right section contains a very small icon bar that has two options, “Satellite” and “Map”. By selecting the “Satellite” option, one will change the display of the globe to show terrain.
FIGURE 3.8: SATELLITE FEATURE ii. Map -The next option located within this taskbar allows the client to view a location without the interference of terrain. This option is helpful when the user must have the ability to easily identify roads, cities, bodies of water, and distances.
FIGURE 3.9: MAP FEATURE
iii. Zoom -The last feature located within the display is located on the top left section of the screen. This option allows the user to see a location closer or farther away. This enables one to see more accurate images of a desired location.
FIGURE 3.10: ZOOM FEATURE
Zoom-out
Zoom-in
Instructions Manual Agriensensors.net
Page 22 Dynamax, Inc.
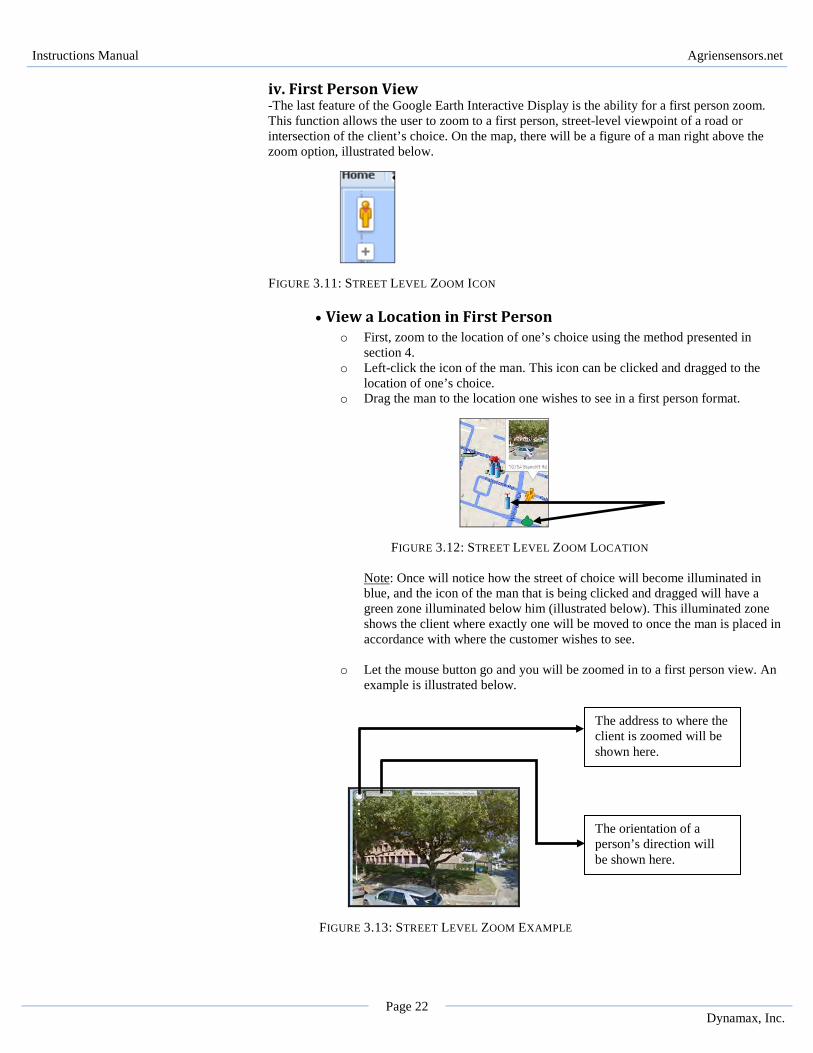
iv. First Person View -The last feature of the Google Earth Interactive Display is the ability for a first person zoom. This function allows the user to zoom to a first person, street-level viewpoint of a road or intersection of the client’s choice. On the map, there will be a figure of a man right above the zoom option, illustrated below.
FIGURE 3.11: STREET LEVEL ZOOM ICON
• View a Location in First Person o First, zoom to the location of one’s choice using the method presented in
section 4. o Left-click the icon of the man. This icon can be clicked and dragged to the
location of one’s choice. o Drag the man to the location one wishes to see in a first person format.
FIGURE 3.12: STREET LEVEL ZOOM LOCATION
Note: Once will notice how the street of choice will become illuminated in blue, and the icon of the man that is being clicked and dragged will have a green zone illuminated below him (illustrated below). This illuminated zone shows the client where exactly one will be moved to once the man is placed in accordance with where the customer wishes to see.
o Let the mouse button go and you will be zoomed in to a first person view. An
example is illustrated below.
FIGURE 3.13: STREET LEVEL ZOOM EXAMPLE
The address to where the client is zoomed will be shown here.
The orientation of a person’s direction will be shown here.
Instructions Manual Agriensensors.net
Page 23 Dynamax, Inc.
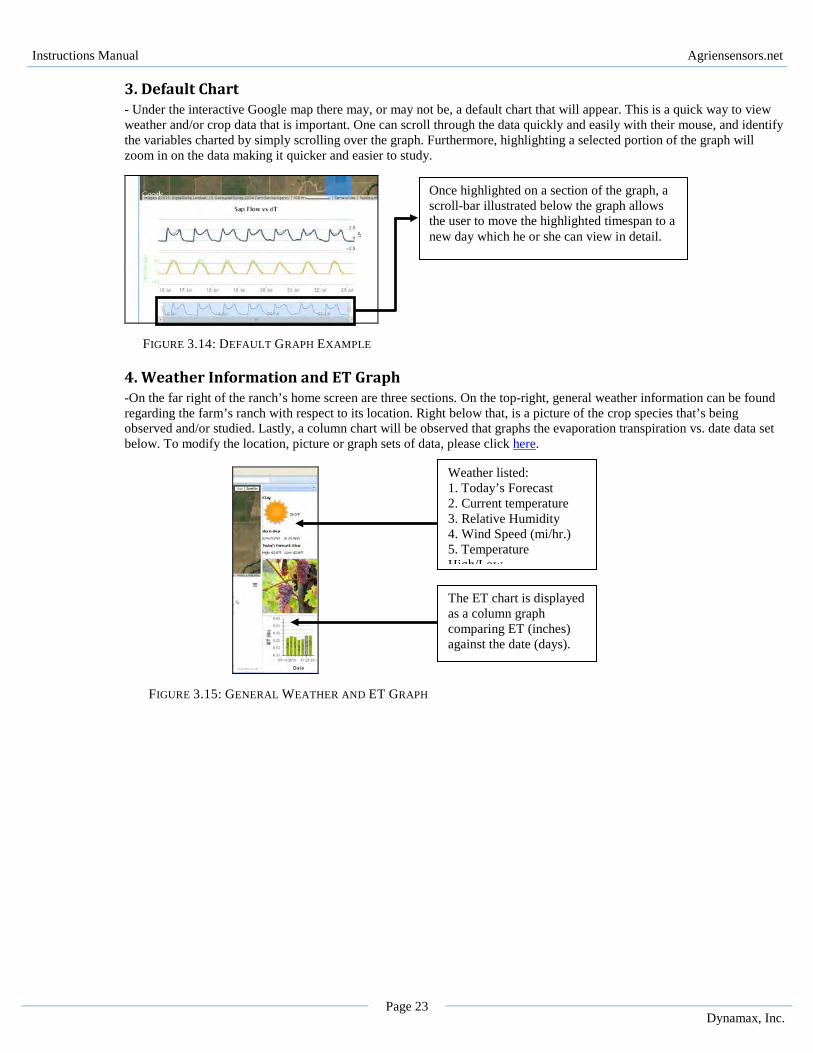
3. Default Chart - Under the interactive Google map there may, or may not be, a default chart that will appear. This is a quick way to view weather and/or crop data that is important. One can scroll through the data quickly and easily with their mouse, and identify the variables charted by simply scrolling over the graph. Furthermore, highlighting a selected portion of the graph will zoom in on the data making it quicker and easier to study.
FIGURE 3.14: DEFAULT GRAPH EXAMPLE
4. Weather Information and ET Graph -On the far right of the ranch’s home screen are three sections. On the top-right, general weather information can be found regarding the farm’s ranch with respect to its location. Right below that, is a picture of the crop species that’s being observed and/or studied. Lastly, a column chart will be observed that graphs the evaporation transpiration vs. date data set below. To modify the location, picture or graph sets of data, please click here.
FIGURE 3.15: GENERAL WEATHER AND ET GRAPH
Weather listed: 1. Today’s Forecast 2. Current temperature 3. Relative Humidity 4. Wind Speed (mi/hr.) 5. Temperature High/Low The ET chart is displayed as a column graph comparing ET (inches) against the date (days).
Once highlighted on a section of the graph, a scroll-bar illustrated below the graph allows the user to move the highlighted timespan to a new day which he or she can view in detail.
Instructions Manual Agriensensors.net
Page 24 Dynamax, Inc.
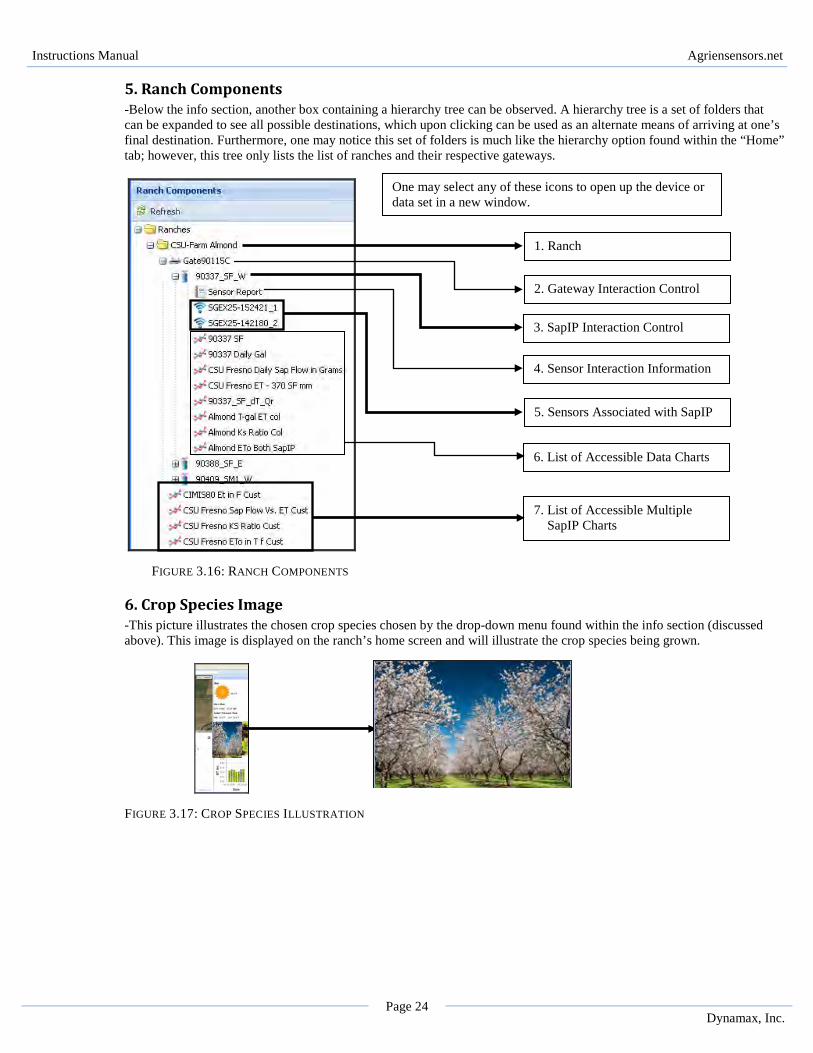
5. Ranch Components -Below the info section, another box containing a hierarchy tree can be observed. A hierarchy tree is a set of folders that can be expanded to see all possible destinations, which upon clicking can be used as an alternate means of arriving at one’s final destination. Furthermore, one may notice this set of folders is much like the hierarchy option found within the “Home” tab; however, this tree only lists the list of ranches and their respective gateways.
FIGURE 3.16: RANCH COMPONENTS
6. Crop Species Image -This picture illustrates the chosen crop species chosen by the drop-down menu found within the info section (discussed above). This image is displayed on the ranch’s home screen and will illustrate the crop species being grown.
FIGURE 3.17: CROP SPECIES ILLUSTRATION
One may select any of these icons to open up the device or data set in a new window.
1. Ranch
2. Gateway Interaction Control
4. Sensor Interaction Information
3. SapIP Interaction Control
5. Sensors Associated with SapIP
6. List of Accessible Data Charts
7. List of Accessible Multiple SapIP Charts
Instructions Manual Agriensensors.net
Page 25 Dynamax, Inc.
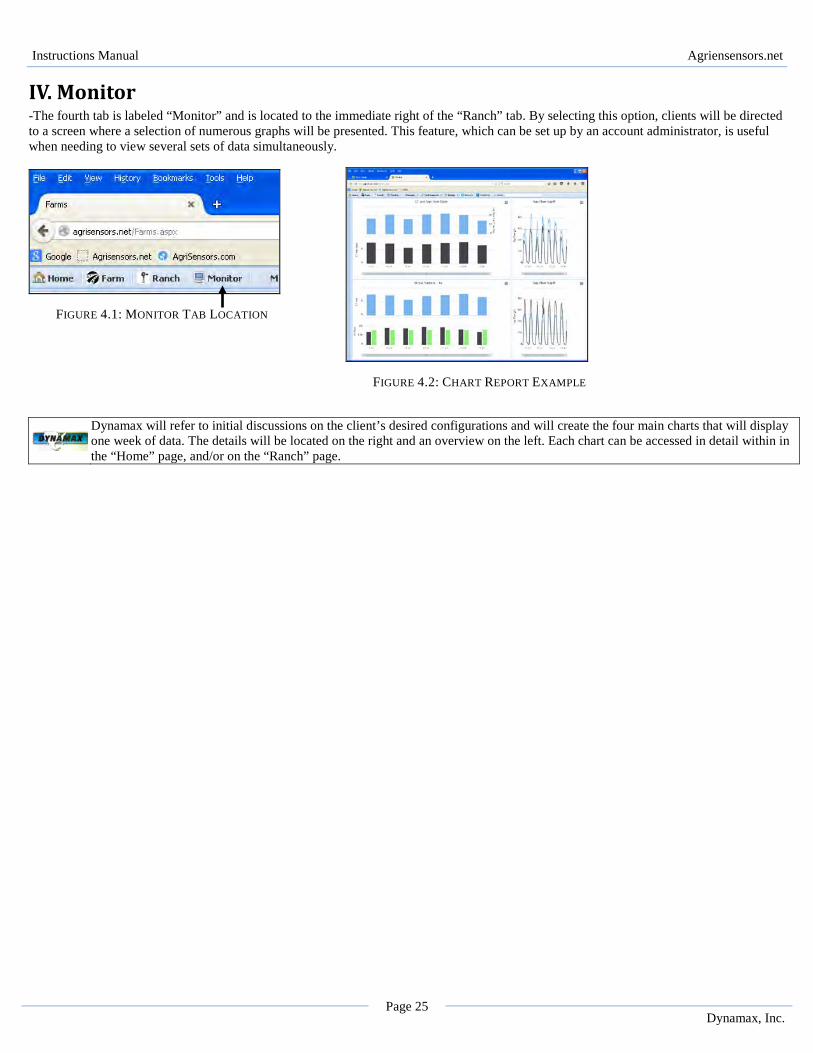
IV. Monitor -The fourth tab is labeled “Monitor” and is located to the immediate right of the “Ranch” tab. By selecting this option, clients will be directed to a screen where a selection of numerous graphs will be presented. This feature, which can be set up by an account administrator, is useful when needing to view several sets of data simultaneously.
FIGURE 4.1: MONITOR TAB LOCATION
Dynamax will refer to initial discussions on the client’s desired configurations and will create the four main charts that will display one week of data. The details will be located on the right and an overview on the left. Each chart can be accessed in detail within in the “Home” page, and/or on the “Ranch” page.
FIGURE 4.2: CHART REPORT EXAMPLE
Instructions Manual Agriensensors.net
Page 26 Dynamax, Inc.
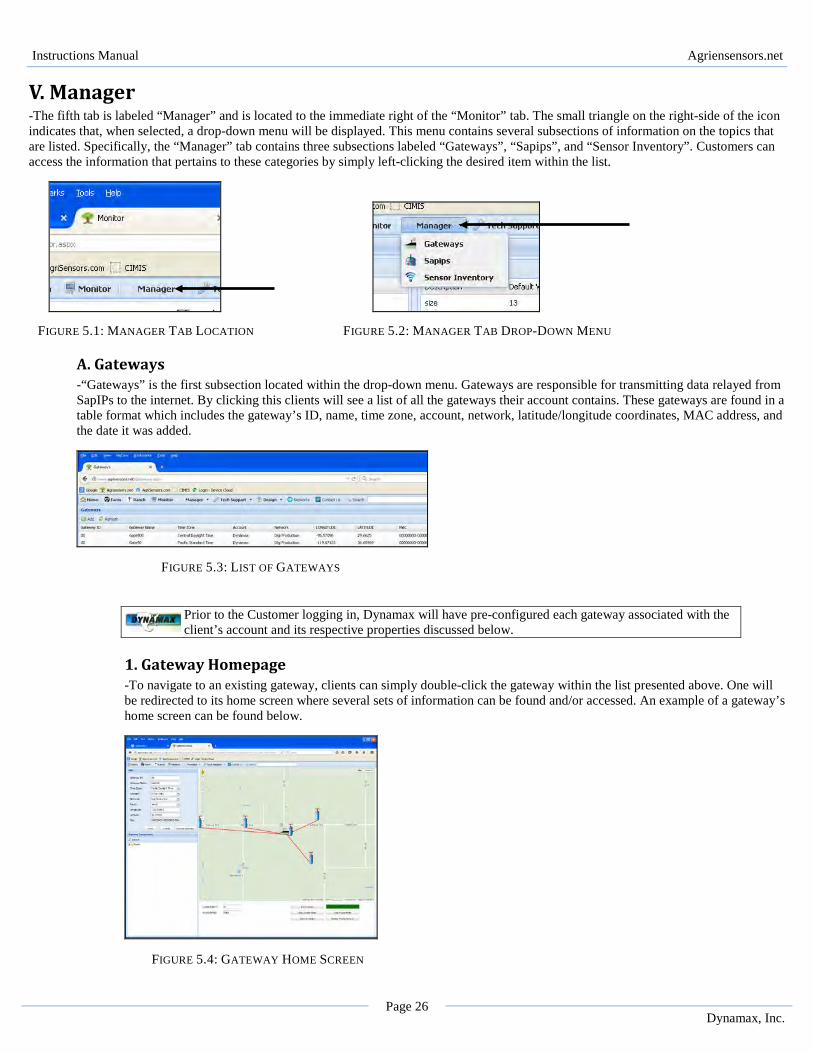
V. Manager -The fifth tab is labeled “Manager” and is located to the immediate right of the “Monitor” tab. The small triangle on the right-side of the icon indicates that, when selected, a drop-down menu will be displayed. This menu contains several subsections of information on the topics that are listed. Specifically, the “Manager” tab contains three subsections labeled “Gateways”, “Sapips”, and “Sensor Inventory”. Customers can access the information that pertains to these categories by simply left-clicking the desired item within the list.
FIGURE 5.1: MANAGER TAB LOCATION FIGURE 5.2: MANAGER TAB DROP-DOWN MENU
A. Gateways -“Gateways” is the first subsection located within the drop-down menu. Gateways are responsible for transmitting data relayed from SapIPs to the internet. By clicking this clients will see a list of all the gateways their account contains. These gateways are found in a table format which includes the gateway’s ID, name, time zone, account, network, latitude/longitude coordinates, MAC address, and the date it was added.
FIGURE 5.3: LIST OF GATEWAYS
1. Gateway Homepage -To navigate to an existing gateway, clients can simply double-click the gateway within the list presented above. One will be redirected to its home screen where several sets of information can be found and/or accessed. An example of a gateway’s home screen can be found below.
FIGURE 5.4: GATEWAY HOME SCREEN
Prior to the Customer logging in, Dynamax will have pre-configured each gateway associated with the client’s account and its respective properties discussed below.
Instructions Manual Agriensensors.net
Page 27 Dynamax, Inc.
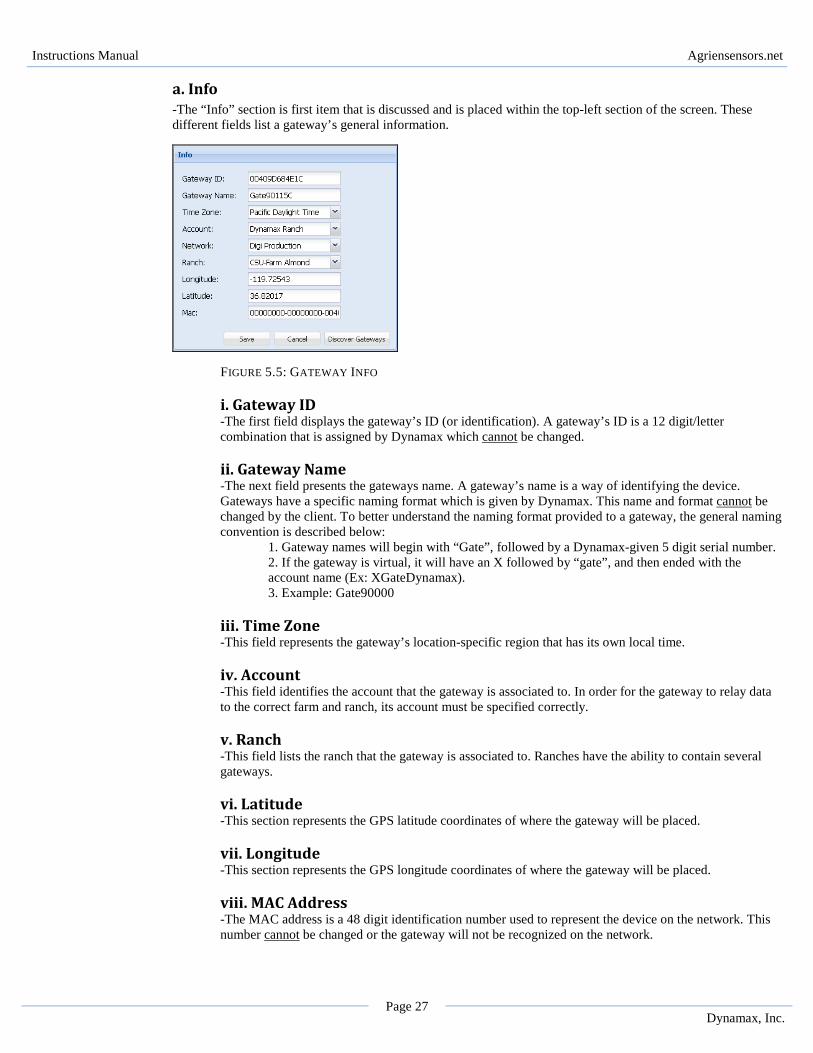
a. Info -The “Info” section is first item that is discussed and is placed within the top-left section of the screen. These different fields list a gateway’s general information.
FIGURE 5.5: GATEWAY INFO
i. Gateway ID -The first field displays the gateway’s ID (or identification). A gateway’s ID is a 12 digit/letter combination that is assigned by Dynamax which cannot be changed. ii. Gateway Name -The next field presents the gateways name. A gateway’s name is a way of identifying the device. Gateways have a specific naming format which is given by Dynamax. This name and format cannot be changed by the client. To better understand the naming format provided to a gateway, the general naming convention is described below: 1. Gateway names will begin with “Gate”, followed by a Dynamax-given 5 digit serial number.
2. If the gateway is virtual, it will have an X followed by “gate”, and then ended with the account name (Ex: XGateDynamax). 3. Example: Gate90000
iii. Time Zone -This field represents the gateway’s location-specific region that has its own local time. iv. Account -This field identifies the account that the gateway is associated to. In order for the gateway to relay data to the correct farm and ranch, its account must be specified correctly. v. Ranch -This field lists the ranch that the gateway is associated to. Ranches have the ability to contain several gateways. vi. Latitude -This section represents the GPS latitude coordinates of where the gateway will be placed. vii. Longitude -This section represents the GPS longitude coordinates of where the gateway will be placed. viii. MAC Address -The MAC address is a 48 digit identification number used to represent the device on the network. This number cannot be changed or the gateway will not be recognized on the network.
Instructions Manual Agriensensors.net
Page 28 Dynamax, Inc.
ix. Discover Gateways -This feature is a box located to the right of the “Save” and “Cancel” buttons under the information presented above. This button is only important when configuring a new gateway. To forward to this information, click here.
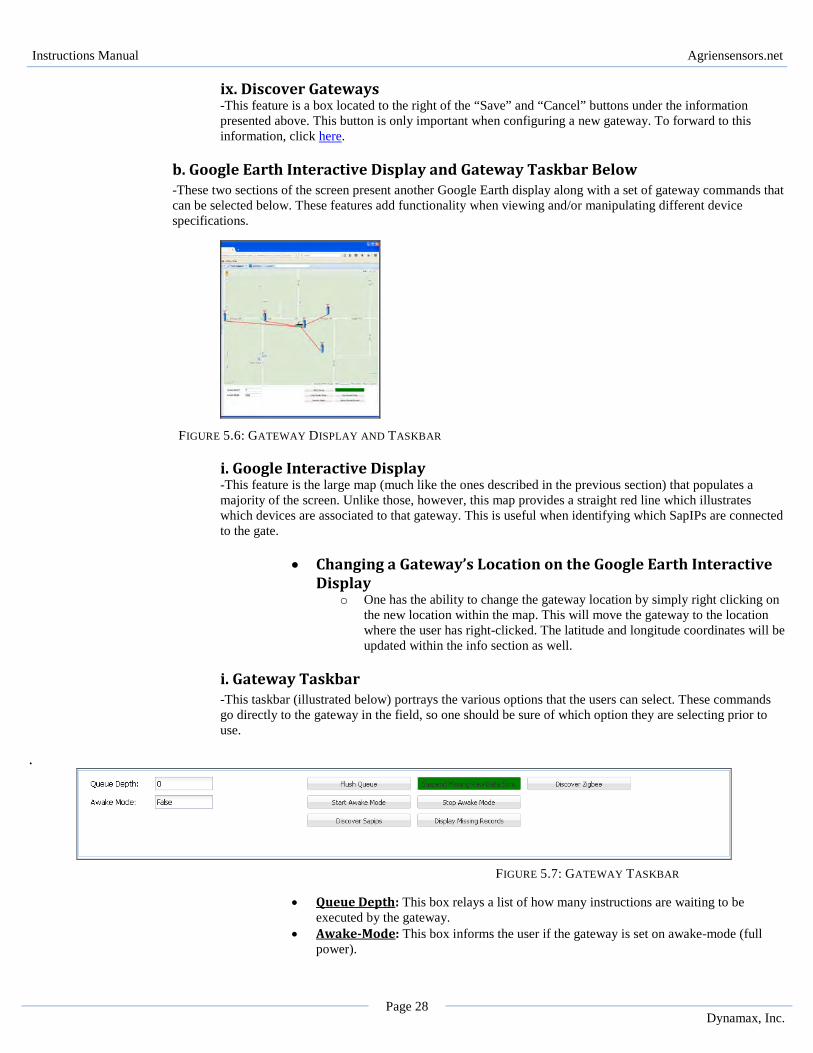
b. Google Earth Interactive Display and Gateway Taskbar Below -These two sections of the screen present another Google Earth display along with a set of gateway commands that can be selected below. These features add functionality when viewing and/or manipulating different device specifications.
FIGURE 5.6: GATEWAY DISPLAY AND TASKBAR
i. Google Interactive Display -This feature is the large map (much like the ones described in the previous section) that populates a majority of the screen. Unlike those, however, this map provides a straight red line which illustrates which devices are associated to that gateway. This is useful when identifying which SapIPs are connected to the gate.
• Changing a Gateway’s Location on the Google Earth Interactive Display
o One has the ability to change the gateway location by simply right clicking on the new location within the map. This will move the gateway to the location where the user has right-clicked. The latitude and longitude coordinates will be updated within the info section as well.
i. Gateway Taskbar -This taskbar (illustrated below) portrays the various options that the users can select. These commands go directly to the gateway in the field, so one should be sure of which option they are selecting prior to use.
.
FIGURE 5.7: GATEWAY TASKBAR
• Queue Depth: This box relays a list of how many instructions are waiting to be executed by the gateway.
• Awake-Mode: This box informs the user if the gateway is set on awake-mode (full power).
Instructions Manual Agriensensors.net
Page 29 Dynamax, Inc.
• Flush Queue: This button allows the user to erase all instructions that are waiting to be executed.
• Stop Awake-Mode: This button allows the user to set the device on low-power mode. • Discover RF Nodes: This button will identify all devices able to communicate with
the gateway. • Display Missing Records: This button will show any records that were not recorded
or did not transmit correctly. • Discover Zigbee: This button tests to see if the gateway is communicating with any
SapIP’s on an RF level.
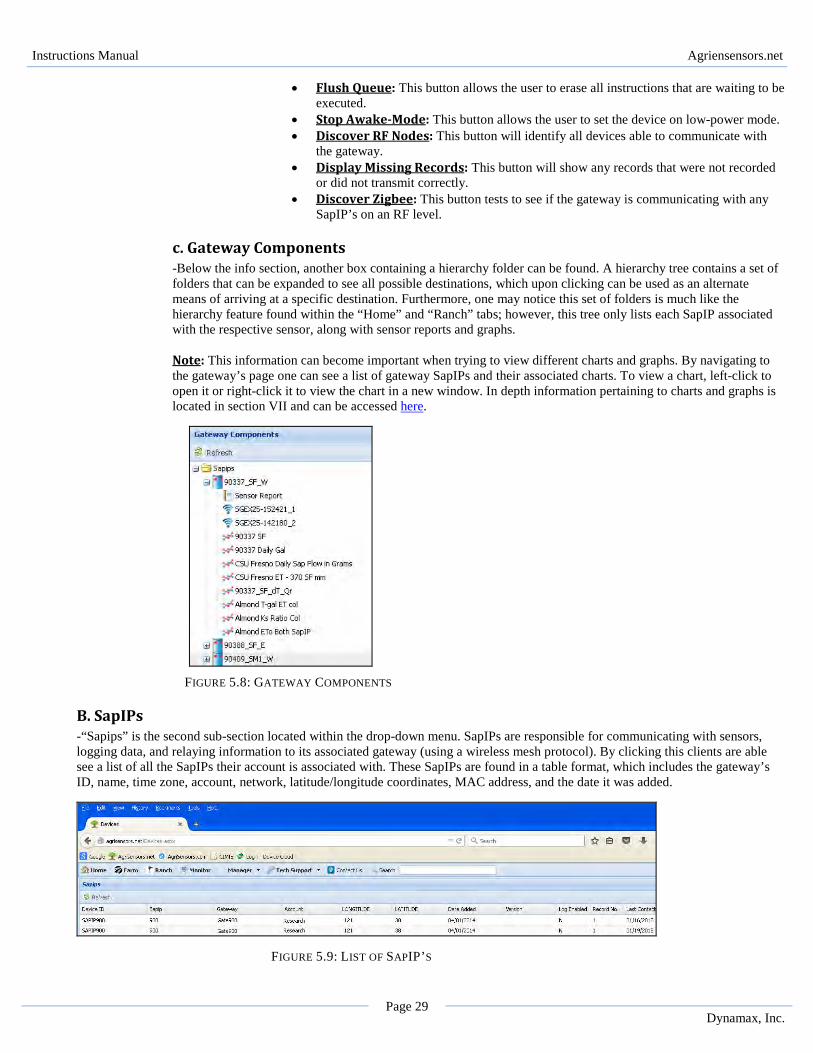
c. Gateway Components -Below the info section, another box containing a hierarchy folder can be found. A hierarchy tree contains a set of folders that can be expanded to see all possible destinations, which upon clicking can be used as an alternate means of arriving at a specific destination. Furthermore, one may notice this set of folders is much like the hierarchy feature found within the “Home” and “Ranch” tabs; however, this tree only lists each SapIP associated with the respective sensor, along with sensor reports and graphs. Note: This information can become important when trying to view different charts and graphs. By navigating to the gateway’s page one can see a list of gateway SapIPs and their associated charts. To view a chart, left-click to open it or right-click it to view the chart in a new window. In depth information pertaining to charts and graphs is located in section VII and can be accessed here.
FIGURE 5.8: GATEWAY COMPONENTS
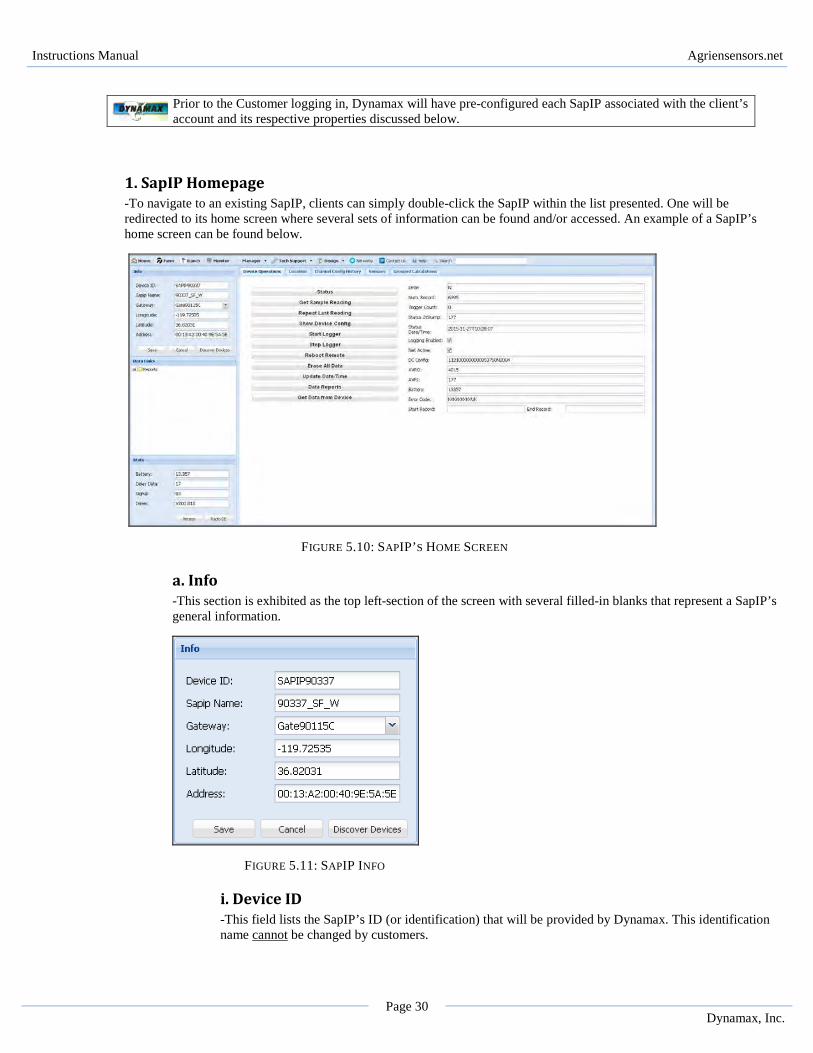
B. SapIPs -“Sapips” is the second sub-section located within the drop-down menu. SapIPs are responsible for communicating with sensors, logging data, and relaying information to its associated gateway (using a wireless mesh protocol). By clicking this clients are able see a list of all the SapIPs their account is associated with. These SapIPs are found in a table format, which includes the gateway’s ID, name, time zone, account, network, latitude/longitude coordinates, MAC address, and the date it was added.
FIGURE 5.9: LIST OF SAPIP’S
Instructions Manual Agriensensors.net
Page 30 Dynamax, Inc.
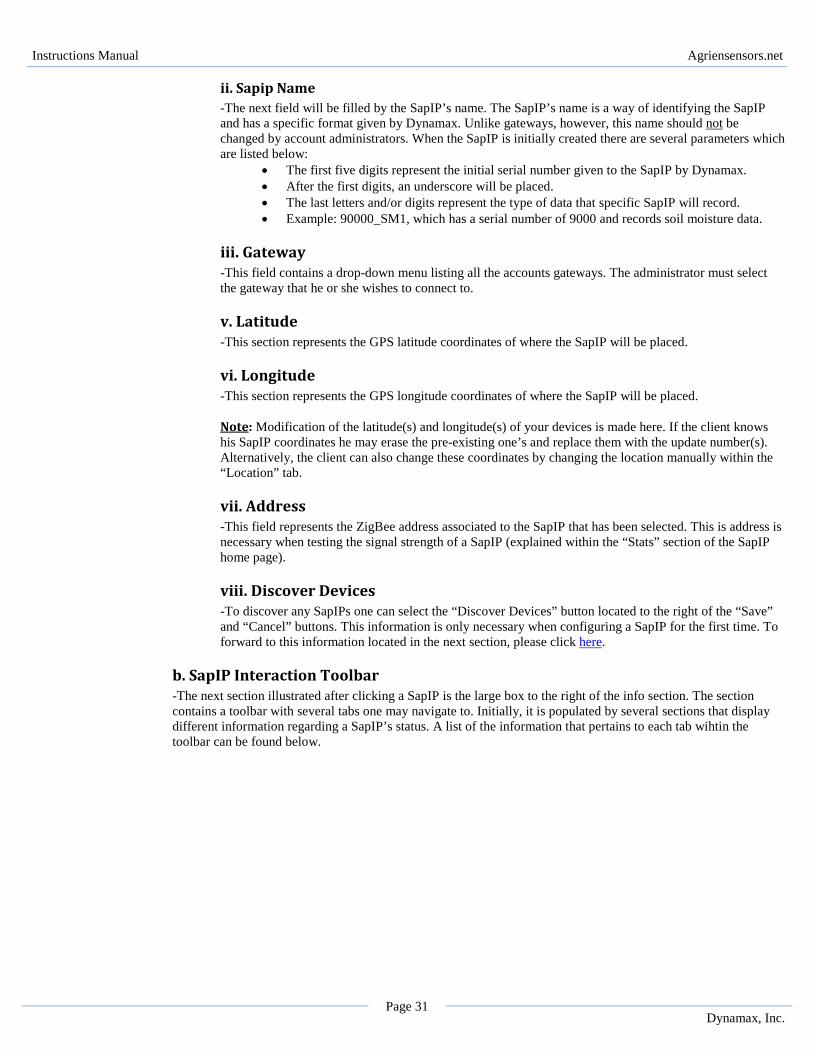
1. SapIP Homepage -To navigate to an existing SapIP, clients can simply double-click the SapIP within the list presented. One will be redirected to its home screen where several sets of information can be found and/or accessed. An example of a SapIP’s home screen can be found below.
FIGURE 5.10: SAPIP’S HOME SCREEN
a. Info -This section is exhibited as the top left-section of the screen with several filled-in blanks that represent a SapIP’s general information.
FIGURE 5.11: SAPIP INFO
i. Device ID -This field lists the SapIP’s ID (or identification) that will be provided by Dynamax. This identification name cannot be changed by customers.
Prior to the Customer logging in, Dynamax will have pre-configured each SapIP associated with the client’s account and its respective properties discussed below.
Instructions Manual Agriensensors.net
Page 31 Dynamax, Inc.
ii. Sapip Name -The next field will be filled by the SapIP’s name. The SapIP’s name is a way of identifying the SapIP and has a specific format given by Dynamax. Unlike gateways, however, this name should not be changed by account administrators. When the SapIP is initially created there are several parameters which are listed below:
• The first five digits represent the initial serial number given to the SapIP by Dynamax. • After the first digits, an underscore will be placed. • The last letters and/or digits represent the type of data that specific SapIP will record. • Example: 90000_SM1, which has a serial number of 9000 and records soil moisture data.
iii. Gateway -This field contains a drop-down menu listing all the accounts gateways. The administrator must select the gateway that he or she wishes to connect to.
v. Latitude -This section represents the GPS latitude coordinates of where the SapIP will be placed.
vi. Longitude -This section represents the GPS longitude coordinates of where the SapIP will be placed. Note: Modification of the latitude(s) and longitude(s) of your devices is made here. If the client knows his SapIP coordinates he may erase the pre-existing one’s and replace them with the update number(s). Alternatively, the client can also change these coordinates by changing the location manually within the “Location” tab.
vii. Address -This field represents the ZigBee address associated to the SapIP that has been selected. This is address is necessary when testing the signal strength of a SapIP (explained within the “Stats” section of the SapIP home page).
viii. Discover Devices -To discover any SapIPs one can select the “Discover Devices” button located to the right of the “Save” and “Cancel” buttons. This information is only necessary when configuring a SapIP for the first time. To forward to this information located in the next section, please click here.
b. SapIP Interaction Toolbar -The next section illustrated after clicking a SapIP is the large box to the right of the info section. The section contains a toolbar with several tabs one may navigate to. Initially, it is populated by several sections that display different information regarding a SapIP’s status. A list of the information that pertains to each tab wihtin the toolbar can be found below.
Instructions Manual Agriensensors.net
Page 32 Dynamax, Inc.
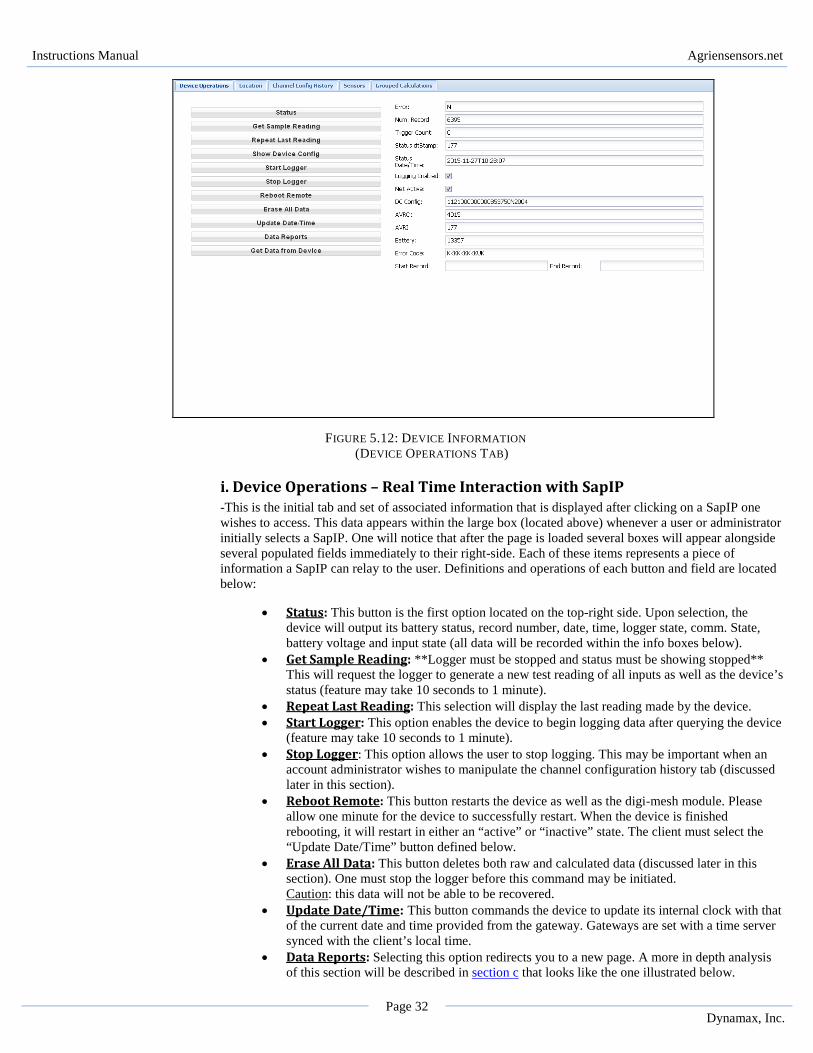
FIGURE 5.12: DEVICE INFORMATION (DEVICE OPERATIONS TAB)
i. Device Operations – Real Time Interaction with SapIP -This is the initial tab and set of associated information that is displayed after clicking on a SapIP one wishes to access. This data appears within the large box (located above) whenever a user or administrator initially selects a SapIP. One will notice that after the page is loaded several boxes will appear alongside several populated fields immediately to their right-side. Each of these items represents a piece of information a SapIP can relay to the user. Definitions and operations of each button and field are located below:
• Status: This button is the first option located on the top-right side. Upon selection, the device will output its battery status, record number, date, time, logger state, comm. State, battery voltage and input state (all data will be recorded within the info boxes below).
• Get Sample Reading: **Logger must be stopped and status must be showing stopped** This will request the logger to generate a new test reading of all inputs as well as the device’s status (feature may take 10 seconds to 1 minute).
• Repeat Last Reading: This selection will display the last reading made by the device. • Start Logger: This option enables the device to begin logging data after querying the device
(feature may take 10 seconds to 1 minute). • Stop Logger: This option allows the user to stop logging. This may be important when an
account administrator wishes to manipulate the channel configuration history tab (discussed later in this section).
• Reboot Remote: This button restarts the device as well as the digi-mesh module. Please allow one minute for the device to successfully restart. When the device is finished rebooting, it will restart in either an “active” or “inactive” state. The client must select the “Update Date/Time” button defined below.
• Erase All Data: This button deletes both raw and calculated data (discussed later in this section). One must stop the logger before this command may be initiated. Caution: this data will not be able to be recovered.
• Update Date/Time: This button commands the device to update its internal clock with that of the current date and time provided from the gateway. Gateways are set with a time server synced with the client’s local time.
• Data Reports: Selecting this option redirects you to a new page. A more in depth analysis of this section will be described in section c that looks like the one illustrated below.
Instructions Manual Agriensensors.net
Page 33 Dynamax, Inc.
• Get Data from Device: This selection allows the user to retrieve specific record numbers by placing a request in the gateways queue if they have not been reported or are missing.
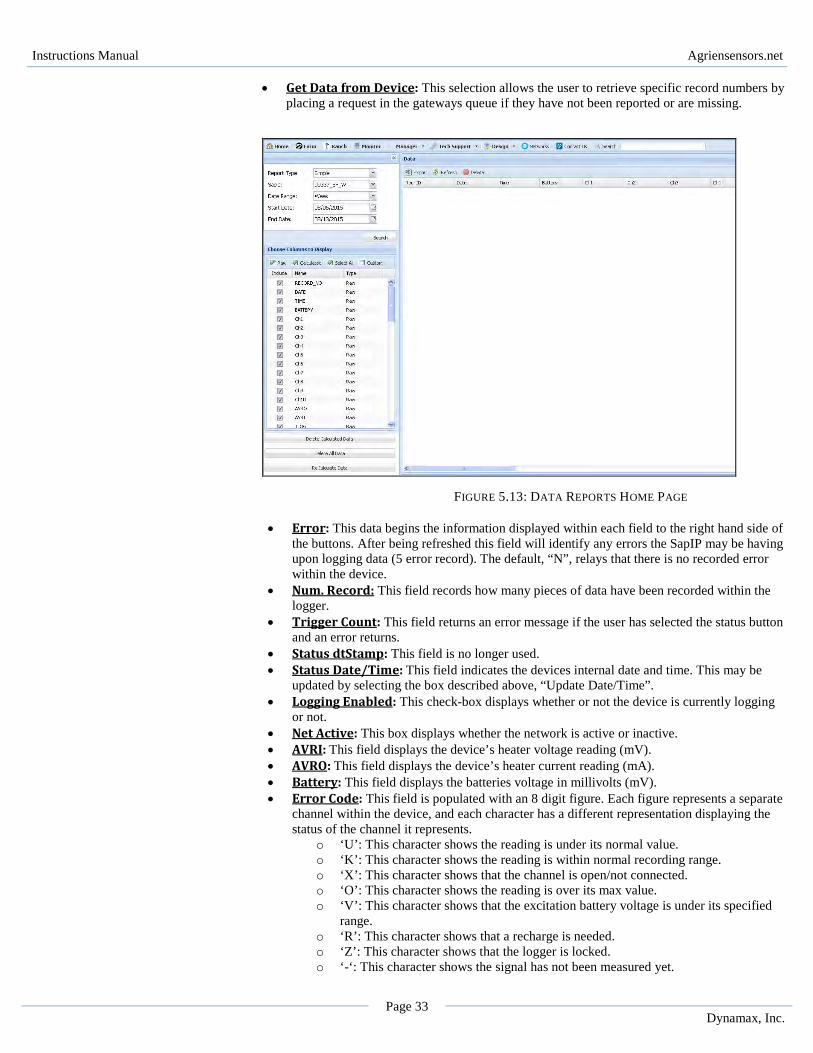
FIGURE 5.13: DATA REPORTS HOME PAGE
• Error: This data begins the information displayed within each field to the right hand side of the buttons. After being refreshed this field will identify any errors the SapIP may be having upon logging data (5 error record). The default, “N”, relays that there is no recorded error within the device.
• Num. Record: This field records how many pieces of data have been recorded within the logger.
• Trigger Count: This field returns an error message if the user has selected the status button and an error returns.
• Status dtStamp: This field is no longer used. • Status Date/Time: This field indicates the devices internal date and time. This may be
updated by selecting the box described above, “Update Date/Time”. • Logging Enabled: This check-box displays whether or not the device is currently logging
or not. • Net Active: This box displays whether the network is active or inactive. • AVRI: This field displays the device’s heater voltage reading (mV). • AVRO: This field displays the device’s heater current reading (mA). • Battery: This field displays the batteries voltage in millivolts (mV). • Error Code: This field is populated with an 8 digit figure. Each figure represents a separate
channel within the device, and each character has a different representation displaying the status of the channel it represents.
o ‘U’: This character shows the reading is under its normal value. o ‘K’: This character shows the reading is within normal recording range. o ‘X’: This character shows that the channel is open/not connected. o ‘O’: This character shows the reading is over its max value. o ‘V’: This character shows that the excitation battery voltage is under its specified
range. o ‘R’: This character shows that a recharge is needed. o ‘Z’: This character shows that the logger is locked. o ‘-‘: This character shows the signal has not been measured yet.
Instructions Manual Agriensensors.net
Page 34 Dynamax, Inc.
• Start Record/Stop Record: These are the fields where the user can place the beginning and ending of a set of records if they have are missing.
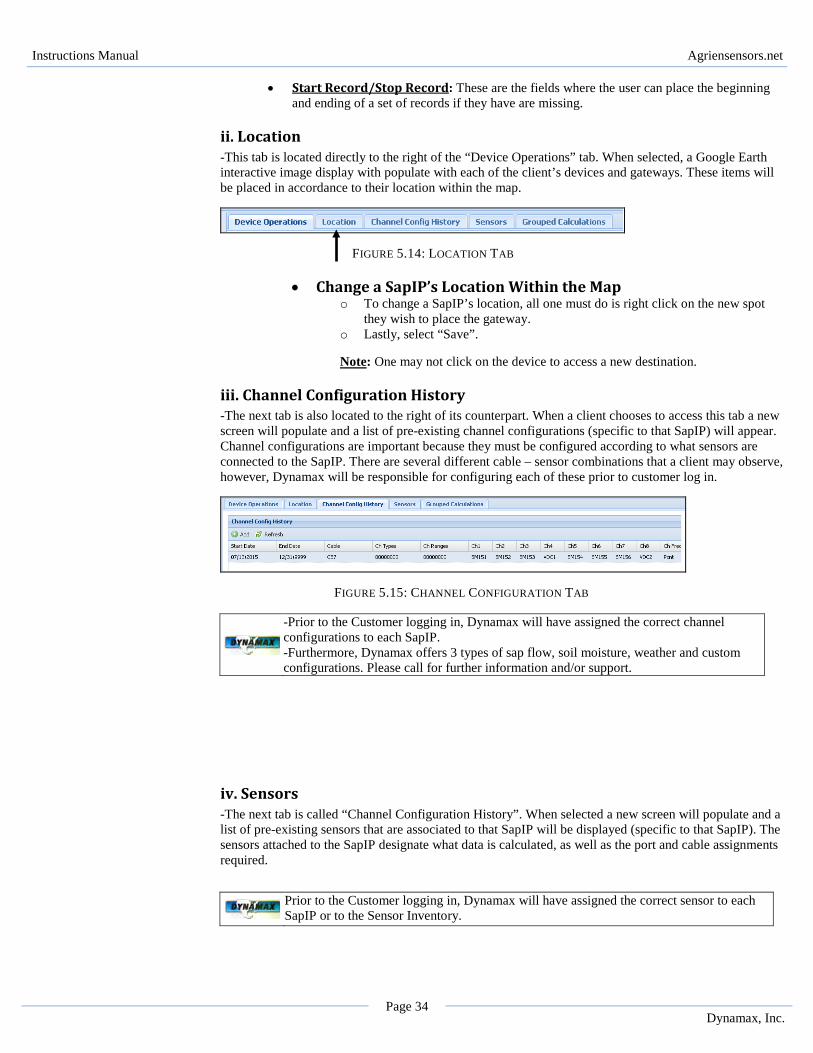
ii. Location -This tab is located directly to the right of the “Device Operations” tab. When selected, a Google Earth interactive image display with populate with each of the client’s devices and gateways. These items will be placed in accordance to their location within the map.
FIGURE 5.14: LOCATION TAB
• Change a SapIP’s Location Within the Map o To change a SapIP’s location, all one must do is right click on the new spot
they wish to place the gateway. o Lastly, select “Save”.
Note: One may not click on the device to access a new destination.
iii. Channel Configuration History -The next tab is also located to the right of its counterpart. When a client chooses to access this tab a new screen will populate and a list of pre-existing channel configurations (specific to that SapIP) will appear. Channel configurations are important because they must be configured according to what sensors are connected to the SapIP. There are several different cable – sensor combinations that a client may observe, however, Dynamax will be responsible for configuring each of these prior to customer log in.
FIGURE 5.15: CHANNEL CONFIGURATION TAB
iv. Sensors -The next tab is called “Channel Configuration History”. When selected a new screen will populate and a list of pre-existing sensors that are associated to that SapIP will be displayed (specific to that SapIP). The sensors attached to the SapIP designate what data is calculated, as well as the port and cable assignments required.
-Prior to the Customer logging in, Dynamax will have assigned the correct channel configurations to each SapIP. -Furthermore, Dynamax offers 3 types of sap flow, soil moisture, weather and custom configurations. Please call for further information and/or support.
Prior to the Customer logging in, Dynamax will have assigned the correct sensor to each SapIP or to the Sensor Inventory.
Instructions Manual Agriensensors.net
Page 35 Dynamax, Inc.
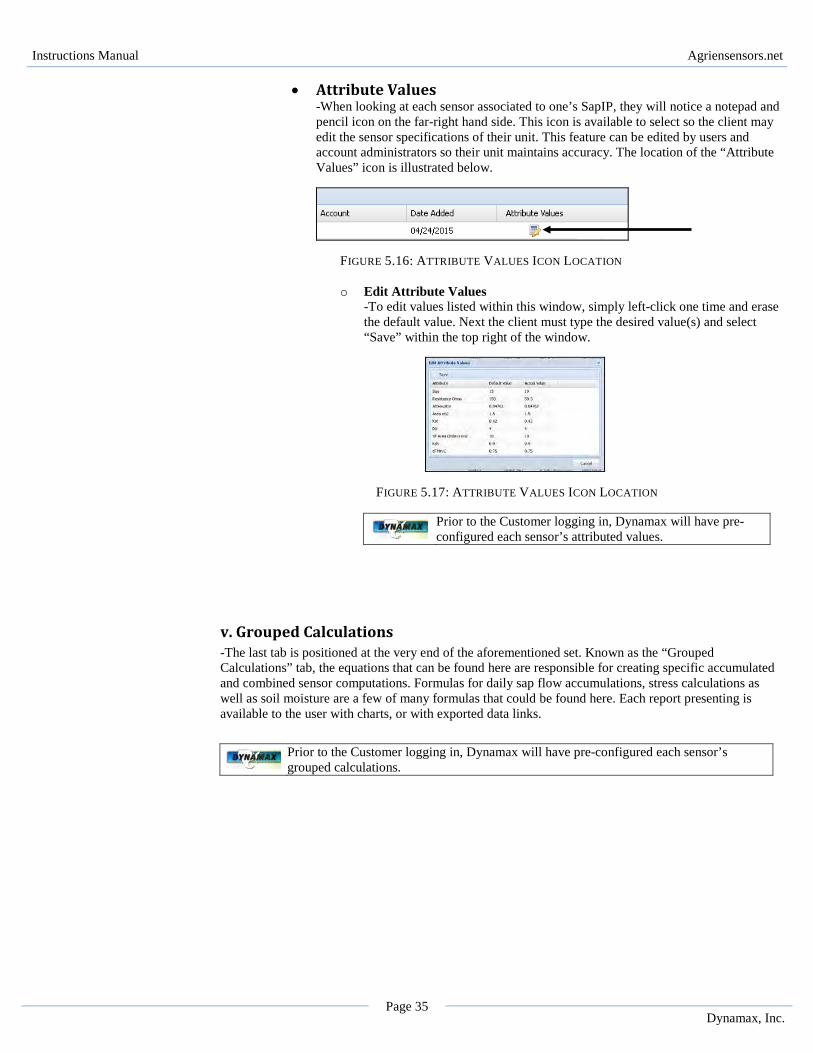
• Attribute Values -When looking at each sensor associated to one’s SapIP, they will notice a notepad and pencil icon on the far-right hand side. This icon is available to select so the client may edit the sensor specifications of their unit. This feature can be edited by users and account administrators so their unit maintains accuracy. The location of the “Attribute Values” icon is illustrated below.
FIGURE 5.16: ATTRIBUTE VALUES ICON LOCATION
o Edit Attribute Values -To edit values listed within this window, simply left-click one time and erase the default value. Next the client must type the desired value(s) and select “Save” within the top right of the window.
FIGURE 5.17: ATTRIBUTE VALUES ICON LOCATION
v. Grouped Calculations -The last tab is positioned at the very end of the aforementioned set. Known as the “Grouped Calculations” tab, the equations that can be found here are responsible for creating specific accumulated and combined sensor computations. Formulas for daily sap flow accumulations, stress calculations as well as soil moisture are a few of many formulas that could be found here. Each report presenting is available to the user with charts, or with exported data links.
Prior to the Customer logging in, Dynamax will have pre-configured each sensor’s attributed values.
Prior to the Customer logging in, Dynamax will have pre-configured each sensor’s grouped calculations.
Instructions Manual Agriensensors.net
Page 36 Dynamax, Inc.
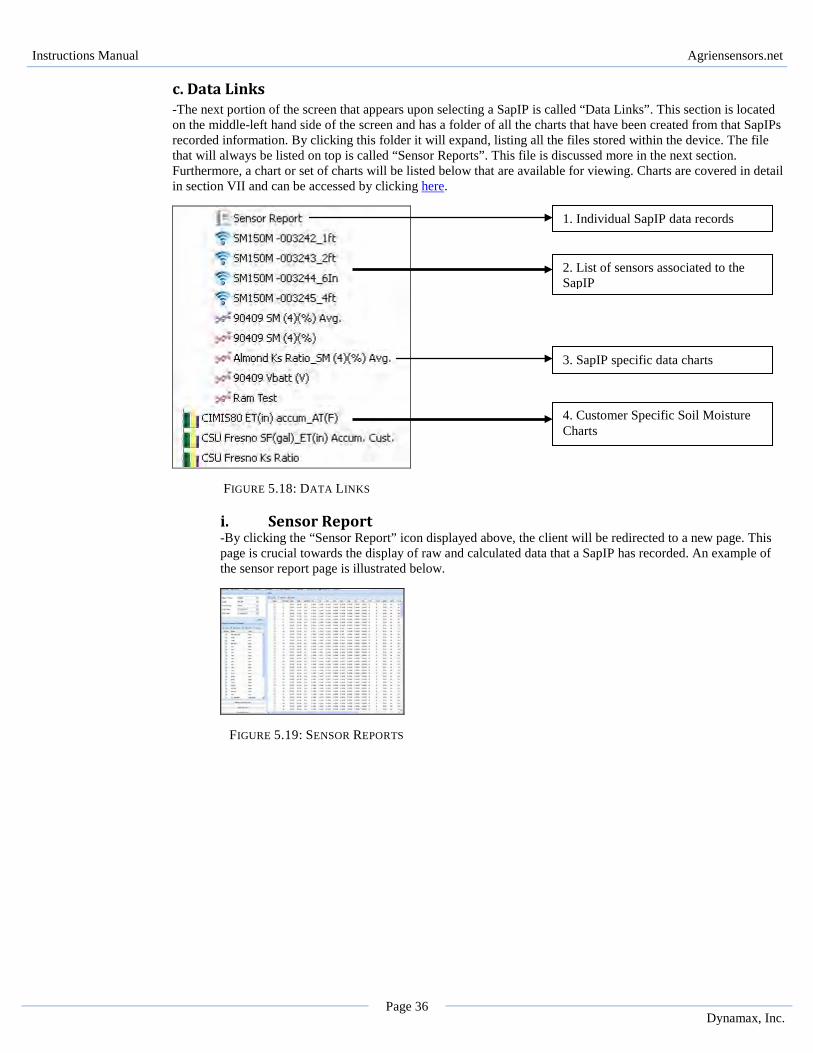
c. Data Links -The next portion of the screen that appears upon selecting a SapIP is called “Data Links”. This section is located on the middle-left hand side of the screen and has a folder of all the charts that have been created from that SapIPs recorded information. By clicking this folder it will expand, listing all the files stored within the device. The file that will always be listed on top is called “Sensor Reports”. This file is discussed more in the next section. Furthermore, a chart or set of charts will be listed below that are available for viewing. Charts are covered in detail in section VII and can be accessed by clicking here.
FIGURE 5.18: DATA LINKS
i. Sensor Report -By clicking the “Sensor Report” icon displayed above, the client will be redirected to a new page. This page is crucial towards the display of raw and calculated data that a SapIP has recorded. An example of the sensor report page is illustrated below.
FIGURE 5.19: SENSOR REPORTS
1. Individual SapIP data records
2. List of sensors associated to the SapIP
3. SapIP specific data charts
4. Customer Specific Soil Moisture Charts
Instructions Manual Agriensensors.net
Page 37 Dynamax, Inc.
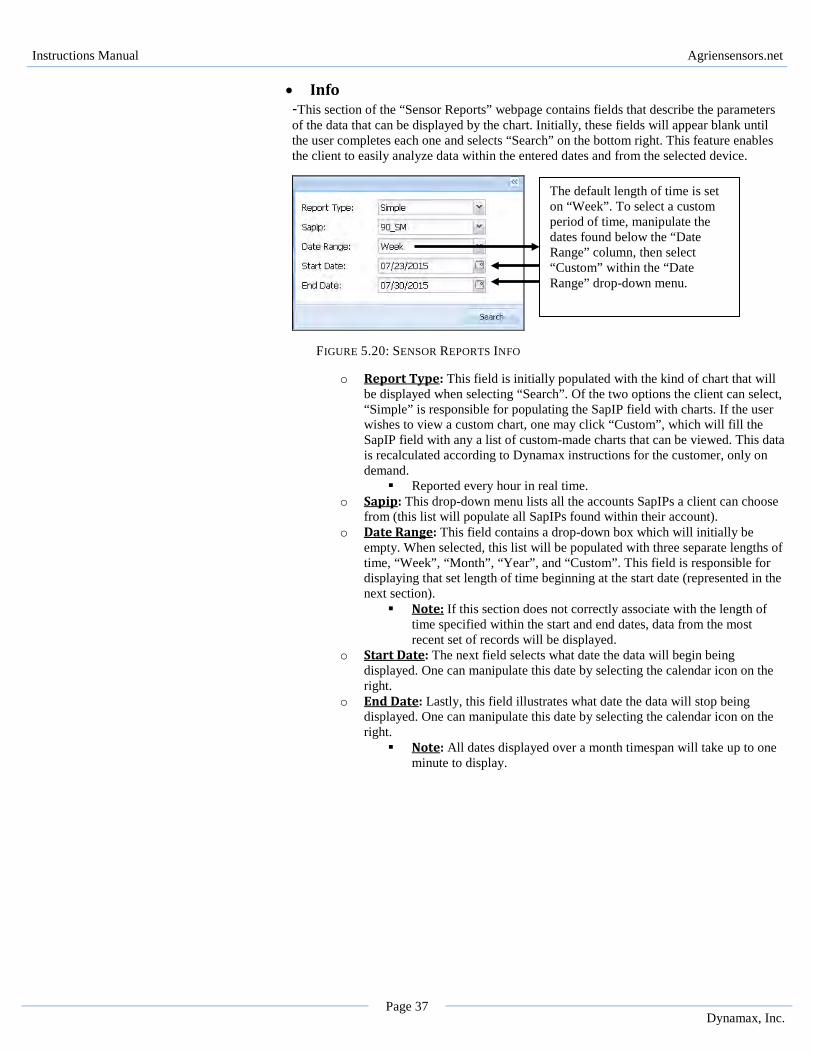
• Info -This section of the “Sensor Reports” webpage contains fields that describe the parameters of the data that can be displayed by the chart. Initially, these fields will appear blank until the user completes each one and selects “Search” on the bottom right. This feature enables the client to easily analyze data within the entered dates and from the selected device.
FIGURE 5.20: SENSOR REPORTS INFO
o Report Type: This field is initially populated with the kind of chart that will be displayed when selecting “Search”. Of the two options the client can select, “Simple” is responsible for populating the SapIP field with charts. If the user wishes to view a custom chart, one may click “Custom”, which will fill the SapIP field with any a list of custom-made charts that can be viewed. This data is recalculated according to Dynamax instructions for the customer, only on demand.
Reported every hour in real time. o Sapip: This drop-down menu lists all the accounts SapIPs a client can choose
from (this list will populate all SapIPs found within their account). o Date Range: This field contains a drop-down box which will initially be
empty. When selected, this list will be populated with three separate lengths of time, “Week”, “Month”, “Year”, and “Custom”. This field is responsible for displaying that set length of time beginning at the start date (represented in the next section).
Note: If this section does not correctly associate with the length of time specified within the start and end dates, data from the most recent set of records will be displayed.
o Start Date: The next field selects what date the data will begin being displayed. One can manipulate this date by selecting the calendar icon on the right.
o End Date: Lastly, this field illustrates what date the data will stop being displayed. One can manipulate this date by selecting the calendar icon on the right.
Note: All dates displayed over a month timespan will take up to one minute to display.
The default length of time is set on “Week”. To select a custom period of time, manipulate the dates found below the “Date Range” column, then select “Custom” within the “Date Range” drop-down menu.
Instructions Manual Agriensensors.net
Page 38 Dynamax, Inc.
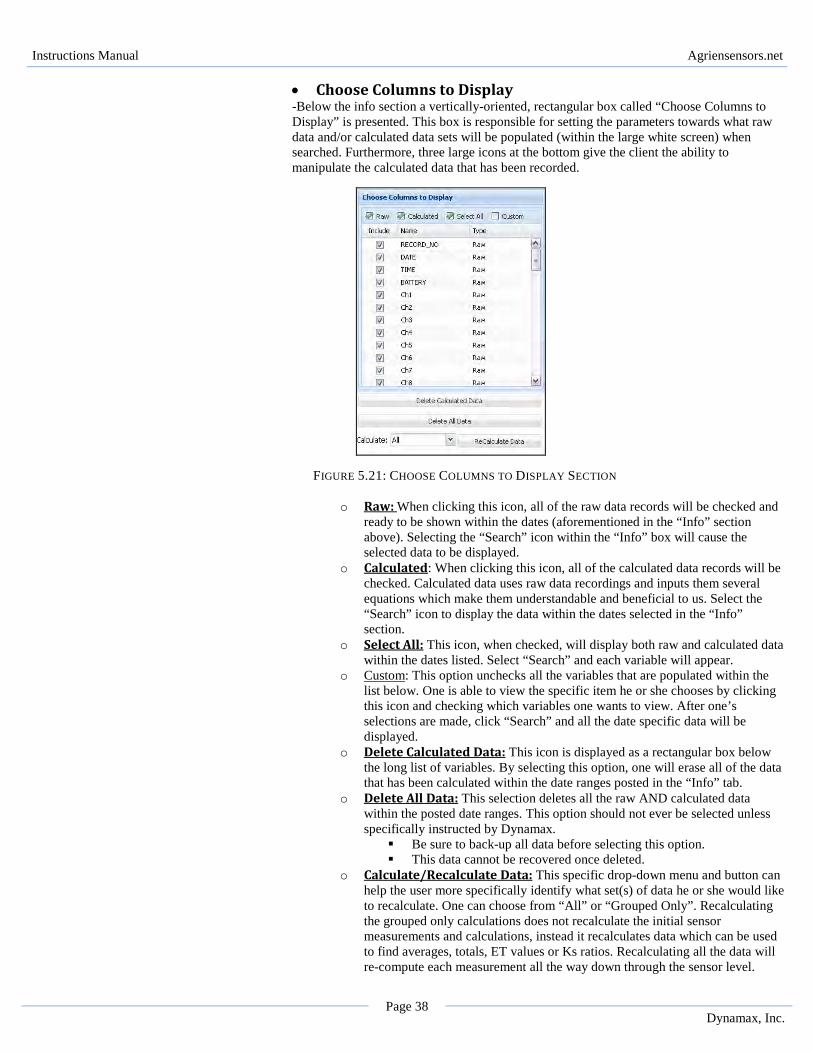
• Choose Columns to Display -Below the info section a vertically-oriented, rectangular box called “Choose Columns to Display” is presented. This box is responsible for setting the parameters towards what raw data and/or calculated data sets will be populated (within the large white screen) when searched. Furthermore, three large icons at the bottom give the client the ability to manipulate the calculated data that has been recorded.
FIGURE 5.21: CHOOSE COLUMNS TO DISPLAY SECTION
o Raw: When clicking this icon, all of the raw data records will be checked and ready to be shown within the dates (aforementioned in the “Info” section above). Selecting the “Search” icon within the “Info” box will cause the selected data to be displayed.
o Calculated: When clicking this icon, all of the calculated data records will be checked. Calculated data uses raw data recordings and inputs them several equations which make them understandable and beneficial to us. Select the “Search” icon to display the data within the dates selected in the “Info” section.
o Select All: This icon, when checked, will display both raw and calculated data within the dates listed. Select “Search” and each variable will appear.
o Custom: This option unchecks all the variables that are populated within the list below. One is able to view the specific item he or she chooses by clicking this icon and checking which variables one wants to view. After one’s selections are made, click “Search” and all the date specific data will be displayed.
o Delete Calculated Data: This icon is displayed as a rectangular box below the long list of variables. By selecting this option, one will erase all of the data that has been calculated within the date ranges posted in the “Info” tab.
o Delete All Data: This selection deletes all the raw AND calculated data within the posted date ranges. This option should not ever be selected unless specifically instructed by Dynamax.
Be sure to back-up all data before selecting this option. This data cannot be recovered once deleted.
o Calculate/Recalculate Data: This specific drop-down menu and button can help the user more specifically identify what set(s) of data he or she would like to recalculate. One can choose from “All” or “Grouped Only”. Recalculating the grouped only calculations does not recalculate the initial sensor measurements and calculations, instead it recalculates data which can be used to find averages, totals, ET values or Ks ratios. Recalculating all the data will re-compute each measurement all the way down through the sensor level.
Instructions Manual Agriensensors.net
Page 39 Dynamax, Inc.
Note: One must be sure to select “Custom” within the “Date Range” field if he or she wishes to view a data set that is not a week, month, or year in length.
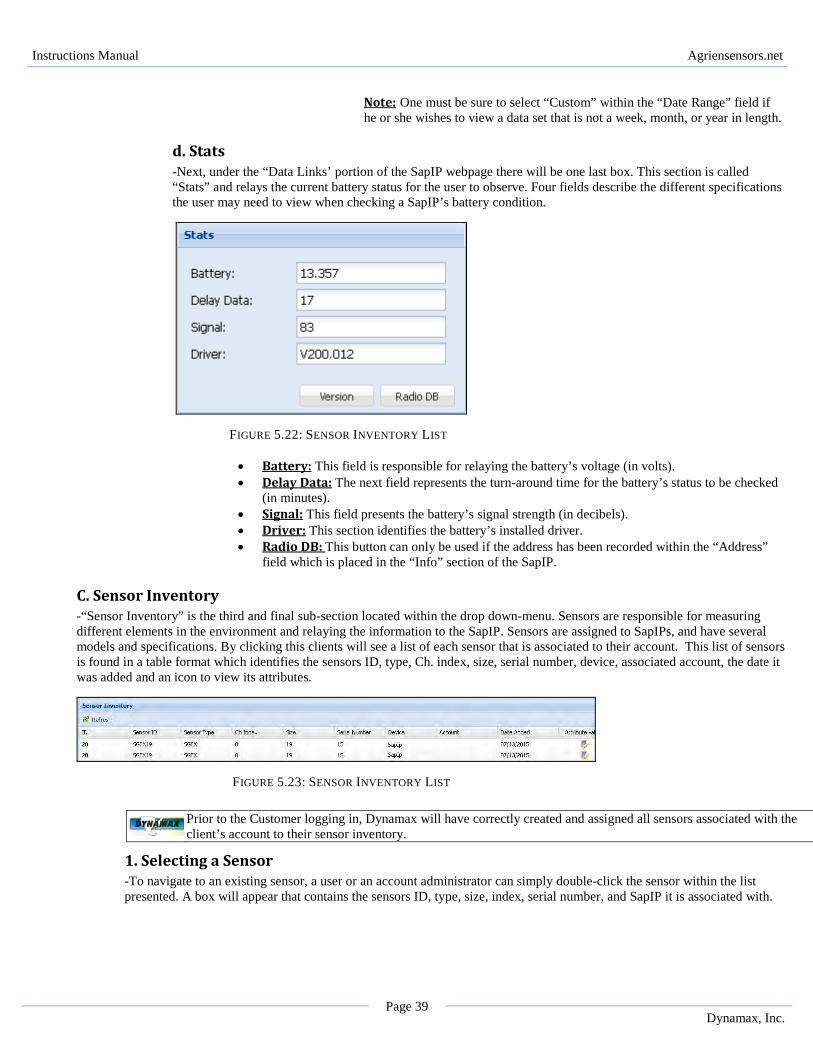
d. Stats -Next, under the “Data Links’ portion of the SapIP webpage there will be one last box. This section is called “Stats” and relays the current battery status for the user to observe. Four fields describe the different specifications the user may need to view when checking a SapIP’s battery condition.
FIGURE 5.22: SENSOR INVENTORY LIST
• Battery: This field is responsible for relaying the battery’s voltage (in volts). • Delay Data: The next field represents the turn-around time for the battery’s status to be checked
(in minutes). • Signal: This field presents the battery’s signal strength (in decibels). • Driver: This section identifies the battery’s installed driver. • Radio DB: This button can only be used if the address has been recorded within the “Address”
field which is placed in the “Info” section of the SapIP.
C. Sensor Inventory -“Sensor Inventory” is the third and final sub-section located within the drop down-menu. Sensors are responsible for measuring different elements in the environment and relaying the information to the SapIP. Sensors are assigned to SapIPs, and have several models and specifications. By clicking this clients will see a list of each sensor that is associated to their account. This list of sensors is found in a table format which identifies the sensors ID, type, Ch. index, size, serial number, device, associated account, the date it was added and an icon to view its attributes.
FIGURE 5.23: SENSOR INVENTORY LIST
1. Selecting a Sensor -To navigate to an existing sensor, a user or an account administrator can simply double-click the sensor within the list presented. A box will appear that contains the sensors ID, type, size, index, serial number, and SapIP it is associated with.
Prior to the Customer logging in, Dynamax will have correctly created and assigned all sensors associated with the client’s account to their sensor inventory.
Instructions Manual Agriensensors.net
Page 40 Dynamax, Inc.
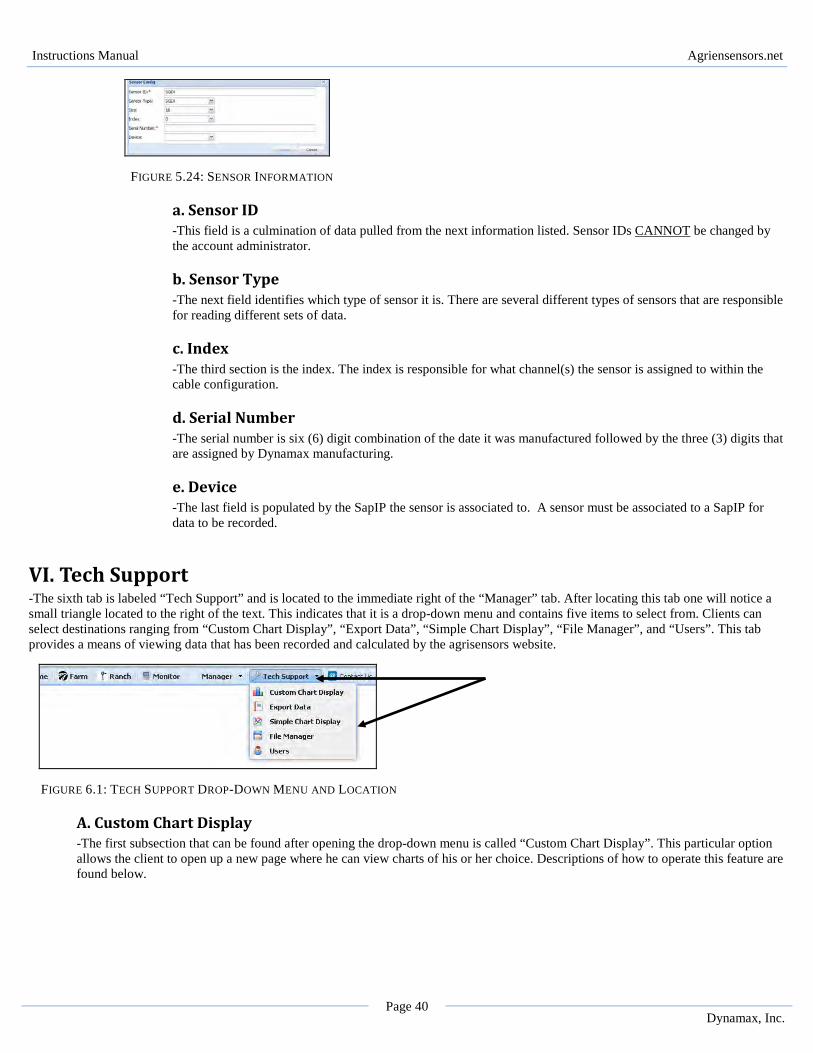
FIGURE 5.24: SENSOR INFORMATION
a. Sensor ID -This field is a culmination of data pulled from the next information listed. Sensor IDs CANNOT be changed by the account administrator.
b. Sensor Type -The next field identifies which type of sensor it is. There are several different types of sensors that are responsible for reading different sets of data.
c. Index -The third section is the index. The index is responsible for what channel(s) the sensor is assigned to within the cable configuration.
d. Serial Number -The serial number is six (6) digit combination of the date it was manufactured followed by the three (3) digits that are assigned by Dynamax manufacturing.
e. Device -The last field is populated by the SapIP the sensor is associated to. A sensor must be associated to a SapIP for data to be recorded.
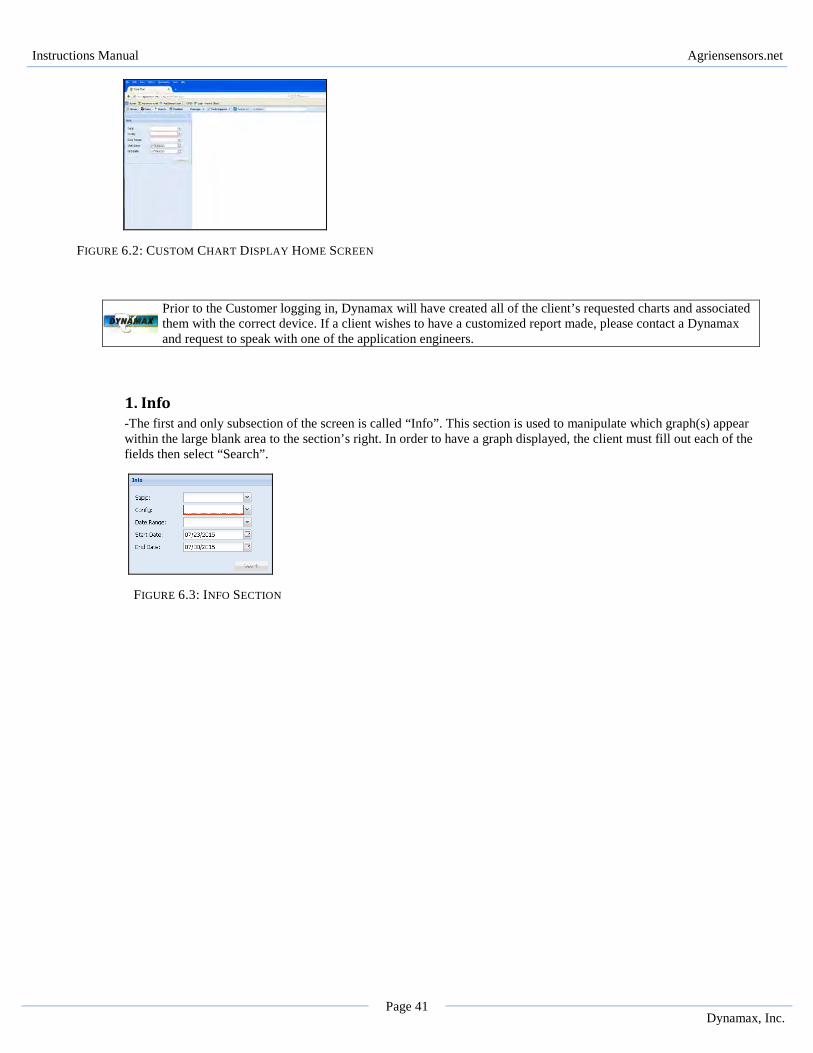
VI. Tech Support -The sixth tab is labeled “Tech Support” and is located to the immediate right of the “Manager” tab. After locating this tab one will notice a small triangle located to the right of the text. This indicates that it is a drop-down menu and contains five items to select from. Clients can select destinations ranging from “Custom Chart Display”, “Export Data”, “Simple Chart Display”, “File Manager”, and “Users”. This tab provides a means of viewing data that has been recorded and calculated by the agrisensors website.
FIGURE 6.1: TECH SUPPORT DROP-DOWN MENU AND LOCATION
A. Custom Chart Display -The first subsection that can be found after opening the drop-down menu is called “Custom Chart Display”. This particular option allows the client to open up a new page where he can view charts of his or her choice. Descriptions of how to operate this feature are found below.
Instructions Manual Agriensensors.net
Page 41 Dynamax, Inc.
FIGURE 6.2: CUSTOM CHART DISPLAY HOME SCREEN
1. Info -The first and only subsection of the screen is called “Info”. This section is used to manipulate which graph(s) appear within the large blank area to the section’s right. In order to have a graph displayed, the client must fill out each of the fields then select “Search”.
FIGURE 6.3: INFO SECTION
Prior to the Customer logging in, Dynamax will have created all of the client’s requested charts and associated them with the correct device. If a client wishes to have a customized report made, please contact a Dynamax and request to speak with one of the application engineers.
Instructions Manual Agriensensors.net
Page 42 Dynamax, Inc.
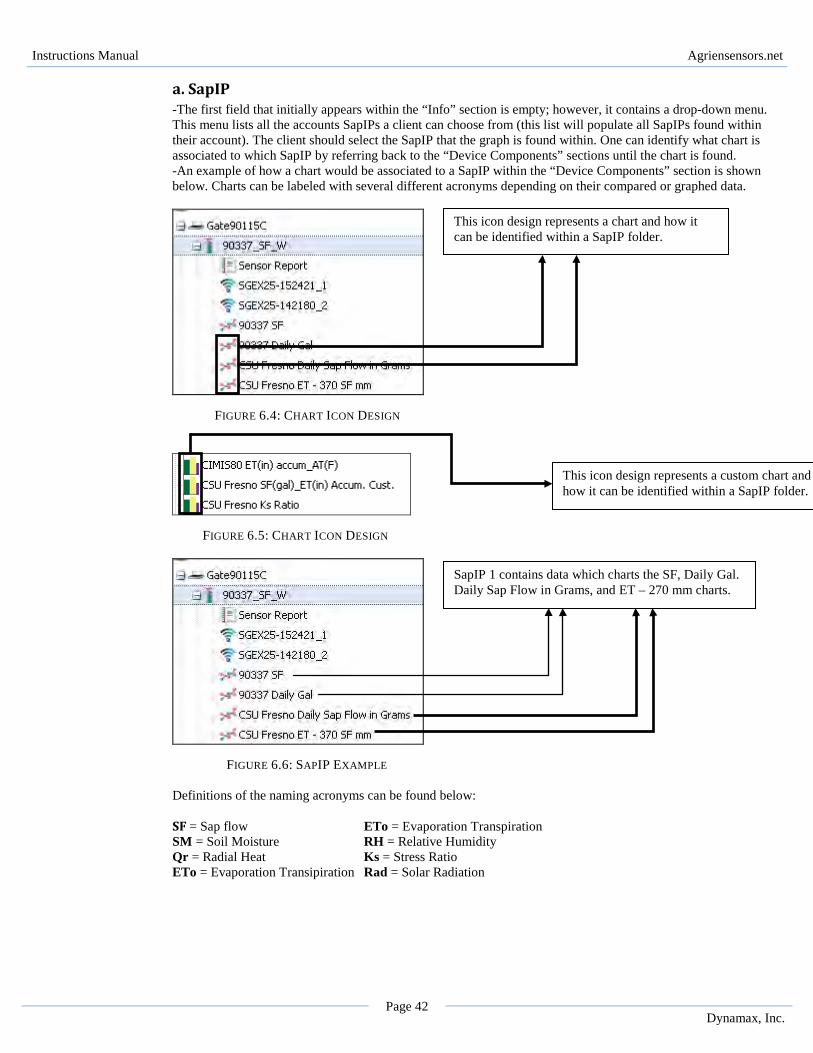
a. SapIP -The first field that initially appears within the “Info” section is empty; however, it contains a drop-down menu. This menu lists all the accounts SapIPs a client can choose from (this list will populate all SapIPs found within their account). The client should select the SapIP that the graph is found within. One can identify what chart is associated to which SapIP by referring back to the “Device Components” sections until the chart is found. -An example of how a chart would be associated to a SapIP within the “Device Components” section is shown below. Charts can be labeled with several different acronyms depending on their compared or graphed data.
FIGURE 6.4: CHART ICON DESIGN
FIGURE 6.5: CHART ICON DESIGN
FIGURE 6.6: SAPIP EXAMPLE
Definitions of the naming acronyms can be found below:
SF = Sap flow ETo = Evaporation Transpiration SM = Soil Moisture RH = Relative Humidity
Qr = Radial Heat Ks = Stress Ratio ETo = Evaporation Transipiration Rad = Solar Radiation
SapIP 1 contains data which charts the SF, Daily Gal. Daily Sap Flow in Grams, and ET – 270 mm charts.
This icon design represents a chart and how it can be identified within a SapIP folder.
This icon design represents a custom chart and how it can be identified within a SapIP folder.
Instructions Manual Agriensensors.net
Page 43 Dynamax, Inc.
b. Config. -This first field is also initially blank and within the same section. This menu lists every chart that is associated with the SapIP selected in the first field.
c. Date Range - This field contains a drop-down box which will initially be empty. When selected, this list will be populated with three separate lengths of time, “Week”, “Month”, “Year”, and “Custom”. This field is responsible for displaying that set length of time set before the end date (represented in the next section). Week, month, year – all restate data of interest. For another set of data, please select “Custom”.
Note: If this section does not correctly associate with the length of time specified within the start and end dates, the last recorded weeks’ worth of data will appear.
d. Start Date/End Date -These fields are initially blank and are responsible for setting the parameters on what days of data will appear.
• Start Date: The next field illustrates what date the data will begin being displayed. One can manipulate this date by selecting the calendar icon on the right.
• End Date: Lastly, this field illustrates what date the data will stop being displayed. One can manipulate this date by selecting the calendar icon on the right.
Note: One must be sure to select “Custom” within the “Date Range” field if he or she wishes to view a data
set that is not a week, month, or year in length.
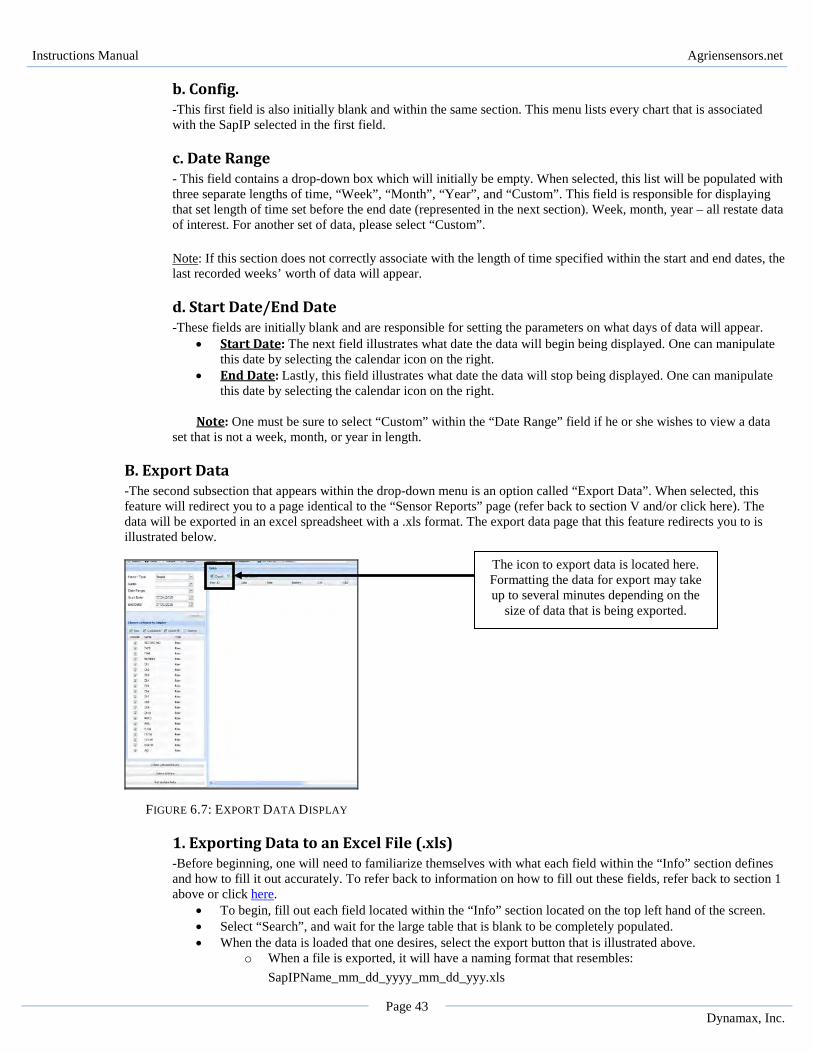
B. Export Data -The second subsection that appears within the drop-down menu is an option called “Export Data”. When selected, this feature will redirect you to a page identical to the “Sensor Reports” page (refer back to section V and/or click here). The data will be exported in an excel spreadsheet with a .xls format. The export data page that this feature redirects you to is illustrated below.
FIGURE 6.7: EXPORT DATA DISPLAY
1. Exporting Data to an Excel File (.xls) -Before beginning, one will need to familiarize themselves with what each field within the “Info” section defines and how to fill it out accurately. To refer back to information on how to fill out these fields, refer back to section 1 above or click here.
• To begin, fill out each field located within the “Info” section located on the top left hand of the screen. • Select “Search”, and wait for the large table that is blank to be completely populated. • When the data is loaded that one desires, select the export button that is illustrated above.
o When a file is exported, it will have a naming format that resembles: SapIPName_mm_dd_yyyy_mm_dd_yyy.xls
The icon to export data is located here. Formatting the data for export may take up to several minutes depending on the
size of data that is being exported.
Instructions Manual Agriensensors.net
Page 44 Dynamax, Inc.
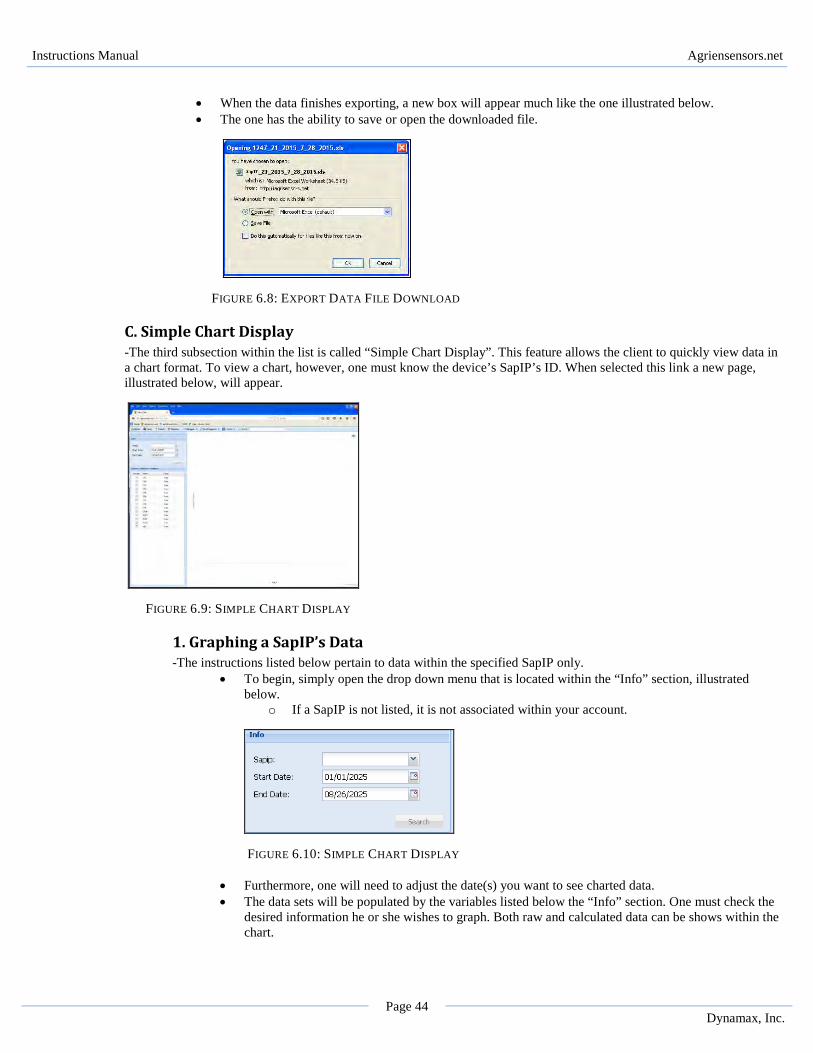
• When the data finishes exporting, a new box will appear much like the one illustrated below. • The one has the ability to save or open the downloaded file.
FIGURE 6.8: EXPORT DATA FILE DOWNLOAD
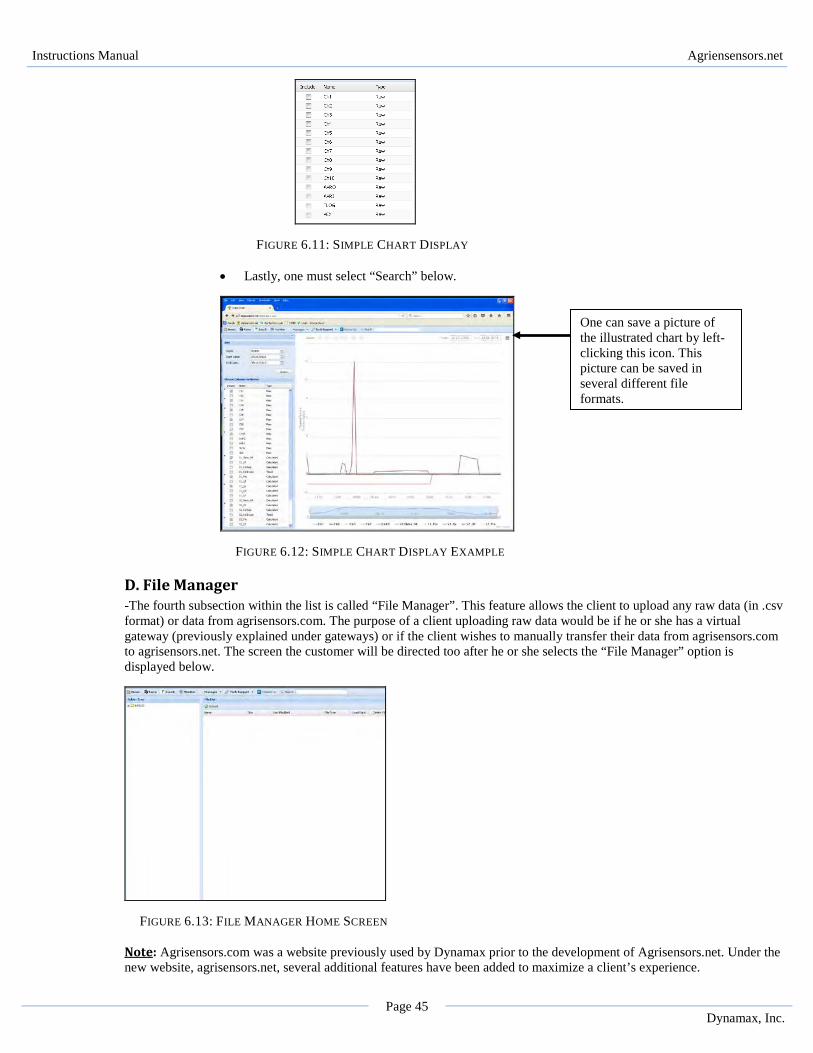
C. Simple Chart Display -The third subsection within the list is called “Simple Chart Display”. This feature allows the client to quickly view data in a chart format. To view a chart, however, one must know the device’s SapIP’s ID. When selected this link a new page, illustrated below, will appear.
FIGURE 6.9: SIMPLE CHART DISPLAY
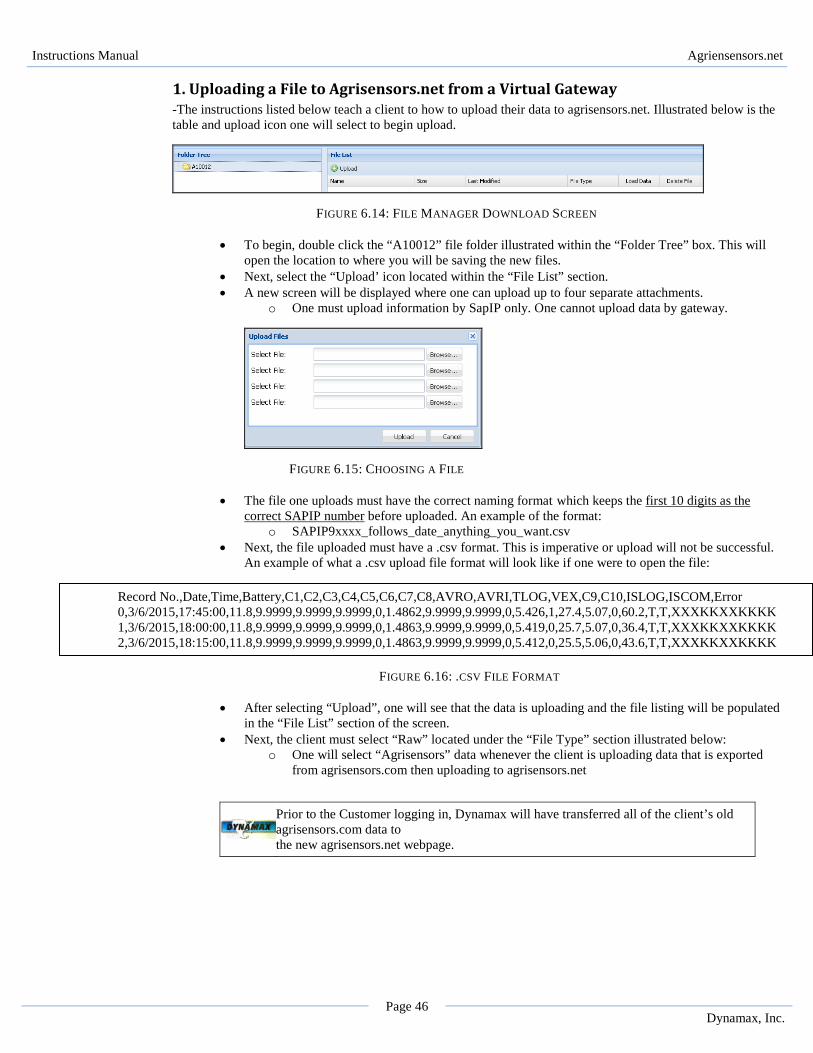
1. Graphing a SapIP’s Data -The instructions listed below pertain to data within the specified SapIP only.
• To begin, simply open the drop down menu that is located within the “Info” section, illustrated below.
o If a SapIP is not listed, it is not associated within your account.
FIGURE 6.10: SIMPLE CHART DISPLAY
• Furthermore, one will need to adjust the date(s) you want to see charted data. • The data sets will be populated by the variables listed below the “Info” section. One must check the
desired information he or she wishes to graph. Both raw and calculated data can be shows within the chart.
Instructions Manual Agriensensors.net
Page 45 Dynamax, Inc.
FIGURE 6.11: SIMPLE CHART DISPLAY
• Lastly, one must select “Search” below.
FIGURE 6.12: SIMPLE CHART DISPLAY EXAMPLE
D. File Manager -The fourth subsection within the list is called “File Manager”. This feature allows the client to upload any raw data (in .csv format) or data from agrisensors.com. The purpose of a client uploading raw data would be if he or she has a virtual gateway (previously explained under gateways) or if the client wishes to manually transfer their data from agrisensors.com to agrisensors.net. The screen the customer will be directed too after he or she selects the “File Manager” option is displayed below.
FIGURE 6.13: FILE MANAGER HOME SCREEN Note: Agrisensors.com was a website previously used by Dynamax prior to the development of Agrisensors.net. Under the new website, agrisensors.net, several additional features have been added to maximize a client’s experience.
One can save a picture of the illustrated chart by left-clicking this icon. This picture can be saved in several different file formats.
Instructions Manual Agriensensors.net
Page 46 Dynamax, Inc.
1. Uploading a File to Agrisensors.net from a Virtual Gateway -The instructions listed below teach a client to how to upload their data to agrisensors.net. Illustrated below is the table and upload icon one will select to begin upload.
FIGURE 6.14: FILE MANAGER DOWNLOAD SCREEN
• To begin, double click the “A10012” file folder illustrated within the “Folder Tree” box. This will open the location to where you will be saving the new files.
• Next, select the “Upload’ icon located within the “File List” section. • A new screen will be displayed where one can upload up to four separate attachments.
o One must upload information by SapIP only. One cannot upload data by gateway.
FIGURE 6.15: CHOOSING A FILE
• The file one uploads must have the correct naming format which keeps the first 10 digits as the
correct SAPIP number before uploaded. An example of the format: o SAPIP9xxxx_follows_date_anything_you_want.csv
• Next, the file uploaded must have a .csv format. This is imperative or upload will not be successful. An example of what a .csv upload file format will look like if one were to open the file:
FIGURE 6.16: .CSV FILE FORMAT
• After selecting “Upload”, one will see that the data is uploading and the file listing will be populated
in the “File List” section of the screen. • Next, the client must select “Raw” located under the “File Type” section illustrated below:
o One will select “Agrisensors” data whenever the client is uploading data that is exported from agrisensors.com then uploading to agrisensors.net
Prior to the Customer logging in, Dynamax will have transferred all of the client’s old agrisensors.com data to the new agrisensors.net webpage.
Record No.,Date,Time,Battery,C1,C2,C3,C4,C5,C6,C7,C8,AVRO,AVRI,TLOG,VEX,C9,C10,ISLOG,ISCOM,Error 0,3/6/2015,17:45:00,11.8,9.9999,9.9999,9.9999,0,1.4862,9.9999,9.9999,0,5.426,1,27.4,5.07,0,60.2,T,T,XXXKKXXKKKK 1,3/6/2015,18:00:00,11.8,9.9999,9.9999,9.9999,0,1.4863,9.9999,9.9999,0,5.419,0,25.7,5.07,0,36.4,T,T,XXXKKXXKKKK 2,3/6/2015,18:15:00,11.8,9.9999,9.9999,9.9999,0,1.4863,9.9999,9.9999,0,5.412,0,25.5,5.06,0,43.6,T,T,XXXKKXXKKKK
Instructions Manual Agriensensors.net
Page 47 Dynamax, Inc.
FIGURE 6.17: AGRISENSORS.NET FILE TYPE UPLOAD
• After selecting “Upload”, one will see that the data is uploading and the file listing will be populated in the “File List” section of the screen if one searches for data within the SapIP screen. An illustration lists the final result below.
o One will have to select “Recalculate Data” to see any new calculations on agrisensors.net.
FIGURE 6.18: SUCCESSFUL FILE UPLOAD
E. Users -The second to last subsection within the list is called “Users”. This feature allows an account administrator to view and/or modify the permissions and list of users that can login agrisensors.net. This feature allows a client to modify usage without having to contact Dynamax. After selecting the “Users” icon within the drop down menu, a list of account managers and users (if any) will be illustrated much like the picture below. One will notice the list of columns contains the User ID, First and last names, the role (either account administrator or user), the associated account, the status (either active or inactive) and a red delete button.
FIGURE 6.18: USERS HOMEPAGE
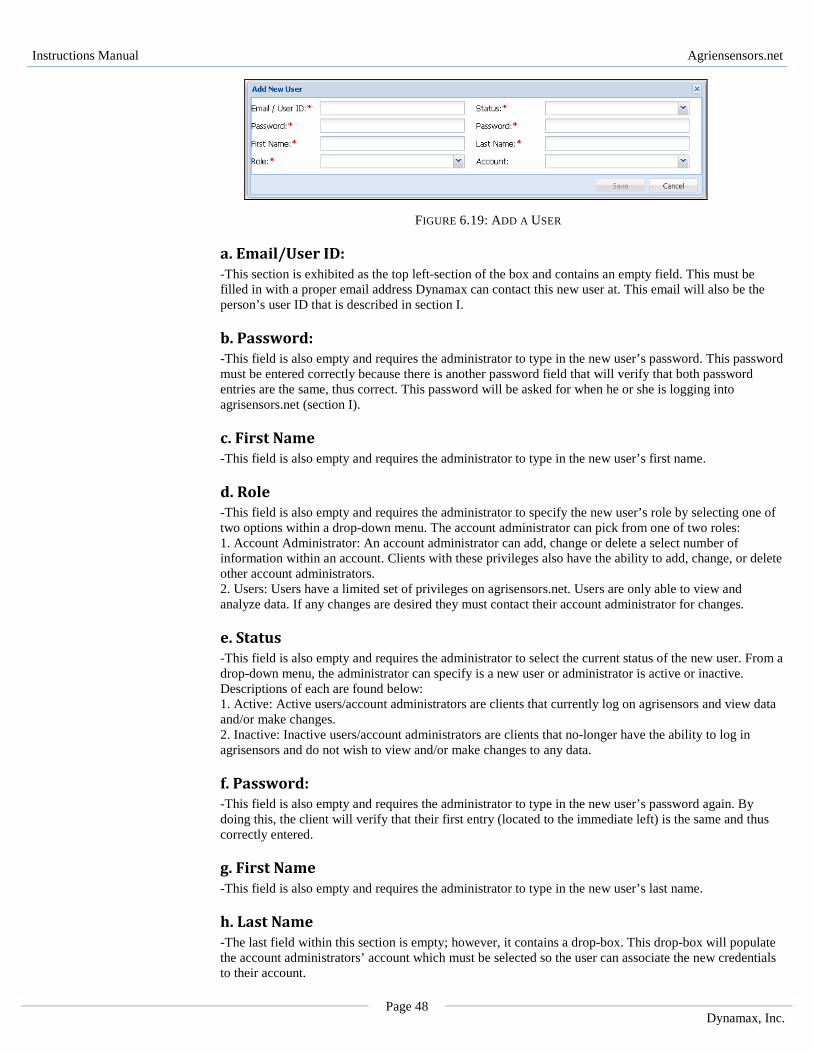
1. Create an Additional User -To add an additional user to an account, one must first have account administrator privileges. This will create a new log in that another person may use to view data that is collected by an accounts gateways and devices.
• To begin, one must select the “Add” icon which is found above the table within the “Users” box. • One will notice a new box appears with several fields. All fields illustrated below must be filled in
correctly. An illustration of this box appears below:
Prior to the Customer logging in, Dynamax will configured all account administrators and account users.
Instructions Manual Agriensensors.net
Page 48 Dynamax, Inc.
FIGURE 6.19: ADD A USER
a. Email/User ID: -This section is exhibited as the top left-section of the box and contains an empty field. This must be filled in with a proper email address Dynamax can contact this new user at. This email will also be the person’s user ID that is described in section I.
b. Password: -This field is also empty and requires the administrator to type in the new user’s password. This password must be entered correctly because there is another password field that will verify that both password entries are the same, thus correct. This password will be asked for when he or she is logging into agrisensors.net (section I).
c. First Name -This field is also empty and requires the administrator to type in the new user’s first name.
d. Role -This field is also empty and requires the administrator to specify the new user’s role by selecting one of two options within a drop-down menu. The account administrator can pick from one of two roles: 1. Account Administrator: An account administrator can add, change or delete a select number of information within an account. Clients with these privileges also have the ability to add, change, or delete other account administrators. 2. Users: Users have a limited set of privileges on agrisensors.net. Users are only able to view and analyze data. If any changes are desired they must contact their account administrator for changes.
e. Status -This field is also empty and requires the administrator to select the current status of the new user. From a drop-down menu, the administrator can specify is a new user or administrator is active or inactive. Descriptions of each are found below: 1. Active: Active users/account administrators are clients that currently log on agrisensors and view data and/or make changes. 2. Inactive: Inactive users/account administrators are clients that no-longer have the ability to log in agrisensors and do not wish to view and/or make changes to any data.
f. Password: -This field is also empty and requires the administrator to type in the new user’s password again. By doing this, the client will verify that their first entry (located to the immediate left) is the same and thus correctly entered.
g. First Name -This field is also empty and requires the administrator to type in the new user’s last name.
h. Last Name -The last field within this section is empty; however, it contains a drop-box. This drop-box will populate the account administrators’ account which must be selected so the user can associate the new credentials to their account.
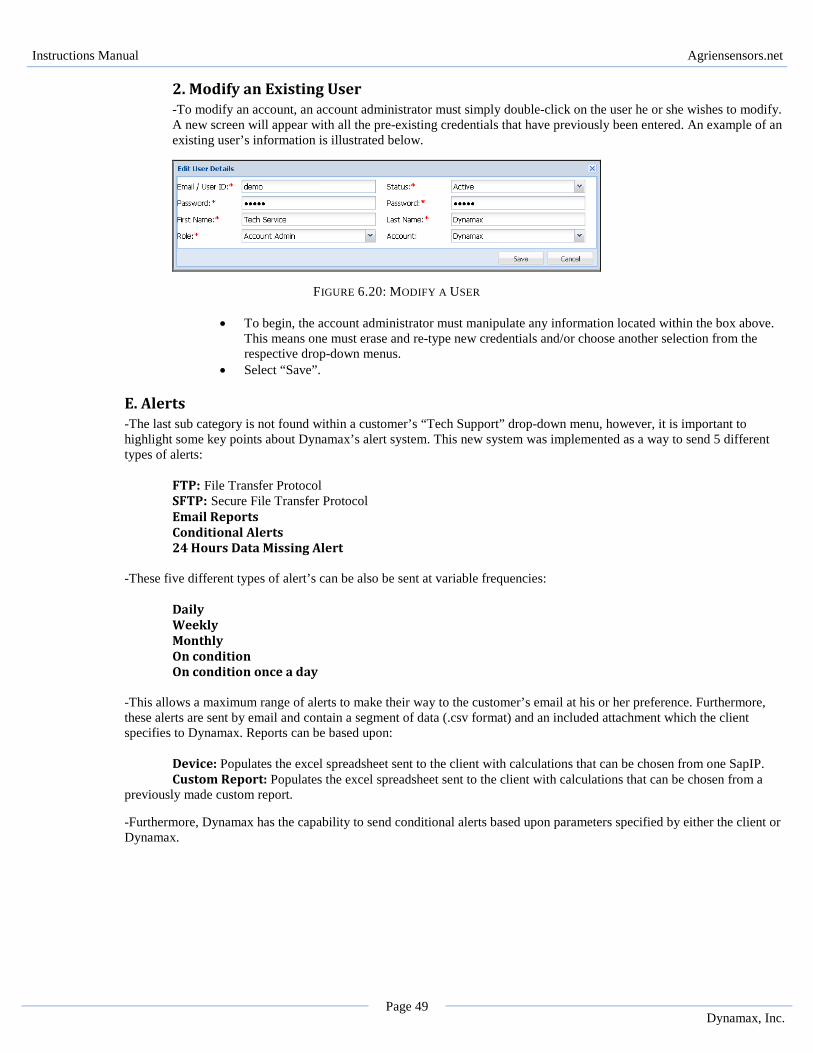
Instructions Manual Agriensensors.net
Page 49 Dynamax, Inc.
2. Modify an Existing User -To modify an account, an account administrator must simply double-click on the user he or she wishes to modify. A new screen will appear with all the pre-existing credentials that have previously been entered. An example of an existing user’s information is illustrated below.
FIGURE 6.20: MODIFY A USER • To begin, the account administrator must manipulate any information located within the box above.
This means one must erase and re-type new credentials and/or choose another selection from the respective drop-down menus.
• Select “Save”.
E. Alerts -The last sub category is not found within a customer’s “Tech Support” drop-down menu, however, it is important to highlight some key points about Dynamax’s alert system. This new system was implemented as a way to send 5 different types of alerts:
FTP: File Transfer Protocol SFTP: Secure File Transfer Protocol Email Reports Conditional Alerts 24 Hours Data Missing Alert
-These five different types of alert’s can be also be sent at variable frequencies:
Daily Weekly Monthly On condition On condition once a day
-This allows a maximum range of alerts to make their way to the customer’s email at his or her preference. Furthermore, these alerts are sent by email and contain a segment of data (.csv format) and an included attachment which the client specifies to Dynamax. Reports can be based upon:
Device: Populates the excel spreadsheet sent to the client with calculations that can be chosen from one SapIP. Custom Report: Populates the excel spreadsheet sent to the client with calculations that can be chosen from a
previously made custom report. -Furthermore, Dynamax has the capability to send conditional alerts based upon parameters specified by either the client or Dynamax.
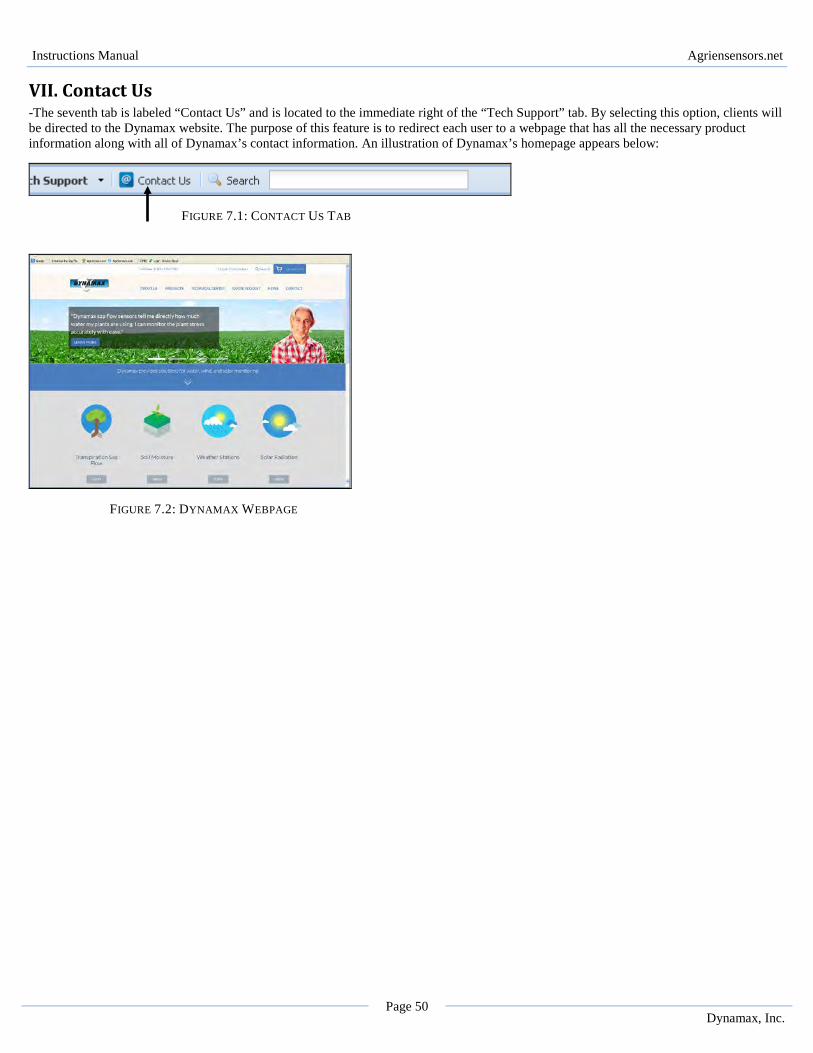
Instructions Manual Agriensensors.net
Page 50 Dynamax, Inc.
VII. Contact Us -The seventh tab is labeled “Contact Us” and is located to the immediate right of the “Tech Support” tab. By selecting this option, clients will be directed to the Dynamax website. The purpose of this feature is to redirect each user to a webpage that has all the necessary product information along with all of Dynamax’s contact information. An illustration of Dynamax’s homepage appears below:
FIGURE 7.1: CONTACT US TAB
FIGURE 7.2: DYNAMAX WEBPAGE
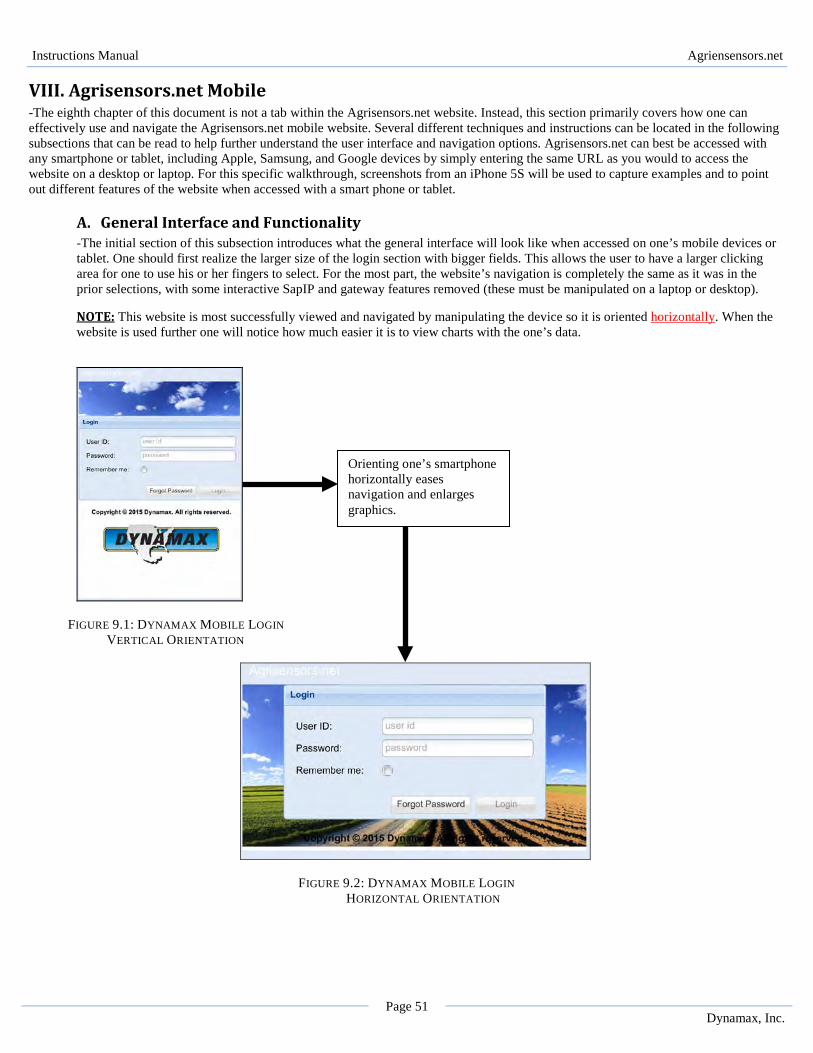
Instructions Manual Agriensensors.net
Page 51 Dynamax, Inc.
VIII. Agrisensors.net Mobile -The eighth chapter of this document is not a tab within the Agrisensors.net website. Instead, this section primarily covers how one can effectively use and navigate the Agrisensors.net mobile website. Several different techniques and instructions can be located in the following subsections that can be read to help further understand the user interface and navigation options. Agrisensors.net can best be accessed with any smartphone or tablet, including Apple, Samsung, and Google devices by simply entering the same URL as you would to access the website on a desktop or laptop. For this specific walkthrough, screenshots from an iPhone 5S will be used to capture examples and to point out different features of the website when accessed with a smart phone or tablet.
A. General Interface and Functionality -The initial section of this subsection introduces what the general interface will look like when accessed on one’s mobile devices or tablet. One should first realize the larger size of the login section with bigger fields. This allows the user to have a larger clicking area for one to use his or her fingers to select. For the most part, the website’s navigation is completely the same as it was in the prior selections, with some interactive SapIP and gateway features removed (these must be manipulated on a laptop or desktop). NOTE: This website is most successfully viewed and navigated by manipulating the device so it is oriented horizontally. When the website is used further one will notice how much easier it is to view charts with the one’s data.
FIGURE 9.1: DYNAMAX MOBILE LOGIN VERTICAL ORIENTATION
FIGURE 9.2: DYNAMAX MOBILE LOGIN HORIZONTAL ORIENTATION
Orienting one’s smartphone horizontally eases navigation and enlarges graphics.
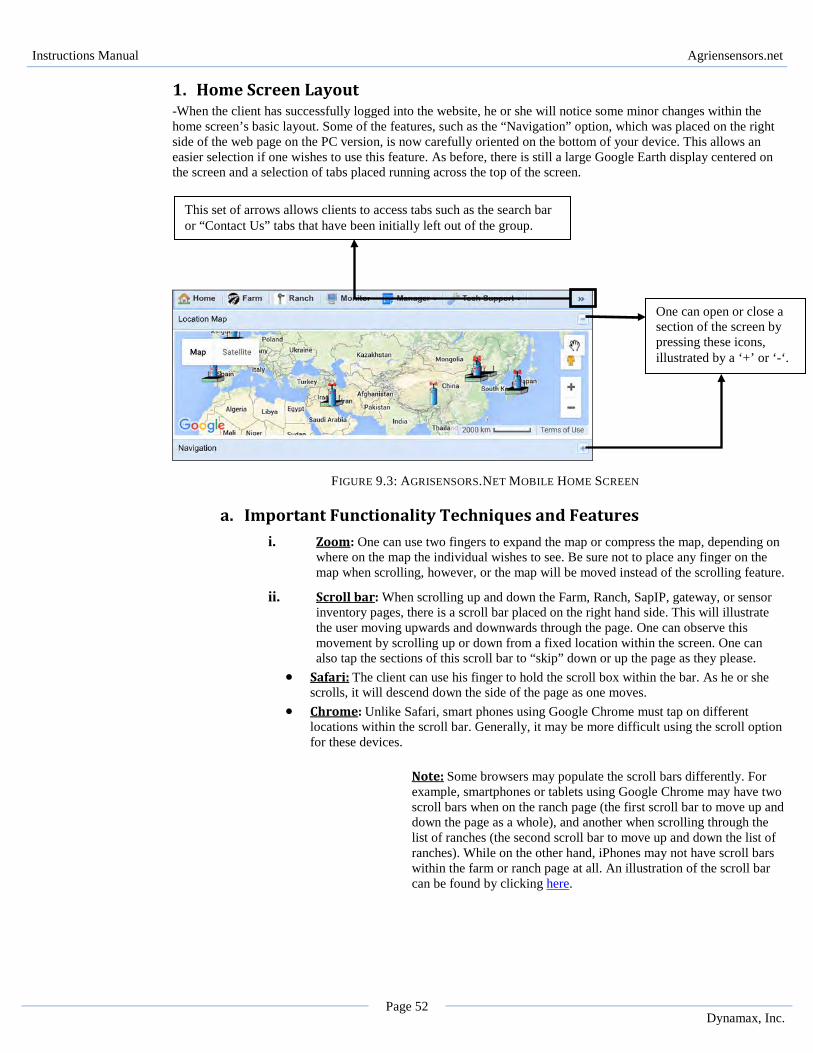
Instructions Manual Agriensensors.net
Page 52 Dynamax, Inc.
1. Home Screen Layout -When the client has successfully logged into the website, he or she will notice some minor changes within the home screen’s basic layout. Some of the features, such as the “Navigation” option, which was placed on the right side of the web page on the PC version, is now carefully oriented on the bottom of your device. This allows an easier selection if one wishes to use this feature. As before, there is still a large Google Earth display centered on the screen and a selection of tabs placed running across the top of the screen.
FIGURE 9.3: AGRISENSORS.NET MOBILE HOME SCREEN
a. Important Functionality Techniques and Features i. Zoom: One can use two fingers to expand the map or compress the map, depending on
where on the map the individual wishes to see. Be sure not to place any finger on the map when scrolling, however, or the map will be moved instead of the scrolling feature.
ii. Scroll bar: When scrolling up and down the Farm, Ranch, SapIP, gateway, or sensor inventory pages, there is a scroll bar placed on the right hand side. This will illustrate the user moving upwards and downwards through the page. One can observe this movement by scrolling up or down from a fixed location within the screen. One can also tap the sections of this scroll bar to “skip” down or up the page as they please.
• Safari: The client can use his finger to hold the scroll box within the bar. As he or she scrolls, it will descend down the side of the page as one moves.
• Chrome: Unlike Safari, smart phones using Google Chrome must tap on different locations within the scroll bar. Generally, it may be more difficult using the scroll option for these devices.
Note: Some browsers may populate the scroll bars differently. For example, smartphones or tablets using Google Chrome may have two scroll bars when on the ranch page (the first scroll bar to move up and down the page as a whole), and another when scrolling through the list of ranches (the second scroll bar to move up and down the list of ranches). While on the other hand, iPhones may not have scroll bars within the farm or ranch page at all. An illustration of the scroll bar can be found by clicking here.
One can open or close a section of the screen by pressing these icons, illustrated by a ‘+’ or ‘-‘.
This set of arrows allows clients to access tabs such as the search bar or “Contact Us” tabs that have been initially left out of the group.
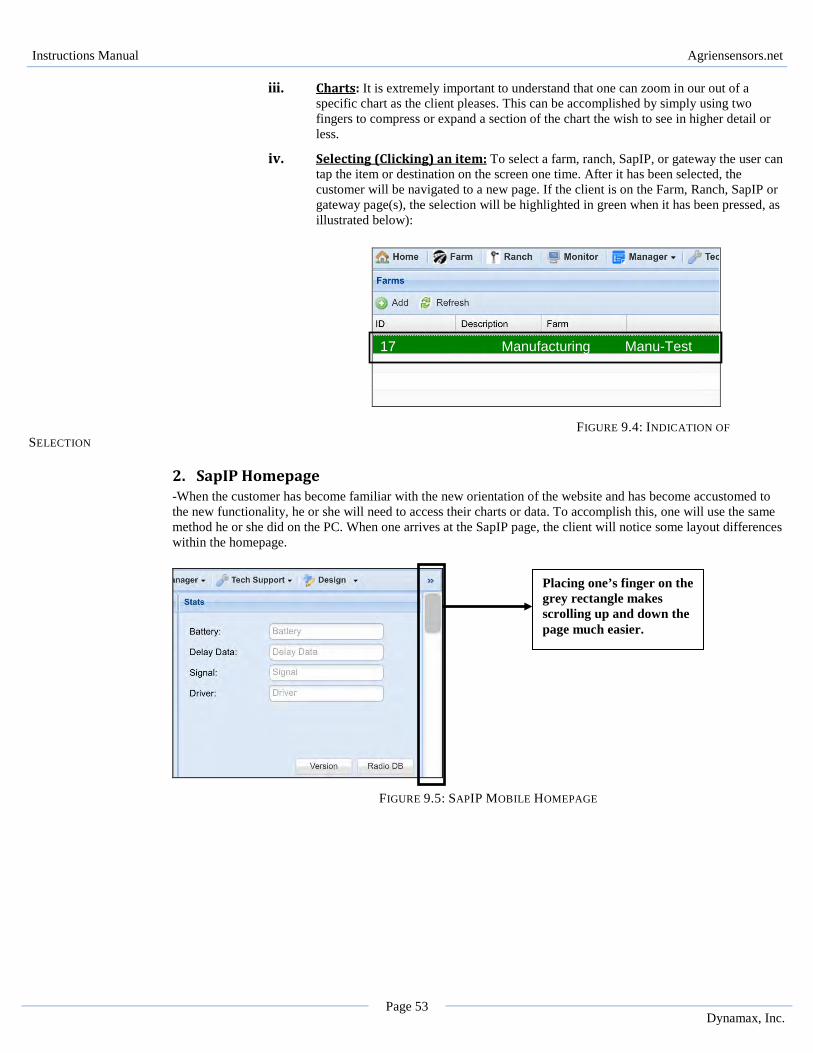
Instructions Manual Agriensensors.net
Page 53 Dynamax, Inc.
iii. Charts: It is extremely important to understand that one can zoom in our out of a specific chart as the client pleases. This can be accomplished by simply using two fingers to compress or expand a section of the chart the wish to see in higher detail or less.
iv. Selecting (Clicking) an item: To select a farm, ranch, SapIP, or gateway the user can tap the item or destination on the screen one time. After it has been selected, the customer will be navigated to a new page. If the client is on the Farm, Ranch, SapIP or gateway page(s), the selection will be highlighted in green when it has been pressed, as illustrated below):
FIGURE 9.4: INDICATION OF SELECTION
2. SapIP Homepage -When the customer has become familiar with the new orientation of the website and has become accustomed to the new functionality, he or she will need to access their charts or data. To accomplish this, one will use the same method he or she did on the PC. When one arrives at the SapIP page, the client will notice some layout differences within the homepage.
FIGURE 9.5: SAPIP MOBILE HOMEPAGE
17 Manufacturing Manu-Test
Placing one’s finger on the grey rectangle makes scrolling up and down the page much easier.
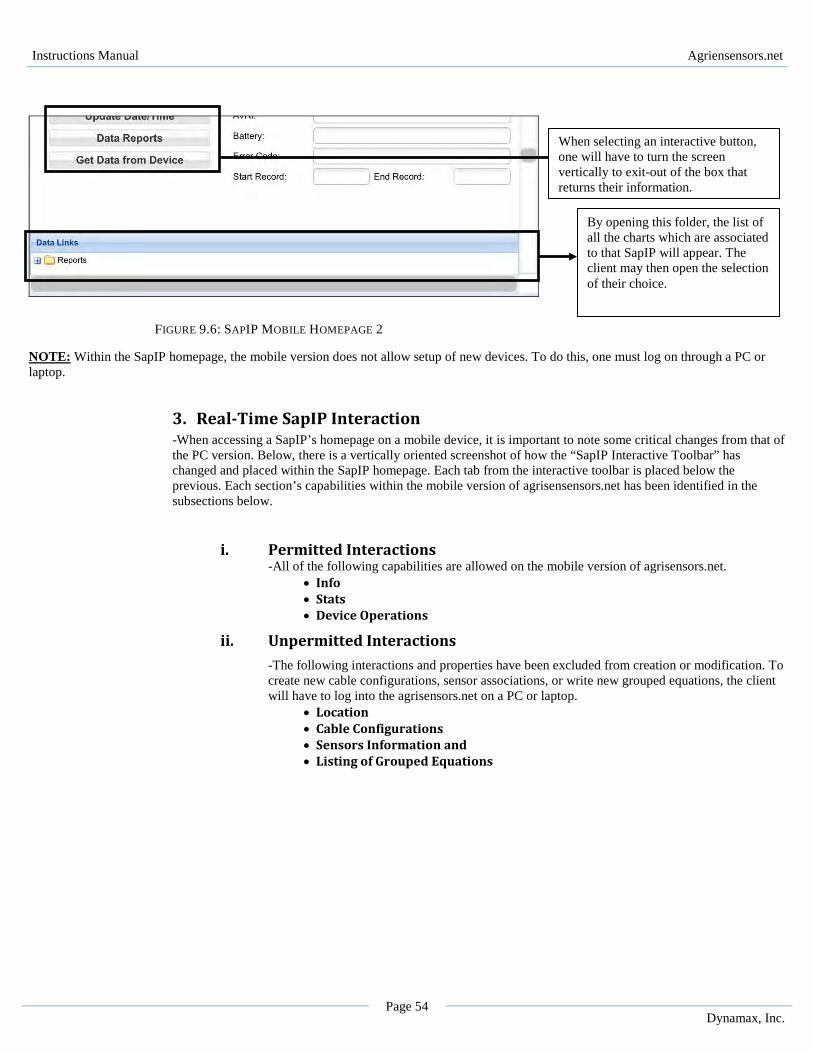
Instructions Manual Agriensensors.net
Page 54 Dynamax, Inc.
FIGURE 9.6: SAPIP MOBILE HOMEPAGE 2 NOTE: Within the SapIP homepage, the mobile version does not allow setup of new devices. To do this, one must log on through a PC or laptop.
3. Real-Time SapIP Interaction -When accessing a SapIP’s homepage on a mobile device, it is important to note some critical changes from that of the PC version. Below, there is a vertically oriented screenshot of how the “SapIP Interactive Toolbar” has changed and placed within the SapIP homepage. Each tab from the interactive toolbar is placed below the previous. Each section’s capabilities within the mobile version of agrisensensors.net has been identified in the subsections below.
i. Permitted Interactions -All of the following capabilities are allowed on the mobile version of agrisensors.net.
• Info • Stats • Device Operations
ii. Unpermitted Interactions -The following interactions and properties have been excluded from creation or modification. To create new cable configurations, sensor associations, or write new grouped equations, the client will have to log into the agrisensors.net on a PC or laptop.
• Location • Cable Configurations • Sensors Information and • Listing of Grouped Equations
By opening this folder, the list of all the charts which are associated to that SapIP will appear. The client may then open the selection of their choice.
When selecting an interactive button, one will have to turn the screen vertically to exit-out of the box that returns their information.
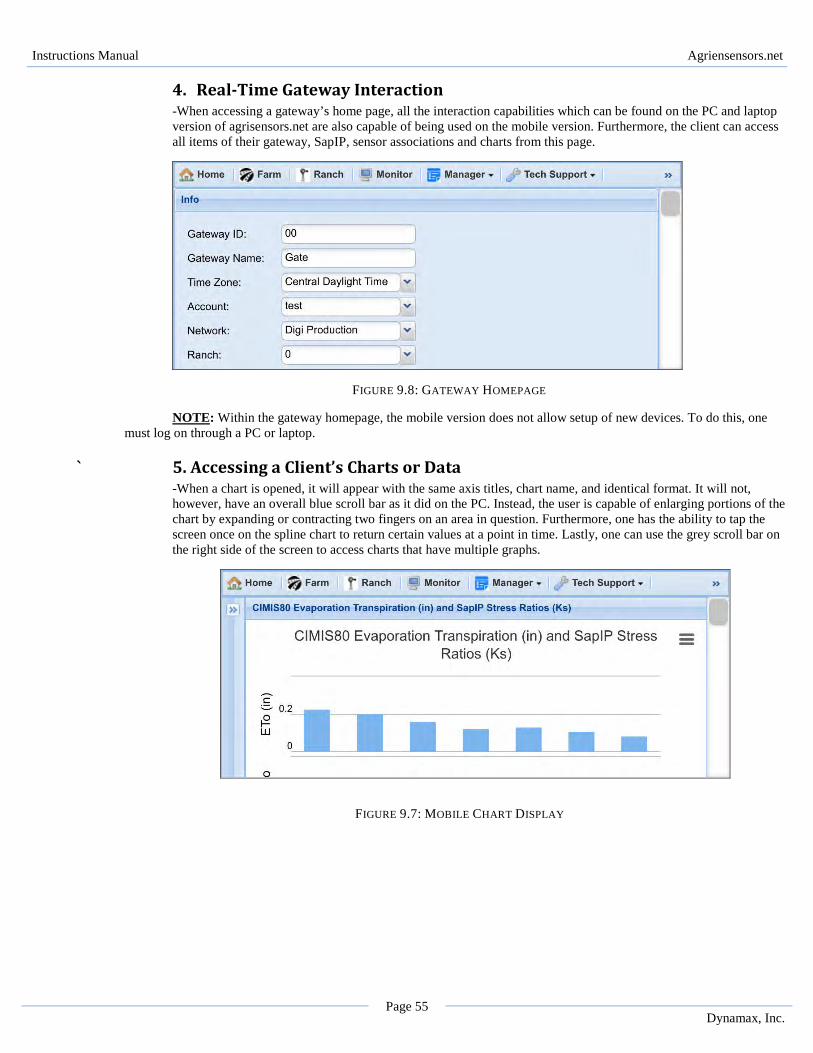
Instructions Manual Agriensensors.net
Page 55 Dynamax, Inc.
4. Real-Time Gateway Interaction -When accessing a gateway’s home page, all the interaction capabilities which can be found on the PC and laptop version of agrisensors.net are also capable of being used on the mobile version. Furthermore, the client can access all items of their gateway, SapIP, sensor associations and charts from this page.
FIGURE 9.8: GATEWAY HOMEPAGE
NOTE: Within the gateway homepage, the mobile version does not allow setup of new devices. To do this, one must log on through a PC or laptop.
` 5. Accessing a Client’s Charts or Data -When a chart is opened, it will appear with the same axis titles, chart name, and identical format. It will not, however, have an overall blue scroll bar as it did on the PC. Instead, the user is capable of enlarging portions of the chart by expanding or contracting two fingers on an area in question. Furthermore, one has the ability to tap the screen once on the spline chart to return certain values at a point in time. Lastly, one can use the grey scroll bar on the right side of the screen to access charts that have multiple graphs.
FIGURE 9.7: MOBILE CHART DISPLAY
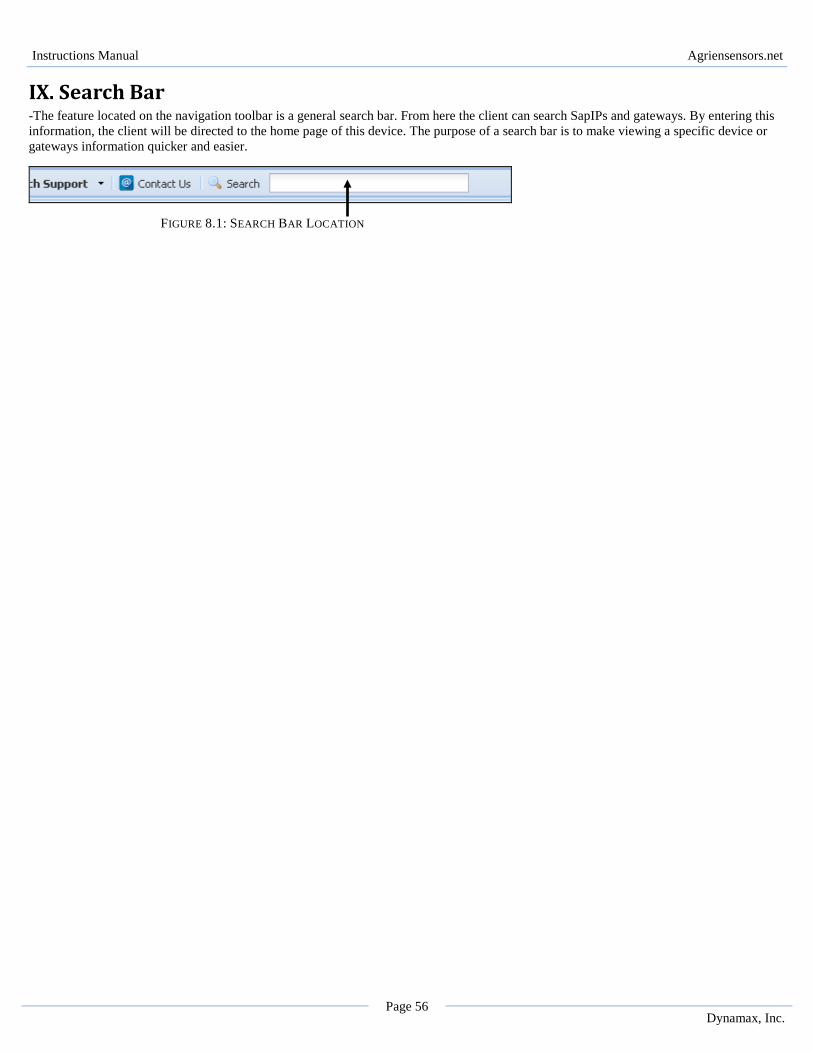
Instructions Manual Agriensensors.net
Page 56 Dynamax, Inc.
IX. Search Bar -The feature located on the navigation toolbar is a general search bar. From here the client can search SapIPs and gateways. By entering this information, the client will be directed to the home page of this device. The purpose of a search bar is to make viewing a specific device or gateways information quicker and easier.
FIGURE 8.1: SEARCH BAR LOCATION