Embed Size (px)
Citation preview

PEAKFQ DRAFT - 1/30/98
Users Manual for Program PEAKFQ,Annual Flood Frequency Analysis UsingBulletin 17B Guidelines
U.S. Geological SurveyWater-Resources Investigations Report _______
DRAFT
SUBJECT TO REVISION

PEAKFQ DRAFT - 1/30/98
Users Manual for Program PEAKFQ,Annual Flood Frequency Analysis UsingBulletin 17B Guidelines
By WILBERT O. THOMAS, JR., ALAN M. LUMB,KATHLEEN M. FLYNN, and WILLIAM H. KIRBY
U.S. GEOLOGICAL SURVEYWATER-RESOURCES INVESTIGATIONS REPORT _________
PEAKFQ DRAFT - 1/30/98
U.S. DEPARTMENT OF THE INTERIOR
BRUCE BABBITT, Secretary
U.S. GEOLOGICAL SURVEY
_____________________, Director
Any use of trade, product, or firm names in this publication is fordescriptive purposes only and does not imply endorsement bythe U.S. Government.
________________________________________________________________________________
For additional information, write to:
Chief, Office of Surface Water415 National CenterU.S. Geological SurveyReston, Virginia 22092

PEAKFQ iii DRAFT - 1/30/98
CONTENTSSymbols............................................................................................................................................................ vAbstract ............................................................................................................................................................ 1Introduction ...................................................................................................................................................... 1Peak Streamflow Records ................................................................................................................................ 1Principles of Computation ............................................................................................................................... 3
Systematic Record Analysis ..................................................................................................................... 3Outlier and Historic Record Tests............................................................................................................. 5Historic Record Adjustment ..................................................................................................................... 6Conditional Probability Adjustment ......................................................................................................... 9Estimation of Generalized Skew Coefficient.......................................................................................... 10Computation of Weighted Skew Coefficient.......................................................................................... 11Expected Probability Adjustment ........................................................................................................... 12Confidence Limits................................................................................................................................... 13
Computer Program PEAKFQ ........................................................................................................................ 15Example: wdm input
Opening Screen................................................................................................................................ 43Input................................................................................................................................................. 43Output .............................................................................................................................................. 47Modify ............................................................................................................................................. 49Start.................................................................................................................................................. 52
Example: ascii inputOpening Screen................................................................................................................................ 59Input................................................................................................................................................. 59Output .............................................................................................................................................. 61Start.................................................................................................................................................. 64Modify ............................................................................................................................................. 65
Program Diagnostics............................................................................................................................... 76References Cited ............................................................................................................................................ 77Appendix A. Description of the AIDE Character-Based User Interface ....................................................... 78Appendix B.1. Station Header Records ......................................................................................................... 80Appendix B.2. Station Option Records.......................................................................................................... 81Appendix B.3. Peak-Flow Records................................................................................................................ 83Appendix C. Data-Set Attributes ................................................................................................................... 86
FIGURES
1. General Flow Chart for Bulletin 17B Flood Frequency Computations ....................................................... 42. Definition Sketch Showing Time Periods and Discharges Used in Historic Record Adjustment............... 73. Structure of the PEAKFQ Program ........................................................................................................... 154. Example of Output from PEAKFQ for the Fishkill Creek at Beacon, New York..................................... 175. Example of Output from PEAKFQ for the Floyd River at James, Iowa ................................................... 226. Example of Output from PEAKFQ for the Back Creek near Jones Springs, West Virginia..................... 277. Example of Output from PEAKFQ for the Orestimba Creek near Newman, California .......................... 328. Example of Output from PEAKFQ for the Sugar Creek at Crawfordsville, Indiana ................................ 37A.1. Basic PEAKFQ Screen Layout .............................................................................................................. 79
TABLES
1. Streamflow-qualification Codes for Peak Streamflow ................................................................................ 21.a. Correspondence between qualification codes in the peak-flow file and in the peakfq program and
how peakfq handles the associate peaks ................................................................................................... 32. Outlier Test Values............................................................................................................................... 6
3. Symptoms and Courses of Action for Troubleshooting PEAKFQ ............................................................ 59C.1. Attributes associated with annual peak-flow data sets ........................................................................... 86C.2. Sources of attributes associated with peak-flow data sets...................................................................... 89
KN

PEAKFQ iv DRAFT - 1/30/98
CONVERSION FACTORS
Multiply By To obtain
foot (ft) 0.3048 meter (m)
mile (mi) 1.609 kilometer (km)
square mile (mi2) 2.590 square kilometer (km2)
cubic foot (ft3) 0.0283 cubic meter (m3)
cubic foot per second (ft3/s) 0.0283 cubic meter per second (m3/s)

PEAKFQ v DRAFT - 1/30/98
SYMBOLS
Symbol, explanation:
, centroidal position occupied by m-th largest observed peak
, generalized skew coefficient
, historically-adjusted skew coefficient
, skew coefficient of frequency curve passing through , , and
, absolute value of the station skew coefficient
G, station skew coefficient
, Bulletin 17B skew coefficient estimate used in final log-Pearson Type III frequency curve
g, desired skew coefficient
H, historical period length
K, confidence coefficient
, 10 percent significance level outlier tests KN values for a normal distribution for sample size N
, Pearson Type III standardized ordinates for desired skew (g) and exceedance probability (p)
, standard normal frequency factor for probability p
, frequency factor after adjustment with Student-t
, historically-weighted logarithmic mean
, Bulletin 17B mean
, mean of frequency curve passing through , , and
, historically-weighted rank of the m-th largest observed peak
m, rank of the m-th largest observed peak
MSE, mean-square error (standard error of estimate squared)
, mean-square error of generalized skew coefficient
, mean-square error of station skew coefficient
, effective number of peaks above flood base,
, number of peaks below the flood base, including any zeros and low outliers
, number of high outliers
, number of historic peaks
, number of systematic peaks
, number of peaks between and
cm
G
G
G′ Q∗0.50 Q∗
0.10 Q∗0.01
G
GW
KN
kg p,
kp
kp′
M
M
M′ Q∗0.50 Q∗
0.10 Q∗0.01
m
MSEG
MSEG
N QO
NBB
NHO
NHP
NS
NX QO QH

PEAKFQ vi DRAFT - 1/30/98
n, sample size from normal population of flood logarithms
, probability plotting position of the m-th ranked observed peak
, estimated probability of exceeding the flood base
p, exceedance probability
, normal exceedance probability corresponding to
, conditional frequency curve describing only those peaks above a base
, intermediate unconditional frequency curve
, final Bulletin 17B-estimated frequency curve
, historical threshold streamflow
, flood base streamflow
, systematic frequency curve
S, sample logarithmic standard deviation
, Bulletin 17B standard deviation
, historically-weighted logarithmic standard deviation
, standard deviation of frequency curve passing through , , and
, student's t with n-1 degrees of freedom and exceedance probability p
W, weight given to systematic peaks
, logarithmic magnitudes of historic peaks and high outliers
, sample logarithmic mean
X, logarithmic magnitudes of systematic peaks between QO and QH
, confidence limit
, population skew coefficient
µ, population mean
, population standard deviation
Note: All symbols and explanations from Interagency Advisory Committee on Water Data (1982) and Lepkin and
others (1979).
Pm
PO
p′ kp′
Q
Q∗
Q
QH
QO
Qs
S
S
S′ Q∗0.50 Q∗
0.10 Q∗0.01
tn 1 p,–
X′
X
α
γ
σ

PEAKFQ 1 DRAFT - 1/30/98
Users Manual for Program PEAKFQ, Annual FloodFrequency Analysis Using Bulletin 17B Guidelines
By Wilbert O. Thomas, Jr., Alan M. Lumb, Kathleen M. Flynn, and William H. Kirby
Abstract
Estimates of flood flows having given recurrence intervals or probabilities of exceedance are neededfor design of hydraulic structures and floodplain management. Program PEAKFQ provides estimates ofinstantaneous annual peak flows having recurrence intervals of 2, 5, 10, 25, 50, 100, 200, and 500 years(exceedance probabilities of 0.50, 0.20, 0.10, 0.04, 0.02, 0.01, 0.005, and 0.002, respectively). Asimplemented in program PEAKFQ, the Pearson Type III frequency distribution is fit to the logarithms ofinstantaneous annual peak flows following Bulletin 17B guidelines of the Interagency Advisory Committeeon Water Data. The parameters of the Pearson Type III frequency curve are estimated by the logarithmicsample moments (mean, standard deviation, and coefficient of skewness). This documentation provides anoverview of the computational procedures in program PEAKFQ, provides a description of the programmenus, and provides an example of the output from the program.
INTRODUCTION
Program PEAKFQ performs statistical flood-frequency analyses of annual-peak flows followingprocedures recommended in Bulletin 17B of the Interagency Advisory Committee on Water Data (1982).The Bulletin 17B guidelines contain a complete and definitive description of the recommended procedures.The following sections document implementation of the Bulletin 17B guidelines in program PEAKFQ. Thisinformation is intended to assist the user with options to the program.
The Bulletin 17B procedures characterize the magnitude and frequency of instantaneous annual peakflows at gaging stations where these data are observed. The magnitudes of the annual events are assumed tobe independent random variables following a log-Pearson Type III probability distribution; that is, thelogarithms of the peak flows follow a Pearson Type III distribution. This distribution defines the probabilitythat any single annual peak will exceed a specified streamflow. Given this annual probability, otherprobabilities, such as the probability that a future design period will be free of exceedances, can becalculated by standard methods. By considering only annual events, the Bulletin 17B guidelines reduce thepeak-streamflow frequency problem to the problem of estimating the needed design floods using the recordof annual peak flows at the site. The parameters of the Pearson Type III frequency curve are estimated fromthe logarithmic sample moments (mean, standard deviation, and coefficient of skewness). The neededdesign floods are estimated from this frequency curve computed by program PEAKFQ.
PEAK STREAMFLOW RECORDS
The peak data fall into two classes: systematic and historic. The systematic record includes all annualpeaks observed in the course of one or more systematic gaging programs at the site. In a systematic gagingprogram, the annual peak is observed (or estimated) for each year of the program. Several systematicrecords at one site can be combined, provided that the hydrologic conditions during the periods of recordare comparable. The gaps between distinct systematic-record periods can be ignored, provided that the lackof record in the interim was unrelated to the hydrologic conditions. Thus, if a flood record was interruptedfor lack of funds for data collection, the interruption could be ignored and the available data could be usedas if no interruption had occurred. On the other hand, if the record was interrupted because of prolonged

PEAKFQ 2 DRAFT - 1/30/98
drought or excessive floodings, the interruption should not be ignored but rather should be used, if possible,as evidence for adding one or more estimated peaks to the systematic record. Thus, the systematic record isintended to constitute an unbiased and representative sample of the population of all possible annual peaksat the site.
In contrast to the systematic record, the historic record consists of annual peaks that would not havebeen observed except for evidence indicating their unusual magnitude. Flood information acquired from oldnewspaper articles, letters, personal recollections, and other historical sources almost invariably refer tofloods of noteworthy, and hence, extraordinary size. Similarly, the very existence of an indirect streamflowdetermination outside a period of systematic record suggests that the determination was made because anunusually large streamflow had occurred. Thus, historic records, by the conditions of their collection, forma biased and unrepresentative sample of flood experience. Despite this bias, however, the historic record canbe used to supplement the systematic record provided that all historic peaks above some historic thresholdhave been recorded.
The systematic record may contain one or more peaks for which historic information is available orwhich exceed the smaller historic peaks. Such peaks are called high outliers. They are used as part of thesystematic record but also are treated like historic peaks in the historic-record adjustment procedure.
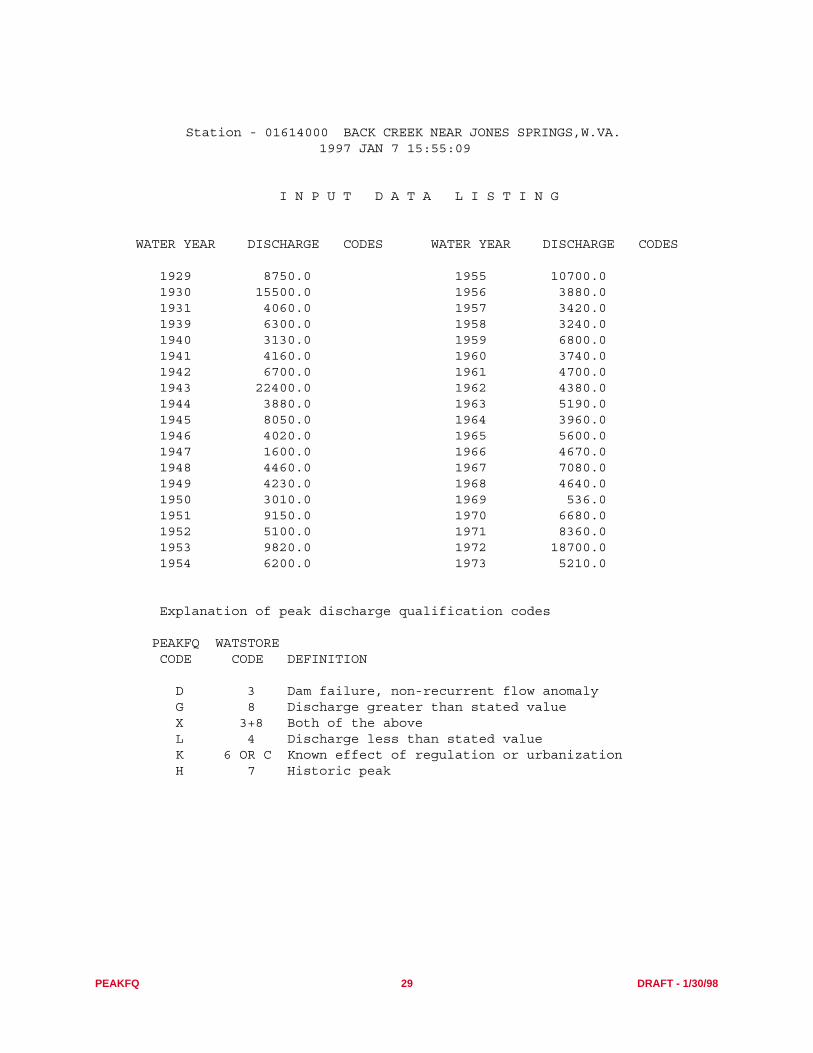
The U.S. Geological Survey maintains a peak flow data base. In the past, these data were stored inthe WATSTORE peak flow file. The data are now maintained in the National Water Information System database. Qualification codes may be assigned to some peaks, identifying (1) basin or environmental conditionsthat may have affected the magnitude or accuracy of the streamflow value or (2) historical peaks. Forexample, if the peak is too small to measure, then an estimate of lower bound on the magnitude may bestored (this might occur during a drought period when the actual peak was less than the gage could record).In this case, the peak-flow file would contain a qualification code of 4 (Lepkin and others, 1979) associatedwith the peak. Note that an individual peak flow can have more than one qualification code associated withit. Table 1 contains a description of the qualification codes that can be found in the peak-flow file. To makethings interesting, peakfq recognizes a subset of peak-flow-file qualification codes and uses a different codeto identify these peaks. Table 1a defines the correspondence between the peakfq and peak-flow-filequalification codes and briefly describes how the peakfq program handles the associated peaks.
Table 1. Streamflow-qualification codes for peak streamflow
Streamflowqualification
codeDefinition
1 Streamflow is a maximum daily average.
2 Streamflow is an estimate.
3 Streamflow affected by dam failure.
4 Streamflow less than indicated value, which is minimum recordable value at this site.
5 Streamflow affected to an unknown degree by regulation or diversion
6 Streamflow affected by regulation. At least 10 percent of basin controlled by reservoirs.
7 Streamflow is an historic peak.
8 Streamflow actually greater than indicated value.
9 Streamflow due to snow melt, hurricane, ice-jam or debris dam breakup.
A Year of occurrence is unknown or not exact.
B Month or day of occurrence is unknown or not exact.
C All or part of the record affected by urbanization, mining, agricultural changes, channelization, or otheractivity. The urbanized basins contain at least 10 percent impervious cover.
E Only peak streamflow recorded for this year.

PEAKFQ 3 DRAFT - 1/30/98
PRINCIPLES OF COMPUTATION
The Bulletin 17B computational analysis is illustrated in figure 1. The following sections provide anoverview of the major computational steps.
FIGURE 1 NEAR HERE
Systematic Record Analysis
The systematic record analysis involves the computation of the mean, standard deviation andcoefficient of skewness ( , S, and G, respectively) of the common logarithms of the annual peak flows inthe systematic record. At some sites, annual peaks of magnitude zero can occur; more generally, the annualpeak may occasionally fall below or be equal to some lower limit of measurement called the gage base(which may be zero). To account for this possibility, the number of peaks below the gage base is computedin addition to the mean, standard deviation, and skewness of the logarithms of the above-base systematicpeaks. The statistics of the systematic peaks and the number of peaks below the gage base are used tocompute the systematic record frequency curve as follows:
log + S (1)
where = systematic frequency curve at exceedance probability p, and
= the Pearson Type III standardized ordinates for station skew (G) and exceedance
probability p.
Table 1a. Correspondence between qualification codes in the peak-flow file and in the peakfq program and howpeakfq handles the associated peaks
peakfqprogram
Peak-flowfile
Description
D 3 dam failure
Peak excluded from analysis.
X 3 and 8 dam failure and discharge greater than stated
Peak excluded from analysis.
K 6 or C known effect of regulation or urbanization
By default, peakfq excludes peaks with qualification codes of 6 or C. The user mayinclude these peaks by specifying YES under the "Include urban-regulated peaks"column on the Modify/Options menu.
H 7 historic peak
By default, peakfq will include or exclude peaks with qualification code of 7 based onthe Bulletin 17-B computed high-outlier threshold and the length of the historicperiod. The user can modify these criteria by specifying the "Historic return period"and "Discharge threshold" on the Modify/Historic menu and the "Low outlier criteria"on the Modify/Low menu.
- 1, 2, 4,5, 9, A,B, or E
maximum daily average, estimate, less than indicated value, unknown regulation ordiversion, snowmelt/hurricane/ice-jam/debris dam breakup, year unknown or not exact,month or day unknown
Peak always included in analysis.
X
Qs p, X= kG p,
Qs p,
kG p,

PEAKFQ 4 DRAFT - 1/30/98
Figure 1. General flow chart for Bulletin 17B flood-frequency computations (modified from Interagency AdvisoryCommittee on Water Data, 1982).
Begin
Systematic recordanalysis
End
StationskewLow
outliers
Historicpeaks/high
outliers
Recomputestatistics
without low
Historicpeaks/high
outliers
Historicpeaks/high
outliers
Lowoutliers
Lowoutliers
outliers
Recompute statisticsadjusted for
historic peaks/high outliers
Recomputestatistics
without lowoutliers
Recompute statisticsadjusted for
historic peaks/high outliers
Recomputestatistics
without lowoutliers
Conditionalprobabilityadjustment
Lowoutliersomitted
Determine weighted skewCompute final frequency curve
No G<-0.4 G>0.4 No
-0.4<G<0.4Yes Yes
No NoNo
YesYes Yes
No
Yes
Yes
No
Compute confidence limitsCompute expected probability curve
G

PEAKFQ 5 DRAFT - 1/30/98
The systematic record frequency curve is an initial estimate of the Bulletin 17B frequency curve,
which is recomputed as the systematic statistics are modified for outlier and historic data adjustments.
Outlier and Historic Record Tests
The next step in the analysis is to detect and make appropriate adjustments for low outliers, high
outliers, and historic peaks. The sequence of these tests and adjustments depend on the station skew
coefficient, G, computed in the first step. Because a relatively large skew coefficient of either sign (G > 0.4
or G < -0.4) is likely to be caused by an outlier on the corresponding end of the sample, this possibility is
checked first and any necessary adjustment is applied before checking for outliers on the other end. If the
skew coefficient is of relative moderate size (-0.4 < G < 0.4), the existence of both high and low outliers can
be checked before applying any adjustments. Program PEAKFQ tests for low outliers using the following
equation:
= - S (2)
where = low outlier threshold in log units, and
= 10 percent significance levels values for normal distribution for sample size N (see table 2).
The frequency curve is automatically adjusted for the effect of low outliers using the conditional
probability adjustment described later.
High outliers also are tested for but no adjustment can be applied unless the user supplies necessary
information about the length of the historic period and the high outlier threshold. The equation for detecting
high outliers is as follows:
= + S (3)
where = high outlier threshold in log units. Program PEAKFQ does not automatically use the high
outlier threshold ( ) in the analysis.
If an adjustment for historic data has previously been made, then the following equation is used to
detect low outliers:
= - (4)
where = low outlier threshold in log units,
= historically-weighted logarithmic mean, and
= historically-weighted logarithmic standard deviation.
The computation of and is described in the next section.
XL X KN
XL
KN
XH X KN
XHXH
XL M KH S
XL
M
S
M S

PEAKFQ 6 DRAFT - 1/30/98
Historic Record Adjustment
The recalculation of the statistics of the above-base peaks is required after the detection of outliers or
historic information. It takes into account any zero flows or below-gage-base peaks, low outliers, high
outliers, and historic peaks that have been detected, as specified in Appendix 6 of Bulletin 17B. The logical
basis for the calculation is the following:
Historic adjustment criterion: Every annual peak that exceeded some historic threshold streamflow
( ) during the historic period (H) has been recorded as either a historic peak or a systematic peak (high
outlier). In other words, the record is complete for peaks above during the time period H. The historic
period H includes the systematic record period plus one or more years that have no systematic record. This
criterion implies that the unrecorded portion of the historic period contains only peaks below the threshold
Table 2.--Outlier test KN valuesThe table below contains one-sided 10 percent significance level KN values for a normal distribution (InteragencyAdvisory Committee on Water Data, 1982, after Grubbs and Beck, 1972).
Sample size KN value Sample size KN value Sample size KN value Sample size KN value
10 2.036 45 2.727 80 2.940 115 3.06411 2.088 46 2.736 81 2.945 116 3.06712 2.134 47 2.744 82 2.949 117 3.07013 2.175 48 2.753 83 2.953 118 3.07314 2.213 49 2.760 84 2.957 119 3.07515 2.247 50 2.768 85 2.961 120 3.07816 2.279 51 2.775 86 2.966 121 3.08117 2.309 52 2.783 87 2.970 122 3.08318 2.335 53 2.790 88 2.973 123 3.08619 2.361 54 2.798 89 2.977 124 3.08920 2.385 55 2.804 90 2.981 125 3.09221 2.408 56 2.811 91 2.984 126 3.09522 2.429 57 2.818 92 2.989 127 3.09723 2.448 58 2.824 93 2.993 128 3.10024 2.467 59 2.831 94 2.996 129 3.10225 2.486 60 2.837 95 3.000 130 3.10426 2.502 61 2.842 96 3.003 131 3.10727 2.519 62 2.849 97 3.006 132 3.10928 2.534 63 2.854 98 3.011 133 3.11229 2.549 64 2.860 99 3.014 134 3.11430 2.563 65 2.866 100 3.017 135 3.11631 2.577 66 2.871 101 3.021 136 3.11932 2.591 67 2.877 102 3.024 137 3.12233 2.604 68 2.883 103 3.027 138 3.12434 2.616 69 2.888 104 3.030 139 3.12635 2.628 70 2.893 105 3.033 140 3.12936 2.639 71 2.897 106 3.037 141 3.13137 2.650 72 2.903 107 3.040 142 3.13338 2.661 73 2.908 108 3.043 143 3.13539 2.671 74 2.912 109 3.046 144 3.13840 2.682 75 2.917 110 3.049 145 3.14041 2.692 76 2.922 111 3.052 146 3.14242 2.700 77 2.927 112 3.055 147 3.14443 2.710 78 2.931 113 3.058 148 3.14644 2.719 79 2.935 114 3.061 149 3.148
QHQH
PEAKFQ 7 DRAFT - 1/30/98
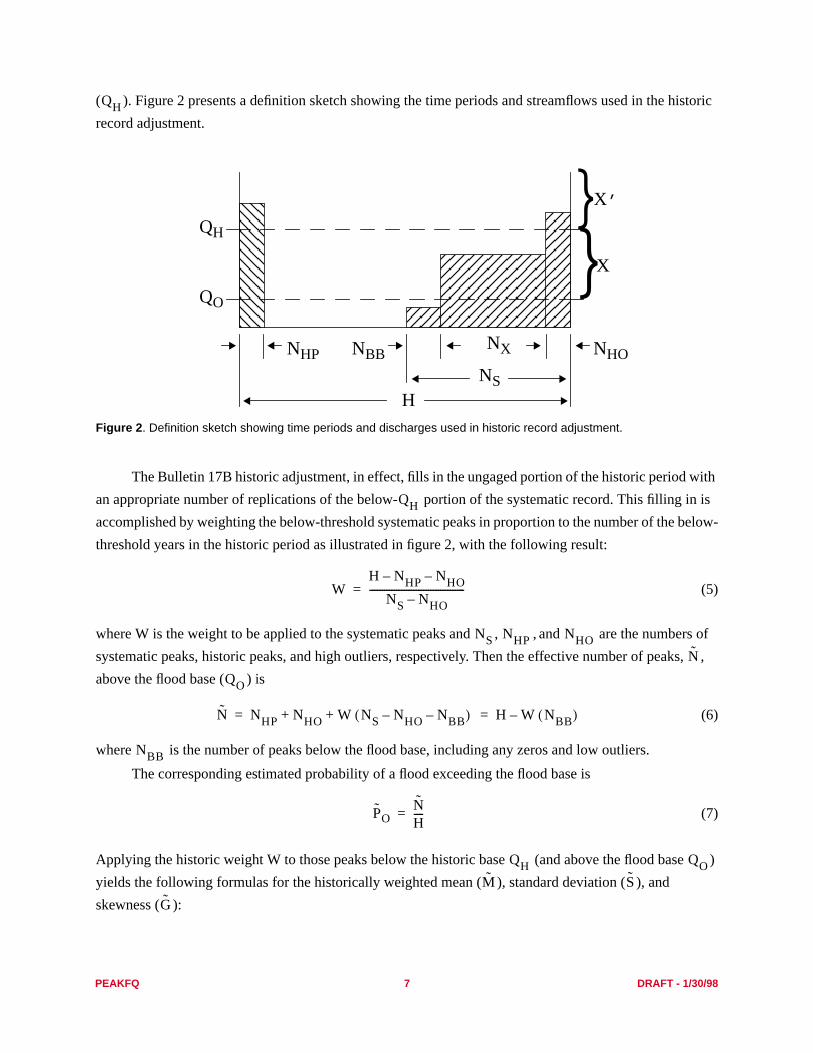
( ). Figure 2 presents a definition sketch showing the time periods and streamflows used in the historic
record adjustment.
Figure 2. Definition sketch showing time periods and discharges used in historic record adjustment.
The Bulletin 17B historic adjustment, in effect, fills in the ungaged portion of the historic period with
an appropriate number of replications of the below- portion of the systematic record. This filling in is
accomplished by weighting the below-threshold systematic peaks in proportion to the number of the below-
threshold years in the historic period as illustrated in figure 2, with the following result:
(5)
where W is the weight to be applied to the systematic peaks and , , and are the numbers of
systematic peaks, historic peaks, and high outliers, respectively. Then the effective number of peaks, ,
above the flood base ( ) is
(6)
where is the number of peaks below the flood base, including any zeros and low outliers.
The corresponding estimated probability of a flood exceeding the flood base is
(7)
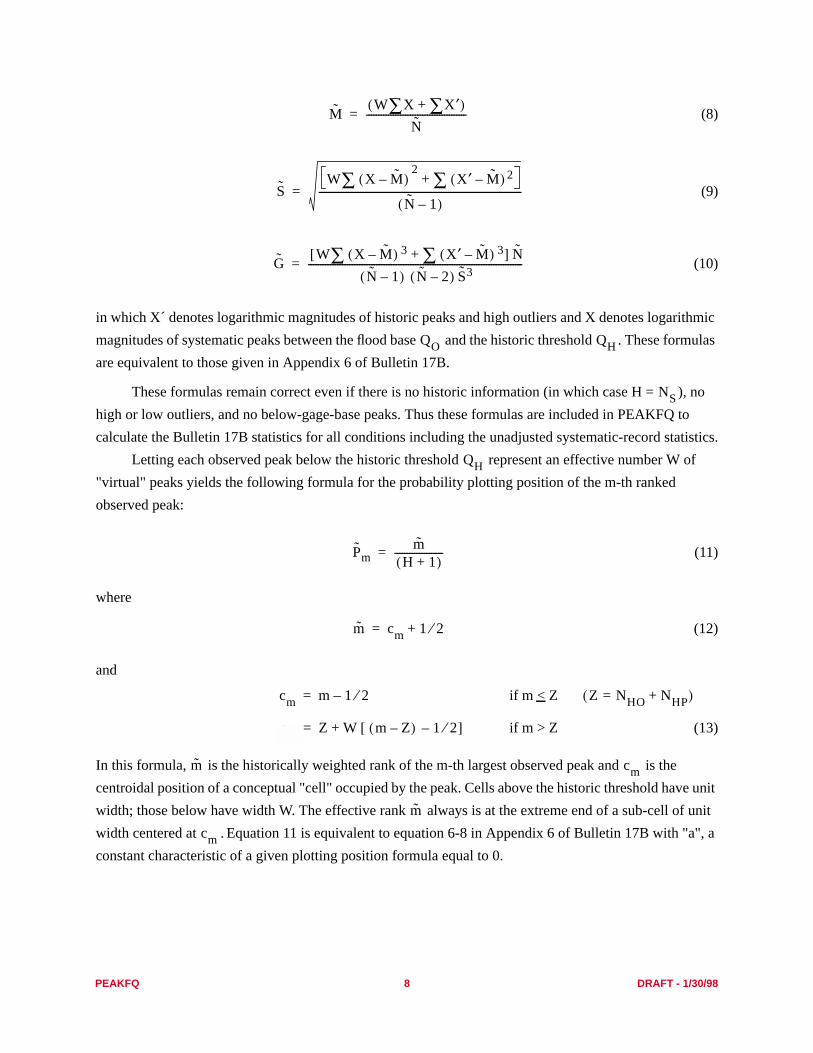
Applying the historic weight W to those peaks below the historic base (and above the flood base )
yields the following formulas for the historically weighted mean ( ), standard deviation ( ), and
skewness ( ):
QH
QH
QO
}X’
}X
NHONBBNHP
HNS
NX
QH
WH NHP– NHO–
NS NHO–---------------------------------------=
NS NHP NHON
QO
N NHP NHO W NS NHO NBB––( )+ + H W NBB( )–= =
NBB
PONH----=
QH QOM S
G
PEAKFQ 8 DRAFT - 1/30/98
(8)
(9)
(10)
in which X´ denotes logarithmic magnitudes of historic peaks and high outliers and X denotes logarithmic
magnitudes of systematic peaks between the flood base and the historic threshold . These formulas
are equivalent to those given in Appendix 6 of Bulletin 17B.
These formulas remain correct even if there is no historic information (in which case H = ), no
high or low outliers, and no below-gage-base peaks. Thus these formulas are included in PEAKFQ to
calculate the Bulletin 17B statistics for all conditions including the unadjusted systematic-record statistics.
Letting each observed peak below the historic threshold represent an effective number W of
"virtual" peaks yields the following formula for the probability plotting position of the m-th ranked
observed peak:
(11)
where
(12)
and
if m < Z
if m > Z (13)
In this formula, is the historically weighted rank of the m-th largest observed peak and is the
centroidal position of a conceptual "cell" occupied by the peak. Cells above the historic threshold have unit
width; those below have width W. The effective rank always is at the extreme end of a sub-cell of unit
width centered at . Equation 11 is equivalent to equation 6-8 in Appendix 6 of Bulletin 17B with "a", a
constant characteristic of a given plotting position formula equal to 0.
MW X∑ X∑ ′+( )
N-----------------------------------------=
SW X M–( )
2∑ X′ M–( )∑ 2+
N 1–( )-----------------------------------------------------------------------------------=
GW X M–( )∑ 3 X′ M–( )∑ 3+[ ] N
N 1–( ) N 2–( ) S3----------------------------------------------------------------------------------------=
QO QH
NS
QH
Pmm
H 1+( )--------------------=
m cm 1 2⁄+=
cm m 1 2⁄–= Z NHO NHP+=( )
cm Z W m Z–( ) 1 2⁄–[ ]+=
m cm
m
cm

PEAKFQ 9 DRAFT - 1/30/98
Conditional Probability Adjustment
After the peak-streamflow frequency curve parameters have been determined, the historically-
weighted frequency curve can be tabulated. If no low outliers, zero flows, or below-gage-base peaks are
present, this process is simply a matter of looking up the Pearson Type III standardized ordinates, for
the desired skew coefficient (g) and probability (p) and computing the logarithmic frequency curve
ordinates by the formula:
(14)
When peaks below the flood base are present, however, the above calculation determines a
conditional frequency curve describing only those peaks above the base. To account for the fraction of
the population below the flood base, the following argument is used: the probability that an annual peak will
exceed a streamflow x (above the flood base) is the product of the probability that the peak will exceed the
base at all, times the conditional probability that it will exceed x, given that it exceeds the base. The first of
these factors is just the probability ; the second factor is the probability on the conditional frequency
curve at streamflow x. Thus the unconditional curve, , assigns a probability (p) to the streamflow
having probability p on the above-base curve. Conversely, an exceedance probability p on the unconditional
curve corresponds to the probability on the original above-base curve . Thus the ordinates of
the unconditional curve can be computed directly by the formula:
(15)
, , and are the logarithmic mean, standard deviation and skew coefficient of the above-base
distribution.
Because this distribution does not have the Pearson Type III shape, it is only used as an intermediate
step in constructing an equivalent Pearson Type III curve. First, the three points , and
are computed using the above formula. Then a logarithmic Pearson Type III curve is passed through these
three points; its mean, standard deviation, and skew coefficient, , , and , are found by solving the
three simultaneous equations:
(for p = 0.50, 0.10, and 0.01) (16)
An exact solution requires a laborious interpolation in the Pearson Type III tables; the Bulletin 17B
guidelines present a direct formula based on a linear approximation. Note that , , and represent
the contributions of all the observed peaks, those below the base as well as those above, whereas , ,
and did not. The resulting unconditional frequency curve, when floods below the base have been
detected, then is:
(17)
kg p,
Qplog M S kg p,( )+=
Q
PO
Q∗ PO
Q∗ p PO⁄ Q
Q∗plog M S k
G p PO⁄ ,
+=
M S G
Q∗0.50 Q∗
0.10 Q∗0.01
M′ S′ G′
M′ S′ kG′ p,
+ Q∗plog=
M′ S′ G′M S
G
Qplog M′ S′ kG′ p,
+=

PEAKFQ 10 DRAFT - 1/30/98
This defines only the part of the distribution above the flood base; the part below the flood base is not
defined, but is of no practical importance.
These conditional probability adjustments are used not only to construct the final Bulletin 17B
frequency curve but also to construct a systematic-record frequency curve that takes into account any zero
flows or below-the-gage-base peaks but does not reflect any historic information or outlier tests.
Estimation of Generalized Skew Coefficient
The skew of a frequency distribution has a tremendous effect on the resulting shape and thus the
values of the distribution. The discussion in this section concerns the development of appropriate
generalized skew coefficients for the program’s flood frequency analysis. The following discussion is
modified from Bulletin 17B (p. 10-14).
The skew coefficient of the station record (station skew coefficient, G) is sensitive to extreme events;
thus it is difficult to obtain an estimate of an accurate skew coefficient from a small sample. The accuracy
of the estimated skew coefficient can be improved by weighting the station skew coefficient with a
generalized skew coefficient estimated by pooling information from nearby sites. The following guidelines
are recommended for estimating generalized skew.
The recommended procedure for developing generalized skew coefficients requires the use of at least
40 stations, or all stations within a 100-mile radius. The stations used should have 25 or more years of
record. It is recognized that in some locations a relaxation of these criteria may be necessary. The actual
procedure includes analysis by three methods: (1) skew isolines drawn on a map; (2) skew prediction
equation; and (3) the mean skew coefficient from selected stations. Each of the methods are discussed
separately.
To develop the isoline map, plot each station skew coefficient at the centroid of its drainage basin and
examine the plotted data for any geographic or topographic trends. If a pattern is evident, then isolines are
drawn and the average of the sum of the squared differences between observed and isoline values, mean-
square error (MSE), is computed. The MSE will be used in appraising the accuracy of the isoline map. If no
pattern is evident, then an isoline map cannot be drawn and is, therefore, not further considered.
A prediction equation should be developed that would relate either the station skew coefficients or the
differences from the isoline map to predictor variables that affect the skew coefficient of the station record.
These would include watershed and climatologic variables such as drainage area, channel slope, and
precipitation characteristics. The prediction equation should preferably be used for estimating the skew
coefficient at stations with variables that are within the range of data used to calibrate the equation. The MSE
will be used to evaluate the accuracy of the prediction equation.
Determine the arithmetic mean and variance of the skew coefficients for all stations. In some cases,
the variability of the runoff regime may be so large as to preclude obtaining 40 stations with reasonably
homogeneous hydrology. In these situations, the arithmetic means and variance of about 20 stations may be
used to estimate the generalized skew coefficient. The drainage areas and meteorologic, topographic, and
geologic characteristics should be representative of the region around the station of interest.

PEAKFQ 11 DRAFT - 1/30/98
Select the method that provides the most accurate estimate of the skew coefficient. Compare the MSE
from the isoline map to the MSE for the prediction equation. The smaller MSE should then be compared to
the variance of the data. If the MSE is significantly smaller than the variance, the method with the smaller
MSE should be used and that MSE used in equation 22 to predict the weighted skew coefficient, for .
If the smaller MSE is not significantly smaller than the variance, neither the isoline map nor the prediction
equation provides a more accurate estimate of the skew coefficient than does the mean value. The mean
skew coefficient should be used as it provides the most accurate estimate and the variance should be used
in equation 22 for .
In the absence of detailed studies, the generalized skew coefficient can be read from Plate 1
found in the flyleaf pocket of Bulletin 17B. This map of generalized skew coefficients was developed when
this bulletin was first introduced and has not been changed. The procedures used to develop the statistical
analysis for the individual stations do not conform in all aspects to the procedures recommended in the
current guide. However, Plate 1 is still considered an alternative for use with the guide for those who prefer
not to develop their own generalized skew procedures.
The accuracy of a regional generalized skew relationship is generally not comparable to Plate 1
accuracy. While the average accuracy of Plate 1 is given, the accuracy of subregions within the United
States are not given. A comparison should only be made between relationships that cover approximately the
same geographical area.
Computation of Weighted Skew Coefficient
The station and generalized skew coefficient can be combined to form a better estimate of the skew
coefficient for a given watershed. Under the assumption that the generalized skew coefficient is unbiased
and independent of the station skew coefficient, the MSE of the weighted estimate is minimized by
weighting the station and generalized skew coefficient in inverse proportion to their individual MSE’s. This
concept is expressed in the following equation adopted from Tasker (1978), which should be used in
computing a weighted skew coefficient:
(18)
where = weighted skew coefficient,
G = station skew coefficient,
= generalized skew coefficient,
= mean-square error of generalized skew coefficient, and
= mean-square error of station skew coefficient.
Equation 18 can be used to estimate a weighted skew coefficient regardless of the source of
generalized skew coefficient, provided the MSE of the generalized skew coefficient can be estimated. When
generalized skew coefficients are read from Plate 1, the value of = 0.302 should be used in equation
18. The MSE of the station skew for log-Pearson Type III random variables can be obtained from the results
MSEG
MSEG
G( )
GW
MSEG
G( ) MSEG G( )+
MSEG
MSEG+---------------------------------------------------------------=
GW
G
MSEG
MSEG
MSEG

PEAKFQ 12 DRAFT - 1/30/98
of Monte Carlo experiment by Wallis and others (1974). Their results show that the MSE of the logarithmic
station skew is a function of record length and population skew. For use in calculating , this function
can be approximated with sufficient accuracy by the equation:
(19)
where A = -0.33 + 0.08 if ,
-0.52 + 0.30 if > 0.90,
B = 0.94 - 0.26 if , and
= 0.55 if > 1.50.
in which is the absolute value of the station skew coefficient (used as an estimate of population skew
coefficient) and N is the record length in years. If the historic adjustment (Bulletin 17B, Appendix 6) has
been applied, the historically adjusted skew coefficient, , and historic period, H, are to be used for G and
N, respectively, in equation 19. Application of equation 19 to stations with absolute skew coefficients
(logs) greater than 2 causes decreasing weight to be given to the station coefficient when the period of
record increases. Application of equation 18 also may give improper weight to the generalized skew
coefficient if the generalized and station skew coefficients differ by more than 0.5. In these situations, an
examination of the data and the flood-producing characteristics of the watershed should be made and
possibly greater weight given to the station skew coefficient.
Expected Probability Adjustment
The final steps in the Bulletin 17B analysis, as implemented in program PEAKFQ, are to compute the
so-called expected-probability frequency curve and a set of upper and lower confidence limits. These
computations are optional and are intended primarily as an aid to the interpretation of the principal Bulletin
17B-estimated frequency curve given by above.
The expected probability concept deals with the following problem. A sample of size n will be drawn
from a normal population (of flood logarithms), and the flood having exceedance probability p will be
estimated by the quantity , in which and S are the ordinary sample mean and standard
deviation and is the standard normal frequency factor for probability p. Because it is computed from a
random sample, the estimate is a random variable, which usually will differ from the true
p-probability flood. Thus one is led to ask how the probability of another flood exceeding the estimate
compares with the nominal probability p. For a normal population one has:
(20)
where is Student’s t with n-1 degrees of freedom. This probability has come to be known as the
"expected probability" (Beard, 1960; Interagency Advisory Committee on Water Data, 1982, Appendix
WMSEG( )
MSEG 10A B log10 N 10⁄( )–
=
G G 0.90≤
G G
G G 1.50≤
G
G
G
Q
X kp S( )+ X
kpX kp S( )+
X kp S( )+
P X X kp( ) S+>{ } PX X–
S-------------- kp>{ } P tn 1– kp n n 1+( )⁄[ ] 0.5>{ }= =
tn 1–

PEAKFQ 13 DRAFT - 1/30/98
11). For nominal exceedance probabilities less than 0.50—floods above the median—the expected
probability exceeds the nominal probability. This bias is removed by replacing by the frequency factor:
(21)
in which is the Student-t value with exceedance probability p. The visible effect of this adjustment
is to increase the slope of the estimated frequency curve in proportion to the statistical variability of the
sample statistics.
This normal-population result is applied to the Bulletin 17B-estimated Pearson Type III distribution
with mean, standard deviation, and skew coefficient, , , and GW, by first looking up the normal
exceedance probability corresponding to and, second, applying the Pearson Type III frequency
factor, having this skew coefficient and probability, to the sample mean and standard deviation, as
follows: . Of course, even this estimate, when evaluated for any particular sample,
normally will misrepresent the true p-probability flood. With respect to a number of samples, however, the
fraction of floods actually exceeding the estimated p-probability floods will be correct. Nonetheless, the
Bulletin 17B guidelines specify that the basic flood frequency curve (without expected probability) is the
curve to be used for estimating flood risk and forming weighted averages of independent flood frequency
estimates.
Confidence Limits
Finally, one-sided confidence limits for the p-probability flood are computed. A one-sided confidence
limit is a sample statistic—hence a random variable—having a specified probability of exceeding (or not
exceeding) a specified population characteristic. In the Bulletin 17B analysis, these statistics are of the form
, where and S are the sample mean and standard deviation after all Bulletin 17B tests and
adjustments and K is a confidence coefficient chosen to satisfy the following equation:
(22)
In this equation, µ, σ, and γ are the population mean, standard deviation, and skew coefficient, and the
right-hand side of the inequality is the population p-probability flood; these parameters are unknown and
the idea is to find a K-value such that , which can be computed from the sample, will almost
certainly be an upper (or lower) bound on this unknown population characteristic. In any particular sample
the computed value may fail to bound the population characteristic, but, over a number of
samples, the specified fraction—α (or 1-α)—will yield correct bounds. A value of close to unity yields
upper confidence limits and a value close to zero yields lower limits. In particular, the upper 95-percent
confidence limit has α = 0.95; the lower 95-percent limit has α = 0.05. The value of K is found by
rearranging the probability statement as follows:
(23)
kp
k′p tn 1 p,– n 1+( ) n⁄[ ] 0.5=
tn 1 p,–
M S
p′ k′pkG p′,
M S kGW p′, +
X K S•+ X
P X K S•+ µ kγ p, σ( )+>{ } α=
X K S•+
X K S•+
Pµ X–( ) σ n⁄( ) n kγ p,( )+⁄
S σ⁄( )----------------------------------------------------------------------------------- n K( )<
α=

PEAKFQ 14 DRAFT - 1/30/98
in which n is the sample size. If the underlying population were normally distributed, and if and s were
the ordinary sample mean and standard deviation, then the random variable on the left-hand side of the
inequality would have the noncentral t distribution with n-1 degrees of freedom and noncentrality
parameter . If the underlying population becomes less skewed, if the sample size increases, and
if the population skew coefficient, γ, could be replaced by the Bulletin 17B estimated skew coefficient,
, then one might hope the variate would have approximately the noncentral-t distribution. Building
upon this foundation, one obtains:
(24)
which is the noncentral-t value with exceedance probability l-α. A standard large-sample approximation
for the noncentral-t distribution then yields the result:
(25)
in which is the standard normal deviate with exceedance probability and is the
Bulletin 17B estimated skew coefficient. As stated above, an a-value near unity yields upper confidence
limits whereas a value near zero yields lower limits. This result is equivalent to that in the Bulletin 17B
guidelines.
x
n kγ p,( )
GW
n K( ) tn 1– n kGW p, 1 α–( ),,=
K
kGW p,
k 1 α–( )
n------------------- 1 nk
2GW p, k 1 α–( )
2–
2 n 1–( )⁄+{ }0.5
+
1 k 1 α–( )2
2 n 1–( )⁄–{ }----------------------------------------------------------------------------------------------------------------------------------------------------------=
k 1 α–( ) 1 α–( ) GW

PEAKFQ 15 DRAFT - 1/30/98
COMPUTER PROGRAM PEAKFQ
The following sections describe the computer program PEAKFQ for performing the Bulletin 17B
flood-frequency analysis. Figure 3 shows the structure of the PEAKFQ program.
Figure 3. Structure of the PEAKFQ program.
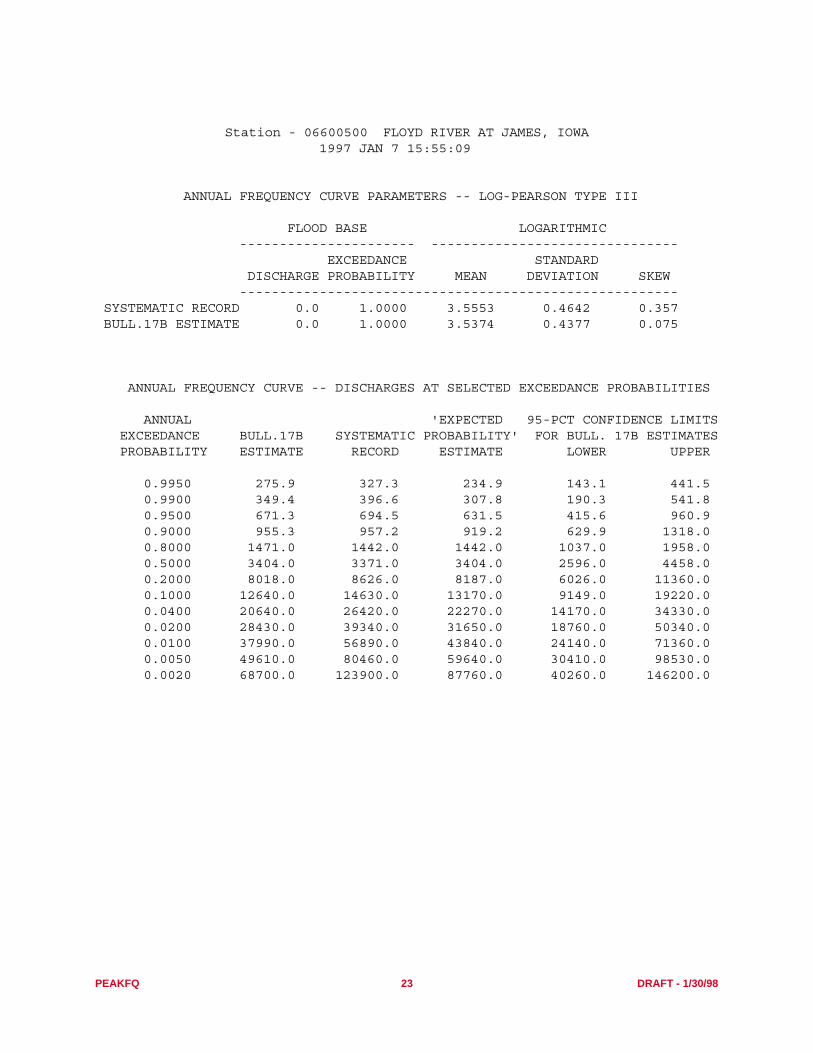
Examples of flood-frequency analyses using program PEAKFQ are provided for five stations: Fishkill
Creek at Beacon, N.Y. (fig. 4), Floyd River at James, Iowa (fig. 5), Back Creek at Jones Springs, W.Va. (fig.
6), Orestimba Creek near Newman, Calif. (fig. 7), and Sugar Creek at Crawfordsville, Ind. (fig. 8). The
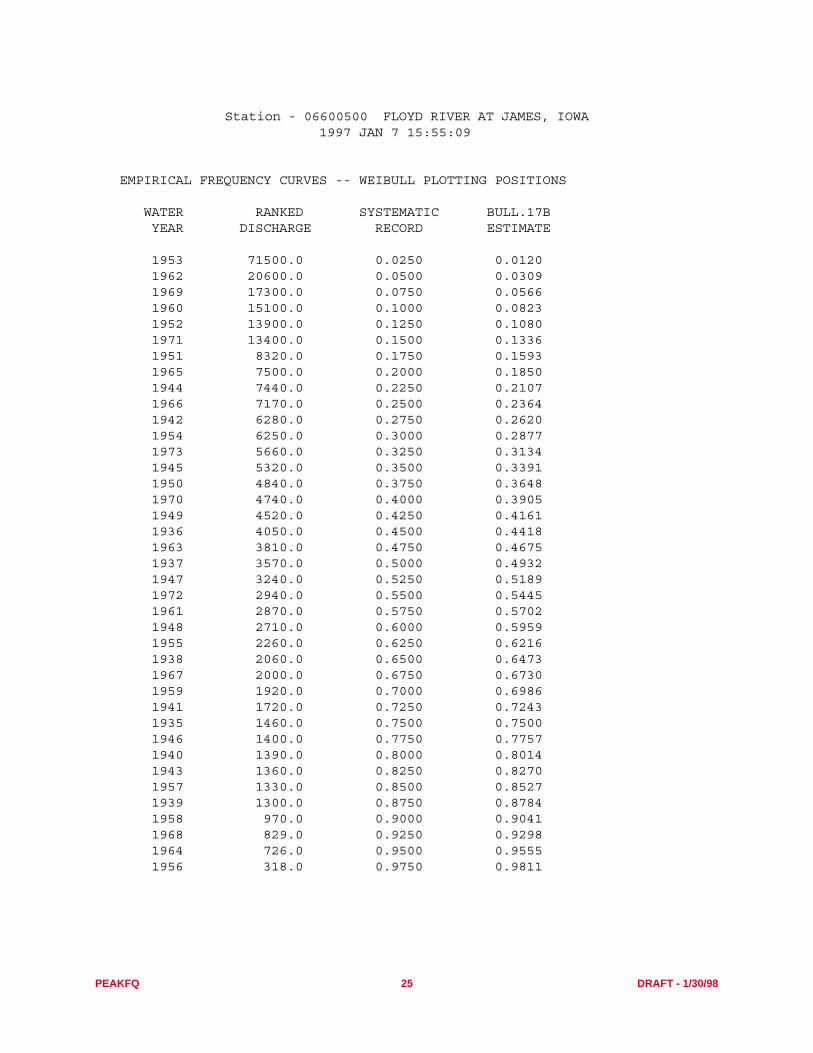
Floyd River example illustrates the historic adjustment for a high outlier in the systematic record. The 1953
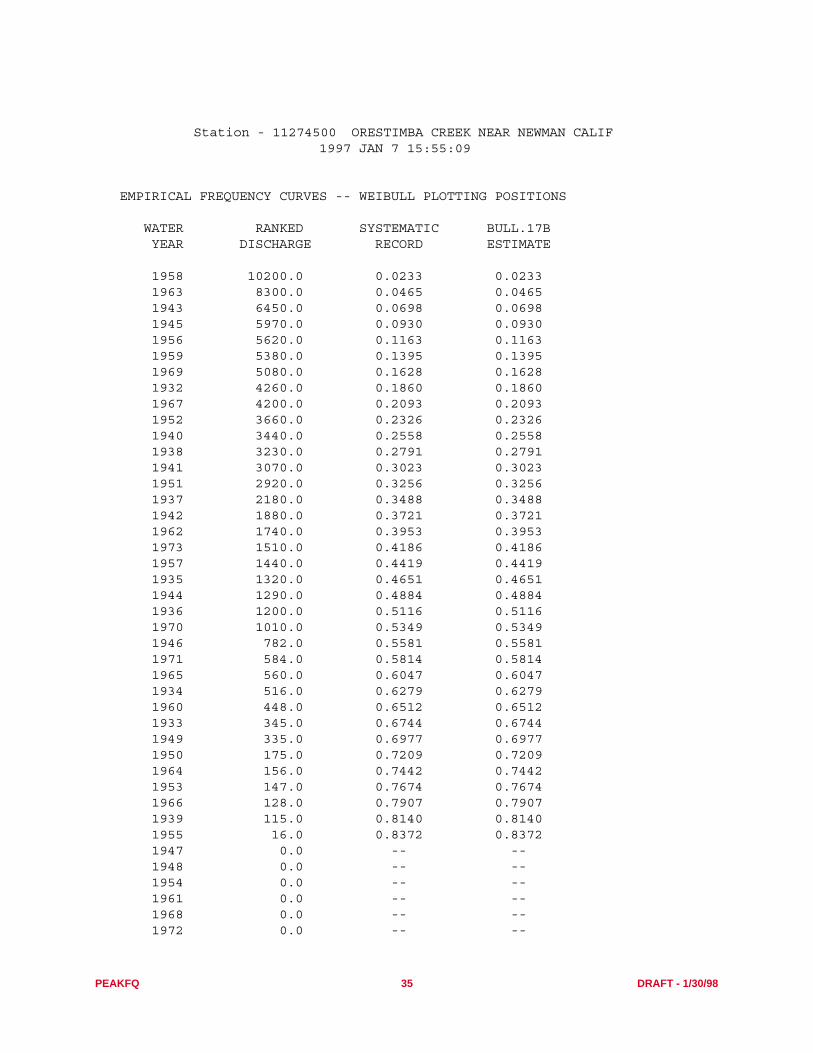
annual peak flow (71,500 ft3/s) is the highest known peak flow in at least 82 years. The Orestimba Creek
example illustrates the detection and adjustment for a low outlier and several zero flows. Both these
examples are discussed in Appendix 12 of Bulletin 17B (Interagency Advisory Committee on Water Data,
1982).
FIGURES 4, 5, 6, 7, AND 8 NEAR HERE
Peakfq
Input Output Modify Start
File Options
Wdm Keyboard ASCII Options Skew Historic Low Base
File Select

PEAKFQ 16 DRAFT - 1/30/98
U. S. GEOLOGICAL SURVEY ANNUAL PEAK FLOW FREQUENCY ANALYSIS Following Bulletin 17-B Guidelines Program peakfq (Version 2.3, Jan, 1997)
--- PROCESSING DATE/TIME ---
1997 JAN 7 15:55:09
--- PROCESSING OPTIONS ---
Plot option = Graphics & Printer Basin char output = WDM Print option = Yes Debug print = No Input peaks listing = Long Input peaks format = WDM file

PEAKFQ 17 DRAFT - 1/30/98
Figure 4. Example of output from PEAKFQ for the Fishkill Creek at Beacon, N.Y.
U. S. GEOLOGICAL SURVEY ANNUAL PEAK FLOW FREQUENCY ANALYSIS Following Bulletin 17-B Guidelines Program peakfq (Version 2.3, Jan, 1997)
Station - 01373500 FISHKILL CR AT BEACON NY 1997 JAN 7 15:55:09
I N P U T D A T A S U M M A R Y
Number of peaks in record = 24 Peaks not used in analysis = 0 Systematic peaks in analysis = 24 Historic peaks in analysis = 0 Years of historic record = 0 Generalized skew = 0.600 Standard error of generalized skew = 0.550 Skew option = WEIGHTED Gage base discharge = 0.0 User supplied high outlier threshold = -- User supplied low outlier criterion = -- Plotting position parameter = 0.00
********* NOTICE -- Preliminary machine computations. ********* ********* User responsible for assessment and interpretation. *********
WCF134I-NO SYSTEMATIC PEAKS WERE BELOW GAGE BASE. 0.0 WCF163I-NO HIGH OUTLIERS OR HISTORIC PEAKS EXCEEDED HHBASE. 9425.0 WCF195I-NO LOW OUTLIERS WERE DETECTED BELOW CRITERION. 578.7

PEAKFQ 18 DRAFT - 1/30/98
Station - 01373500 FISHKILL CR AT BEACON NY 1997 JAN 7 15:55:09
ANNUAL FREQUENCY CURVE PARAMETERS -- LOG-PEARSON TYPE III
FLOOD BASE LOGARITHMIC ---------------------- ------------------------------- EXCEEDANCE STANDARD DISCHARGE PROBABILITY MEAN DEVIATION SKEW ------------------------------------------------------- SYSTEMATIC RECORD 0.0 1.0000 3.3684 0.2456 0.730 BULL.17B ESTIMATE 0.0 1.0000 3.3684 0.2456 0.668
ANNUAL FREQUENCY CURVE -- DISCHARGES AT SELECTED EXCEEDANCE PROBABILITIES
ANNUAL 'EXPECTED 95-PCT CONFIDENCE LIMITS EXCEEDANCE BULL.17B SYSTEMATIC PROBABILITY' FOR BULL. 17B ESTIMATES PROBABILITY ESTIMATE RECORD ESTIMATE LOWER UPPER
0.9950 773.1 797.9 717.3 510.6 1019.0 0.9900 829.6 851.4 778.2 558.6 1083.0 0.9500 1038.0 1050.0 999.3 740.6 1313.0 0.9000 1192.0 1199.0 1163.0 880.1 1485.0 0.8000 1438.0 1439.0 1418.0 1106.0 1760.0 0.5000 2194.0 2181.0 2194.0 1796.0 2660.0 0.2000 3657.0 3645.0 3743.0 2996.0 4722.0 0.1000 4959.0 4966.0 5208.0 3946.0 6848.0 0.0400 7067.0 7134.0 7778.0 5358.0 10700.0 0.0200 9031.0 9181.0 10430.0 6589.0 14660.0 0.0100 11390.0 11660.0 13920.0 7995.0 19780.0 0.0050 14220.0 14670.0 18620.0 9605.0 26370.0 0.0020 18830.0 19650.0 27510.0 12100.0 38030.0

PEAKFQ 19 DRAFT - 1/30/98
Station - 01373500 FISHKILL CR AT BEACON NY 1997 JAN 7 15:55:09
I N P U T D A T A L I S T I N G
WATER YEAR DISCHARGE CODES WATER YEAR DISCHARGE CODES
1945 2290.0 1957 1310.0 1946 1470.0 1958 2500.0 1947 2220.0 1959 1960.0 1948 2970.0 1960 2140.0 1949 3020.0 1961 4340.0 1950 1210.0 1962 3060.0 1951 2490.0 1963 1780.0 1952 3170.0 1964 1380.0 1953 3220.0 1965 980.0 1954 1760.0 1966 1040.0 1955 8800.0 1967 1580.0 1956 8280.0 1968 3630.0
Explanation of peak discharge qualification codes
PEAKFQ WATSTORE CODE CODE DEFINITION
D 3 Dam failure, non-recurrent flow anomaly G 8 Discharge greater than stated value X 3+8 Both of the above L 4 Discharge less than stated value K 6 OR C Known effect of regulation or urbanization H 7 Historic peak

PEAKFQ 20 DRAFT - 1/30/98
Station - 01373500 FISHKILL CR AT BEACON NY 1997 JAN 7 15:55:09
EMPIRICAL FREQUENCY CURVES -- WEIBULL PLOTTING POSITIONS
WATER RANKED SYSTEMATIC BULL.17B YEAR DISCHARGE RECORD ESTIMATE
1955 8800.0 0.0400 0.0400 1956 8280.0 0.0800 0.0800 1961 4340.0 0.1200 0.1200 1968 3630.0 0.1600 0.1600 1953 3220.0 0.2000 0.2000 1952 3170.0 0.2400 0.2400 1962 3060.0 0.2800 0.2800 1949 3020.0 0.3200 0.3200 1948 2970.0 0.3600 0.3600 1958 2500.0 0.4000 0.4000 1951 2490.0 0.4400 0.4400 1945 2290.0 0.4800 0.4800 1947 2220.0 0.5200 0.5200 1960 2140.0 0.5600 0.5600 1959 1960.0 0.6000 0.6000 1963 1780.0 0.6400 0.6400 1954 1760.0 0.6800 0.6800 1967 1580.0 0.7200 0.7200 1946 1470.0 0.7600 0.7600 1964 1380.0 0.8000 0.8000 1957 1310.0 0.8400 0.8400 1950 1210.0 0.8800 0.8800 1966 1040.0 0.9200 0.9200 1965 980.0 0.9600 0.9600

PEAKFQ 21 DRAFT - 1/30/98
U. S. GEOLOGICAL SURVEY ANNUAL PEAK FLOW FREQUENCY ANALYSIS Following Bulletin 17-B Guidelines Program peakfq (Version 2.3, Jan, 1997) 1997 JAN 7 15:55:09
Station - 01373500 FISHKILL CR AT BEACON NY
100000.0 +----+------------+------+--------+-----+---------+---------+-----+--------+------+-------+----+----+-----+ | | | | | | | | | | | | | | | | | | | | | | | | | | | | | | | | | | | | | | | | | | | | | | | ***** NOTICE ***** NOTICE ****** | | | | | | | | | A | | * PRELIMINARY MACHINE COMPUTATION. * | | | | | | | | | N | | * USER IS RESPONSIBLE FOR ASSESS- * | | | | | | | | | N | | * MENT AND INTERPRETATION. * | | | | | | | | | U | | ************************************ | | | | | | | | | A | | | | | | | | | | | | | | | L 31600.0 +----+------------+------+--------+-----+---------+---------+-----+--------+------+-------+----+----+-----+ | | PLOT SYMBOL KEY | | | | | | | | | | P | | * WRC FINAL FREQUENCY CURVE | | | | | | | | | | E | | O OBSERVED (SYSTEMATIC) PEAKS | | | | | | | | | | A | | $ HISTORICALLY ADJUSTED PEAKS | | | | | | | | | # K | | # SYSTEMATIC-RECORD FREQ CURVE| | | | | | | | | * | | WHEN POINTS COINCIDE, ONLY THE | | | | | | | | | | M | | TOPMOST SYMBOL SHOWS. | | | | | | | | * | A | | | | | | | | | | | | | | | G | | | | | | | | | | | | * | | N 10000.0 +----+------------+------+--------+-----+---------+---------+-----+--------+------+-------+----+----+-----+ I | | | | | | | | | | | O # * | | | T | | | | | | | | | | O | * | | | | U | | | | | | | | | | | * | | | | D | | | | | | | | | | * | | | | E | | | | | | | | | | | | | | | S | | | | | | | | | * | | | | | | | | | | | | | | O | | | | | | | | | | | | | | | | | | | | | | | | | | | | | * O | | | | | | / 3160.0 +----+------------+------+--------+-----+---------+--------O+O--O-O--------+------+-------+----+----+-----+ L | | | | | | | O * | | | | | | | O | | | | | | | O** | | | | | | | | G | | | | | | O O*O | | | | | | | | | | | | | | * * | | | | | | | | | S | | | | | |O O | | | | | | | | | C | | | | | O* | | | | | | | | | A | | | | * O | | | | | | | | | | L | | | * O O | | | | | | | | | | | E | | | | | | | | | | | | | | | / 1000.0 +----+------#---*-*----O-+--------+-----+---------+---------+-----+--------+------+-------+----+----+-----+ | # * * | | | | | | | | | | | | | * * | | | | | | | | | | | | | | | | | | | | | | | | | | | | | | | | | | | | | | | | | | | | | | | | | | | | | | | | | | | | | | | | | | | | | | | | | | | | | | | | | | | | | | | | | | | | | | | | | | | | | | | | | | | | | | | | | | | | | | 316.0 +----+------------+------+--------+-----+---------+---------+-----+--------+------+-------+----+----+-----+
99.5 99.0 95.0 90.0 80.0 70.0 50.0 30.0 20.0 10.0 5.0 2.0 1.0 0.5 0.2 ANNUAL EXCEEDANCE PROBABILITY, PERCENT (NORMAL SCALE)

PEAKFQ 22 DRAFT - 1/30/98
Figure 5. Example of output from PEAKFQ for the Floyd River at James, Iowa.
U. S. GEOLOGICAL SURVEY ANNUAL PEAK FLOW FREQUENCY ANALYSIS Following Bulletin 17-B Guidelines Program peakfq (Version 2.3, Jan, 1997)
Station - 06600500 FLOYD RIVER AT JAMES, IOWA 1997 JAN 7 15:55:09
I N P U T D A T A S U M M A R Y
Number of peaks in record = 39 Peaks not used in analysis = 0 Systematic peaks in analysis = 39 Historic peaks in analysis = 0 Years of historic record = 82 Generalized skew = -0.300 Standard error of generalized skew = 0.550 Skew option = WEIGHTED Gage base discharge = 0.0 User supplied high outlier threshold = 70000.0 User supplied low outlier criterion = -- Plotting position parameter = 0.00
********* NOTICE -- Preliminary machine computations. ********* ********* User responsible for assessment and interpretation. *********
WCF134I-NO SYSTEMATIC PEAKS WERE BELOW GAGE BASE. 0.0 WCF195I-NO LOW OUTLIERS WERE DETECTED BELOW CRITERION. 206.8 *WCF161I-USER HIGH OUTLIER CRITERION REPLACES WRC. 70000.0 62394.9 WCF165I-HIGH OUTLIERS AND HISTORIC PEAKS ABOVE HHBASE. 1 0 70000.0
PEAKFQ 23 DRAFT - 1/30/98
Station - 06600500 FLOYD RIVER AT JAMES, IOWA 1997 JAN 7 15:55:09
ANNUAL FREQUENCY CURVE PARAMETERS -- LOG-PEARSON TYPE III
FLOOD BASE LOGARITHMIC ---------------------- ------------------------------- EXCEEDANCE STANDARD DISCHARGE PROBABILITY MEAN DEVIATION SKEW ------------------------------------------------------- SYSTEMATIC RECORD 0.0 1.0000 3.5553 0.4642 0.357 BULL.17B ESTIMATE 0.0 1.0000 3.5374 0.4377 0.075
ANNUAL FREQUENCY CURVE -- DISCHARGES AT SELECTED EXCEEDANCE PROBABILITIES
ANNUAL 'EXPECTED 95-PCT CONFIDENCE LIMITS EXCEEDANCE BULL.17B SYSTEMATIC PROBABILITY' FOR BULL. 17B ESTIMATES PROBABILITY ESTIMATE RECORD ESTIMATE LOWER UPPER
0.9950 275.9 327.3 234.9 143.1 441.5 0.9900 349.4 396.6 307.8 190.3 541.8 0.9500 671.3 694.5 631.5 415.6 960.9 0.9000 955.3 957.2 919.2 629.9 1318.0 0.8000 1471.0 1442.0 1442.0 1037.0 1958.0 0.5000 3404.0 3371.0 3404.0 2596.0 4458.0 0.2000 8018.0 8626.0 8187.0 6026.0 11360.0 0.1000 12640.0 14630.0 13170.0 9149.0 19220.0 0.0400 20640.0 26420.0 22270.0 14170.0 34330.0 0.0200 28430.0 39340.0 31650.0 18760.0 50340.0 0.0100 37990.0 56890.0 43840.0 24140.0 71360.0 0.0050 49610.0 80460.0 59640.0 30410.0 98530.0 0.0020 68700.0 123900.0 87760.0 40260.0 146200.0

PEAKFQ 24 DRAFT - 1/30/98
Station - 06600500 FLOYD RIVER AT JAMES, IOWA 1997 JAN 7 15:55:09
I N P U T D A T A L I S T I N G
WATER YEAR DISCHARGE CODES WATER YEAR DISCHARGE CODES
1935 1460.0 1955 2260.0 1936 4050.0 1956 318.0 1937 3570.0 1957 1330.0 1938 2060.0 1958 970.0 1939 1300.0 1959 1920.0 1940 1390.0 1960 15100.0 1941 1720.0 1961 2870.0 1942 6280.0 1962 20600.0 1943 1360.0 1963 3810.0 1944 7440.0 1964 726.0 1945 5320.0 1965 7500.0 1946 1400.0 1966 7170.0 1947 3240.0 1967 2000.0 1948 2710.0 1968 829.0 1949 4520.0 1969 17300.0 1950 4840.0 1970 4740.0 1951 8320.0 1971 13400.0 1952 13900.0 1972 2940.0 1953 71500.0 1973 5660.0 1954 6250.0
Explanation of peak discharge qualification codes
PEAKFQ WATSTORE CODE CODE DEFINITION
D 3 Dam failure, non-recurrent flow anomaly G 8 Discharge greater than stated value X 3+8 Both of the above L 4 Discharge less than stated value K 6 OR C Known effect of regulation or urbanization H 7 Historic peak
PEAKFQ 25 DRAFT - 1/30/98
Station - 06600500 FLOYD RIVER AT JAMES, IOWA 1997 JAN 7 15:55:09
EMPIRICAL FREQUENCY CURVES -- WEIBULL PLOTTING POSITIONS
WATER RANKED SYSTEMATIC BULL.17B YEAR DISCHARGE RECORD ESTIMATE
1953 71500.0 0.0250 0.0120 1962 20600.0 0.0500 0.0309 1969 17300.0 0.0750 0.0566 1960 15100.0 0.1000 0.0823 1952 13900.0 0.1250 0.1080 1971 13400.0 0.1500 0.1336 1951 8320.0 0.1750 0.1593 1965 7500.0 0.2000 0.1850 1944 7440.0 0.2250 0.2107 1966 7170.0 0.2500 0.2364 1942 6280.0 0.2750 0.2620 1954 6250.0 0.3000 0.2877 1973 5660.0 0.3250 0.3134 1945 5320.0 0.3500 0.3391 1950 4840.0 0.3750 0.3648 1970 4740.0 0.4000 0.3905 1949 4520.0 0.4250 0.4161 1936 4050.0 0.4500 0.4418 1963 3810.0 0.4750 0.4675 1937 3570.0 0.5000 0.4932 1947 3240.0 0.5250 0.5189 1972 2940.0 0.5500 0.5445 1961 2870.0 0.5750 0.5702 1948 2710.0 0.6000 0.5959 1955 2260.0 0.6250 0.6216 1938 2060.0 0.6500 0.6473 1967 2000.0 0.6750 0.6730 1959 1920.0 0.7000 0.6986 1941 1720.0 0.7250 0.7243 1935 1460.0 0.7500 0.7500 1946 1400.0 0.7750 0.7757 1940 1390.0 0.8000 0.8014 1943 1360.0 0.8250 0.8270 1957 1330.0 0.8500 0.8527 1939 1300.0 0.8750 0.8784 1958 970.0 0.9000 0.9041 1968 829.0 0.9250 0.9298 1964 726.0 0.9500 0.9555 1956 318.0 0.9750 0.9811

PEAKFQ 26 DRAFT - 1/30/98
U. S. GEOLOGICAL SURVEY ANNUAL PEAK FLOW FREQUENCY ANALYSIS Following Bulletin 17-B Guidelines Program peakfq (Version 2.3, Jan, 1997) 1997 JAN 7 15:55:09
Station - 06600500 FLOYD RIVER AT JAMES, IOWA
1000000.1 +----+------------+------+--------+-----+---------+---------+-----+--------+------+-------+----+----+-----+ | | | | | | | | | | | | | | | | | | | | | | | | | | | | | | | | | | | | | | | | | | | | | | | ***** NOTICE ***** NOTICE ****** | | | | | | | | | A | | * PRELIMINARY MACHINE COMPUTATION. * | | | | | | | | | N | | * USER IS RESPONSIBLE FOR ASSESS- * | | | | | | | | | N | | * MENT AND INTERPRETATION. * | | | | | | | | | U | | ************************************ | | | | | | | | | A | | | | | | | | | | | | | | # L 100000.0 +----+------------+------+--------+-----+---------+---------+-----+--------+------+-------+----+----+-----+ | | PLOT SYMBOL KEY | | | | | | O | $| # | P | | * WRC FINAL FREQUENCY CURVE | | | | | | | # | * E | | O OBSERVED (SYSTEMATIC) PEAKS | | | | | | | | * | A | | $ HISTORICALLY ADJUSTED PEAKS | | | | | | # * | | K | | # SYSTEMATIC-RECORD FREQ CURVE| | | | | | # * | | | | | WHEN POINTS COINCIDE, ONLY THE | | | | | # # * | | | | M | | TOPMOST SYMBOL SHOWS. | | | | | * * $ | | | | A | | | | | | | | | O $O $| | | | | G | | | | | | | | | O O $* | | | | | N 10000.0 +----+------------+------+--------+-----+---------+---------+-----+--------+------+-------+----+----+-----+ I | | | | | | | | O$O*$O$ | | | | | | T | | | | | | | O*$O | | | | | | | U | | | | | | | OOO$O | | | | | | | | D | | | | | | OOO$** | | | | | | | | E | | | | | | O*OO* | | | | | | | | S | | | | | | O* # | | | | | | | | | | | | | | *O O | | | | | | | | | | | | | * OO | | | | | | | | | | | | | | $O O O OO | | | | | | | | | | / 1000.0 +----+------------+------*--------+-----+---------+---------+-----+--------+------+-------+----+----+-----+ L | | $O $O | | | | | | | | | | | | O | | * * | | | | | | | | | | | | G | | * * | | | | | | | | | | | | | | # | | | | | | | | | | | | | S # * $ O | | | | | | | | | | | | | C * | | | | | | | | | | | | | | A | | | | | | | | | | | | | | | L | | | | | | | | | | | | | | | E | | | | | | | | | | | | | | | / 100.0 +----+------------+------+--------+-----+---------+---------+-----+--------+------+-------+----+----+-----+ | | | | | | | | | | | | | | | | | | | | | | | | | | | | | | | | | | | | | | | | | | | | | | | | | | | | | | | | | | | | | | | | | | | | | | | | | | | | | | | | | | | | | | | | | | | | | | | | | | | | | | | | | | | | | | | | | | | | | | | | | | | | | | | | | | | | | | | 10.0 +----+------------+------+--------+-----+---------+---------+-----+--------+------+-------+----+----+-----+
99.5 99.0 95.0 90.0 80.0 70.0 50.0 30.0 20.0 10.0 5.0 2.0 1.0 0.5 0.2 ANNUAL EXCEEDANCE PROBABILITY, PERCENT (NORMAL SCALE)

PEAKFQ 27 DRAFT - 1/30/98
Figure 6. Example of output from PEAKFQ for the Back Creek near Jones Springs, W.Va.
U. S. GEOLOGICAL SURVEY ANNUAL PEAK FLOW FREQUENCY ANALYSIS Following Bulletin 17-B Guidelines Program peakfq (Version 2.3, Jan, 1997)
Station - 01614000 BACK CREEK NEAR JONES SPRINGS,W.VA. 1997 JAN 7 15:55:09
I N P U T D A T A S U M M A R Y
Number of peaks in record = 38 Peaks not used in analysis = 0 Systematic peaks in analysis = 38 Historic peaks in analysis = 0 Years of historic record = 0 Generalized skew = 0.500 Standard error of generalized skew = 0.550 Skew option = WEIGHTED Gage base discharge = 0.0 User supplied high outlier threshold = -- User supplied low outlier criterion = -- Plotting position parameter = 0.00
********* NOTICE -- Preliminary machine computations. ********* ********* User responsible for assessment and interpretation. *********
WCF134I-NO SYSTEMATIC PEAKS WERE BELOW GAGE BASE. 0.0 WCF198I-LOW OUTLIERS BELOW FLOOD BASE WERE DROPPED. 1 945.8 WCF163I-NO HIGH OUTLIERS OR HISTORIC PEAKS EXCEEDED HHBASE. 22759.8

PEAKFQ 28 DRAFT - 1/30/98
Station - 01614000 BACK CREEK NEAR JONES SPRINGS,W.VA. 1997 JAN 7 15:55:09
ANNUAL FREQUENCY CURVE PARAMETERS -- LOG-PEARSON TYPE III
FLOOD BASE LOGARITHMIC ---------------------- ------------------------------- EXCEEDANCE STANDARD DISCHARGE PROBABILITY MEAN DEVIATION SKEW ------------------------------------------------------- SYSTEMATIC RECORD 0.0 1.0000 3.7220 0.2804 -0.731 BULL.17B ESTIMATE 945.8 0.9737 3.7407 0.2328 0.565
ANNUAL FREQUENCY CURVE -- DISCHARGES AT SELECTED EXCEEDANCE PROBABILITIES
ANNUAL 'EXPECTED 95-PCT CONFIDENCE LIMITS EXCEEDANCE BULL.17B SYSTEMATIC PROBABILITY' FOR BULL. 17B ESTIMATES PROBABILITY ESTIMATE RECORD ESTIMATE LOWER UPPER
0.9950 -- 646.2 -- -- -- 0.9900 -- 840.0 -- -- -- 0.9500 2504.0 1622.0 2445.0 1962.0 3009.0 0.9000 2884.0 2228.0 2838.0 2317.0 3417.0 0.8000 3477.0 3172.0 3446.0 2877.0 4058.0 0.5000 5235.0 5700.0 5235.0 4514.0 6047.0 0.2000 8464.0 9168.0 8577.0 7266.0 10190.0 0.1000 11210.0 11280.0 11530.0 9402.0 14110.0 0.0400 15480.0 13670.0 16340.0 12520.0 20720.0 0.0200 19330.0 15250.0 20920.0 15190.0 27060.0 0.0100 23800.0 16670.0 26560.0 18180.0 34830.0 0.0050 29020.0 17960.0 33560.0 21550.0 44340.0 0.0020 37250.0 19460.0 45480.0 26680.0 60160.0
PEAKFQ 29 DRAFT - 1/30/98
Station - 01614000 BACK CREEK NEAR JONES SPRINGS,W.VA. 1997 JAN 7 15:55:09
I N P U T D A T A L I S T I N G
WATER YEAR DISCHARGE CODES WATER YEAR DISCHARGE CODES
1929 8750.0 1955 10700.0 1930 15500.0 1956 3880.0 1931 4060.0 1957 3420.0 1939 6300.0 1958 3240.0 1940 3130.0 1959 6800.0 1941 4160.0 1960 3740.0 1942 6700.0 1961 4700.0 1943 22400.0 1962 4380.0 1944 3880.0 1963 5190.0 1945 8050.0 1964 3960.0 1946 4020.0 1965 5600.0 1947 1600.0 1966 4670.0 1948 4460.0 1967 7080.0 1949 4230.0 1968 4640.0 1950 3010.0 1969 536.0 1951 9150.0 1970 6680.0 1952 5100.0 1971 8360.0 1953 9820.0 1972 18700.0 1954 6200.0 1973 5210.0
Explanation of peak discharge qualification codes
PEAKFQ WATSTORE CODE CODE DEFINITION
D 3 Dam failure, non-recurrent flow anomaly G 8 Discharge greater than stated value X 3+8 Both of the above L 4 Discharge less than stated value K 6 OR C Known effect of regulation or urbanization H 7 Historic peak

PEAKFQ 30 DRAFT - 1/30/98
Station - 01614000 BACK CREEK NEAR JONES SPRINGS,W.VA. 1997 JAN 7 15:55:09
EMPIRICAL FREQUENCY CURVES -- WEIBULL PLOTTING POSITIONS
WATER RANKED SYSTEMATIC BULL.17B YEAR DISCHARGE RECORD ESTIMATE
1943 22400.0 0.0256 0.0256 1972 18700.0 0.0513 0.0513 1930 15500.0 0.0769 0.0769 1955 10700.0 0.1026 0.1026 1953 9820.0 0.1282 0.1282 1951 9150.0 0.1538 0.1538 1929 8750.0 0.1795 0.1795 1971 8360.0 0.2051 0.2051 1945 8050.0 0.2308 0.2308 1967 7080.0 0.2564 0.2564 1959 6800.0 0.2821 0.2821 1942 6700.0 0.3077 0.3077 1970 6680.0 0.3333 0.3333 1939 6300.0 0.3590 0.3590 1954 6200.0 0.3846 0.3846 1965 5600.0 0.4103 0.4103 1973 5210.0 0.4359 0.4359 1963 5190.0 0.4615 0.4615 1952 5100.0 0.4872 0.4872 1961 4700.0 0.5128 0.5128 1966 4670.0 0.5385 0.5385 1968 4640.0 0.5641 0.5641 1948 4460.0 0.5897 0.5897 1962 4380.0 0.6154 0.6154 1949 4230.0 0.6410 0.6410 1941 4160.0 0.6667 0.6667 1931 4060.0 0.6923 0.6923 1946 4020.0 0.7179 0.7179 1964 3960.0 0.7436 0.7436 1944 3880.0 0.7692 0.7692 1956 3880.0 0.7949 0.7949 1960 3740.0 0.8205 0.8205 1957 3420.0 0.8462 0.8462 1958 3240.0 0.8718 0.8718 1940 3130.0 0.8974 0.8974 1950 3010.0 0.9231 0.9231 1947 1600.0 0.9487 0.9487 1969 536.0 0.9744 0.9744

PEAKFQ 31 DRAFT - 1/30/98
U. S. GEOLOGICAL SURVEY ANNUAL PEAK FLOW FREQUENCY ANALYSIS Following Bulletin 17-B Guidelines Program peakfq (Version 2.3, Jan, 1997) 1997 JAN 7 15:55:09
Station - 01614000 BACK CREEK NEAR JONES SPRINGS,W.VA.
100000.0 +----+------------+------+--------+-----+---------+---------+-----+--------+------+-------+----+----+-----+ | | | | | | | | | | | | | | | | | | | | | | | | | | | | | | | | | | | | | | | | | | | | | | | ***** NOTICE ***** NOTICE ****** | | | | | | | | | A | | * PRELIMINARY MACHINE COMPUTATION. * | | | | | | | | | N | | * USER IS RESPONSIBLE FOR ASSESS- * | | | | | | | | | N | | * MENT AND INTERPRETATION. * | | | | | | | | | U | | ************************************ | | | | | | | | | A | | | | | | | | | | | | | | * L 31600.0 +----+------------+------+--------+-----+---------+---------+-----+--------+------+-------+----+----+-----+ | | PLOT SYMBOL KEY | | | | | | | | * | P | | * WRC FINAL FREQUENCY CURVE | | | | | | | * | | E | | O OBSERVED (SYSTEMATIC) PEAKS | | | | | | O | | | | A | | $ HISTORICALLY ADJUSTED PEAKS | | | | | | * | | # K | | # SYSTEMATIC-RECORD FREQ CURVE| | | | | O * | | # | | | WHEN POINTS COINCIDE, ONLY THE | | | | | O | * # # | | M | | TOPMOST SYMBOL SHOWS. | | | | | * # # | | | | A | | | | | | | | | | # | | | | G | | | | | | | | | * | | | | | N 10000.0 +----+------------+------+--------+-----+---------+---------+-----+-----O--+------+-------+----+----+-----+ I | | | | | | | | * O O | | | | | | T | | | | | | | # O O | | | | | | U | | | | | | | *O O | | | | | | | D | | | | | | | #*OOO | | | | | | | | E | | | | | | # * | | | | | | | | S | | | | | | # * *OOO | | | | | | | | | | | | | | OO*OOOO| | | | | | | | | | | | | O OO O* O | | | | | | | | | | | | | O O * | | | | | | | | | | / 3160.0 +----+------------+---O--O--O-----#-----+---------+---------+-----+--------+------+-------+----+----+-----+ L | | | * | | | | | | | | | | | O | | * * | | | | | | | | | | | | G | | | # | | | | | | | | | | | | | | | | | | | | | | | | | | S | | | | | | | | | | | | | | | C | | O | | | | | | | | | | | | A | | # | | | | | | | | | | | | | L | | # | | | | | | | | | | | | | E | | # | | | | | | | | | | | | | / 1000.0 +----+------------+------+--------+-----+---------+---------+-----+--------+------+-------+----+----+-----+ | | | | | | | | | | | | | | | | # | | | | | | | | | | | | | | | | | | | | | | | | | | | | # | | | | | | | | | | | | | | | | O | | | | | | | | | | | | | | | | | | | | | | | | | | | | | | | | | | | | | | | | | | | | | | | | | | | | | | | | | | | | | | | | | | | | | | | | | 316.0 +----+------------+------+--------+-----+---------+---------+-----+--------+------+-------+----+----+-----+
99.5 99.0 95.0 90.0 80.0 70.0 50.0 30.0 20.0 10.0 5.0 2.0 1.0 0.5 0.2 ANNUAL EXCEEDANCE PROBABILITY, PERCENT (NORMAL SCALE)

PEAKFQ 32 DRAFT - 1/30/98
Figure 7. Example of output from PEAKFQ for the Orestimba Creek near Newman, Calif.
U. S. GEOLOGICAL SURVEY ANNUAL PEAK FLOW FREQUENCY ANALYSIS Following Bulletin 17-B Guidelines Program peakfq (Version 2.3, Jan, 1997)
Station - 11274500 ORESTIMBA CREEK NEAR NEWMAN CALIF 1997 JAN 7 15:55:09
I N P U T D A T A S U M M A R Y
Number of peaks in record = 42 Peaks not used in analysis = 0 Systematic peaks in analysis = 42 Historic peaks in analysis = 0 Years of historic record = 0 Generalized skew = -0.300 Standard error of generalized skew = 0.550 Skew option = WEIGHTED Gage base discharge = 0.0 User supplied high outlier threshold = -- User supplied low outlier criterion = -- Plotting position parameter = 0.00
********* NOTICE -- Preliminary machine computations. ********* ********* User responsible for assessment and interpretation. *********
WCF133I-SYSTEMATIC PEAKS BELOW GAGE BASE WERE NOTED. 6 0.0 WCF198I-LOW OUTLIERS BELOW FLOOD BASE WERE DROPPED. 1 23.9 WCF163I-NO HIGH OUTLIERS OR HISTORIC PEAKS EXCEEDED HHBASE. 41786.0

PEAKFQ 33 DRAFT - 1/30/98
Station - 11274500 ORESTIMBA CREEK NEAR NEWMAN CALIF 1997 JAN 7 15:55:09
ANNUAL FREQUENCY CURVE PARAMETERS -- LOG-PEARSON TYPE III
FLOOD BASE LOGARITHMIC ---------------------- ------------------------------- EXCEEDANCE STANDARD DISCHARGE PROBABILITY MEAN DEVIATION SKEW ------------------------------------------------------- SYSTEMATIC RECORD 0.0 0.8571 2.9140 0.7661 -0.942 BULL.17B ESTIMATE 23.9 0.8333 2.9628 0.6749 -0.487
ANNUAL FREQUENCY CURVE -- DISCHARGES AT SELECTED EXCEEDANCE PROBABILITIES
ANNUAL 'EXPECTED 95-PCT CONFIDENCE LIMITS EXCEEDANCE BULL.17B SYSTEMATIC PROBABILITY' FOR BULL. 17B ESTIMATES PROBABILITY ESTIMATE RECORD ESTIMATE LOWER UPPER
0.8000 260.9 213.1 252.3 156.9 398.2 0.5000 1041.0 1078.0 1041.0 699.3 1562.0 0.2000 3474.0 3695.0 3557.0 2266.0 5832.0 0.1000 6095.0 6117.0 6367.0 3804.0 11110.0 0.0400 10570.0 9521.0 11370.0 6245.0 21140.0 0.0200 14700.0 12080.0 16180.0 8371.0 31190.0 0.0100 19440.0 14530.0 21930.0 10710.0 43450.0 0.0050 24770.0 16830.0 28620.0 13250.0 57960.0 0.0020 32650.0 19590.0 39100.0 16880.0 80620.0

PEAKFQ 34 DRAFT - 1/30/98
Station - 11274500 ORESTIMBA CREEK NEAR NEWMAN CALIF 1997 JAN 7 15:55:09
I N P U T D A T A L I S T I N G
WATER YEAR DISCHARGE CODES WATER YEAR DISCHARGE CODES
1932 4260.0 1953 147.0 1933 345.0 1954 0.0 1934 516.0 1955 16.0 1935 1320.0 1956 5620.0 1936 1200.0 1957 1440.0 1937 2180.0 1958 10200.0 1938 3230.0 1959 5380.0 1939 115.0 1960 448.0 1940 3440.0 1961 0.0 1941 3070.0 1962 1740.0 1942 1880.0 1963 8300.0 1943 6450.0 1964 156.0 1944 1290.0 1965 560.0 1945 5970.0 1966 128.0 1946 782.0 1967 4200.0 1947 0.0 1968 0.0 1948 0.0 1969 5080.0 1949 335.0 1970 1010.0 1950 175.0 1971 584.0 1951 2920.0 1972 0.0 1952 3660.0 1973 1510.0
Explanation of peak discharge qualification codes
PEAKFQ WATSTORE CODE CODE DEFINITION
D 3 Dam failure, non-recurrent flow anomaly G 8 Discharge greater than stated value X 3+8 Both of the above L 4 Discharge less than stated value K 6 OR C Known effect of regulation or urbanization H 7 Historic peak
PEAKFQ 35 DRAFT - 1/30/98
Station - 11274500 ORESTIMBA CREEK NEAR NEWMAN CALIF 1997 JAN 7 15:55:09
EMPIRICAL FREQUENCY CURVES -- WEIBULL PLOTTING POSITIONS
WATER RANKED SYSTEMATIC BULL.17B YEAR DISCHARGE RECORD ESTIMATE
1958 10200.0 0.0233 0.0233 1963 8300.0 0.0465 0.0465 1943 6450.0 0.0698 0.0698 1945 5970.0 0.0930 0.0930 1956 5620.0 0.1163 0.1163 1959 5380.0 0.1395 0.1395 1969 5080.0 0.1628 0.1628 1932 4260.0 0.1860 0.1860 1967 4200.0 0.2093 0.2093 1952 3660.0 0.2326 0.2326 1940 3440.0 0.2558 0.2558 1938 3230.0 0.2791 0.2791 1941 3070.0 0.3023 0.3023 1951 2920.0 0.3256 0.3256 1937 2180.0 0.3488 0.3488 1942 1880.0 0.3721 0.3721 1962 1740.0 0.3953 0.3953 1973 1510.0 0.4186 0.4186 1957 1440.0 0.4419 0.4419 1935 1320.0 0.4651 0.4651 1944 1290.0 0.4884 0.4884 1936 1200.0 0.5116 0.5116 1970 1010.0 0.5349 0.5349 1946 782.0 0.5581 0.5581 1971 584.0 0.5814 0.5814 1965 560.0 0.6047 0.6047 1934 516.0 0.6279 0.6279 1960 448.0 0.6512 0.6512 1933 345.0 0.6744 0.6744 1949 335.0 0.6977 0.6977 1950 175.0 0.7209 0.7209 1964 156.0 0.7442 0.7442 1953 147.0 0.7674 0.7674 1966 128.0 0.7907 0.7907 1939 115.0 0.8140 0.8140 1955 16.0 0.8372 0.8372 1947 0.0 -- -- 1948 0.0 -- -- 1954 0.0 -- -- 1961 0.0 -- -- 1968 0.0 -- -- 1972 0.0 -- --

PEAKFQ 36 DRAFT - 1/30/98
U. S. GEOLOGICAL SURVEY ANNUAL PEAK FLOW FREQUENCY ANALYSIS Following Bulletin 17-B Guidelines Program peakfq (Version 2.3, Jan, 1997) 1997 JAN 7 15:55:09
Station - 11274500 ORESTIMBA CREEK NEAR NEWMAN CALIF
100000.0 +----+------------+------+--------+-----+---------+---------+-----+--------+------+-------+----+----+-----+ | | | | | | | | | | | | | | | | | | | | | | | | | | | | | | | | | | | | | | | | | | | | | | | ***** NOTICE ***** NOTICE ****** | | | | | | | | | A | | * PRELIMINARY MACHINE COMPUTATION. * | | | | | | | | * N | | * USER IS RESPONSIBLE FOR ASSESS- * | | | | | | | * | N | | * MENT AND INTERPRETATION. * | | | | | | * | # U | | ************************************ | | | | | * # # | A | | | | | | | | | | | * # | | | L 10000.0 +----+------------+------+--------+-----+---------+---------+-----+--------+------*-*----O+----+----+-----+ | | PLOT SYMBOL KEY | | | | | #O | | | | P | | * WRC FINAL FREQUENCY CURVE | | | | *O O | | | | | E | | O OBSERVED (SYSTEMATIC) PEAKS | | | | O O O | | | | | | A | | $ HISTORICALLY ADJUSTED PEAKS | | | O OO | | | | | | K | | # SYSTEMATIC-RECORD FREQ CURVE| | OOO O * | | | | | | | | WHEN POINTS COINCIDE, ONLY THE | | * | | | | | | | M | | TOPMOST SYMBOL SHOWS. | | O O | | | | | | | | A | | | | | | | OO* | | | | | | | | G | | | | | | O|OO * | | | | | | | | N 1000.0 +----+------------+------+--------+-----+-------O-*---------+-----+--------+------+-------+----+----+-----+ I | | | | | | * | | | | | | | | | T | | | | | | *O | | | | | | | | | U | | | | | * OOO | | | | | | | | | D | | | | | # | | | | | | | | | E | | | | | OO | | | | | | | | | S | | | | * | | | | | | | | | | | | | | # | | | | | | | | | | | | | | | OO O| | | | | | | | | | | | | | OO | | | | | | | | | | / 100.0 +----+------------+------+--------+-----+---------+---------+-----+--------+------+-------+----+----+-----+ L | | | | | | | | | | | | | | | O | | | | | | | | | | | | | | | G | | | | | | | | | | | | | | | | | | | | | | | | | | | | | | S | | | | | | | | | | | | | | | C | | | | | | | | | | | | | | | A | | | | | | | | | | | | | | | L | | | | O | | | | | | | | | | | E | | | | | | | | | | | | | | | / 10.0 +----+------------+------+--------+-----+---------+---------+-----+--------+------+-------+----+----+-----+ | | | | | | | | | | | | | | | | | | | | | | | | | | | | | | | | | | | | | | | | | | | | | | | | | | | | | | | | | | | | | | | | | | | | | | | | | | | | | | | | | | | | | | | | | | | | | | | | | | | | | | | | | | | | | | | | | | | | | | | | | | | | | | | | | | | | | | | 1.0 +----+------------+------+--------+-----+---------+---------+-----+--------+------+-------+----+----+-----+
99.5 99.0 95.0 90.0 80.0 70.0 50.0 30.0 20.0 10.0 5.0 2.0 1.0 0.5 0.2 ANNUAL EXCEEDANCE PROBABILITY, PERCENT (NORMAL SCALE)

PEAKFQ 37 DRAFT - 1/30/98
Figure 8. Example of output from PEAKFQ for the Sugar Creek at Crawfordsville, Ind.
U. S. GEOLOGICAL SURVEY ANNUAL PEAK FLOW FREQUENCY ANALYSIS Following Bulletin 17-B Guidelines Program peakfq (Version 2.3, Jan, 1997)
Station - 03339500 SUGAR CREEK AT CRAWFORDSVILLE, IND. 1997 JAN 7 15:55:09
I N P U T D A T A S U M M A R Y
Number of peaks in record = 42 Peaks not used in analysis = 2 Systematic peaks in analysis = 39 Historic peaks in analysis = 1 Years of historic record = 102 Generalized skew = -0.400 Standard error of generalized skew = 0.550 Skew option = WEIGHTED Gage base discharge = 0.0 User supplied high outlier threshold = 35000.0 User supplied low outlier criterion = -- Plotting position parameter = 0.00
********* NOTICE -- Preliminary machine computations. ********* ********* User responsible for assessment and interpretation. *********
**WCF109W-PEAKS WITH MINUS-FLAGGED DISCHARGES WERE BYPASSED. 2 **WCF113W-NUMBER OF SYSTEMATIC PEAKS HAS BEEN REDUCED TO NSYS = 39 WCF134I-NO SYSTEMATIC PEAKS WERE BELOW GAGE BASE. 0.0 WCF198I-LOW OUTLIERS BELOW FLOOD BASE WERE DROPPED. 1 1457.8 *WCF161I-USER HIGH OUTLIER CRITERION REPLACES WRC. 35000.0 43331.8 WCF165I-HIGH OUTLIERS AND HISTORIC PEAKS ABOVE HHBASE. 0 1 35000.0 WCF002J-CALCS COMPLETED. RETURN CODE = 2
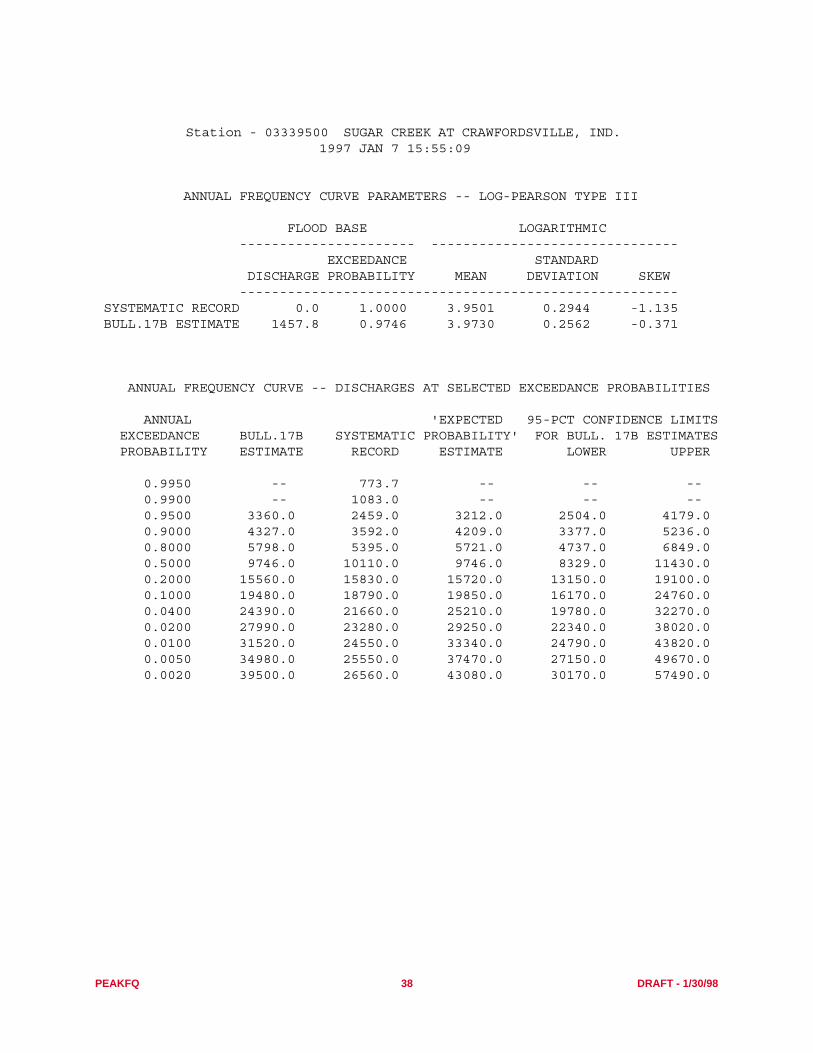
PEAKFQ 38 DRAFT - 1/30/98
Station - 03339500 SUGAR CREEK AT CRAWFORDSVILLE, IND. 1997 JAN 7 15:55:09
ANNUAL FREQUENCY CURVE PARAMETERS -- LOG-PEARSON TYPE III
FLOOD BASE LOGARITHMIC ---------------------- ------------------------------- EXCEEDANCE STANDARD DISCHARGE PROBABILITY MEAN DEVIATION SKEW ------------------------------------------------------- SYSTEMATIC RECORD 0.0 1.0000 3.9501 0.2944 -1.135 BULL.17B ESTIMATE 1457.8 0.9746 3.9730 0.2562 -0.371
ANNUAL FREQUENCY CURVE -- DISCHARGES AT SELECTED EXCEEDANCE PROBABILITIES
ANNUAL 'EXPECTED 95-PCT CONFIDENCE LIMITS EXCEEDANCE BULL.17B SYSTEMATIC PROBABILITY' FOR BULL. 17B ESTIMATES PROBABILITY ESTIMATE RECORD ESTIMATE LOWER UPPER
0.9950 -- 773.7 -- -- -- 0.9900 -- 1083.0 -- -- -- 0.9500 3360.0 2459.0 3212.0 2504.0 4179.0 0.9000 4327.0 3592.0 4209.0 3377.0 5236.0 0.8000 5798.0 5395.0 5721.0 4737.0 6849.0 0.5000 9746.0 10110.0 9746.0 8329.0 11430.0 0.2000 15560.0 15830.0 15720.0 13150.0 19100.0 0.1000 19480.0 18790.0 19850.0 16170.0 24760.0 0.0400 24390.0 21660.0 25210.0 19780.0 32270.0 0.0200 27990.0 23280.0 29250.0 22340.0 38020.0 0.0100 31520.0 24550.0 33340.0 24790.0 43820.0 0.0050 34980.0 25550.0 37470.0 27150.0 49670.0 0.0020 39500.0 26560.0 43080.0 30170.0 57490.0

PEAKFQ 39 DRAFT - 1/30/98
Station - 03339500 SUGAR CREEK AT CRAWFORDSVILLE, IND. 1997 JAN 7 15:55:09
I N P U T D A T A L I S T I N G
WATER YEAR DISCHARGE CODES WATER YEAR DISCHARGE CODES
-1913 36000.0 H 1957 26300.0 1927 -24300.0 H 1958 15100.0 1937 -8720.0 H 1959 14600.0 1939 17600.0 1960 7300.0 1940 3660.0 1961 8580.0 1941 903.0 1962 15100.0 1942 5050.0 1963 15100.0 1943 24000.0 1964 21800.0 1944 11400.0 1965 6200.0 1945 9470.0 1966 2130.0 1946 8970.0 1967 11100.0 1947 7710.0 1968 14300.0 1948 14800.0 1969 11200.0 1949 13900.0 1970 6670.0 1950 20800.0 1971 5440.0 1951 9470.0 1972 9370.0 1952 7860.0 1973 6900.0 1953 7860.0 1974 9680.0 1954 2730.0 1975 6810.0 1955 6480.0 1976 7730.0 1956 18200.0 1977 5290.0
Explanation of peak discharge qualification codes
PEAKFQ WATSTORE CODE CODE DEFINITION
D 3 Dam failure, non-recurrent flow anomaly G 8 Discharge greater than stated value X 3+8 Both of the above L 4 Discharge less than stated value K 6 OR C Known effect of regulation or urbanization H 7 Historic peak

PEAKFQ 40 DRAFT - 1/30/98
Station - 03339500 SUGAR CREEK AT CRAWFORDSVILLE, IND. 1997 JAN 7 15:55:09
EMPIRICAL FREQUENCY CURVES -- WEIBULL PLOTTING POSITIONS
WATER RANKED SYSTEMATIC BULL.17B YEAR DISCHARGE RECORD ESTIMATE
-1913 36000.0 -- 0.0097 1957 26300.0 0.0250 0.0271 1943 24000.0 0.0500 0.0523 1964 21800.0 0.0750 0.0774 1950 20800.0 0.1000 0.1026 1956 18200.0 0.1250 0.1277 1939 17600.0 0.1500 0.1529 1958 15100.0 0.1750 0.1780 1962 15100.0 0.2000 0.2031 1963 15100.0 0.2250 0.2283 1948 14800.0 0.2500 0.2534 1959 14600.0 0.2750 0.2786 1968 14300.0 0.3000 0.3037 1949 13900.0 0.3250 0.3289 1944 11400.0 0.3500 0.3540 1969 11200.0 0.3750 0.3791 1967 11100.0 0.4000 0.4043 1974 9680.0 0.4250 0.4294 1945 9470.0 0.4500 0.4546 1951 9470.0 0.4750 0.4797 1972 9370.0 0.5000 0.5049 1946 8970.0 0.5250 0.5300 1961 8580.0 0.5500 0.5551 1952 7860.0 0.5750 0.5803 1953 7860.0 0.6000 0.6054 1976 7730.0 0.6250 0.6306 1947 7710.0 0.6500 0.6557 1960 7300.0 0.6750 0.6809 1973 6900.0 0.7000 0.7060 1975 6810.0 0.7250 0.7311 1970 6670.0 0.7500 0.7563 1955 6480.0 0.7750 0.7814 1965 6200.0 0.8000 0.8066 1971 5440.0 0.8250 0.8317 1977 5290.0 0.8500 0.8569 1942 5050.0 0.8750 0.8820 1940 3660.0 0.9000 0.9071 1954 2730.0 0.9250 0.9323 1966 2130.0 0.9500 0.9574 1941 903.0 0.9750 0.9826 1937 -8720.0 -- -- 1927 -24300.0 -- --

PEAKFQ 41 DRAFT - 1/30/98
U. S. GEOLOGICAL SURVEY ANNUAL PEAK FLOW FREQUENCY ANALYSIS Following Bulletin 17-B Guidelines Program peakfq (Version 2.3, Jan, 1997) 1997 JAN 7 15:55:09
Station - 03339500 SUGAR CREEK AT CRAWFORDSVILLE, IND.
100000.0 +----+------------+------+--------+-----+---------+---------+-----+--------+------+-------+----+----+-----+ | | | | | | | | | | | | | | | | | | | | | | | | | | | | | | | | | | | | | | | | | | | | | | | ***** NOTICE ***** NOTICE ****** | | | | | | | | | A | | * PRELIMINARY MACHINE COMPUTATION. * | | | | | | | | | N | | * USER IS RESPONSIBLE FOR ASSESS- * | | | | | | | | | N | | * MENT AND INTERPRETATION. * | | | | | | | | | U | | ************************************ | | | | | | | | * A | | | | | | | | | | | | $ * | L 31600.0 +----+------------+------+--------+-----+---------+---------+-----+--------+------+-------+----*----+-----+ | | PLOT SYMBOL KEY | | | | | | * * | | | P | | * WRC FINAL FREQUENCY CURVE | | | | | O * $O | # # # E | | O OBSERVED (SYSTEMATIC) PEAKS | | | | | O * # # # | | | A | | $ HISTORICALLY ADJUSTED PEAKS | | | | * # | | | | K | | # SYSTEMATIC-RECORD FREQ CURVE| | | | O O # | | | | | | | WHEN POINTS COINCIDE, ONLY THE | | | O* O | | | | | | M | | TOPMOST SYMBOL SHOWS. | | OO$OO | | | | | | | A | | | | | | | * | | | | | | | G | | | | | | | **O$O | | | | | | | | N 10000.0 +----+------------+------+--------+-----+---------*OO-O-----+-----+--------+------+-------+----+----+-----+ I | | | | | | # *OOO | | | | | | | | T | | | | | | $OO*O | | | | | | | | | U | | | | | O *O | | | | | | | | | D | | | | $OO O | | | | | | | | | | E | | | | $O * | | | | | | | | | | S | | | | $O$O | | | | | | | | | | | | | | * | | | | | | | | | | | | | | | | | | | | | | | | | | | | * $O | | | | | | | | | | | / 3160.0 +----+----------*-+------+--------+-----+---------+---------+-----+--------+------+-------+----+----+-----+ L | | | $O | | | | | | | | | | | | O | | # | | | | | | | | | | | | G | | #$O | | | | | | | | | | | | | | | | | | | | | | | | | | | S | | # | | | | | | | | | | | | | C | | # | | | | | | | | | | | | | A | | | | | | | | | | | | | | | L | | | | | | | | | | | | | | | E | # | | | | | | | | | | | | | / 1000.0 +----+------------+------+--------+-----+---------+---------+-----+--------+------+-------+----+----+-----+ | | $ O | | | | | | | | | | | | | # | | | | | | | | | | | | | | | | | | | | | | | | | | | | | | | | | | | | | | | | | | | | | | | | | | | | | | | | | | | | | | | | | | | | | | | | | | | | | | | | | | | | | | | | | | | | | | | | | | | | | | | | | | | | | | | | | | | | | | | 316.0 +----+------------+------+--------+-----+---------+---------+-----+--------+------+-------+----+----+-----+
99.5 99.0 95.0 90.0 80.0 70.0 50.0 30.0 20.0 10.0 5.0 2.0 1.0 0.5 0.2 ANNUAL EXCEEDANCE PROBABILITY, PERCENT (NORMAL SCALE)
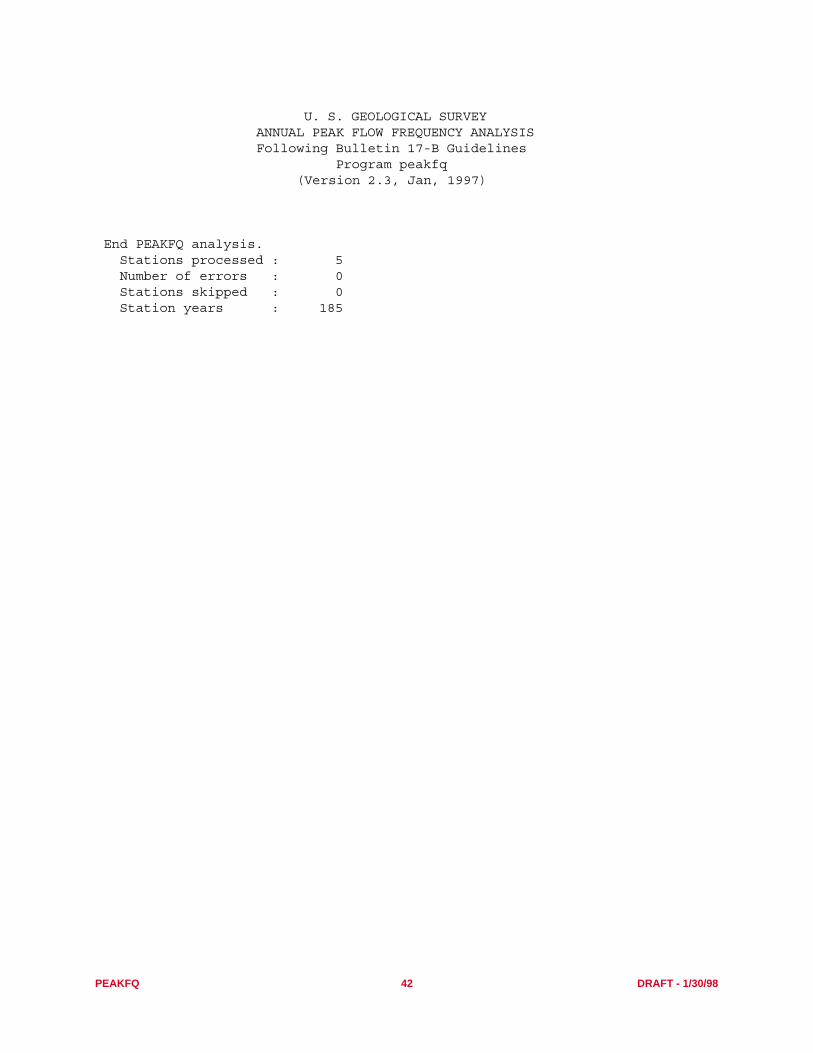
PEAKFQ 42 DRAFT - 1/30/98
U. S. GEOLOGICAL SURVEY ANNUAL PEAK FLOW FREQUENCY ANALYSIS Following Bulletin 17-B Guidelines Program peakfq (Version 2.3, Jan, 1997)
End PEAKFQ analysis. Stations processed : 5 Number of errors : 0 Stations skipped : 0 Station years : 185

PEAKFQ 43 DRAFT - 1/30/98
PEAKFQ example: wdm input PEAKFQ
Opening Screen
The program version number and date (2.3 and January 7, 1997, respectively) are included inthe heading of the Opening screen. The program name and version number are also includedin the upper right hand corner of the screen and on all subsequent screens. The primary pro-gram options are all found on the opening screen. They should be accessed in the order InputOutput, Modify, and Start processing.
The STATUS window in the middle of the screen includes information on the source of thedata to be analyzed, the number of stations being analyzed and the names of input and outputfiles. This information is updated as the information is changed. Initially, the input format isunknown and the default output file is PEAKFQ.OUT.
Input
Data from 3 sources can be processed: (1) Watershed Data Management (WDM) file, (2)ASCII file in the standard WATSTORE card-image format, and (3) keyboard entry. Thisexample shows the WDM option, see Input in the next section for a complete description ofthe input options.

PEAKFQ 44 DRAFT - 1/30/98
PEAKFQ example: wdm input PEAKFQ
Input / Wdm
With the WDM input option, the user specifies the name of the WDM file to be used andselects the data sets to be used. A WDM file must be open before data sets can be selected.
Input / WDM / File
From the File menu, the user may select to Open and existing WDM file, Close a previouslyopened WDM file, or get a brief Summary of the contents of an open WDM file. PEAKFQdoes not support accessing multiple WDM files, but an open WDM file can be closed andanother opened. After opening a new WDM file, data sets must be re-selected.

PEAKFQ 45 DRAFT - 1/30/98
PEAKFQ example: wdm input PEAKFQ
Input / Wdm / File / Open
The name of an existing WDM file is entered. There are no restriction on WDM file names.Any name that is valid on the computer being used is acceptable. However, the suffix .WDMor .wdm is suggested to make the files easy to identify. If the file is not in the local directory, afull or relative path name can be included.
Note that once this screen is exited, the STATUS window will identify this WDM file as beingthe source of the data to be analyzed.
Input / Wdm / File (screen with selection of Return option not shown)
Input / Wdm
Once an existing WDM file has been opened, the data sets to be analyzed are Selected.

PEAKFQ 46 DRAFT - 1/30/98
PEAKFQ example: wdm input PEAKFQ
Input / Wdm / Select
The select option offers a number of options for selecting and unselecting data sets. The data-set number (dsn) of each selected data set is stored in a buffer. The contents of the buffer deter-mine what data sets will be analyzed by PEAKFQ. Data sets may be Added to or Droppedfrom the buffer by number. Data sets may also be selected by Browsing a brief description ofthe data sets in the wdm file or by searching the contents using Boolean criteria. For a detaileddescription of all of the Select options, see the next section.
Note that initially, the STATUS window indicates three are no data sets in the buffer. After theSelect menu is exited the STATUS window will be updated to indicate the number of data setsin the buffer.
Input / Wdm / Select / Add
The Add option is used to add data sets to the buffer using the data-set number. Up to 24 dataset can be added to the buffer at a time. The Add option may be selected as many times asneeded to add all the desired data sets to the buffer.
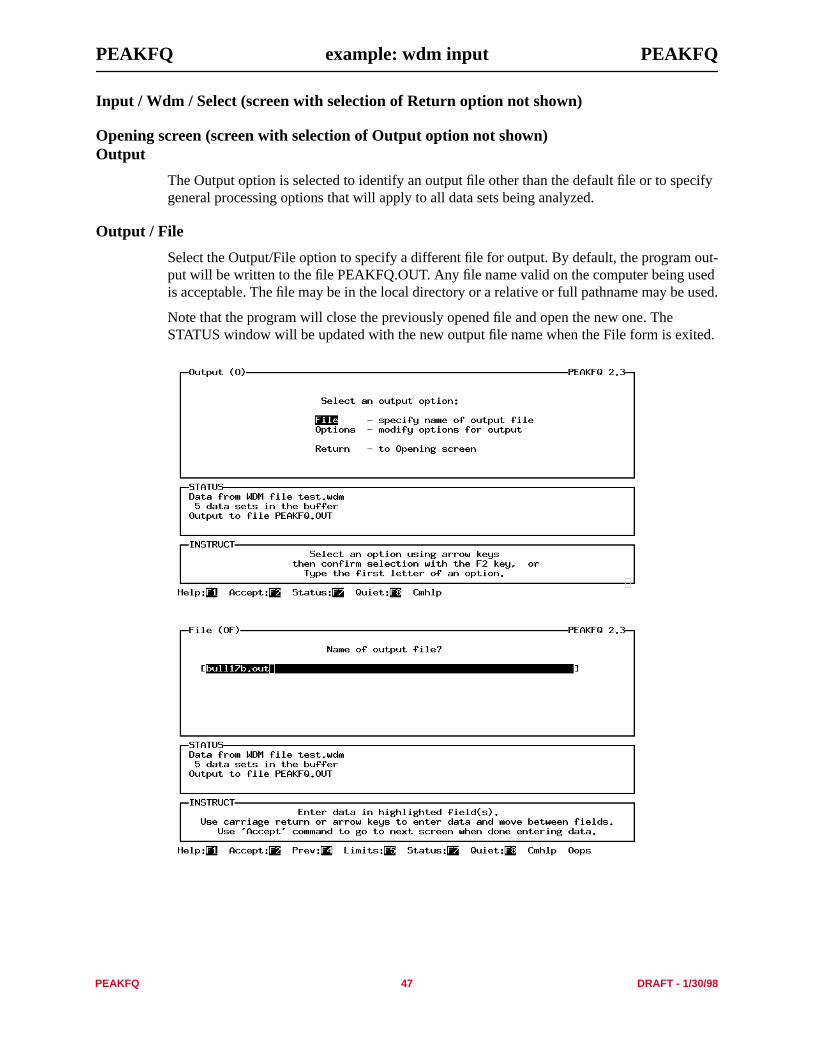
PEAKFQ 47 DRAFT - 1/30/98
PEAKFQ example: wdm input PEAKFQ
Input / Wdm / Select (screen with selection of Return option not shown)
Opening screen (screen with selection of Output option not shown)Output
The Output option is selected to identify an output file other than the default file or to specifygeneral processing options that will apply to all data sets being analyzed.
Output / File
Select the Output/File option to specify a different file for output. By default, the program out-put will be written to the file PEAKFQ.OUT. Any file name valid on the computer being usedis acceptable. The file may be in the local directory or a relative or full pathname may be used.
Note that the program will close the previously opened file and open the new one. TheSTATUS window will be updated with the new output file name when the File form is exited.

PEAKFQ 48 DRAFT - 1/30/98
PEAKFQ example: wdm input PEAKFQ
Output (screen with selection of Options option not shown)Output/Options
Select Output/Options to modify options for output that will be used for all of the data setsprocessed. These include plotting styles, saving additional output to other files, having the pro-gram pause between processing each data set. and including additional information in the out-put file.
In the example, plot style was changed from NONE to Both, causing the print file to containthe old-fashioned line printer plots and also generating the more modern-style graphical out-put. The default value was used for all other options.
Options (screen with selection of Return option not shown)

PEAKFQ 49 DRAFT - 1/30/98
PEAKFQ example: wdm input PEAKFQ
Opening Screen (screen showing selection of Modify option not shown.
ModifyModify / Options
The modify option is selected to change processing options that apply to the calculations forindividual data sets.
Select Options to modify the analysis period, skew method, and whether or not to includeurban or regulated peaks. The initial default values for the dates are based on the availableperiod of record. The initial default for the skew computation option is weighted between sta-tion and generalized skews (WTD), with the other options being STAtion and GENeralized.By default, urban and regulated peaks are not included. When processing data from a WDMfile, peakfq will save these options and they will be provided as the data sets defaults for futureanalyses. The first column in the table is informational and cannot be modified.
In the example, the Begin and End years were modified to correspond to the dates used in theBulletin 17B report. The skew computation option remained as WeighTeD and urban and reg-ulated peaks were not included (the default values.)

PEAKFQ 50 DRAFT - 1/30/98
PEAKFQ example: wdm input PEAKFQ
Modify (screen with selection of Skew option not shown)Modify / SkewModify / Skew (User)
Select Skew to enter generalized skew and standard error, replacing the estimate for the gener-alized skew map of the Bulletin 17-B guidelines. By default, the Bulletin 17-B values will beused and the computed skews will be saved in each data set. If User skew is selected, the gen-eralized skew values are entered on a second Skew screen. In the second skew screen, the firstcolumn in the table is informational and cannot be modified.
In the example, the type of generalized skew was changed from the default 17B to User andGeneralized skew values were entered for each of the data sets.

PEAKFQ 51 DRAFT - 1/30/98
PEAKFQ example: wdm input PEAKFQ
Modify (screen with selection of Historic option not shown)Modify / Historic
The Historic option is selected to modify the length of the historic return period and (or) Bul-letin 17-B computed high-outlier discharge threshold. The first three columns in the table areinformational and cannot be modified.
In the example, values for the second and 5th data sets were modified to correspond to theexamples in the Bulletin 17-B report.
Modify (screen with selection of Low option not shown)Modify / Low
Select Low to specify a discharge below which historic peaks will not be used in the calcula-tions. If a value greater than 0.0 is entered, this will override the Bulletin 17-B computed low-outlier criteria. The first two columns in the table are informational and cannot be changed.The lowest peak flow column contains the lowest annual peak flow in the systematic record.
In the example, no changes were made.

PEAKFQ 52 DRAFT - 1/30/98
PEAKFQ example: wdm input PEAKFQ
Modify (screen with selection of Base option not shown)Modify / Base
Select Base to adjust the lower limit for measurable flood discharge, this is used in conjunctionwith the “less than” qualification code. A value greater than 0.0 will supersede the gage basedischarge inferred from any “less than” qualification codes. The first column in the table ininformational and cannot be modified. In the example, no values were entered.
Modify (screen with selection of Return option not shown)
Opening Screen (screen with selection of Start option not shown)Start
After the Input source has been specified and any desired Output or Modify entries have beenmade, select Start to perform the analysis.
If the plot style Graphics or Both was specified on the Output /Options screen, the screen forselecting the output graphics device will be displayed.

PEAKFQ 53 DRAFT - 1/30/98
PEAKFQ example: wdm input PEAKFQ
Start (results of analysis)
In the example, the computed statistics and plots for each of the data sets were displayed onthe screen (on the Output/Options screen, Yes was specified for Pause between stations.)

PEAKFQ 54 DRAFT - 1/30/98
PEAKFQ example: wdm input PEAKFQ

PEAKFQ 55 DRAFT - 1/30/98
PEAKFQ example: wdm input PEAKFQ
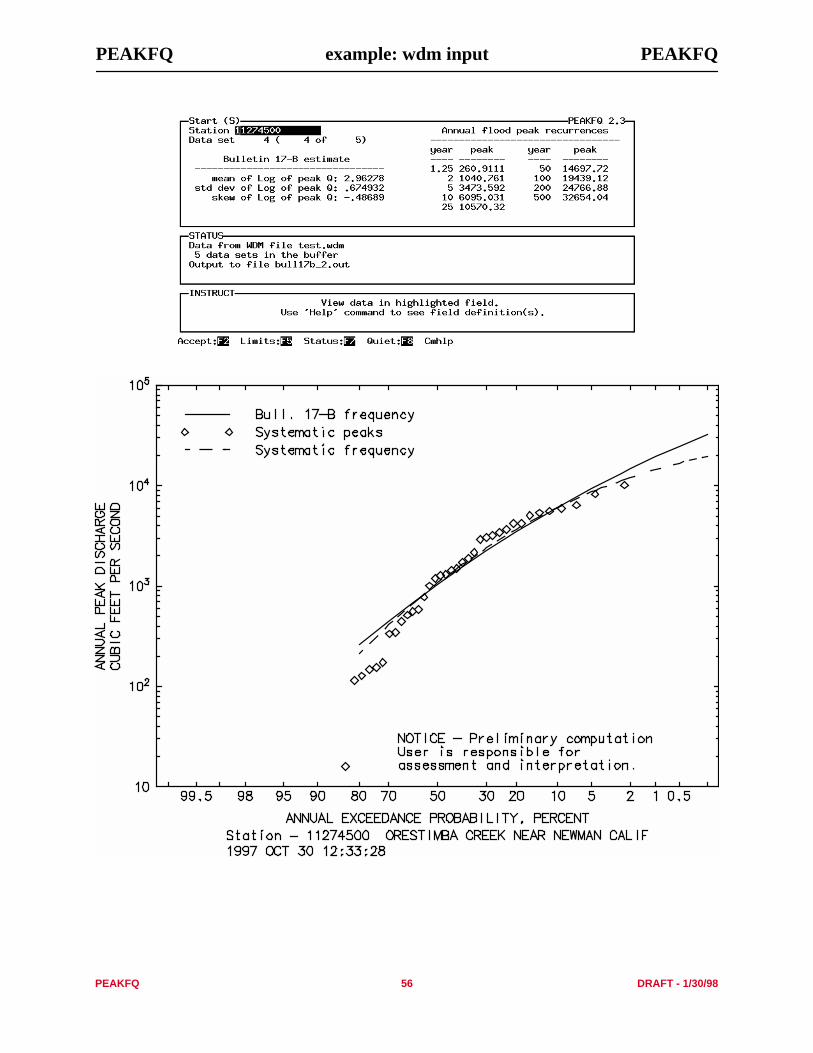
PEAKFQ 56 DRAFT - 1/30/98
PEAKFQ example: wdm input PEAKFQ

PEAKFQ 57 DRAFT - 1/30/98
PEAKFQ example: wdm input PEAKFQ

PEAKFQ 58 DRAFT - 1/30/98
PEAKFQ example: wdm input PEAKFQ
(finished processing)
A screen indicating that all of the stations have been processed is displayed.
Opening screen
After all of the stations have been processed, the user can change the general Output options,Modify the processing options for selected data sets, or select new Input to analyze a differentset of data.

PEAKFQ 59 DRAFT - 1/30/98
PEAKFQ example: ascii input PEAKFQ
Opening screen
The program version number and date (2.3 and January 7, 1997, respectivley) areincluded in the heading of the Opening screen. The program name and version num-ber are also included in the upper right hand corner of the screen and on all subse-quent screens. The primary program options are all found on the opening screen.They should be accessed in the order Input Output, Modify, and Start processing.
The STATUS window in the middle of the screen includes information on the sourceof the data to be analyzed, the number of stations being analyzed and the names ofinput and output files. This information is updated as the information is changed. Ini-tially, the input format is unknow and the default output file is PEAKFQ.OUT.
Input
Data from 3 sources can be processed: (1) Watershed Data Management (WDM) file,(2) ASCII file in the standard WATSTORE card-image format, and (3) keyboard entry.This example shows the ASCII option.

PEAKFQ 60 DRAFT - 1/30/98
PEAKFQ example: ascii input PEAKFQ
Input / ASCII
With the ASCII input option, the user supplies the name of the file containing the peakflow data to be analyzed. This file must be in the standard, WATSTORE card-imageformat, as described in Appendix B. This file may contain data for one or more sta-tions. After the file has been opened, the user specifies whether ALL or SOME of thestations in the file are to be analyzed. If ALL is specified, all stations in the file will beanalyzed. If SOME is specified, the station numbers for up to 20 stations to be ana-lyzed are entered, including any leading zeros as appropriate.
Note that once the input file has been opened, the STATUS window is updated to indi-cate input is from the Watstore-formatted file test4.inp.

PEAKFQ 61 DRAFT - 1/30/98
PEAKFQ example: ascii input PEAKFQ
Opening screen (screen with selection of Output option not shown)Output
The Output option is selected to identify an output file other than the default file or tospecify general processing options that will apply to all stations being analyzed.
Output / File
Select the Output/File option to specify a different file for output. By default, the pro-gram output will be written to the file PEAKFQ.OUT. Any file name valid on the com-puter being used is acceptable. The file may be in the local directory or a relative orfull pathname may be used.
Note that the program will close the previously opened file and open the new one. TheSTATUS window will be updated with the new output file name when the File form isexited.

PEAKFQ 62 DRAFT - 1/30/98
PEAKFQ example: ascii input PEAKFQ
Output (screen with selection of Options option not shown)Output/Options
Select Output/Options to modify options for output that will be used for all of the sta-tions processed. These include plotting styles, saving additional output to other files,having the program pause between processing each data set. and including additionalinformation in the output file. If WAtstore or Both is specified for additional output,the name for the output file is entered in a separate screen.
In the example, plot style was changed from NONE to GRAPHICS and additional out-put was specified in the WAtstore format. This will produce the more modern-stylegraphical output and a file containing the computed basin characteristics statistics. Thedefault value was used for all other options. Since WAtstore output was specified, thefile name is entered.
Options (screen with selection of Return option not shown)

PEAKFQ 63 DRAFT - 1/30/98
PEAKFQ example: ascii input PEAKFQ
Opening Screen (screen showing selection of Modify option not shown.Modify
The modify option is selected to specify whether or not computational options willneed to be modified for any of the stations. If Yes is selected, modifications may bemade for each station as it is processed. If No is selected, the default processingoptions will be used. This differs from processing data input from a WDM file, wherethe computational options are specified for all data sets before processing begins.
Computational options that may be modified during processing include analysisperiod, skew methods, historic return periods, discharge threshold , and low outliercriteria. The default computational options are determined by the contents of the inputfile, including any “I” records that may be present. See the Start / Modify descriptionof this example for details of the computational options.

PEAKFQ 64 DRAFT - 1/30/98
PEAKFQ example: ascii input PEAKFQ
Opening screen (screen with selection of Start option not shown)Start
After the Input source has been specified and any desired Output or Modify entrieshave been made, select Start to perform the analysis.
If the plot style Graphics or Both was specified on the Output /Options screen, thescreen for selecting the output graphics device will be displayed. For some outputgraphics devices, the name of a file for graphical output may need to be entered.
In the example, the Laser option generates a PostScript file that can be printed on alaser printer or other device that recognizes the PostScript language.

PEAKFQ 65 DRAFT - 1/30/98
PEAKFQ example: ascii input PEAKFQ
Start - Modify
If Yes was specified under the Modify option on the Opening Screen, a Modify screenwill be presented for each station from the ASCII input file, as it is processed. This isin contrast to the WDM Input option, where all computation modifications are madefor all data sets being processed before any processing starts. The default values on theModify screen are determined by the contents of the input file, including any “I”records that may be present. All of the computation options can be changed by theuser.
By default, the begin and end year fields contain the water years of the first and last,respectivley, peaks in the input file for the station. If an “I” record is present, positivevalues in the begin and (or) end year fields will be provided as the defaults. This willdetermine the period of record to be used in the calculations.
By default, the length of the historic period is zero; no historic adjustment is appliedduring computation, the historic peaks are ignored, and any high outliers are treated asnormal systematic peaks. If an “I” record is present, a positive value in the length ofhistoric period field will be provided as the default. If positive, the historic period con-tains the systematic record as a subset.
The skew computation option is, by default, weighted between station and generalizedskews (WTD, Bulletin 17B weighted skew.) If an “I” record is present with a stationoption code of S or G, the default skew option code will be be STAtion or GENeral-ized.
By default, the Bulletin 17B computed low-outlier criterion will be applied duringcomputation, This is indicated by a 0.0 in the low-outlier threshold field. If an “I”record is present, a positive value in the low-outlier discharge criterion field will beprovided as the default. Historic peaks with discharges below the low-outlier thresholdwill not be used in the calculations.
The gage base discharge represents the lower limit of measureable flood peak at a sta-tion; this is 0.0 by default. If an “I” record is present, a positive value in the gage basedischarge field will be provided as the default. A negative or zero value will be ignoredby the program. If positive, this gage base discharge will supersede the gage baseinferred from any “less than” qualification code (4) in the peak record. Note that thisgage base discharge is not the same as the partial-duration base discharge that may bein the station header “Y” record.
The Latitude and Longitude fields contain, by default, the values from the stationheader “H” record. They are used to compute the generalized skew if it is not entered.
By default, the Hi-outlier threshold field is 0.0. If an “I” record is present, a positivevalue in the historic-high-outlier discharge threshold field will be provided as thedefault. If a positive value is specified in this field, it will override the Bulletin-17Bcomputed high-outlier threshold, with all historic peaks that are less than this ignoredin the computations. If this field is blank or negative, the threshold will be set to thevalue of the lowest historic peak.
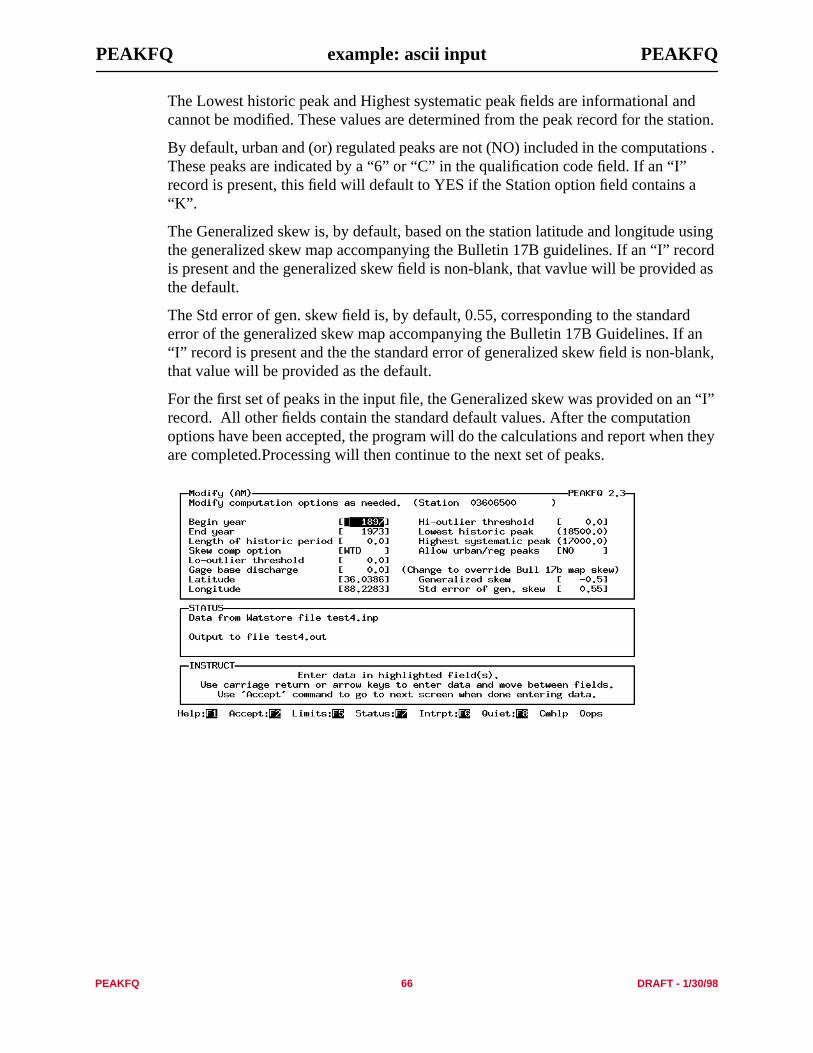
PEAKFQ 66 DRAFT - 1/30/98
PEAKFQ example: ascii input PEAKFQ
The Lowest historic peak and Highest systematic peak fields are informational andcannot be modified. These values are determined from the peak record for the station.
By default, urban and (or) regulated peaks are not (NO) included in the computations .These peaks are indicated by a “6” or “C” in the qualification code field. If an “I”record is present, this field will default to YES if the Station option field contains a“K”.
The Generalized skew is, by default, based on the station latitude and longitude usingthe generalized skew map accompanying the Bulletin 17B guidelines. If an “I” recordis present and the generalized skew field is non-blank, that vavlue will be provided asthe default.
The Std error of gen. skew field is, by default, 0.55, corresponding to the standarderror of the generalized skew map accompanying the Bulletin 17B Guidelines. If an“I” record is present and the the standard error of generalized skew field is non-blank,that value will be provided as the default.
For the first set of peaks in the input file, the Generalized skew was provided on an “I”record. All other fields contain the standard default values. After the computationoptions have been accepted, the program will do the calculations and report when theyare completed.Processing will then continue to the next set of peaks.

PEAKFQ 67 DRAFT - 1/30/98
PEAKFQ example: ascii input PEAKFQ
H 03606500 3602190881342004747017SW 6040005 205.00 380.58N 03606500 BIG SANDY RIVER AT BRUCETON, TENNY 03606500 2000.00I -.52 036065003 03606500 189703 250007 18.003 03606500 191903 210007 17.003 03606500 192612 185007 16.503 03606500 19300109 9100 13.983 03606500 19310327 2060 11.203 03606500 19320113 7820 13.603 03606500 19330321 3220 11.953 03606500 19331218 5580 12.943 03606500 19350121 17000 16.163 03606500 19360704 6740 13.283 03606500 19370121 13800 14.863 03606500 19380123 4270 12.67 ...3 03606500 19700403 4330 13.113 03606500 19710824 5080 13.363 03606500 19720717 12000 15.143 03606500 19730421 7640 14.88

PEAKFQ 68 DRAFT - 1/30/98
PEAKFQ example: ascii input PEAKFQ
The second set of peaks in the test4.inp file is a repeat of the first set of peaks, this timewith a different set of options specified on the “I” record. In this case, the “I”: recordcontains values for the Generalized skew (-.5), Lentht of historic period (77), and theSkew computation option (G). The standard defaults are provided for all other options.After the computation options have been accepted, the program will do the calcula-tions and report when they are completed.Processing will then continue to the next setof peaks.
(NOTE: Sets of data with the same station number can only be processed if the ALLoption is selected for which stations to be analyzed on the Inut / ASCII / Stationsscreen.)
H 03606500 3602190881342004747017SW 6040005 205.00 380.58N 03606500 BIG SANDY RIVER AT BRUCETON, TENNY 03606500 2000.00I -.5 77. G2 036065003 03606500 189703 250007 18.003 03606500 191903 210007 17.003 03606500 192612 185007 16.503 03606500 19300109 9100 13.983 03606500 19310327 2060 11.203 03606500 19320113 7820 13.603 03606500 19330321 3220 11.953 03606500 19331218 5580 12.943 03606500 19350121 17000 16.163 03606500 19360704 6740 13.283 03606500 19370121 13800 14.863 03606500 19380123 4270 12.67 ...3 03606500 19700403 4330 13.113 03606500 19710824 5080 13.363 03606500 19720717 12000 15.143 03606500 19730421 7640 14.88

PEAKFQ 69 DRAFT - 1/30/98
PEAKFQ example: ascii input PEAKFQ
For Fishkill Creek at Beacon, NY, the third set of data in the input file, the “I” recordprovides the default value for the Generalized skew (0.6). The standard defaults areprovided for all other options.

PEAKFQ 70 DRAFT - 1/30/98
PEAKFQ example: ascii input PEAKFQ
For Floyd River at James, Iowa, the fourth and fifth sets of peaks in the input file, the“I” record first provides the default for Generalizced skew (-.2). The standard defaultsare provided for the rest of the options.

PEAKFQ 71 DRAFT - 1/30/98
PEAKFQ example: ascii input PEAKFQ
The “I” record for the second set of peaks provides defaults for Generalized skew (-2),Lenth of historic period (82), and the Hi-outlier threshold (70000.). The standarddefaults are provided for the rest of the options.

PEAKFQ 72 DRAFT - 1/30/98
PEAKFQ example: ascii input PEAKFQ
For the Back Creek near Jones Springs, WV, te “I” record provides the default forGeneralized skew (0.2).

PEAKFQ 73 DRAFT - 1/30/98
PEAKFQ example: ascii input PEAKFQ
For the fist set of data for Orestimba Creek near Newman, California, the “I” recordprovides the default for Generalized skew (.2), with the standard defaults provided forthe rest of the options.

PEAKFQ 74 DRAFT - 1/30/98
PEAKFQ example: ascii input PEAKFQ
For the second set of data for Orestimba Creek, the “I” record provides the default forGeneralized skew (.2) and the Skew computation option (G).

PEAKFQ 75 DRAFT - 1/30/98
PEAKFQ example: ascii input PEAKFQ
(finished processing)
A screen indicating that all of the stations have been processed is displayed.
Opening screen
After all of the stations have been processed, the user can change the general Outputoptions, Modify the processing options for selected data sets, or select new Input toanalyze a different set of data.

PEAKFQ 76 DRAFT - 1/30/98
Program Diagnostics
Some common problems and suggested actions associated with running program PEAKFQ aredescribed in table 4.
Table 3. Symptoms and courses of action for troubleshooting PEAKFQ
Symptom Suggested courses of action
1. Error involving high-memoryallocation occurs at startup.
This error may be occurring because other devices or programs addressed in theAUTOEXEC.BAT and CONFIG.SYS root directory files may be interfering.Alter the AUTOEXEC.BAT and CONFIG.SYS files to alleviate this problem.Consult the DOS manual for further instruction.
2. Program is accessed, but the first datascreen is scrambled.
This problem is caused by problems with the AUTOEXEC.BAT andCONFIG.SYS files. These must be altered as stated in 1.
3. Program did accept data in the STARTmenu on the first attempt, but onadditional attempts it did not.
This problem has been found to occur when running program from theWINDOWS environment. Either exit WINDOWS and try running from DOS orselect the RETURN menu to exit program and begin the program again.
4. Program running from WINDOWSenvironment but became inoperativewhen tried to plot frequency curve tothe screen.
While PEAKFQ will usually work from WINDOWS, the plotting will interferewith the SVGA. Sometimes a simple error message is displayed and user cancontinue working in WINDOWS. At other times, however, DOS becomesinoperative. Do not plot with PEAKFQ while in WINDOWS to avoid thisproblem.

PEAKFQ 77 DRAFT - 11/7/97
REFERENCES CITED
Beard, L.R., 1960, Probability estimates based on small normal-distribution samples: Journal of Geophysical
Research, v. 65, no. 7, p. 2143-2148.
Grubbs, F.E., and Beck, Glenn, 1972, Extension of sample sizes and percentage points for significance tests of outlying
observations: Technometrics, v. 14, no. 4, p. 847-854.
Interagency Advisory Committee on Water Data, 1982, Guidelines for determining flood-flow frequency: Bulletin 17B
of the Hydrology Subcommittee, Office of Water Data Coordination, U.S. Geological Survey, Reston, Va., 183 p.
Lepkin, W.D., DeLapp, M.M., Kirby, W.H., and Wilson, T.A., 1979, National Water Data Storage and Retrieval
System WATSTORE User’s Guide: U.S. Geological Survey Open-File Report 79-1336-I, v. 4, ch. I, secs. A, B,
and C.
Tasker, G.D., 1978, Flood Frequency Analysis with a Generalized Skew Coefficient: Water Resources Research, v. 14,
no. 2, p. 373-376.
Wallis, J.R., Matalas, N.C., and Slack, J.R., 1974, Just a Moment: Water Resources Research, v. 10, no. 2, p. 211-219.

PEAKFQ 78 DRAFT - 1/30/98
APPENDIX A. DESCRIPTION OF THE AIDE CHARACTER-BASED USER INTERFACE
User Interface
There are four types of screens that make up PEAKFQ: menu, form fill-in, file name, and informational textscreens. Commands for displaying help information, moving to previous or following screens, and displayingallowable ranges for input values are available on each screen as applicable.
Each screen consists of at least two boxed-in regions, or windows. These two regions are the data window andthe instruction window. A third region, the assistance window, can be displayed or removed from the screen asdesired. Beneath the windows, the available commands appear, with their associated function keys. Figure A.1shows the basic layout of the screens found in PEAKFQ.
All three windows and the line of available commands can be viewed on an 80x24 character screen. Eachwindow has a distinct purpose. User interaction with the program takes place in the data window where menus,input forms, and informational text are displayed. The instruction window contains information on the keystrokesnecessary to interact with the program. Error messages related to invalid keystrokes are also displayed in theinstruction window. When error messages are displayed, the instruction type in the upper left-hand corner of thewindow changes from the usual “INSTRUCT” to “ERROR.” In the assistance window, help information, validranges for input values, and details on program status can be displayed.
Each screen has a name, which is placed where the words screen name appear in figure A.1. The first screen iscalled the opening screen. All subsequent screens are given a name based on the menu option selected. Screennames are followed by a path—a list of characters that represent the keystrokes made to arrive at the current screen.This list of keystrokes can aid in keeping track of where the current screen falls in the menu hierarchy.
Assistance Window
The assistance window appears when the commands Help, Limits, Status, or Cmhlp are chosen. The name ofthe command chosen is placed in the upper left-hand corner of the assistance window, where the words assistancetype appear in figure A.1. The assistance window can be closed by choosing the Quiet command.
Command Line
Figure A.1 describes each of the commands available in PEAKFQ. Most commands are invoked by pressing asingle function key. The Accept command, associated with the F2 function key, is used most frequently in theprocess of using the program. Those commands not invoked by a single function key are chosen by pressing the F3function key or the semicolon key (“;”) followed by the first letter of the command. Pressing either the F3 key orthe semicolon key causes the cursor to be placed at the bottom of the screen; any command can then be invoked bytyping its first letter. Pressing either of these keys a second time without invoking any command will reactivate thedata window. The F3 key and the semicolon key are also used to reactivate the data window when the assistancewindow becomes the active window on the screen. This occurs when a command has been chosen that opens theassistance window and there is more information to be displayed than can be viewed at one time in the four-linewindow. The line of commands at the bottom of the screen disappears and directions are given in the instructionwindow as to how to scroll through the text displayed in the assistance window. Pressing the F3 key or thesemicolon key at this point restores the line of commands and reactivates the data window.
Data Window
Menu selections in the data window can be made by highlighting the desired option through use of the arrowkeys and then invoking the Accept command. Alternatively, the first letter of the desired menu option can be typed.If more than one menu option begins with the same letter, enough characters must be typed to uniquely identify thedesired option.
Form fill-in screens may require character input, such as a yes/no response or numeric input. There are alsooption fields that can be toggled on or off by pressing the space bar. Movement of the cursor around these screensis accomplished through use of the arrow keys or the Enter key.
File name screens contain one input field into which a file name is typed. These file names are checked forvalidity; warnings are issued for invalid file names, and opportunity is given to enter a valid file name.
Informational text screens are displayed to give information on tasks in progress or already completed, as wellas to give explanatory information or error messages. When these screens are displayed, use the Accept commandto continue.

PEAKFQ 79 DRAFT - 1/30/98
a. The function keys will work to invoke the commands on most systems. For those systems where this is not the case,the semicolon key (";") followed by the first letter of the command can be pressed instead.
Figure A.1. Basic PEAKFQ screen layout.
CommandKeys pressed
to invokea Function
Help F1or ;h
Displays help information in the assistance window. Help information is available for menuoptions and for input fields on form fill-in and file name screens. Once Help has been chosen, thehelp information displayed is updated as different screen elements are highlighted and as differentscreens are displayed. The program automatically closes the assistance window if a screen isreached for which there is no help information.
Accept F2or ;a
Indicates that you have “accepted” the input values, menu option currently highlighted, or textmessage in the data window. Causes program execution to continue.
Cmhlp F3cor ;c
Displays brief descriptions of the commands available on the current screen.
Oops F3oor ;o
Redraws screen. Default values replace any values that have been entered. Available on form fill-in and file name screens.
Prev F4or ;p
Re-displays the previous screen. Available on most form fill-in screens and file name inputscreens. The program does not read any input values previously entered if Prev is chosen.
Limits F5or ;l
Displays valid ranges for numeric input and possible responses for character input on form fill-inand file name screens. As with the Help command, information on input limits is updated asdifferent screen elements are highlighted by using the arrow keys or the Enter key.
Intrpt F6or ;i
Interrupts current processing loop, returning program to point of execution previous to currentprocess.
Status F7or ;s
Displays current status information including name of input source, number of stations selected forprocessing, and hydrograph separation method chosen.
Quiet F8or ;q
Closes the assistance window. Only available if the assistance window is open.
Help: Accept: Prev: Limits: Status: Intrpt: Quiet: Cmhlp Oops
instruction type
F1 F4
assistance type
screen name (path) PEAKFQ 1.0
Assistance window
Instruction window
Data window
F2 F5 F6 F8F7

PEAKFQ 80 DRAFT - 1/30/98
APPENDIX B.1. STATION HEADER RECORDS.
WDMrecord column format attribute description------ ------ ------ --------- ------------------------------------------------------- Z 1 "Z" -- Record identifier.
33-37 A5 AGENCY Agency code as assigned by WATSTORE.
------ ------ ------ --------- ------------------------------------------------------- H 1 "H" -- Record identifier.
2-16 A15 STAID or Station identification number. ISTAID
17-31 --- Station locator 3I2 LATDEG Latitude, DDMMSS I3,2I2 LNGDEG Longitude, DDDMMSS I2 Sequence number
32-33 A2 STFIPS Numeric state code where station is located.
34-35 A2 DSCODE For USGS sites only, the district (numeric state code) or the alpha project code of the office responsible for collecting and storing the data.
36-38 A3 COCODE FIPS county code where the station is located.
39-40 A2 SITECO Site code indicating the major class of data collected at the site: SW - stream GW - well SP - spring LK - lake or reservoir ES - estuary ME - meteorological
41-48 I8 HUCODE Hydrologic unit code from the USGS state hydrologic unit maps.
49-55 F7.0 DAREA Total drainage area, in square miles.
56-62 F7.0 CONTDA Contributing drainage area, in square miles.
63-70 F8.0 DATUM Datum, feet above mean sea level.
71-79 F9.0 WELLDP Well depth, in feet.
------ ------ ------ --------- ------------------------------------------------------- N 1 "N" -- Record identifier.
2-16 A15 STAID or Station identification number. ISTAID
17-64 A64 STANAM Station name.
65-72 A8 GUCODE Major geologic unit codes as assigned by WATSTORE.
73 A1 AQTYPE Aquifer type code assigned by WATSTORE: U - unconfined single aquifer N - unconfined multiple aquifers C - confined single aquifer M - confined multiple aquifers X - mixed multiple aquifers
------ ------ ------ --------- ------------------------------------------------------- Y 1 "Y" -- Record identifier.
2-16 A15 STAID or Station identification number. ISTAID
17-23 F7.0 BASEQ Base discharge.
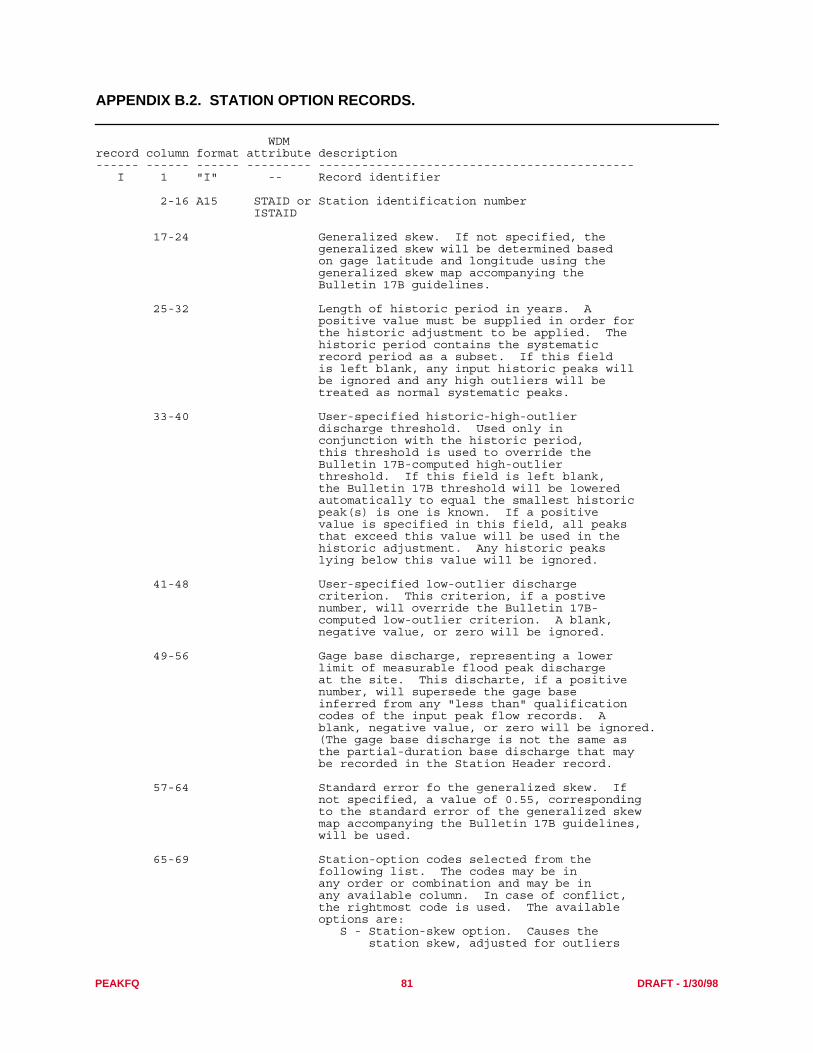
PEAKFQ 81 DRAFT - 1/30/98
APPENDIX B.2. STATION OPTION RECORDS.
WDMrecord column format attribute description------ ------ ------ --------- -------------------------------------------- I 1 "I" -- Record identifier
2-16 A15 STAID or Station identification number ISTAID
17-24 Generalized skew. If not specified, the generalized skew will be determined based on gage latitude and longitude using the generalized skew map accompanying the Bulletin 17B guidelines.
25-32 Length of historic period in years. A positive value must be supplied in order for the historic adjustment to be applied. The historic period contains the systematic record period as a subset. If this field is left blank, any input historic peaks will be ignored and any high outliers will be treated as normal systematic peaks.
33-40 User-specified historic-high-outlier discharge threshold. Used only in conjunction with the historic period, this threshold is used to override the Bulletin 17B-computed high-outlier threshold. If this field is left blank, the Bulletin 17B threshold will be lowered automatically to equal the smallest historic peak(s) is one is known. If a positive value is specified in this field, all peaks that exceed this value will be used in the historic adjustment. Any historic peaks lying below this value will be ignored.
41-48 User-specified low-outlier discharge criterion. This criterion, if a postive number, will override the Bulletin 17B- computed low-outlier criterion. A blank, negative value, or zero will be ignored.
49-56 Gage base discharge, representing a lower limit of measurable flood peak discharge at the site. This discharte, if a positive number, will supersede the gage base inferred from any "less than" qualification codes of the input peak flow records. A blank, negative value, or zero will be ignored. (The gage base discharge is not the same as the partial-duration base discharge that may be recorded in the Station Header record.
57-64 Standard error fo the generalized skew. If not specified, a value of 0.55, corresponding to the standard error of the generalized skew map accompanying the Bulletin 17B guidelines, will be used.
65-69 Station-option codes selected from the following list. The codes may be in any order or combination and may be in any available column. In case of conflict, the rightmost code is used. The available options are: S - Station-skew option. Causes the station skew, adjusted for outliers

PEAKFQ 82 DRAFT - 1/30/98
and historic data, rather than the Bulletin 17B weighted skew, to be used for the final frequency curve. G - Generalized-skew options. Causes the generalized skew, rather than the Bulletin 17B weighted skew, to be used in the final frequency curve. K - Known regulation/urbanization input option. Allows peaks with the known regulation or urbanization codes (6 or C) to be included in the statistical analysis. 71-74 Begin year: first water year of retrieved records to be included in the statistical analysis; earlier years are ignored. This value must be either blank or a four-digit number. If blank or less than the first year of the input record, no years will be dropped from the beginning of the record.
75-78 End year: last water year of retrieved records to be included int the statistical analysis; later years will be ignored. This value must be either blank or a four-digit number. If blank or greater than the last year of the input record, no years will be dropped from the end of the record. xx-xx
___________________________________________________________________________

PEAKFQ 83 DRAFT - 1/30/98
APPENDIX B.3. PEAK-FLOWS RECORDS.
The peak-flows records may be preceded by station header records.
------ ------ ------ --------- ------------------------------------------------------- WDMrecord column format attribute description------ ------ ------ --------- ------------------------------------------------------- 3 1 "3" -- Record identifier.
2-16 A15 STAID or Station identification number. ISTAID
17-20 I4 -- Year peak occurred: o Calendar year if columns 21-22 contain a valid month o Water year if columns 21-22 are blank or 99
21-22 I2 -- Month the annual peak discharge occurred. Blank if month is not known.
23-24 I2 -- Day of the month the annual peak discharge occurred. Blank if day is not known.
25-31 F7.0 -- Annual peak discharge, right justified.
32-43 A12 -- Annual peak discharge qualification codes. More than one code may be associated with a peak, except as noted below. 1 - discharge is a maximum daily average 2 - discharge is an estimate 3 - discharge affected by dam failure 4 - discharge less than indicated value, which is minimum recordable discharge at this site * 5 - discharge affected to unknown degree by regulation or diversion ** 6 - discharge affected by regulation or diversion ** 7 - discharge is a historic peak *** 8 - discharge actually greater than indicated value 9 - discharge due to snowmelt, hurricane, ice-jam or debris dam breakup A - year of occurrence is unknown or not exact B - month or day of occurrence is unknown or not exact C - all or part of the record affected by urbanization, mining, agricultural changes, channelization, or others D - base discharge changed during this year E - only annual maximum peak available for this year
* Code 4 cannot occur simultaneously with codes 1, 2, 3, 7, or 8. ** Codes 5 and 6 cannot occur simultaneously *** Code 7 should indicate that the value for the particular year is a historic peak and the particular year occurred before or after the systematic record, or during a break in the systematic record.
44-51 F8.0 -- Gage height associated with annual peak discharge, right justified in field.
52-55 A4 Gage height qualification codes. More than one code may be associated with a gage height. 1 - gage height affected by backwater

PEAKFQ 84 DRAFT - 1/30/98
2 - gage height not the maximum for the year 3 - gage height at different site and/or datum 4 - gage height below minimum recordable elevation 5 - gage height is an estimate 6 - gage datum changed during this year
* If code 2 is given here, then a date and data entries should be made for the maximum annual gage height (cols 60-75).
56-59 I4 "Highest since" year -- representing the calendar year after which the given peak discharge (cols 25-31) is known to be the highest. This year is determined from historic newspaper accounts, local information, or other sources.
60-61 I2 -- Month in which the annual peak gage height occurred. While this month may not be in the same calendar year as the annual peak, it is that it is in the same water year.
62-63 I2 -- Day of the month of the annual peak gage height.
64-71 F8.0 Annual peak gage height.
72-75 A4 -- Annual peak gage height qualification codes 1 - gage height affected by backwater 3 - gage height at different site and/or datum 5 - gage height is an estimate 6 - gage datum changed during this year
------ ------ ------ --------- ------------------------------------------------------- 4 1 "4" -- Record identifier.
2-16 A15 STAID or Station identification number. ISTAID
17-20 I4 -- Year data on this record occurred o Calendar year if columns 21-22 contain a valid month o Water year if columns 21-22 are blank or 99 This entry may or may not be the same as on the preceding type 3 record if one is present, but the month and year must have occurred in water year as the peak discharge.
21-22 I2 -- Month the partial duration peak occurred. Blank if month is not known.
23-24 I2 -- Day of the month the partial duration peak occurred. Blank if day is not known.
25-31 F7.0 -- Partial duration peak discharge, right justified.
32-43 A12 -- Partial duration peak discharge qualification codes. More than one code may be associated with a peak. 1 - discharge is a maximum daily average 2 - discharge is an estimate 3 - discharge affected by dam failure 4 - discharge less than indicated value, which is minimum recordable discharge at this site * at this site * 5 - discharge affected to unknown degree by regulation or diversion ** 6 - discharge affected by regulation or

PEAKFQ 85 DRAFT - 1/30/98
diversion ** 7 - discharge is an historic peak *** 8 - discharge actually grater than indicated value 9 - discharge due to snowmelt, hurricane, ice-jam or debris dam breakup A - year of occurrence is unknown or not exact B - month or day of occurrence is unknown or not exact C - all or part of the record affected by urbanization, mining, agricultural changes, channelization, or others D - base discharge changed during this year E - only annual maximum peak available for this year
* Code 4 cannot occur simultaneously with codes 1, 2, 3, 7, or 8. ** Codes 5 and 6 cannot occur simultaneously. *** Code 7 should indicate that the value for the particular year is a historic peak and the particular year occurred before or after the systematic record, or during a break in the systematic record.
44-51 F8.0 -- Partial duration peak gage height.
52-55 A4 Partial duration peak gage height qualification codes. More than one code may be associated with a gage height. 1 - gage height affected by backwater 3 - gage height at different site and/or datum 4 - gate height below minimum recordable elevation 5 - gage height is an estimate 6 - gage datum changed during this year

PEAKFQ 86 DRAFT - 1/30/98
APPENDIX C. DATA-SET ATTRIBUTES
Data-set attributes in a Watershed Data Management (WDM) file are used to describe the data sets. Attributesmay describe how the data is stored in the data set, where the data was gathered, physical features of the associateddata, and statistics computed from the associated data.Over 300 attributes are available for describing data sets. Onlya fraction of these attributes are used by PEAKFQ, but any attribute may be present in the data set.
Table C.1 contains a listing and description of the data-set attributes frequently found in annual peak flow datasets. Table C.2 contains a listing of the attributes that PEAKFQ reads and (or) writes or that are frequently associatedwith annual peak flow data sets and how these attributes are used by the PEAKFQ program. The IOWDM program isusually used to add most of these attributes to the data sets, but they can be manually entered using the ANNIEprogram. The basin characteristic and station header formats are described in Appendixes B.1 and B.2 or see theIOWDM and ANNIE documentation for additional details. Some of these attributes may be modified each time thePEAKFQ program is run. Some of these attributes are output from PEAKFQ. Some of these attributes are ignored byPEAKFQ.
Table C.1. Attributes associated with annual peak-flow data sets
Data-set type
Name Type Length Update Time Table Description
AGENCY Char 8 Yes Opt Opt Agency code.AQTYPE Char 4 Yes Opt Opt Aquifer type.
U - unconfined single aquiferN - unconfined multiple aquifersC - confined single aquiferM - confined multiple aquifersX - mixed multiple aquifers
BASEQ Real 1 Yes Opt Opt Base discharge, in cubic feet per second.COCODE Int 1 Yes Opt Opt County or parish code.COMPFG Int 1 No Opt No Compression flag.
1 - yes, data are compressed (default)2 - no, data are not compressedCompressed data will take up less space in the WDM file but mayrequire a COPY operation to update data values.
CONTDA Real 1 Yes Opt Opt Drainage area, in square miles, that contributes to surface runoff.DAREA Real 1 Yes Opt Opt Total drainage area, in square miles, including noncontributing areas.DATUM Real 1 Yes Opt Opt Reference elevation, to mean sea level.DSCODE Int 1 Yes Opt Opt State code of the Geological Survey office that operates the station.
Usually the same as the state code (STFIPS).GUCODE Char 12 Yes Opt Opt Geologic unit code.HUCODE Int 1 Yes Opt Opt Hydrologic unit code (8 digits). These codes are given in the U.S.
Geological Survey map series "State Hydrologic Unit Maps," Open-FileReport 84-708.
ISTAID Int 1 Yes Opt Opt Station identification number, as an integer.J407BQ Real 1 Yes Opt Opt Base gage discharge.J407BY Int 1 Yes Opt Opt Year to begin analysis, used to identify subset of available record.J407EY Int 1 Yes Opt Opt Year to end analysis, used to identify subset of available record.J407GS Real 1 Yes Opt Opt Generalized skew.J407HO Real 1 Yes Opt Opt High outlier discharge criterion.J407LO Real 1 Yes Opt Opt Low outlier discharge criterion.J407NH Int 1 Yes Opt Opt Number of historic peaks.J407SE Real 1 Yes Opt Opt Root mean square error of generalized skew.J407SO Int 1 Yes Opt Opt Generalized skew option.
-1 - station skew 0 - weighted skew 1 - generalized skew
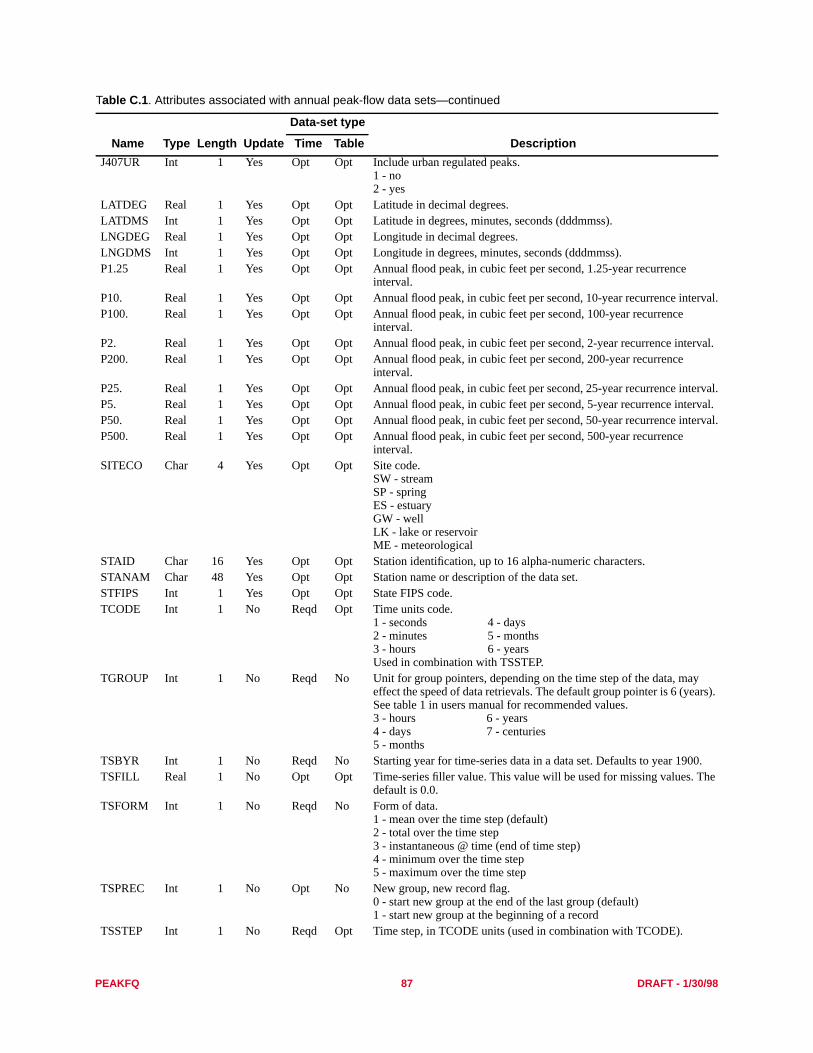
PEAKFQ 87 DRAFT - 1/30/98
J407UR Int 1 Yes Opt Opt Include urban regulated peaks.1 - no2 - yes
LATDEG Real 1 Yes Opt Opt Latitude in decimal degrees.LATDMS Int 1 Yes Opt Opt Latitude in degrees, minutes, seconds (dddmmss).LNGDEG Real 1 Yes Opt Opt Longitude in decimal degrees.LNGDMS Int 1 Yes Opt Opt Longitude in degrees, minutes, seconds (dddmmss).P1.25 Real 1 Yes Opt Opt Annual flood peak, in cubic feet per second, 1.25-year recurrence
interval.P10. Real 1 Yes Opt Opt Annual flood peak, in cubic feet per second, 10-year recurrence interval.P100. Real 1 Yes Opt Opt Annual flood peak, in cubic feet per second, 100-year recurrence
interval.P2. Real 1 Yes Opt Opt Annual flood peak, in cubic feet per second, 2-year recurrence interval.P200. Real 1 Yes Opt Opt Annual flood peak, in cubic feet per second, 200-year recurrence
interval.P25. Real 1 Yes Opt Opt Annual flood peak, in cubic feet per second, 25-year recurrence interval.P5. Real 1 Yes Opt Opt Annual flood peak, in cubic feet per second, 5-year recurrence interval.P50. Real 1 Yes Opt Opt Annual flood peak, in cubic feet per second, 50-year recurrence interval.P500. Real 1 Yes Opt Opt Annual flood peak, in cubic feet per second, 500-year recurrence
interval.SITECO Char 4 Yes Opt Opt Site code.
SW - streamSP - springES - estuaryGW - wellLK - lake or reservoirME - meteorological
STAID Char 16 Yes Opt Opt Station identification, up to 16 alpha-numeric characters.STANAM Char 48 Yes Opt Opt Station name or description of the data set.STFIPS Int 1 Yes Opt Opt State FIPS code.TCODE Int 1 No Reqd Opt Time units code.
1 - seconds 4 - days2 - minutes 5 - months3 - hours 6 - yearsUsed in combination with TSSTEP.
TGROUP Int 1 No Reqd No Unit for group pointers, depending on the time step of the data, mayeffect the speed of data retrievals. The default group pointer is 6 (years).See table 1 in users manual for recommended values.3 - hours 6 - years4 - days 7 - centuries5 - months
TSBYR Int 1 No Reqd No Starting year for time-series data in a data set. Defaults to year 1900.TSFILL Real 1 No Opt Opt Time-series filler value. This value will be used for missing values. The
default is 0.0.TSFORM Int 1 No Reqd No Form of data.
1 - mean over the time step (default)2 - total over the time step3 - instantaneous @ time (end of time step)4 - minimum over the time step5 - maximum over the time step
TSPREC Int 1 No Opt No New group, new record flag.0 - start new group at the end of the last group (default)1 - start new group at the beginning of a record
TSSTEP Int 1 No Reqd Opt Time step, in TCODE units (used in combination with TCODE).
Table C.1. Attributes associated with annual peak-flow data sets—continued
Data-set type
Name Type Length Update Time Table Description

PEAKFQ 88 DRAFT - 1/30/98
TSTYPE Char 4 Yes Opt Opt User-defined four-character descriptor. Used to describe the contents ofthe data set, for example:PRCP, RAIN, SNOW - precipitationFLOW, DISC, PEAK - dischargeTEMP, TMIN, TMAX - temperatureEVAP, PET - evapotranspirationSome models and application programs may require a specific TSTYPEfor data sets they use.
VBTIME Int 1 No Reqd No Variable time-step option for the data set1 - all data are at the same time step2 - time step may vary (default)
WELLDP Real 1 Yes Opt Opt Depth of well, in feet. The greatest depth at which water can enter thewell.
WRCMN Real 1 Yes Opt Opt Mean of logarithms, base 10, of annual peak discharges after outlier andhistoric-peak adjustments.
WRCSD Real 1 Yes Opt Opt Standard deviation of logarithms, base 10, of annual peak dischargesafter outlier and historic-peak adjustments.
WRCSKW Real 1 Yes Opt Opt Skew of logarithms, base 10, of annual peak discharge after outlier andhistoric-peak adjustments and generalized skew weighting.
YRSHPK Int 1 Yes Opt Opt Number of consecutive years used for historic-peak adjustment to flood-frequency data.
Table C.1. Attributes associated with annual peak-flow data sets—continued
Data-set type
Name Type Length Update Time Table Description

PEAKFQ 89 DRAFT - 1/30/98
------------------------------------------------------------------------------Table C.2. Sources of attributes associated with peak-flow data sets------------------------------------------------------------------------------WDM file as processed by IOWDM PEAKFQ--------- --------------------------- use * * i - input by userattribute basin charac statn header ------- r - read from WDM name no. name no. name rec i r w p w - written to WDM---------- ------------ ------------ ------- p - written to "punch"istaid 51 sta id -- sta id N xstaid 2 sta id -- sta id N x xstanam 45 sta name -- sta name N x xlatdms 54 xlngdms 55 xlatdeg 8 lat gage 22 latitude H x xlngdeg 9 lng gage 23 longitude H x xyrshpk 81 yrshispk 197 x xj407by 278 x xj407ey 279 x xj407lo 269 x xj407ho 270 x xj407so 271 x xj407gs 272 x xj407bq 273 x xj407se 275 x xj407ur 276 x xj407nh 274 xwrcmn 78 wrc mn 180 x xwrcsd 79 wrc sd 181 x xwrcskw 77 wrc skew 179 x xp1.25 65 p1,25 75 x xp2. 66 p2 76 x xp5. 67 p5 77 x xp10. 68 p10 78 x xp25. 69 p25 79 x xp50. 70 p50 80 x xp100. 71 p100 81 x xp200. 72 p200 82 x xp500. 73 p500 178 x x
meanpk 74 meanpk 83 xsdpk 75 sdpk 84 xskewpk 76 skewpk 85 xtmtopk 98 timetopk 21yrspk 80 yrspk 196 xdarea 11 area 1 area Hcontda 43 contda 2 cont area Hagency 40 agency Zstfips 41 state c -- state code Hdscode 42 dist c -- dist code Hsiteco 44 site code Hhucode 4 hyd unit c Hdatum 264 datum Hwelldp 47 well dpth Hgucode 46 geol unit Naqtype 48 aquifer tp Nbaseq 49 base q Y______________________________________________________________________________

peakfqf Diagnostic Messages 09/17/99 1 of 7
PEAKFQ Diagnostic Messages
The diagnostic messages included in the peakfq output file are the same as those included in the original J407 procedurein WATSTORE. Diagnostic messages are produced when real or potential errors are detected. These messages are listedand are briefly explained below. (Taken directly from Kirby, W.H., 1981, Annual flood frequency analysis using U.S.Water Resources Council guidelines (program J407): U.S. Geological Survey Open-File Report 79-1336-I,WATSTORE User’s Guide, v. 4, chap. I, sec. C, 56 p.)
Note: In peakfq, references to Water Resources Council guidelines have been replaced with references to Bulletin 17B.With respect to the messages listed below, WRC may be replaced with 17B in the peakfq output.
Most of the messages have the following general format:
***iiinnnn - text data
in which:
*** represents a variable number, possibly zero, of asterisks, to call attention to the message
iii identifies the general part of the program producing the message as follows:INP - input processingPKF - reading the peak flow file retrieval records or the log-Pearson cardsWCF - flood frequency calculations following WRC guidelines
nnn is a message number. The messages are listed below approximately in alphabetic and numericalorder by identifier and number
s is a severity indicator. E means error, W means warning, I and J mean routine information, and Lmeans listing of data or results
text is the text of the message
data is a list of numbers or words generally in the same order as items mentioned in the text
J407 MESSAGES
FRQPLT WILL DROP POINTS BELOW PLOT BASE.
One or more points on the computed empirical frequency curves fall below the lower boundary of the plot.These points will not be plotted.
INP104 STA HAS INVALID AUX DATA CODE. station-ident code
Columns 63-67 (Code) of the station name card contain characters not accepted by J407. The station isrejected.
INP112E GEN SKEW OUT OF RANGE station-ident gs
Input generalized skew gs has absolute value greater than 2.5. Probable error in input data. The station isrejected and the next input data set is sought, unless this message is followed by INP119E.
INP119E ATTEMPTED FIXUP--NEW GEN SKEW = gs
This message follows INP112 if it seems possible that the input generalized skew has a misplaced decimalpoint. The value gs is assumed to be the intended input skew.
INP923 STA HAS INVALID PEAK COUNTS NHIST, NSYS station-ident nhist nsys
Either the number of historic peaks (nhist) or the number of systematic peaks (nsys) was less than zero ortheir sum was less than or equal to zero. Probable cause--invalid input peak counts or input cards out oforder. The station is rejected.

peakfqf Diagnostic Messages 09/17/99 2 of 7
INP971 END OF INPUT/CMD STREAM.
The end of the input data has been reached. This marks the normal end of the job.
INPD11W UNDEFINED CONTROL CARD FLUSHED. card
A control card of undefined type has been encountered. The first 52 characters of the card are printed. Thecard type ($JOB, $OPT) will appear in columns 1-4 and the XJ407 field in columns 5-9. Probable cause -misspelled card type or station name card with no systematic record (zero in cols 68-70). The card isignored.
INPD18W UNDEFINED OPTIONS IGNORED. n card
A control card has been recognized and processed, but it contains one or more (n) undefined option fields.The card image is printed. The card type ($JOB, $OPT) will appear in columns 1-4 and the XJ407 field incolumns 5-9. Probable cause - misspelled or misaligned options. The options that were correctly specifiedare in effect.
INPF13 INVALID PLOT CARD IGNORED. card
A "plot card" of the type formerly used by J407 and other programs has been prepared incorrectly. Replaceit by $JOB and $OPT cards of the current type.
INPUT3 HISTORIC PEAKS OVERFLOWED - nhp i sta_id
The number of historic peaks (nhp) retrieved for station (sta-id) exceeds the capacity of program J407.Probable system error; notify WATSTORE user assistance.
INPUT3 INVALID BEGIN OR END YEAR FROM I-CARD ’years’ sta-id
The begin-year or end-year field on the I-card for the station (sta-id) contains illegal decimal characters;these fields are displayed between single quotes (years). Probable user error.
INPUT3 INVALID STATION OPTIONS FROM I-CARD = ’options’ sta-id
Probable user error. The options specified are displayed between single quotes. Check for invalid stationoptions on the I card for the station (sta-id) printed.
INPUT3 PEAK COUNT EXCEEDS STORAGE CAPACITY n sta-id
The number of peaks (n) retrieved from station (sta-id) exceeds the storage capacity of program J407.Probable system error; notify WATSTORE User assistance.
INPUT3 REQUESTED YEARS NOT IN RECORD - beg-yr end-yr first-yr last-yr sta-id
Probable user error. The years requested on the I-card (beg-yr, end-yr) do not overlap the years available inthe record (first-yr, last-yr) at the station (sta-id).
PKF messages
PKF000L card image
A listing of input data cards produced when PKF reader is in print mode (When J407 is in DBUG mode.)
PKF001E ILLEGAL DECIMAL CHARS ON STA-NAME CARD, n
One or more (n) non-numeric characters have been found in one of the numeric fields of the station namecard. See also message PKF011E.
PKF002E INVALID STATION NAME.
The station name does not begin with an alphabetic character or dollar sign or asterisk. See messagePKF011E.

peakfqf Diagnostic Messages 09/17/99 3 of 7
PKF003E ITEM COUNT NQ OUT OF BOUNDS. nq
Columns 68-70 of the station name card contain a number nq which is less than zero or greater than themaximum number of peaks that can be stored in the program. Probable cause -- items count not right-justified on column 70. See also message PKF011E.
PKF004E ILLEGAL DECIMAL CHARACTERS ON I-TH Q-DATA CARD. n i station-ident
One or more (n) non-numeric characters have been detected in columns 1-70 of the i-th systematic recorddata card for the station identified. See also message PKF011E.
PKF005E ID-FIELDS MISMATCH I-TH Q-DATA CARD. i station-id
Columns 71-80 of the i-th systematic record data card do not agree with columns 71-80 of the station namecard (station id). The offending systematic record data card is printed immediately above or below thismessage. See also PKF011E.
PKF006E DATA ENDED BEFORE I-TH Q-DATA CARD. i station-ident
The end of the input data set was encountered while attempting to read the i-th systematic record data cardfor the indicated station. Probable cause: invalid item count or lost input cards. The reader cannot recoverfrom this error. It return the available data and an error indicator to the calling program.
PKF008W IGNORED FLDS J-10 I-TH Q-DATA CARD. j i station-ident.
Warning only. the item count on the station name card indicated that the j-th through 10-th fields of the i-thsystematic record data card contained no data, but these fields were not blank. The item count may beincorrect or the cards may be out of order. The number of data items indicated by the item count is returnedto the calling program; the excess information is ignored.
PKF011E SKIPPING FOR NEXT STATION.
An error in the input data has been detected, as explained in the preceding PKFxxx messages. The card onwhich the error was found is displayed in message PKF000L or PKF015E. The probable cause of all theseerrors is invalid item counts on the station name card or cards out of order in the input deck. The readerbegins searching for the next valid station name card.
PKF015E card image.
Listing of input cards on which errors were detected, as explained by preceding messages. See alsoPKF011E.
PKF203E HIST PEAK COUNT OUT OF BOUNDS. n station-ident
The historic peak count in the historic/outlier data card is less than zero or greater than the maximumallowable number of historic peaks. See also message PKF211E.
PKF204E ILLEGAL DECIMAL CHARS ON THE I-TH H-DATA CARD n i station-ident.
One or more (n) non-numeric characters have been detected in columns 1-70 of the i-th historic/outlier datacard of the station identified. See also message PKF211E.
PKF205E ID-FIELD MISMATACH I-TH H-DATA CARD i station-ident.
Columns 71-78 of the i-th historic/outlier data card conflict with the corresponding columns on the stationname card for the station identified. The offending historic/outlier card is printed immediately above orbelow this message. See also message PKF211E.
PKF206E DATA ENDED BEFORE I-TH H-DATA CARD i station -ident
The end of the input data set was encountered while attempting to read the i-th historic/outlier data card forthe station identified. See also message PKF211E.
PKF211E HISTORIC DATA RETRIEVAL FAILED.
An error in the historic outlier data has been detected, as explained in preceding messages. The card inwhich the error was found is displayed by message PKF0001 or PKF015E. The probable cause of all these

peakfqf Diagnostic Messages 09/17/99 4 of 7
errors is incorrect counting of historic peaks, incorrect placement of data on the cards, or cards out of order.The reader passes the available data and an error indicator back to the calling program (J407 rejects thestation and searches for the next station.)
PKFQV3 ERROR-END OF VECTOR FILE.
Data sets received from the peak file retrieval program do not conform to the expected format. Check theretrieval program and JCL listings for error messages before calling WATSTORE user assistance.
PKFQV3 ERROR-FILES SCRAMBLED.
Data sets received from the peak file retrieval program do not conform to the expected format. Check theretrieval program and JCL listings for error messages before calling WATSTORE user assistance.
PKFQV3 ERROR-UNKNOWN CONTROL RECORD.
Data sets received from the peak file retrieval program do not conform to the expected format. Check theretrieval program and JCL listings for error messages before calling WATSTORE user assistance.
WCF--- MESSAGESWCF001J FLOOD FREQUENCY, WRC BULL. 17. VER n.n(dddddd).
Unedited machine computations. User is responsible for interpretation and use. n.n (dddddd) = versionnumber and data of last revision. Normal beginning-of-job message, if requested.
WCF002J CALCS COMPLETED. RETURN CODE = n
Normal end-of-job message . Return codes: 0 = no error detected. 1 = non-standard data accepted, 2 =warning -- calculations completed, but results may be incorrect.
WCF003E CALCS ABORTED. RETURN CODE = 3.
WCF … Routines were unable to complete the calculations for reasons explained in previous messages.
WCF004* INTERNAL PROGRAM LOGIC ERROR. Location-code data
This message should not occur. If it does, contact [email protected]
WCF101L INPUT PARAMETERS - GENSKU OPT GS.ERR GAGEB QLWOUT QHIOUT NHIST HISTPD xxx xxx xxx xxx xxx xxx xxx xxx
Routine listing of input data, if requested.
WCF1O2E INVALID INPUT PEAK COUNTS. NPK, NHIST = nnn nnn
Either the number of historic peaks (HNIST) is negative or the total number of input peaks is less thanNHIST. Probable error in counting input peaks.
WCF103L INPUT PEAKS, HISTORIC FIRST. TOTAL NO. = nnn
Routine listing of input data, if requested.
WCF104L INPUT LOG PKS, HISTORIC FIRST. TOTAL NO. = nnn
Routine listing of input data, if requested.
WCF107I ACCEPTED GENSKEW OUTSIDE MAP LIMITS GS m1 m2
Input generalized skew GS was outside range of values (m1, m2) set at program installation time. (Limitsof WRC skew map.)
WCF109W PEAKFS WITH MISSING-DISCHARGE CODES WERE BYPASSED. nnn
nnn negative input peaks were found. These are assumed to be codes for unknown discharges. Thesepeaks are ignored in the computations, but large negative values are stored in corresponding locations inoutput logarithm vector. If the input has any unknown discharges coded as negative values, ensure that

peakfqf Diagnostic Messages 09/17/99 5 of 7
these peaks legitimately can be ignored. Otherwise, incorrect input peak counts may cause this message.Warning only--analysis continues.
WCF111E HISTORIC PEAK HAD MISSING DISCHARGE CODE.
One of the historic peaks was negative. Probable error in input data value or count.
WCF113W NUMBER SYSTEMATIC PEAKS HAS BEEN REDUCED TO NSYS - nnn
Missing-discharge peaks were noted and have been omitted from the sample (WCF109). The correctsample size for analysis is nnn.
WCF117E NO DATA IN SYST RECORD. NSYS NPK NHIST NMISS xxx xx xxx xxx
There is no systematic record at this station. Possible error in input data or input peak count. NPK = totalnumber of input peaks. Other as in list of variables.
WCF118W SYSTEMATIC RECORD SHORTER THAN WRC SPEC. nnn
Systematic record length nnn is less than that specified in WRC BULL 17. Analysis proceeds, but samplesize may be too small for reliable conclusions.
WCF133I SYST PEAKS BELOW GAGE BASE WERE NOTED. nnn bbb
nnn = number of below-gage-base peaks. bbb = gage-base-discharge.
WCF134I NO SYST PEAKS WERE BELOW GAGE BASE. bbb
WCF141E SAMPLE SIZE TOO SMALL TO CALC STATS. lll nnnNSYS, NBG, NLWOUT, NHIOUT, NHISTN, HISTPN xxx xx xx xx xx xx
Either the systematic or the WRC-adjusted record is too short for calculation of mean, variance, and skew(less than 3 items). Probable cause -- insufficient record length or excessively high gage base or user low-outlier criterion. lll = either SYS (systematic) or WRC. nnn = effective sample size. Others as in list ofvariables.
WCF143E NEGATIVE VARIANCE OF LOGS. lll vvv
lll = either SYS (systematic) or WRC. vvv = the computed variance (should be near zero). Probable cause-- roundoff error in computing near-zero variance when all input peaks are (nearly) equal.
WCF151I WRC WEIGHTED SKEW REPLACED BY USER OPTION. www uuu igsopt
WRC weighted skew calculation (www) has been superseded by user-specified skew uuu. An igsopt valueof 1 means generalized skew; -1 means station skew.
WCF156I WRC HIGH-OUTLIER TEST SUPERSEDED BY MIN HIST PK. www
Routine information report of WRC high-outlier test criterion (www). Historic peaks were present belowthis threshold, so the historic-high-outlier threshold was lowered to the level of the smallest historic peak.
WCF157W USER HIGH-OUTLIER CRIT LOWERED TO MIN HIST PK. uuu hhh
Probable user error -- if historic peaks are given. The high-outlier base need not be set unless peaks smallerthan the smallest historic peak are to be treated as high outliers. uuu = user high outlier criterion. hhh -minimum historic peak.
WCF159E HIGH-OUT/HIST-PK BASE BELOW LOW-OUT/GAGE BASE. hhh lll
Probable user error--perhaps the high-outlier and low-outlier or gage-base data have been entered in thewrong order. hhh = high-outlier or historic base. lll = low-outlier or gage base.

peakfqf Diagnostic Messages 09/17/99 6 of 7
WCF161I USER HIGH-OUTLIER CRITERION REPLACES WRC. uuu www
The user-specified historic-peak-high-outlier discharge threshold (uuu) has been noted. Its value supersedesthe WRC-recommended value (www).
WCF162I SYSTEMATIC PEAKS EXCEEDED BY HIGH-OUTLIER CRITERION. nho hhb
One or more (nho) systematic peaks exceeded the high-outlier discharge criterion (hhb) No historicadjustment was applied because the user did not specify the length of the historic period.
WCF163I NO HIGH OUTLIERS OR HISTORIC PEAKS EXCEEDED HHBASE. hhb
No high outliers or historic peaks were detected. The historic-peak-high-outlier discharge threshold is hhb.
WCF164W HISTORIC PERIOD IGNORED. histpd
A historic period length (histpd) was specified, but no high outliers or historic peaks were found. Thehistoric period length is ignored and no WRC historic adjustment is attempted. Probable user error--thehistoric period length should not be specified unless one or more historic peaks or high outliers are present.
WCF165I HIGH OUTLIERS AND HISTORIC PKS ABOVE HHBASE. nho nhp hhb
Historic adjustment was applied. nho = number high outliers noted, nhp = number historic peaks, hhb =high outlier/historic base flow.
WCF167E HSIST PERIOD NO LONGER THAN SYS+HIST PEAKS. hhh nnn
Stated historic period hhh is no longer than actual count of observed peaks nnn. Probable user error - ifboth hhh and nnn are correct there is no point in doing the historic adjustment.
WCF169I ACCEPTED HISTORIC PERIOD GTR THAN T hhh ttt
The historic period hhh may be longer than can be justified under the WRC criteria for historic information.T = 5 * systematic record, up to max of 300 yrs.
WCF171W NUMBER HI-OUT + HIST PKS EXCEEDS 10PCT OF SYS.PKS. nho nhp
Excessive number of historic peaks nhp and high outliers nho suggest that historic base may be set too lowto ensure that every peak exceeding it has been recorded.
WCF191I USER LOW-OUTLIER CRITERION REPLACES WRC. uuu www
uuu = user low-outlier criterion, www = WRC low-outlier criterion
WCF193E LOW OUTLIER CRITERION EXCEEDS HIGH HIST lll hhh
Probable user error--perhaps the high-outlier and low-outlier or gage-base data have been entered in thewrong order. hhh = high-outlier or historic base. lll - low-outlier or gage base.
WCF195I NO LOW OUTLIERS DETECTED BELOW CRITERION xxxxx
No peaks above the gage base were below the low-outlier criterion. xxxxx = low outlier criterion adopted(user or WRC).
WCF198I LOW OUTLIERS BELOW FLOOD BASE WERE DROPPED nnn bbb
Peaks above the gage base and below the low-outlier criterion were noted. The flood base of the WRCfrequency curve has been set at the low-outlier criterion. nnn = number of low outliers dropped. bbb =WRC flood base.
WCF199W NUMBER OF PEAKS BELOW FLOOD BASE EXCEEDS WRC SPEC. nbb bbb maxnbb
WRC Bull 17 specifies a maximum number of peaks that may fall below the flood base for this length ofsystematic record. The actual number nbb of below-base peaks exceeds this limit (maxnbb). The floodbase = bbb. Warning - the calculation proceeds but the results may be unreliable.

peakfqf Diagnostic Messages 09/17/99 7 of 7
WCF213E COND PROB ADJUST FAILED - EXCESSIVE lll PROB BELOW BASE. ppp
The conditional probability adjustment described in appendix 4 of WRC Bull 17 cannot be performed whenppp fraction of the peaks are below the flood base. lll = (SYS for systematic rec freq curve, in which caseflood base = gage base) or WRC.
WCF215E SKEW OUT OF TABLE RANGE. lll skew-a skew-u gensku
One or more of the skews to be used in constructing the Pearson Type III curve for either the systematic orWRC record is out of the range of the WRC Pearson Type III table (+ or - 9.0). lll = either SYS or WRC.Skew-a is the skew of the above base peaks. Skew-u and gensku may not be present. Skew-u is theunconditional skew after any conditional probability adjustment or weighted-skew calculation. gensku isthe generalized skew, and is printed only if the error is detected after the WRC weighted-skew calculations.
WCF217L FREQUENCY CURVE PARAMS lll xxx xxxxx xxxxx xxxxx xxxxx xxxxx xxxxx
Routine report of frequency curve parameters for curve lll (SYS or WRC). Parameters are -- probability ofexceeding base; mean, standard deviation, and skew of frequency curve (unconditional -- after a conditionalprobability adjustment, if P (BASE) is less than 1.0); mean, standard deviation, and skew of above-basepeaks (before conditional probability adjustment).
WCF219J FREQ CURVE ORDINATES lll 2-YR (.50) 10-YR (.10) 100-YR (.01) xxxxxxx xxxxxxx xxxxxxx
Routine report of frequency curve ordinates at 2-yr, 10-yr, and 100-yr levels for lll (SYS or WRC)frequency curve.
WCF233W EXPECTED PROB OUT OF RANGE AT TAB PROB xxxxx yyyyy
Expected-probability calculation called for table lookup at expected probability xxxxx beyond the limits ofthe computed WRC frequency curve. This message normally occurs several times when sample size is lessthan about 10 years and tabular probability yyyyy is less than about 0.10.
WCF238J FREQ CURVE WRC-EXPECT PROB xxxxxxx xxxxxxx xxxxxxx
Routine report of ’expected-probability’ frequency curve ordinates at 2-, 10-, and 100-yr levels. ’Expected-probability’ curve is based on WRC frequency curve.
WCF239J FREQ CURVE CONF LIMS WRC xx.x xxxxxxx xxxxxxx xxxxxxx xxxxxxx xxxxxxx xxxxxxx
Upper and lower confidence limits for WRC frequency curve ordinates reported in WCF219. xx.x = one-sided confidence level.