Embed Size (px)
Citation preview

usesscience for a changing world
U.S. DEPARTMENT OF THE INTERIOR U.S.GEOLOGICAL SURVEY
Environmental Effects of the Big Rapids Dam Remnant Removal, Big Rapids, Michigan, 2000-02
Water-Resources Investigations Report 03-4136
Prepared in cooperation with the City of Big Rapids, Michigan

COVER PHOTO: U.S. Geological Survey scientists extending a steel cable tagline across transect 28 on April 19, 2002. The cable is used to keep the boat on the transect during streamflow measurements and streambed-elevation profiles. Photo by D. Healy.

Environmental Effects of the Big Rapids Dam Remnant Removal, Big Rapids, Michigan, 2000-02
By Denis F. Healy, Stephen J. Rheaume, and J. Alan Simpson
Water-Resources Investigations Report 03-4136
Prepared in cooperation with the City of Big Rapids, Michigan
Lansing, Michigan 2003

U.S. DEPARTMENT OF THE INTERIOR
GALE A. NORTON, Secretary
U.S. GEOLOGICAL SURVEY
Charles G Groat, Director
The use of firm, trade, and brand names in this report is foridentification purposes only and does not constitute
endorsement by the U.S. Government.
For additional information Copies of this report can bewrite to: purchased from:
District Chief U.S. Geological SurveyU.S. Geological Survey Branch of Information Services6520 Mercantile Way, Suite 5 Box 25286Lansing, MI 48911-5991 Denver, CO 80225-0286

CONTENTS
Page
Abstract .......................................................................... 1
Introduction....................................................................... 1
Purpose and scope........................................................... 2
Acknowledgments........................................................... 2
Hydrologic setting ................................................................. 2
Methods of investigation............................................................ 4
Water quality ............................................................... 4
Sediment.................................................................. 10
Stream habitat.............................................................. 11
Environmental effects of dam removal............................................... 11
Water quality .............................................................. 11
Continuous water-quality data......................................... 12
Discrete water-quality samples ........................................ 12
Sediment.................................................................. 20
Stream habitat ............................................................. 27
Reference reach (Reach A)............................................. 29
Impoundment reach at North End Riverside Park (Reach B) ............... 29
First downstream reach at Hemlock Park (Reach C) ...................... 30
Second downstream reach at USGS streamflow-gaging station (Reach D).... 33
Third downstream reach at High Banks Park (Reach E) ................... 33
Streambed-elevation profiles................................................. 36
Persistence of the measured environmental effects..................................... 39
Summary and conclusions ......................................................... 43
References ....................................................................... 43
Appendixes ...................................................................... 46
Appendix 1. Tables listing constituents, parameter codes,reporting levels, units, analytical method and method reference ........ 46
Appendix 2. Tables listing bed-sediment data............................ 52
in
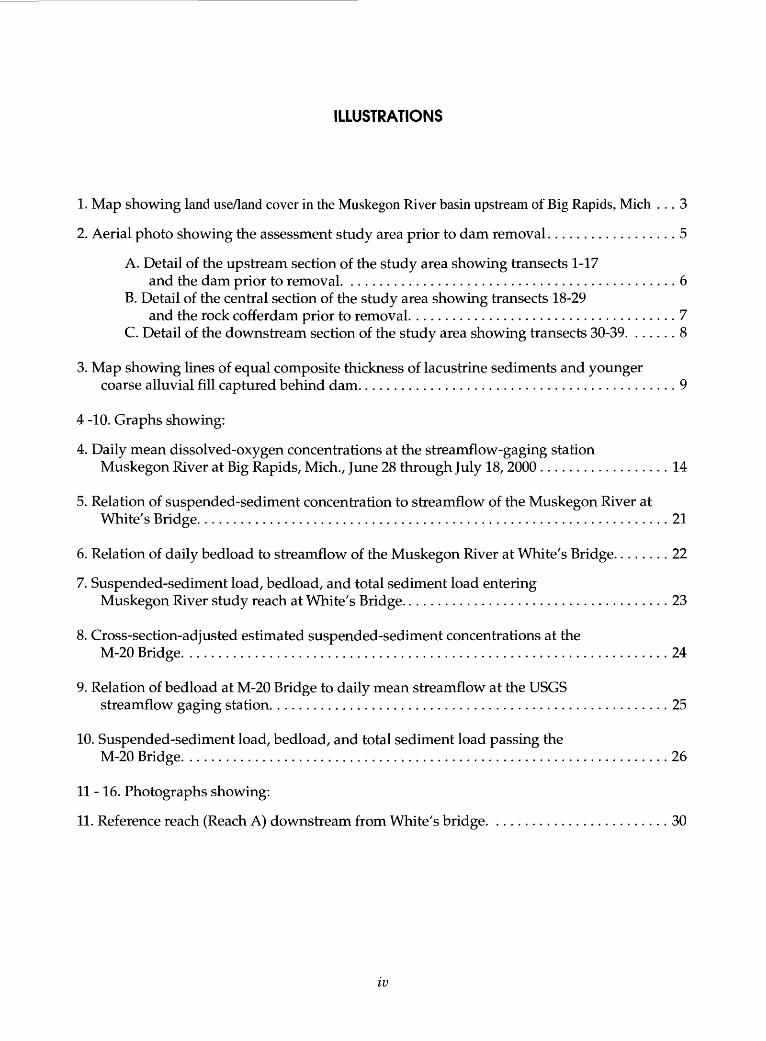
ILLUSTRATIONS
1. Map showing land use/land cover in the Muskegon River basin upstream of Big Rapids, Mich ... 3
2. Aerial photo showing the assessment study area prior to darn removal.................. 5
A. Detail of the upstream section of the study area showing transects 1-17and the dam prior to removal. ............................................. 6
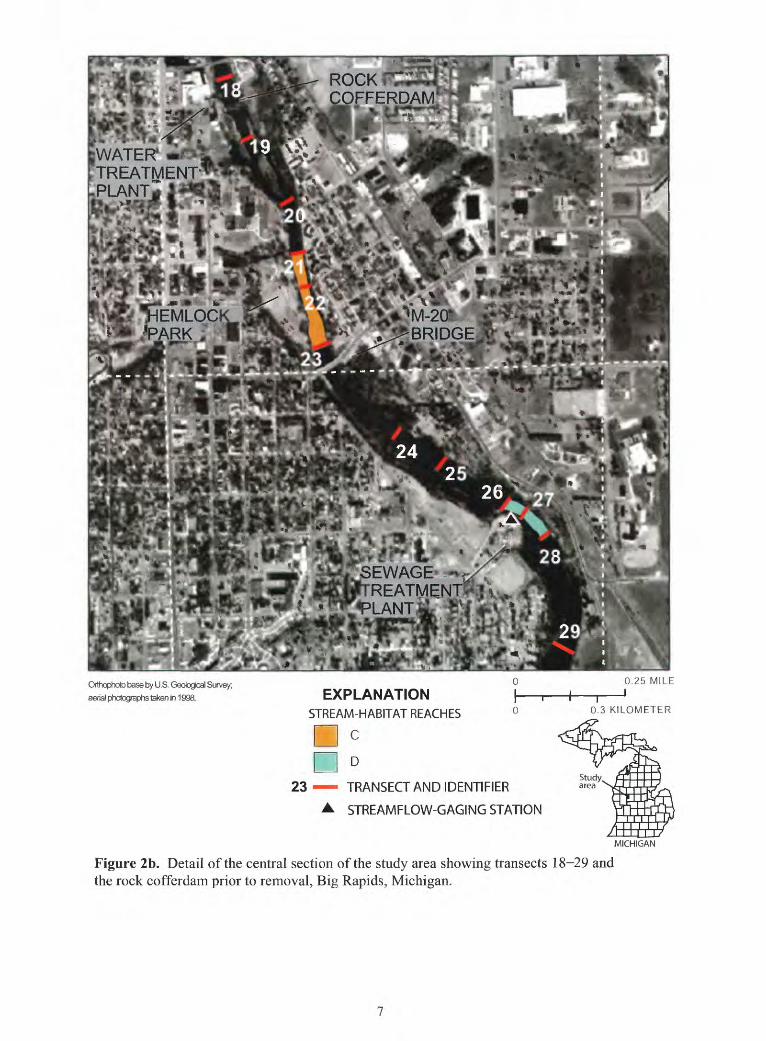
B. Detail of the central section of the study area showing transects 18-29and the rock cofferdam prior to removal. .................................... 7
C. Detail of the downstream section of the study area showing transects 30-39. ...... 8
3. Map showing lines of equal composite thickness of lacustrine sediments and youngercoarse alluvial fill captured behind dam............................................ 9
4 -10. Graphs showing:
4. Daily mean dissolved-oxygen concentrations at the streamflow-gaging stationMuskegon River at Big Rapids, Mich., June 28 through July 18,2000 .................. 14
5. Relation of suspended-sediment concentration to streamflow of the Muskegon River atWhite's Bridge................................................................. 21
6. Relation of daily bedload to streamflow of the Muskegon River at White's Bridge........ 22
7. Suspended-sediment load, bedload, and total sediment load enteringMuskegon River study reach at White's Bridge..................................... 23
8. Cross-section-adjusted estimated suspended-sediment concentrations at theM-20 Bridge. .................................................................. 24
9. Relation of bedload at M-20 Bridge to daily mean streamflow at the USGSstreamflow gaging station....................................................... 25
10. Suspended-sediment load, bedload, and total sediment load passing theM-20 Bridge. .................................................................. 26
11-16. Photographs showing:
11. Reference reach (Reach A) downstream from White's bridge. ........................ 30
IV
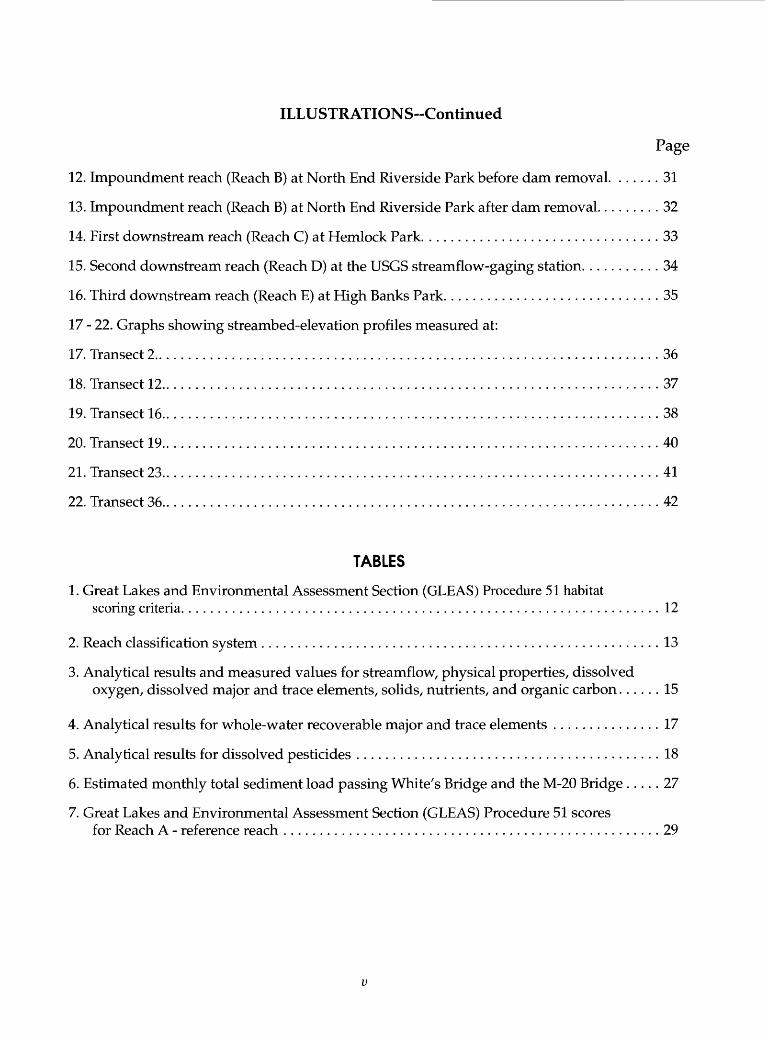
ILLUSTRATIONS-Continued
Page
12. Impoundment reach (Reach B) at North End Riverside Park before dam removal. ...... 31
13. Impoundment reach (Reach B) at North End Riverside Park after dam removal......... 32
14. First downstream reach (Reach C) at Hemlock Park. ................................ 33
15. Second downstream reach (Reach D) at the USGS streamflow-gaging station. .......... 34
16. Third downstream reach (Reach E) at High Banks Park.............................. 35
17 - 22. Graphs showing streambed-elevation profiles measured at:
17. Transect 2...................................................................... 36
18. Transect 12..................................................................... 37
19. Transect 16..................................................................... 38
20. Transect 19..................................................................... 40
21. Transect 23..................................................................... 41
22. Transect 36..................................................................... 42
TABLES
1. Great Lakes and Environmental Assessment Section (GLEAS) Procedure 51 habitatscoring criteria. ................................................................. 12
2. Reach classification system ....................................................... 13
3. Analytical results and measured values for streamflow, physical properties, dissolvedoxygen, dissolved major and trace elements, solids, nutrients, and organic carbon...... 15
4. Analytical results for whole-water recoverable major and trace elements ............... 17
5. Analytical results for dissolved pesticides .......................................... 18
6. Estimated monthly total sediment load passing White's Bridge and the M-20 Bridge..... 27
7. Great Lakes and Environmental Assessment Section (GLEAS) Procedure 51 scoresfor Reach A - reference reach .................................................... 29

TABLES-Continued
Page
8. Great Lakes and Environmental Assessment Section (GLEAS) Procedure51 scores for Reach B - reach at North End Riverside Park............................... 31
9. Great Lakes and Environmental Assessment Section (GLEAS) Procedure51 scores for Reach C - reach at Hemlock Park ........................................ 32
10. Great Lakes and Environmental Assessment Section (GLEAS) Procedure51 scores for Reach D - reach at USGS streamflow-gaging station......................... 34
11. Great Lakes and Environmental Assessment Section (GLEAS) Procedure51 scores for Reach E - reach at High Banks Park...................................... 35
VI

CONVERSION FACTORS, VERTICAL DATUM, AND ABBREVIATIONS
Multiply By To obtain
Length
foot (ft) mile (mi) yard (yd)
0.3048 1.6093 0.9141
meter (m) kilometer (km) meter (m)
Area
square mile (mi2) 2.590 square kilometer (km2)
Volume
cubic yard (yd3) cubic mile (mi3)
acre-foot (acre-ft) acre-foot (acre-ft)
0.7645 4.168
1,234. 0.001234
cubic meter (m3) cubic kilometer (km ) cubic meter (m3) cubic hectometer (hm3 )
Flow rate
foot per second (ft/s) cubic foot per second (ft3/s)
0.3048 0.0283
meter per second (m/s) cubic meter per second (m3/s)
Mass
ton per day (ton/d) 0.9074 megagram per day (Mg/d)
Hydraulic gradient
foot per mile (ft/mi) 0.1894 meter per kilometer (m/km)
In this report, tons of sediment were converted to cubic yards of sediment by assuming an average of 2.65 for the specific gravity of the sediment and an average 62.4 pounds per cubic foot as the weight of water.
Cubic yards of sediment = 0.448 x tons of sediment
Temperature in degrees Fahrenheit (°F) may be converted to degrees Celsius (°C) as follows:
°C = 0.5556 x (°F - 32)
Vertical coordinate information is referenced to the National Geodetic Vertical Datum of 1929 (NGVD of 1929).
Specific conductance is given in microsiemens per centimeter at 25 degrees Celsius (jiS/cm at 25 °C).
Concentrations of chemical constituents in water are given either in milligrams per liter (mg/L) or micrograms per liter (|ig/L).
VII


Environmental Effects of the Big Rapids Dam Remnant Removal, Big Rapids, Michigan, 2000-02
By Denis F. Healy, Stephen J. Rheaume, and J. Alan Simpson
ABSTRACT
The U.S. Geological Survey (USGS), in cooperation with the city of Big Rapids, investigated the environmental effects of removal of a dam- foundation remnant and downstream cofferdam from the Muskegon River in Big Rapids, Mich. The USGS applied a multidiscipline approach, which determined the water quality, sediment character, and stream habitat before and after dam removal. Continuous water-quality data and discrete water-quality samples were collected, the movement of suspended and bed sediment were measured, changes in stream habitat were assessed, and streambed elevations were surveyed.
Analyses of water upstream and downstream from the dam showed that the dam-foundation remnant did not affect water quality. Dissolved-oxygen concentrations downstream from the dam remnant wer& depressed for a short period (days) during the beginning of the dam removal, in part because of that removal effort. Sediment transport from July 2000 through March 2002 was 13,800 cubic yards more at the downstream site than the upstream site. This increase in sediment represents the remobilized sediment upstream from the dam, bank erosion when the impoundment was lowered, and contributions from small tributaries between the sites.
Five habitat reaches were monitored before and after dam-remnant removal. The reaches consisted of a reference reach (A), upstream from the effects of the impoundment; the impoundment (B); and three sites below the impoundment where habitat changes were expected (C, D, and E, in downstream order). Stream- habitat assessment reaches varied in their responses to the dam-remnant removal. Reference reach A was not affected. In impoundment reach B, Great Lakes and Environmental Assessment Section (GLEAS) Procedure 51 ratings went from fair to excellent. For the three downstream reaches, reach C underwent slight habitat degradation, but ratings remained good; reach D underwent slight habitat degradation with ratings changing from excellent to good; and, in an area affected by a 1966 sediment release, reach E habitat rated fair in April 2000 and remained fair in
September 2001. The most noticeable habitat change in the three reaches downstream from the dam site was a measurable increase in siltation and embeddedness.
Bed-elevation profiles show that bed material upstream from the dam site was remobilized as suspended sediment and bedload, and was redeposited in the reaches below the cofferdam. Deposition was greater in the deep, slow-moving pools than the shallow, fast-moving riffles. For the most part, where deposition took place, deposits were less than 1 foot in thickness. In the year following the removal of the cofferdam, much of the sediment deposited below the dam was moved out of the study reach.
INTRODUCTIONIn summer 2000, the city of Big Rapids, Mich.,
removed the remnants of a hydroelectric-dam foundation from the Muskegon River. The 4-ft dam- foundation remnant, henceforth referred to as "the dam", was the remains of a 17-ft high hydroelectric dam constructed in 1914 on the site of an 1866 rock-crib dam that washed out in 1912 (Ferris State University, 2000). In summer 2001, the city also removed from the Muskegon River a rock cofferdam that was approximately 1,000 ft downstream from the dam location. The cofferdam was constructed in 1987 to protect a water main and the intake for the Big Rapids Water Treatment Plant. The cofferdam was composed of large rocks and boulders piled 3 to 4 ft high at construction (Ferris State University, 2000). In the decade before the dam removal, three people drowned within 700 ft of the dam (Hegarty, 2001). The city removed these structures to increase safety for recreational users of the Muskegon River and to improve the riverine environment.
Because of deterioration of the structure, the dam had outlived its usefulness by 1966 (Ferris State University, 2000). The top 13 ft of the dam was removed in an aborted attempt to eliminate the entire structure. Subsequent erosion of sediment from the impoundment area and its redeposition substantially altered the characteristics of the downstream channel

(Westjohn, 1997). In the reaches downstream from the dam site, fishing holes were filled in and sand bars formed. Over the next few winters, the altered river geometry led to the formation of ice jams and subsequent flooding (Hegarty, 2001). Sediments from this remobilization still can be found in the reach of the Muskegon River at High Banks Park near Big Rapids.
Because of the problems that followed the 1966 attempt to remove the dam, the city of Big Rapids required a study of the effects of the dam removal on the environment of the Muskegon River. The Michigan Department of Natural Resources (MDNR), and the U.S. Geological Survey (USGS) in cooperation with the city, conducted complimentary studies to monitor these effects. The MDNR collected and interpreted data pertaining to the effects of the dam removal on fish and macroinvertebrate populations, and the USGS collected and interpreted data on water quality, sediment transport, and stream habitat. In a corollary study, the USGS investigated the application of a sediment- transport model to predict the resulting transport and fate of the sediments for future dam removal projects.
Removing outdated and dilapidated dams can be beneficial. The danger of a flood from collapse of the dam is eliminated. Ecological benefits include the return to more natural streamflow, temperature regime, and sediment transport. Dam removals, however, also can bring about unexpected consequences. Upstream and downstream habitats established during the life of the dam will be disturbed. Revitalized erosion may attack riverbanks. Erosion of sediments deposited above the dam can remobilize any contaminants that may be contained in those sediments. The additional sediment load may be deposited downstream, destroying habitats deemed environmentally and economically desirable.
The Big Rapids dam-removal project was designed to produce minimum effects from sediment remobilization on the reaches downstream. Sediments upstream from the dam were dredged, river elevation was lowered by a controlled drawdown, and the pool behind the rock cofferdam was used as a sediment trap. Hegarty (2001) discusses the dam's history and the project's background, and also describes the steps in the removal project. The dam and cofferdam removal restored a rare habitat type to the Muskegon River, a free-flowing river with a gradient exceeding 10 ft/mi (Michigan Department of Natural Resources, 1997). The Muskegon River now has a 119-mi reach of free- flowing river, one of the longest in Michigan (Michigan Department of Natural Resources, 1997).
Purpose and scope
This report documents the effects of the dam removal on the environment of the Muskegon River. The USGS applied a multidiscipline approach to the study, which included measurements of streamflow, selected water- quality properties, suspended-sediment concentration and bed-load, aquatic habitat, and streambed elevations. The purpose of this report is: (1) to describe the results of the USGS data-collection effort during the pre- and post- dam removal periods and (2) to relate this information to changes in water quality, sediment movement, and aquatic habitat. This report will not discuss in detail the dam- removal project nor discuss the sediment-transport model.
AcknowledgmentsThe cooperation of city of Big Rapids and the MDNR
and their employees is gratefully acknowledged. In particular, we would like to thank Steve Stilwell, city of Big Rapids City Manager, and Sharon Hanshue, Great Lakes Program Coordinator, MDNR, for their continuing assistance with this study. We also would like to thank Jim Hegarty of Preine & Newhof and Mike Ells of Ferris State University for their assistance with this study.
Many USGS employees participated in the collection and analyses of data for this study and in the preparation and review of this report. They include Sharon Baltusis, Jim Bennett, Susie Crowley, Todd Dewitt, Dave Holtschlag, Robert Howell, Rick Hubbell, Don James, Rick Jodoin, Dan Lahde, Margaret Li, Ed Lipinski, Mark Loerop, Jaye Lunsford, Russ Minnerick, Tom Morgan, Robert Nettleton, Cyndi Rachol, Marie Reynolds, Jeanne Rodriguez, Tiffiny Rossi, Andreanna Simard, Julie Stopar, Amy Sutton, Mike Sweat, Atiq Syed, and Dave Westjohn. We also would like to thank USGS Volunter-for-Science Dan Lunsford for his assistance in field data collection.
HYDROLOGIC SETTINGThe Muskegon River starts at the outlet of Houghton
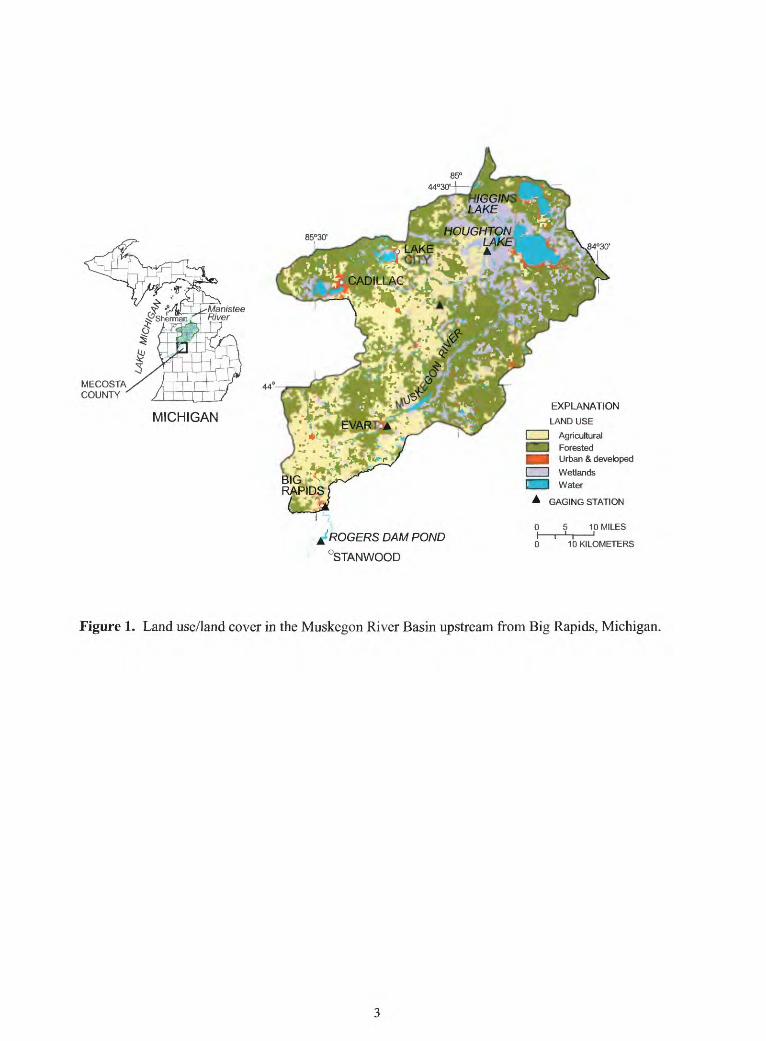
Lake in the north-central part of the Lower Peninsula of Michigan and runs 153 mi southwest through a glacial meltwater channel to Lake Michigan (fig. 1). The meltwater channel was formed during the late Pleistocene in the interlobate zone between the Michigan and Saginaw glacial-ice lobes (Leverett and Taylor, 1915). Bedrock under the glacial deposits of varying thickness is mainly Mississippian and Pennsylvanian sedimentary rocks (Milstein, 1987). Land use/land cover in the approximately 1,751 mi2 basin above the dam predominantly is forest, where recreation is a major industry; agriculture is a secondary land use. (Blumer, 1993) (fig. 1).
^ROGERS DAM POND
°STANWOOD
EXPLANATION
LAND USE
Agricultural ___ Forested BHI Urban & developed I I Wetlands
Water
GAGING STATION
5 10 MILES
10 KILOMETERS
Figure 1. Land use/land cover in the Muskegon River Basin upstream from Big Rapids, Michigan.

The city of Big Rapids is in Mecosta County in the west-central Lower Peninsula of Michigan. The city's population is approximately 12,000. Ferris State University (approximately 10,000 students) is in the city. The city used the Muskegon River as its drinking-water supply until 2001, when it switched to ground water. The dam was in the northern part of the city. The rock cofferdam was approximately 1,000 ft downstream, adjacent to the city water-treatment plant (fig. 2, 2a, 2b, 2c).
The reach of the Muskegon River constituting the study area extends from White's Bridge, approximately 8,850 ft upstream from the dam, to just downstream of the intersection of the Muskegon River with the dividing line between sections 23 and 24 of Big Rapids Township (T. 15 N., R. 10 W.) approximately 200 ft upstream from the confluence with Ryan Creek, or approximately 19,500 ft downstream of the dam (fig. 2). The intersection of the Muskegon River with the section boundary is the upstream limit of Rogers Dam Pond, as designated by the Federal Energy Regulatory Commission.
The Muskegon River is designated as a cold-water stream with year-round streamflow and substantial ground-water inputs (Michigan Department of Natural Resources, 1992). The annual hydrograph for the Muskegon River is typical of rivers in the northeastern United States. Snowmelt usually produces the highest annual flows during March and April, whereas the lowest flows are found in late summer during August and September. Runoff from storms may exceed the spring high flow, but because of the high infiltration rates of the glacial fluvial deposits in the basin, flows from storm runoff usually are attenuated. The USGS streamflow-gaging station, Muskegon River at Evart, Midi., is approximately 28 mi upstream from the dam site and has a drainage area of 1,433 mi2 . The annual mean streamflow at this station for water years 1 1932, 1933, and 1935-1999 is 1,055 (ftVs) (Blumer and others, 2000). April has the highest mean monthly streamflow, 2,231 ft3/s; March 1976 has the maximum monthly mean, 4,115 ft3/s. August has the lowest mean monthly streamflow, 552 ft3/s; August 1941 has the lowest monthly mean, 316 ft3/s.
(Footnotes)1 Water year in U.S. Geological Survey reports is the 12-month period,
October 1 through September 30. The water year is designated by the
calendar year in which it ends and which includes 9 of the 12 months.
Thus, the year ending September 30, 2001, is called the "2001 water
year".
Westjohn (1997) estimated that 19,000 yd3 of sediment was trapped behind the dam. He estimated that up to 80,000 yd3 of sediment might be mobilized as a result of the dam removal (David Westjohn, U.S. Geological Survey, oral commun., 2000). He identified four stratigraphic units: (1) glacial till; (2) coarse sand, gravel, and cobbles predating dam; (3) cyclical, interbedded lacustrine clay, silt, and wood chips deposited in the impoundment between 1916 and 1966; and (4) layers of silt and coarser alluvium deposited since 1966. On the basis of these stratigraphic units, Westjohn (1997) divided the impoundment behind the dam into lower and upper sections. The lower impoundment extended about 1,300 ft upstream from the dam; cyclic lacustrine deposits still were present before dam removal and were covered by the post- 1966 alluvium (fig. 3). The upper impoundment extended from ] ,300 ft to 3,500 ft; lacustrine deposits were absent, and post-1966 alluvium overlay pre- dam deposits. What is probably pre-dam riverbed was exposed 3,500 ft upstream from the dam. Studies by the MDNR (Sharon Hanshue, Michigan Department of Natural Resources, oral commun., 1999) and the city of Big Rapids (Steve Stilwell, city of Big Rapids, oral commun., 1999) showed that the sediments trapped upstream from the dam were not contaminated.
METHODS OF INVESTIGATIONThis study was done to determine the water quality,
sediment character, and stream habitat before and after dam removal. Continuous water-quality data and discrete water-quality samples were collected, the movement of suspended sediment and bedload was measured, changes in stream habitat were assessed, and bed elevations at 39 transects were surveyed.
Water qualityContinuous water-quality data and discrete water-
quality samples were collected to determine whether the dam affected the water quality of the Muskegon River and, in turn, whether the removal of the dam produced short- or long-time changes to the river environment. A continuous water-quality monitor at the USGS streamflow-gaging station on the property of the city of Big Rapids sewage-treatment plant collected hourly water temperature, dissolved-oxygen concentration, and specific-conductance data. Discrete water-quality samples were collected from White's Bridge and the M-20 Bridge (fig. 2).

43°43'
43°4T
SEWAGE-, TREATMENT
HIGH BANKS, PARK
EXPLANATION
STREAM-HABITAT REACH
IIB
TRANSECTS
STREAMFLOW STATION
MICHIGAN
Orthophoto base by U.S. Geological Survey;
aerial photographs taken in 1998.0.5 KILOMETER
Figure 2. Location of Muskegon River, Big Rapids dam-removal study area, Big Rapids, Michigan. (Yellow boxes constitute detailed areas in figures 2a, 2b, and 2c.)

-NORTHEND RIVERSIDE PARK
Orthophoto base by U.S. Geological Survey;
aerial photographs taken in 1998.EXPLANATION
STREAM-HABITAT REACHES
A '
0.3 KILOMETER
btud . _ area12 TRANSECT AND IDENTIFIER
MICHIGAN
Figure 2a. Detail of the upstream section of the study area showing transects 1-17 and the dam prior to removal, Big Rapids, Michigan.
ROCK I \ COFFERDAM
T-iEMLOC
Orthophoto base by U.S. Geological Survey;
aerial photographs taken in 1998. EXPLANATIONSTREAM-HABITAT REACHES
C
I0.3 KILOMETER
i__| D
23 TRANSECT AND IDENTIFIER
A STREAMFLOW-GAGING STATION
MICHIGAN
Figure 2b. Detail of the central section of the study area showing transects 18-29 and the rock cofferdam prior to removal, Big Rapids, Michigan.

HIGH BANKS PARK
Orthophoto base by U.S. Geological Survey;
aerial photographs taken in 1998.0.25 MILE
EXPLANATIONSTREAM-HABITAT REACH
E
36 TRANSECT AND IDENTIFIER study
\0.3 KILOMETER
MICHIGAN
Figure 2c. Detail of the downstream section of the study area showing transects 30-39, Big Rapids, Michigan.

Upper Impoundment
AW
Enlargement of Lower Impoundment Area
Al
EQUAL THICKNESS OF LACUSTRINE SEDIMENT AND OVERLYING POST-1966 ALLUVIUM IN FEET
I I >0to1
I I >1to2
I I >2to3
BBI >3to4
H >4
- - - GROUND-PENETRATING RADAR LINES
B[y 2 BOREHOLE AND SEDIMENT CORE SAMPLING AND NUMBER
A9 AREA WITHIN OR BETWEEN ADJACENT CONTOURS USEDTO COMPUTE SEDIMENT VOLUME
Baldwin Street Bridge
Water Treatment Plant
Base from U.S. Geological Survey 1:24,000 map. 400 FEET__ ~\
100 METERS
MICHIGAN
Figure 3. Lines of equal composite thickness of lacustrine sediments and younger coarse alluvial fill captured behind the dam near Big Rapids, Michigan (from Westjohn, 1997).

The monitor was serviced triweekly and calibrated as needed. Real-time data were made available on the USGS Michigan District Web page (http: //mi.water.usgs.gov/). Wagner and others (2000) describes the USGS installation, field calibration, data processing, and quality-assurance procedures for continuous water-quality monitors.
Discrete water-quality samples for the analyses of major constituents, nutrients, total organic carbon, trace elements, pesticides, turbidity, and suspended solids were collected by depth- and width-integration methods (Wilde and others, 1999a) with a USGS D- 77 sampler and were processed according to standard USGS procedures (Wilde and others, 1999b). Physical properties and dissolved-oxygen concentrations were measured according to procedures outlined in Wilde and Radtke (1998). The samples were shipped to the USGS National Water-Quality Laboratory (NWQL) for analyses. The list of water-quality analytes, analytical methods, reporting levels, and reporting units are presented in appendix 1. Quality control/quality- assurance procedures of the NWQL are described in Pritt and Raese (1995).
Sediment
Streamflow was measured and suspended-sediment and bedload samples were collected to determine the flux of sediment entering and leaving the study area. Bed-elevation cross-section profiles were measured at 39 transects to identify areas of erosion and aggradation (fig- 2).
A USGS streamflow-gaging station was established at the continuous water-quality monitoring station, (USGS 04121650, Muskegon River at Big Rapids, Mich.) by installing a water-level sensor and data logger to record continuous gage-height data. Discharge measurements were made at the M-20 Bridge with a standard AA current meter according to methods described in Buchanan and Somers (1969). The gage height-discharge rating curve was developed by standard methods described in Rantz and others (1982).
Daily suspended-sediment point samples were collected at the gaging station at 1300 Eastern Standard Time by an automatic sampler. A second sampler collected storm- and snowmelt-event samples; the triggering gage height for the sampler varied throughout the year and roughly was about 1.5 ft higher than the gage height at the time of maintenance visits. Depth- and width-integrated suspended-sediment samples were collected from the M-20 Bridge to calibrate the point samples to the cross section by
analytical methods described in Porterfield (1972). In addition, depth- and width-integrated suspended- sediment samples were collected at White's Bridge to calculate the suspended-sediment load entering the study area. Depth- and width-integrated samples were collected with USGS DH-59 or D-49 samplers by equal-width-increment (EWI) or equal-discharge- increment (EDI) methods described in Wilde and others (1999a). All cross-section samples and a subset of the point samples were sent to the USGS Iowa District Sediment Laboratory for analyses of concentration and percentage finer than 0.062 mm, the break between particles of sand and silt size, by analytical methods described in Guy (1969).
Calibrated samples were analyzed by means of the USGS Graphical Constituent Load Analysis System (GCLAS). This program is a tool for the interactive visualization and editing of data and expedites procedures outlined by Porterfield (1972). Daily suspended-sediment load in tons per day were calculated by use of the equation
Load = C *Q * 0.0027,m ^m 'where Cm is the daily mean suspended-sediment
concentrations, in milligrams per liter;Qm is the daily mean streamflow in cubic feet per
second; and 0.0027 is a units conversion term. Days with large fluctuations in sediment concentration or streamflow were examined by subdividing. "Subdivide" refers to the division of data for a calendar day into shorter time periods to obtain correct daily mean values of water or sediment discharge when one or both change beyond certain limits for the day. Subdivided calculated loads were substituted for the mean calculated load for days when they differed by greater than 5 percent (Porterfield, 1972).
Daily suspended-sediment concentrations at White's Bridge were calculated by linear regression analyses in the statistical package S-Plus. Discharges measured at the gaging station were regressed with suspended-sediment concentrations from samples collected at the bridge to develop a model, which was used with the estimated daily mean streamflow to calculate daily mean suspended-sediment concentrations.
Bedload samples were collected from White's Bridge and the M-20 Bridge by EWI method. A BL-84 sampler was lowered to the streambed at each vertical and remained there for a constant time period per sampling event that varied with streamflow from 30 seconds to 5 minutes (Edwards and Glysson, 1999). Bedload samples were processed and sieved at the USGS Michigan District office in Lansing, Mich., by methods described in Guy (1969).
10

Daily bedloads were estimated by regression analyses between streamflow and measured bedloads for each site. For the M-20 bridge, two nonlinear regression lines were developed in S-Plus. The first line estimates the daily bedloads prior to the high-water flow after the dam removal, whereas the second line estimates the daily bedloads during and after high- water flows. For White's Bridge, daily bedloads were estimated in S-Plus by linear regression.
Two, three, or four streambed-elevation profiles were made at each transect. The 39 transects were tied to reference points on the right bank (looking downstream) and the cross-section profiles were made perpendicular to flow. The horizontal location and elevation of the right bank reference points were surveyed with an electronic total station. A Philadelphia survey rod and optical level were used to determine water surface at the time of the profile. The profiles were made either by wading (measuring down from the water surface with a wading rod) or by boat (measuring down from the water surface with a crane and weight).
Stream habitatThree aquatic-habitat assessments were made
during the low-flow periods: (1) before dam removal (pre-removal assessment, April 2000), (2) during the year of dam removal (removal assessment, October 2000), and (3) the year after dam removal, the year of cofferdam removal (post-removal assessment, September 2001). Five stream reaches were assessed per trip: upstream from any dam effect, within the impoundment area above the dam, and three stream reaches below the dam (fig. 2). Aquatic-habitat assessments consisted of both the habitat assessment part of the MDNR Great Lakes and Environmental Assessment Section (GLEAS) Procedure 51 (Michigan Department of Natural Resources, 1991) and the USGS National Water-Quality Assessment (NAWQA) transect procedure (modified from Meador, 1993).
The GLEAS Procedure 51 habitat-quality metrics are separated into three principal categories: (1) substrate and instream cover, (2) channel morphology, and (3) riparian and bank structure. These categories, and different scoring levels, are based on levels of importance in affecting biological community composition. The most important biological-habitat metrics are those characterizing bottom substrate and instream cover, degree of embeddedness, and water velocity. These three habitat characteristics have a direct effect on biological composition and abundance. The corresponding metrics have a greater possible score (20) than other metrics (table 1) because of their greater importance in affecting biological composition.
Metrics associated with channel morphology and structure have a smaller possible score of 15. Riparian and bank metrics, which affect species composition the least, have the lowest possible score of 10.
A GLEAS Procedure 51 aquatic-habitat score is obtained by adding together the individual scores for each of the nine metrics scored in the sampling reach. Assuming that the upstream control reach is classified as excellent, the downstream reach scores then are compared to the upstream reach score (control). Each reach then is classified as excellent, good, fair, or poor based on the degree of similarity to the expected optimum habitat conditions as represented by the upstream control or reference sampling reach (table 2).
The USGS NAWQA transect procedure (modified) is designed to record geomorphic changes in the stream channel. Three to five permanent transects were established at each of the five sampling reaches. Transect data were separated into four principal categories: (1) reach data (latitude/ longitude location, reach length, percent riffle, percent run, and percent pool), (2) stream data (mean canopy angle, mean aspect, mean width, mean depth, and maximum velocity), (3) bank and edge data (mean bank height, mean bank angle, amount of overhanging vegetation, amount of undercut banks, amount of woody debris, amount of macrophyte emergent, and amount of human rubbish), and (4) channel-configuration and streambed-type data (10-20 elevation measurements at each transect to record change in elevation and material type for streambanks and stream bottoms). The stream- habitat transects were included as part of the 39 bed- elevation profile transects.
ENVIRONMENTAL EFFECTS OF DAM REMOVAL
The USGS collected and analyzed data on water quality, suspended and bed sediment, stream habitat, and bed elevations to investigate the environmental effects of the dam and cofferdam removal. Data were collected before and after the removal, and upstream and downstream from the dam.
Water qualityThe effects of dams and their impoundments on
water quality are well documented. Among the effects are oxygen depletion, temperature modification, and changes in chemical composition (The Heinz Center, 2002). Continuous water-quality data were used to monitor downstream conditions before and after the dam removal. Discrete water-quality data were used to evaluate the effects of the dam on river-water quality.
11

Table 1. Great Lakes and Environmental Assessment Section (GLEAS) Procedure 51 habitat scoring criteria
Scoring criteria
Metric Excellent Good Fair Poor
Substrate and instream cover
1. Bottom substrate and available cover
2. Embeddedness/siltation
3. Water velocity
Channel morphology
4. Flow stability
5. Deposition/Sedimentation
6. Pools-riffles-runs-bends
Riparian and bank structure
16-20
16-20
16-20
12-15
12-15
12-15
11-15
11-15
11-15
8-11
8-11
8-11
6-10
6-10
6-10
4-7
4-7
4-7
0-5
0-5
0-5
0-3
0-3
0-3
7. Bank stability
8. Bank vegetation
9. Streamside cover
9-10
9-10
9-10
6-8
6-8
6-8
3-5
3-5
3-5
0-2
0-2
0-2
Continuous water-quality data
Water temperature, specific conductance, and dissolved oxygen data measured by the continuous water-quality monitor were examined for anomalies for the period from December 29, 1999, through October 12, 2001. Water temperature showed no unusual spikes or extremes of high temperature. Regression analyses of specific conductance with streamflow showed a strong negative correlation, with coefficient of determination (R2) equal to 0.80. There were no sudden increases that could be attributed to the dam removal. Dissolved oxygen showed a depression in concentration that lasted about 2 weeks when dam removal began. The daily mean dissolved-oxygen concentrations at the streamflow-gaging station for the period June 28 through July 18, 2000, is shown in figure 4. When compared to the dissolved-oxygen concentrations at streamflow-gaging stations Muskegon
River near Stanwood, Mich. (04121660), which is downstream from Rogers Dam, and Manistee River near Sherman, Mich. (04124000), a site considered minimally affected by anthropogenic activities, the concentrations at Big Rapids show a definite depression. This depression was due in part to an increase in water temperature and probably in part to oxidation of fine organic material stirred up during the initial phases of the dam removal. Because of the short time period for which continuous water-quality data are available, the data were not examined for trends.
Discrete water-quality samples
Prior to the dam removal, water-quality samples for major elements, solids, nutrients, organic carbon, selected trace elements, and selected pesticides were collected at White's Bridge on May 22, 2000, and at the M-20 Bridge on May 23, 2000. The samples
12

Table 2. Reach habitat classification system for the Great Lakes and Environmental Assessment
Section (GLEAS)
Reach Habitat Survey Category Description
Percentsimilarity to upstream
reach
Excellent
Good
Fair
Poor
Similar to upstream control
Slightly different from upstream control
Moderately different from upstream control
Greatly different from upstream control
>90
75-89
60-74
<59
were collected on different days, so some changes in chemical-constituent concentrations may be due to actual changes in concentrations in the river and not an effect of the reach between the sites. The analytical results and relative percent differences between the samples are presented in table 3. For most of the constituents, the relative percent difference in concentrations between the two sites was less than 10 percent. For other constituents, because of small environmental concentrations, small differences in concentrations between the sites produced relatively large percent differences.
The decrease in suspended-sediment concentrations (-35 percent from White's Bridge downstream to the M-20 Bridge is due in part to the lower streamflow at the time the M-20 bridge sample was collected and in part to settling of the larger particles in the impoundment behind the dam (table 3). Turbidity is a measurement of the scattering
effect that water and its contents have on light. The decrease in measured turbidity (-49 percent) downstream may be due in part to the smaller suspended-sediment concentration in the M-20 Bridge sample (table 3).
Chloride (17.8 percent) and sodium (11.5 percent) concentrations increased downstream (table 3). The instantaneous loads of chloride, however, were 80.7 ton/d at White's Bridge and 85.0 ton/d at the M-20 Bridge, an increase of only 6 percent. The instantaneous loads of sodium were 43.0 ton/d and 44.1 ton/d, an increase of 2.5 percent. When loads stay constant while streamflow changes is usually an indication that there is a constant source of the constituent and that streamflow largely will determine the concentration. The increase in sodium and chloride concentrations can be considered an effect of the lower streamflow and not an effect of the dam and its impoundment.
13

10
£ 9O
t£ K.LU
8
Z I- -,LU ~i f
O Q_ 6
I 1 5
O 5 4Q ̂> ̂ 3Oco 0co 2Q
1
0
MUSKEGON RIVER AT BIG RAPIDS
- - - - MUSKEGON RIVER NEAR STANWOOD
--"-' MANISTEE RIVER NEAR SHERMAN
28 29 30 1 JUNE, 2000
9 10 11 12 13 14 15 16 17 18 JULY, 2000
Figure 4. Daily mean dissolved-oxygen concentrations at the streamflow-gaging station Muskegon River at Big Rapids, Mich. (04121650), June 28, through July 18, 2000. (Concentrations at stations Muskegon River near Stanwood, Mich. (04121660) and Manistee River near Sherman, Mich. (04124000) are included for comparison.)
14
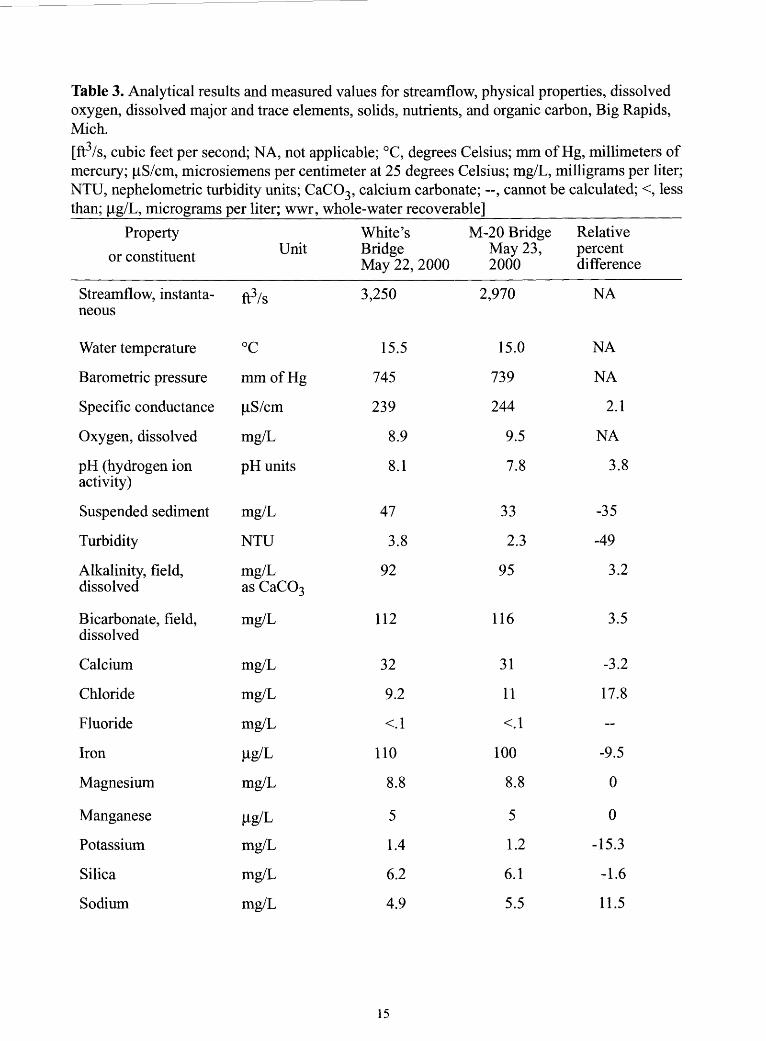
Table 3. Analytical results and measured values for streamflow, physical properties, dissolved oxygen, dissolved major and trace elements, solids, nutrients, and organic carbon, Big Rapids, Mich.[ft3/s, cubic feet per second; NA, not applicable; °C, degrees Celsius; mm of Hg, millimeters of mercury; jiS/cm, microsiemens per centimeter at 25 degrees Celsius; mg/L, milligrams per liter; NTU, nephelometric turbidity units; CaCO3 , calcium carbonate; , cannot be calculated; <, less than; jiig/L, micrograms per liter; wwr, whole-water recoverable]
Property
or constituent
Streamflow, instanta neous
Water temperature
Barometric pressure
Specific conductance
Oxygen, dissolved
pH (hydrogen ion activity)
Suspended sediment
Turbidity
Alkalinity, field, dissolved
Bicarbonate, field, dissolved
Calcium
Chloride
Fluoride
Iron
Magnesium
Manganese
Potassium
Silica
Sodium
Unit
ft3/s
°c
mm of Hg
juS/cm
mg/L
pH units
mg/L
NTU
mg/L as CaCO3
mg/L
mg/L
mg/L
mg/L
l^g/L
mg/L
^ig/L
mg/L
mg/L
mg/L
White's Bridge May 22, 2000
3,250
15.5
745
239
8.9
8.1
47
3.8
92
112
32
9.2
<1
110
8.8
5
1.4
6.2
4.9
M-20 Bridge May 23, 2000
2,970
15.0
739
244
9.5
7.8
33
2.3
95
116
31
11
<-l
100
8.8
5
1.2
6.1
5.5
Relative percent difference
NA
NA
NA
2.1
NA
3.8
-35
-49
3.2
3.5
-3.2
17.8
~
-9.5
0
0
-15.3
-1.6
11.5
15
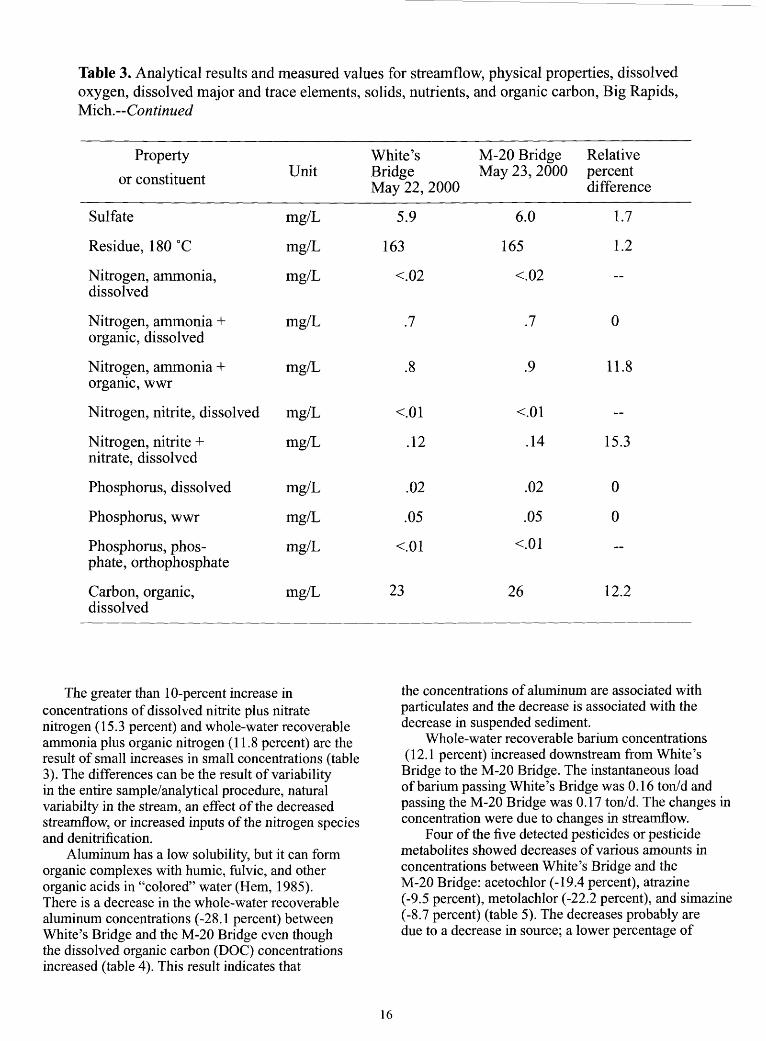
Table 3. Analytical results and measured values for streamflow, physical properties, dissolved oxygen, dissolved major and trace elements, solids, nutrients, and organic carbon, Big Rapids, Mien.-- Continued
Property
or constituent
Sulfate
Residue, 180 °C
Nitrogen, ammonia, dissolved
White's Unit Bridge
May 22, 2000
mg/L 5.9
mg/L 163
mg/L <.02
M-20 Bridge Relative May 23, 2000 percent
difference
6.0 1.7
165 1.2
<.02
Nitrogen, ammonia + mg/L organic, dissolved
Nitrogen, ammonia + mg/L organic, wwr
Nitrogen, nitrite, dissolved mg/L
Nitrogen, nitrite + mg/L nitrate, dissolved
Phosphorus, dissolved mg/L
Phosphorus, wwr mg/L
Phosphorus, phos- mg/L phate, orthophosphate
Carbon, organic, mg/L dissolved
.12
.02
.05
23
.14
.02
.05
26
11.8
15.3
0
0
12.2
The greater than 10-percent increase in concentrations of dissolved nitrite plus nitrate nitrogen (15.3 percent) and whole-water recoverable ammonia plus organic nitrogen (11.8 percent) are the result of small increases in small concentrations (table 3). The differences can be the result of variability in the entire sample/analytical procedure, natural variabilty in the stream, an effect of the decreased streamflow, or increased inputs of the nitrogen species and denitrification.
Aluminum has a low solubility, but it can form organic complexes with humic, fulvic, and other organic acids in "colored" water (Hem, 1985). There is a decrease in the whole-water recoverable aluminum concentrations (-28.1 percent) between White's Bridge and the M-20 Bridge even though the dissolved organic carbon (DOC) concentrations increased (table 4). This result indicates that
the concentrations of aluminum are associated with particulates and the decrease is associated with the decrease in suspended sediment.
Whole-water recoverable barium concentrations (12.1 percent) increased downstream from White's
Bridge to the M-20 Bridge. The instantaneous load of barium passing White's Bridge was 0.16 ton/d and passing the M-20 Bridge was 0.17 ton/d. The changes in concentration were due to changes in streamflow.
Four of the five detected pesticides or pesticide metabolites showed decreases of various amounts in concentrations between White's Bridge and the M-20 Bridge: acetochlor (-19.4 percent), atrazine (-9.5 percent), metolachlor (-22.2 percent), and simazine (-8.7 percent) (table 5). The decreases probably are due to a decrease in source; a lower percentage of
16

Table 4. Analytical results for whole-water recoverable major and trace elements, Big Rapids,Mich.[jLLg/L, micrograms per liter; <, less than; --, cannot be calculated; E, estimated; mg/L, milligramsper liter; ND, no data]
Constituent
Aluminum
Antimony
Arsenic
Barium
Beryllium
Cadmium
Calcium
Chromium
Cobalt
Copper
Iron
Lead
Lithium
Magnesium
Manganese
Mercury
Molybdenum
Nickel
Potassium
Selenium
Silver
Sodium
Strontium
Zinc
Unit
ug/L
ug/L
ug/L
ug/L
ug/L
ug/L
mg/L
ug/L
ug/L
ug/L
ug/L
Ug/L
ug/L
mg/L
ug/L
ug/L
ug/L
Ug/L
mg/L
ug/L
ug/L
mg/L
ug/L
ug/L
White's Bridge May 22, 2000
276
<1
2E
18.7
<5
<-l
31.6
.6E
<2
<20
564
.5E
<7
9.4
62.1
ND
<1
IE
1.4
IE
<1
5.1
80.2
16E
M-20 Bridge May 23, 2000
208
<1
<3
21.1
<5
< !
32.2
<1
<2
<20
515
<1
<7
8.8
61.9
<-3
1
IE
1.2
<3
<1
5.7
79.5
<31
Relative percent
difference
-28.1
-
~
12.1
~
-
1.9
~
--
-9.1
-
--
-6.6
0.3
-
~
0
-7.7
-
~
11.1
-0.9
-
17

Table 5. Analytical results for dissolved pesticides, Big Rapids, Mich. [--, cannot be calculated; <, less than; E, estimated]. Concentrations are reported in micrograms per liter
Pesticide
2 , 6-Diethylaniline
Acetochlor
Alachlor
Alpha-HCH
Atrazine
Azinphos-methyl
Benfluralin
Butylate
Carbaryl
Carbofuran
Chlorpyrifos
cw-Permethrin
Cyanazine
Dacthal
Deethylatrazine
Diazinon
Dieldrin
Disulfoton
EPIC
Ethafluralin
Ethoprophos
Fonofos
Lindane
Linuron
White's Bridge May 22, 2000
O.003
.017
<.002
<.002
.077
<.001
<.002
<.002
<.003
<.003
<.004
<.005
<.004
<.002
.024E
<.002
<.001
<.017
<002
<.004
<.003
<.003
<.004
<.002
M-20 Bridge Relative May 23, 2000 percent
difference
<0.003
.014 -19.4
<.002
<.002
.070 -9.5
<001
<.002
<.002
<.003
<.003
<.004
<.005
<.004
<.002
°1 4E decreased3
<.002
<.001
<.017
<.002
<.004
<.003
<.003
<.004
<.002
18
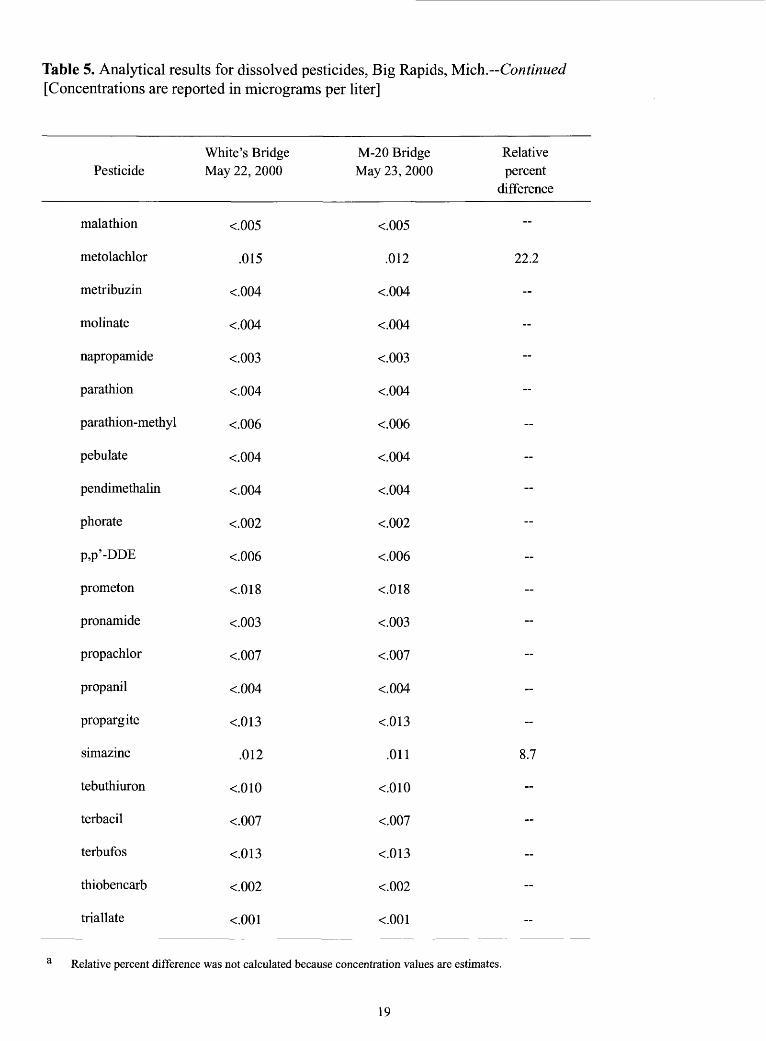
Table 5. Analytical results for dissolved pesticides, Big Rapids, Mich. Continued [Concentrations are reported in micrograms per liter]
Pesticide
malathion
metolachlor
metribuzin
molinate
napropamide
parathion
parathion-methyl
pebulate
pendimethalin
phorate
p,p'-DDE
prometon
pronamide
propachlor
propanil
propargite
simazine
tebuthiuron
terbacil
terbufos
thiobencarb
triallate
White's Bridge May 22, 2000
<.005
.015
<.004
<.004
<.003
<.004
<.006
<.004
<.004
<.002
<.006
<.018
<.003
<.007
<.004
<.013
.012
<010
<.007
<.013
<.002
<.001
M-20 Bridge May 23, 2000
<.005
.012
<.004
<.004
<.003
<.004
<.006
<.004
<.004
<.002
<.006
<.018
<.003
<.007
<.004
<.013
.011
<.010
<.007
<.013
<.002
<.001
Relative percent
difference
-
22.2
--
--
~
~
~
-
~
--
~
-
-
~
~
~
8.7
--
-
~
~
~
Relative percent difference was not calculated because concentration values are estimates.
19
the streamflow is runoff at the time the M-20 sample was collected. Deethylatrazine also showed a decrease in concentration between the two sites; but because there are low recoveries of this compound during the analytical procedure, concentration values only are estimates and percent difference should not be calculated.
For the samples compared, the dam did not appreciably affect water quality in the Muskegon River except through its effect on the sediment load and particle-size distribution. The two samples were collected at high flow, 3,250 fWs at White's Bridge and 2,970 fWs at the M-20 Bridge; the 2000 water year (October 1999 through September 2000) 10-percent exceedance for streamflow at the station at Big Rapids was 2,040 fWs (Blumer and others, 2001). Daily mean streamflows at the streamflow-gaging station, Muskegon River at Evart, Mich. (04121500) for May 22 was 2,760 fWs and for May 23 was 2,420 fWs. These streamflows were greater than the 10-percent exceedance of 1,950 ft3/s for water years 1931 2000 at that gaging station (Blumer and others, 2001). Because removal of the dam started before low-flow conditions were reached, the effect of the dam on water quality during low flow could not be measured. The impoundment behind the dam was small and run-of- the-river with an estimated retention time of less than 3 hours during the lowest flows of the year. It is probable that during low flows, the dam affected water quality in the Muskegon River only through its effect on sediment load and particle-size distribution.
Because the dam did not have a appreciable effect on Muskegon River water quality, no water-quality samples were collected and analyzed after the removal of the dam.
SedimentPrior to the dam removal, the sediment load
entering the impoundment reach from upstream, tributaries, and bank erosion probably was in equilibrium with the quantity leaving the reach over a year or multiyear period. There was no active aggradation of sediment behind the dam. Larger particles probably settled out in the impoundment during low flow and subsequently were remobilized during storm events or spring runoff. Winter ice jams also contributed to moving larger particles past the dam (David Westjohn, U.S. Geological Survey, oral commun., 1999). For this study, the total sediment loads entering the study area at White's Bridge and leaving the dam reach at the M-20 Bridge for the period January 1, 2000, through March 31, 2002, were
estimated and compared.From an examination of activities in the basin
upstream from the study area, it was assumed that there was no major change in the supply of upstream sediment during the study. Twelve suspended-sediment and 13 bedload samples (appendix 2) collected over 3 years at White's Bridge were used to develop linear regression models with daily mean streamflow for sediment entering the study area (figs. 5 and 6). Three additional suspended-sediment samples (February 28, 2000, March 2, 2000, and April 16, 2001) and two additional bedload samples (April 25, 2000, and March 26, 2002) were judged possibly as biased during collection and not used in the analyses. The model for suspended sediment regresses the Iog10 of the concentration with Iog10 of streamflow. The model for the daily bedload regresses the Iog 10 of bedload with the Iog10 of streamflow. Bias correction factors for the transformation of the estimated log values to suspended-sediment concentrations and bedload were calculated as discussed in Helsel and Hirsch (1992). Suspended-sediment concentrations and bedload when discharge is much lower or higher than the measured streamflows are not accounted for in the regression models. Daily mean streamflows were not less than 521 ftVs. The estimated suspended-sediment load, bedload, and total sediment load at White's Bridge are presented in figure 7.
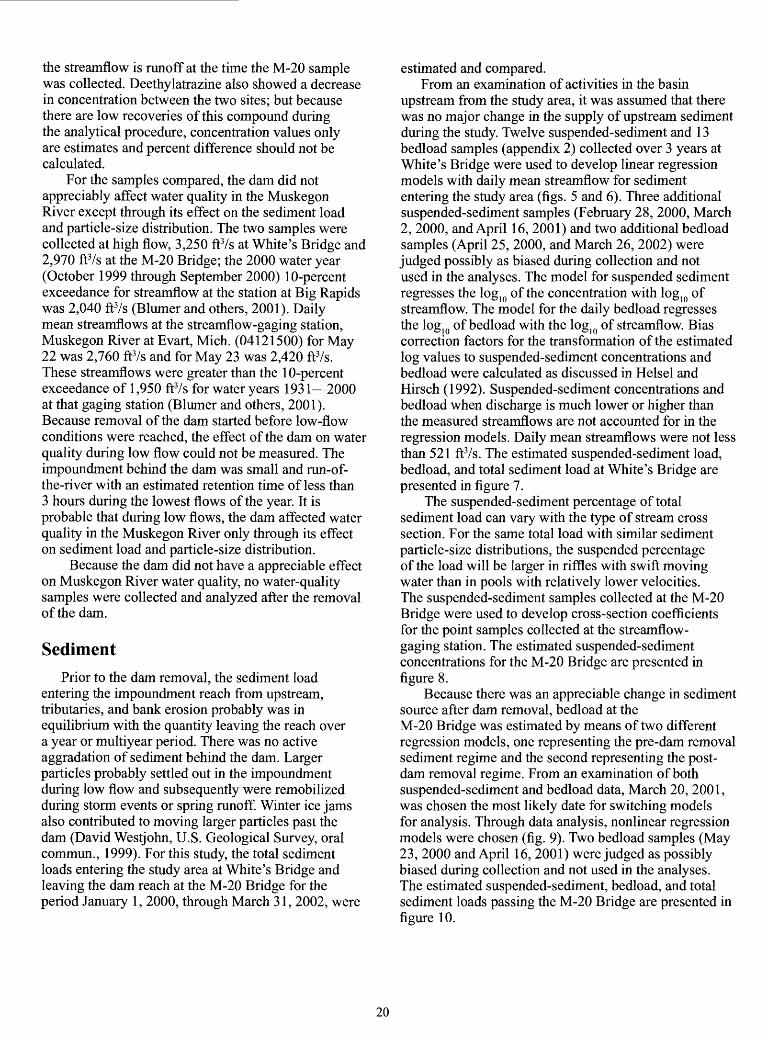
The suspended-sediment percentage of total sediment load can vary with the type of stream cross section. For the same total load with similar sediment particle-size distributions, the suspended percentage of the load will be larger in riffles with swift moving water than in pools with relatively lower velocities. The suspended-sediment samples collected at the M-20 Bridge were used to develop cross-section coefficients for the point samples collected at the streamflow- gaging station. The estimated suspended-sediment concentrations for the M-20 Bridge are presented in figure 8.
Because there was an appreciable change in sediment source after dam removal, bedload at the M-20 Bridge was estimated by means of two different regression models, one representing the pre-dam removal sediment regime and the second representing the post- dam removal regime. From an examination of both suspended-sediment and bedload data, March 20, 2001, was chosen the most likely date for switching models for analysis. Through data analysis, nonlinear regression models were chosen (fig. 9). Two bedload samples (May 23, 2000 and April 16, 2001) were judged as possibly biased during collection and not used in the analyses. The estimated suspended-sediment, bedload, and total sediment loads passing the M-20 Bridge are presented in figure 10.
20

o
o oI-
LLJ CO
Q LU Q
LU Q. CO
CO
co
90
80
70
£ LULu b 60o -1
50
30
20
10
0
MEASURED CONCENTRATION
ESTIMATED CONCENTRATION
1.3916(LOG 1Q(Q))-3.1683
COEFFICIENT OF DETERMINATION=0.90
BIAS CORRECTION FACTOR=0.996
0 1,000 2,000 3,000 4,000 5,000
STREAMFLOW, IN CUBIC FEET PER SECOND
Figure 5. Relation of suspended concentration to streamflow of the Muskegon River at White's Bridge, Big Rapids, Mich. (Data for samples collected on February 28, 2000, March 2, 2000, and April 16, 2001, were not used to develop the regression model.)
21

80
70
< 60 a:LLJ
OT 5°
2
t 40
< 30
_iD gj 20
10
0
MEASURED BED LOAD
ESTIMATED BED LOAD
1.0838(LOG 1Q(Q))-2.2003
COEFFICIENT OF DETERMINATION=0.58
BIAS CORRECTION FACTOR=1.018
1,000 2,000 3,000 4,000
STREAMFLOW, IN CUBIC FEET PER SECOND
5,000
Figure 6. Relation of bed load to streamflow of the Muskegon River atWhite's Bridge, Big Rapids, Mich. (Data for samples collected on April 25, 2000,and March 26, 2002, were not used to develop regression model.)
22

10,000
>- 1,000
LLJ CLCO
IO
g
100
10
SUSPENDED SEDIMENT BED LOAD
TOTAL SEDIMENT STREAMFLOW
0JAN MAR MAY JULY SEPT NOV JAN MAR MAY JULY SEPT NOV JAN MAR
2000 I 2001 I 2002
10,000
1,000 ;> QoZ
100 a aC£ LUI- 0-CO ,_Z LU < LU
in LU LL10 ^o
o
0.1
Figure 7. Suspended-sediment load, bed load, total sediment load, and streamflow entering Muskegon River study reach at White's Bridge, Big Rapids, Mich.
23
I 300
iz"* 250LJJUJO tZ -IO OL onnO Uj ZUU\-°-z co
IS 150
CO _l
SiUJ D. COD CO
100
50
0NOV
1999
ESTIMATED CONCENTRATIONS
MEASURED CONCENTRATIONS
MAR JUNE
2000
SEPT DEC APR JULY
2001
OCT FEE
2002
MAY
Figure 8. Cross-section-adjusted estimated and measured suspended-sediment concentrations at M-20 Bridge, Big Rapids, Mich.
24

600
500
>-Q
LU CLCO
O 400
300
200
100
^ MEASURED LOAD, PRE-REMOVAL
ESTIMATED LOAD, PRE-REMOVAL
MEASURED LOAD, POST-REMOVAL
ESTIMATED LOAD, POST-REMOVAL
1,000 2,000 3,000 4,000 5,000
DAILY MEAN STREAMFLOW (Q), IN CUBIC FEET PER SECOND
6,000
Figure 9. Relation of bed load at M-20 Bridge and daily mean streamflow at the U.S. Geological Survey streamflow-gaging station at Big Rapids, Mich. (Data for measured loads on May 23, 2000, and April 16, 2001, not used in the regression analyses. Date for change from pre- to post-dam removal curve is March 20, 2001.)
25

100,000
10,000
o£ 1,000CL
d < O
100
10
0.1
-SUSPENDED SEDIMENT-BED MATERIAL-TOTAL SEDIMENT
STREAMFLOW
100,000
10,000
1,000
100
10
0.1
O O LJJ co OLLJJ CL
LU LJJ U.
O COID O
o
JAN MAR MAY JULY SEPT NOV JAN MAR MAY JULY SEPT NOV JAN MAR 2000 I 2001 I 2002
Figure 10. Suspended-sediment load, bed load, total sediment load, and streamflow passing the M-20 Bridge, Big Rapids, Michigan.
26
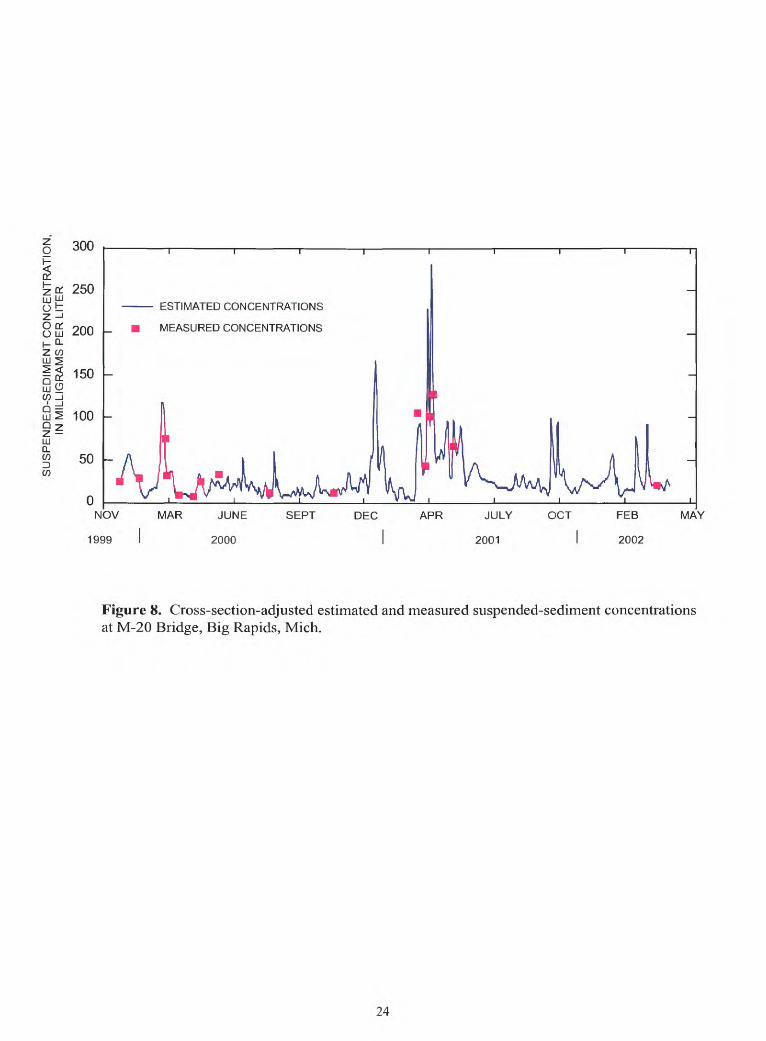
Table 6. Estimated monthly total sediment load passing White's Bridge and the M-20 Bridge,
[yd3 , cubic yards; CI, confidence interval]
Month
Jan-00
Feb-00
Mar-00
Apr-00
May-00
Jun-00
Jul-00
Aug-00
Sep-00
Oct-00
Nov-00
Dec-00
Jan-01
Feb-01
Mar-01
Apr-01
May-01
Jim-01
Whites Bridge
tons yd 3
1,169
3,772
4,655
2,516
8,278
3,155
941
868
720
890
1,594
1,229
1,321
2,453
4,283
10,064
11,215
5,791
524
1,690
2,085
1,127
3,708
1,413
422
389
323
399
714
551
592
1,099
1,919
4,508
5,024
2,594
M-20 Bridge 5
tons yd
2,508
6,485
3,586
1,897
4,412
3,229
1,228
1,088
714
1,011
1,302
1,881
5,358
1,775
5,912
25,396
17,470
6,327
1,123
2,905
1,606
850
1,977
1,447
550
487
320
453
583
843
2,400
795
2,648
11,376
7,826
2,834
Difference 5
tons yd
1,339
2,713
-1,069-619
-3,866
74
287
220-6
121-292
652
4,037-678
1,629
15,332
6,255
536
600
1,215-479
111
-1,732
33
129
98-2
54-131
292
1,808-304
730
6,868
2,802
240
95 percent CIT 3
Upper yd Lower yd
1,251
2,222
351
170-771
508
529
493
365
449
287
719
2,303
111
1,734
9,334
5,270
1,643
4
189
-1,336-738
-2,783-468
-217
-236
-304
-284
-536
-99
1,343-732
-200
4,303
525-774
The estimated monthly total sediment that passed White's Bridge and the M-20 Bridge is presented in table 6. For the period July 2000 through March 2002, the sediment load at the downstream site exceeded that at the upstream site by an estimated 13,800 yd3 . This additional sediment represents the sediment remobilized upstream from the dam, bank erosion when the impoundment was lowered, and contributions from tributaries between the sites. During the high flows of April-May 2001, the amount of sediment passing the downstream site exceeded that passing the upstream site by 9,970 yd3 . It is interesting to note that for the 6 months prior to dam removal, approximately 640 yd3 of sediment was stored in the study area even though this period included the spring high flows. The confidence intervals shown in table 6 represent the limits of the sediment load estimates for which there is a 95-percent
confidence that the true sediment loads are contained in these ranges. The upper limits were calculated monthly by subtracting the 95-percent low estimate at the M-20 bridge from the 95-percent high estimate at White's Bridge. The lower limits were calculated monthly by subtracting the 95-percent high estimate at the M-20 bridge from the 95-percent low estimate at White's Bridge.
Stream habitatData describing stream-habitat reaches delineated
on figures 2a, b, and c, are described in detail in this section. Three assessments were preformed at each reach (pre-removal, removal, and post-removal). Changes in bottom substrate, available cover, siltation, and embeddedness are discussed.
27

Table 6. Estimated monthly total sediment load passing White's Bridge and the M-20 Bridge-Continued
Month
July-01
Aug-01
Sep-01
Oct-01
Nov-01
Dec-01
Jan-02
Feb-02
Mar-02
Jan-00 toMar-02
Jan-00 toJun-00
July-00 to Mar-02
Whites Bridge
tons yd ^
689
615
804
3,852
3,684
4,144
2,018
3,354
9,860
93,934
23,545
70,389
309
275
360
1,726
1,650
1,856
904
1,502
4,417
42,078
10,547
31,531
M-20 Bridge-5
tons yd
1,412
1,251
1,374
6,196
2,904
3,566
3,085
3,871
8,024
123,262
22,117
101,145
633
560
615
2,776
1,301
1,597
1,382
1,734
3,594
55,216
9,907
45,308
Difference-5
tons yd
723
636
570
2,344-780
-578
1,067
517
-1,836
29,328
-1,428
30,756
324
285
255
1,050-349
-259
478
232-822
13,137
-640
13,777
95 percent CI3 3
Upper yd Lower yd
1,905
1,874
1,772
2,532
966
1,101
1,976
1,538
988
41,620
3,731
37,889
-47
-64
-130
247
-1,081
-1,064-113
-477
-2,488
-7,560
-5,132
-2,428
28

Table 7. Great Lakes and Environmental Assessment Section (GLEAS) Procedure 51 scores for Reach A-transects 1-3
Assessment Date Site score Site rating Referenceof site scores
assessment
Percent Habitat similarity survey
category
Pre-removal 04/26/00 110 Excellent 110 100 Excellent
Removal 10/20/00 113 Excellent 113 100 Excellent
Post-removal 09/17/01 114 Excellent 114 100 Excellent
Reference reach (reach A)
Reach A is a stable reference site just downstream from White's Bridge at transects 1-3 (fig. 2a). The reach was selected because the area is upstream from any dam effects and little or no change in stream habitat was expected. Stream habitat in reach A rated excellent for the pre- removal, removal, and post-removal assessments, with GLEAS Procedure 51 scores (Michigan Department of Natural Resources, 1991) of 110, 113, and 114, respectively (table 7).
Assessments of bottom substrate and available cover consistently found greater than 50 percent cobble, gravel, submerged logs and overhanging brush. Streambanks were lined with logs and wooden posts dating back to the logging operations of the late 1800's. Some of the instream gravel, logs, cobble, and boulders were covered with silt and sand but generally were less than 30-percent embedded. All stream habitat types (pools, runs,
and riffles) were well represented, with no type making up greater than 50 percent of the reach length, but a large deep pool was noted in the downstream section.
The stream bottom is mostly hard sand with some areas of soft sand and silt, especially in pools. The streambanks are moderately stable, with some erosion potential during extreme floods; however, banks generally are well vegetated with shrubs, trees, logs, and boulders (fig. 11).
Impoundment reach at North End Riverside Park (reach B)
Reach B is within the impoundment area between transects 7 and 13 (fig. 2a). This reach underwent dramatic habitat changes after the dam was removed. Stream-habitat GLEAS Procedure 51 scores went from
29

* 9 ~''*w ft?^
Figure 11. Reference reach (Reach A) downstream from White's Bridge looking west from left downstream bank, transect 1, October 20,2000. Photo by D.L. Hubbell
fair (69) for the pre-removal assessment, to good (106) for the removal assessment, to excellent (112) for the post-removal assessment (table 8). The reach went from a reduced-velocity impoundment with average depths of 3.5 ft, to a series of riffles, runs and pools of various depths and velocities (figs. 12 and 13).
Assessments of the substrate and available cover documented the change from a predominantly sand/silt system to a diverse mixture of gravel, cobble, boulders, and large logs within a year of the dam removal. The streambed changed from a predominantly soft sand/silt bottom to a hard cobble gravel, with soft sand present only in the deeper pools.
Year-round streamflow to the reach remained basically the same. Springs and bank seeps were exposed when the impoundment head was lowered. Some of the streambanks became exposed during
dam removal; however, banks appeared to be stabilizing 1-year later with grasses, sandbar willow, and cottonwood seedlings.
First downstream reach at Hemlock Park (reach C)
Reach C is between transects 21 and 23 in Hemlock Park (fig. 2b). Reach C underwent slight habitat degradation after the dam was removed, but habitat scores remained good. Stream-habitat GLEAS Procedure 51 scores rated good (88) for the pre-removal assessment, good (84) for the removal assessment, and good (79) for the post-removal assessment (table 9).
30

Table 8. Great Lakes and Environmental Assessment Section (GLEAS) Procedure 51 scores for Reach B at North End Riverside Park, transect 7-13
Assessment Date Site score Site rating Referenceof site scores
assessment
Percent Habitat similarity survey
category
Pre-removal 04/20/00 69 Fair 110 63 Fair
Removal 10/19/00 106 Good 113 94 Excellent
Post-removal 09/07/01 112 Excellent 114 98 Excellent
Figure 12. Impoundment reach (Reach B) at North End Riverside Park before dam removal looking east from right downstream bank, transect 9, April 4, 2000. Photo by D.L. Hubbell
31

Figure 13. Impoundment reach (Reach B) at North End Riverside Park after dam removal, looking east from right downstream bank, transect 9. Photo by D.L. Hubbell.
Table 9. Great Lakes and Environmental Assessment Section (GLEAS) Procedure 51 scores for Reach C at Hemlock Park, transect 21-23
Assessment Date Site score Site rating Referenceof site scores
assessment
Percent Habitat similarity survey
category
Pre-removal
Removal
Post-removal
04/17/00
10/17/00
09/05/01
88
84
79
Fair
Good
Excellent
110
113
114
80
74
69
Good
Good
Fair
32
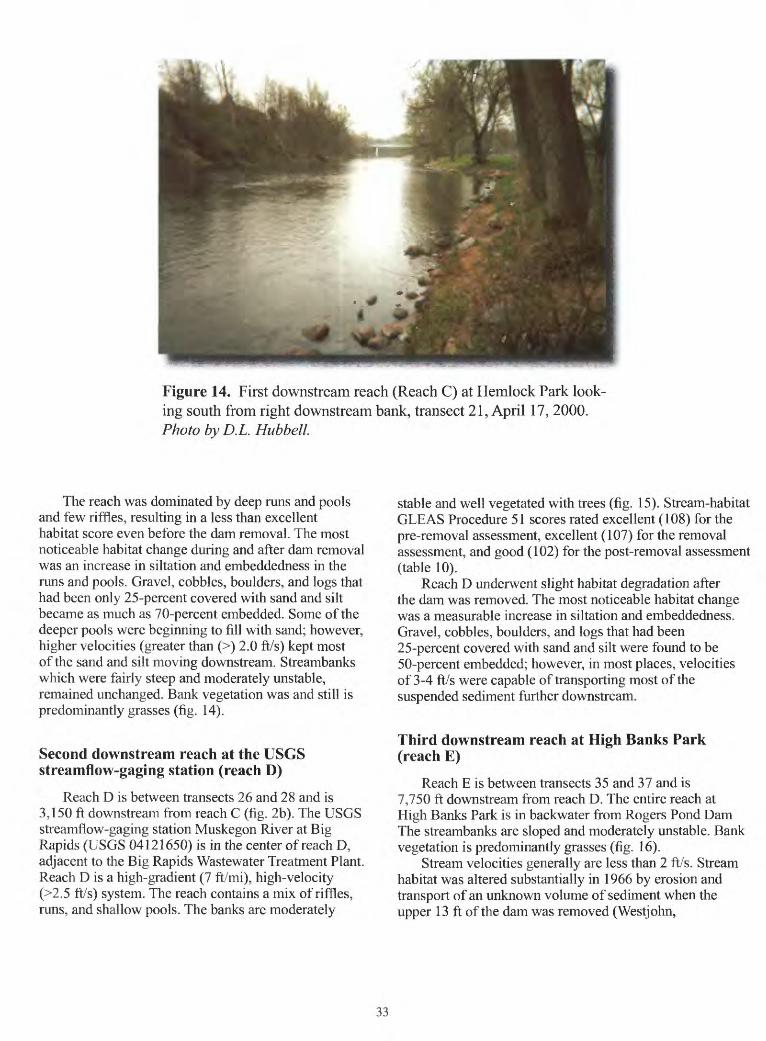
Figure 14. First downstream reach (Reach C) at Hemlock Park look ing south from right downstream bank, transect 21, April 17, 2000. Photo by D.L. Hubbell
The reach was dominated by deep runs and pools and few riffles, resulting in a less than excellent habitat score even before the dam removal. The most noticeable habitat change during and after dam removal was an increase in siltation and embeddedness in the runs and pools. Gravel, cobbles, boulders, and logs that had been only 25-percent covered with sand and silt became as much as 70-percent embedded. Some of the deeper pools were beginning to fill with sand; however, higher velocities (greater than (>) 2.0 ft/s) kept most of the sand and silt moving downstream. Streambanks which were fairly steep and moderately unstable, remained unchanged. Bank vegetation was and still is predominantly grasses (fig. 14).
Second downstream reach at the USGS streamflow-gaging station (reach D)
Reach D is between transects 26 and 28 and is 3,150 ft downstream from reach C (fig. 2b). The USGS streamflow-gaging station Muskegon River at Big Rapids (USGS 04121650) is in the center of reach D, adjacent to the Big Rapids Wastewater Treatment Plant. Reach D is a high-gradient (7 ft/mi), high-velocity (>2.5 ft/s) system. The reach contains a mix of riffles, runs, and shallow pools. The banks are moderately
stable and well vegetated with trees (fig. 15). Stream-habitat GLEAS Procedure 51 scores rated excellent (108) for the pre-removal assessment, excellent (107) for the removal assessment, and good (102) for the post-removal assessment (table 10).
Reach D underwent slight habitat degradation after the dam was removed. The most noticeable habitat change was a measurable increase in siltation and embeddedness. Gravel, cobbles, boulders, and logs that had been 25-percent covered with sand and silt were found to be 50-percent embedded; however, in most places, velocities of 3-4 ft/s were capable of transporting most of the suspended sediment further downstream.
Third downstream reach at High Banks Park (reach E)
Reach E is between transects 35 and 37 and is 7,750 ft downstream from reach D. The entire reach at High Banks Park is in backwater from Rogers Pond Dam The streambanks are sloped and moderately unstable. Bank vegetation is predominantly grasses (fig. 16).
Stream velocities generally are less than 2 ft/s. Stream habitat was altered substantially in 1966 by erosion and transport of an unknown volume of sediment when the upper 13 ft of the dam was removed (Westjohn,
33

Figure 15. Second downstream reach (Reach D) at the USGS stream- flow-gaging station looking east from right downstream bank, transect 26, October 17, 2000. Photo byD.L. Hubbell
Table 10. Great Lakes and Environmental Assessment Section (GLEAS) Procedure 51 scores for Reach D -reach at USGS streamflow-gaging station, transects 26-28
Assessment Date Site score Site rating Referenceof site scores
assessment
Percent Habitat similarity survey
category
Pre-removal 04/19/00 108 Excellent 110 98 Excellent
Removal 10/17/00 107 Excellent 113 95 Excellent
Post-removal 09/06/01 102 Good 114 Good
34

Figure 16. Third downstream reach (Reach E) at High Banks Park looking east from left downstream bank, transect 36. Photo by D.L. Hubbell.
Table 11. Great Lakes and Environmental Assessment Section (GLEAS) Procedure 51 scores for Reach E -reach at High Banks Park, transects 35-37
Assessment Date Site score Site rating Referenceof site scores
assessment
Percent Habitat similarity survey
category
Pre-removal 04/18/00 68 Fair 110 62 Fair
Removal 10/16/00 68 Fair 113 61 Fair
Post-removal 09/04/01 54 Fair 114 47 Poor
35

LU
Li-
LUa
896
895
894
893
892 j !
LU 891
O§ 8902 O I- 889
ILU 888
887
886
PROFILE DATE
4/27/00
A 9/17/01
20 40 60 80 100 120 140 160 180 200 220 240 260 280 300
STREAM BED REFERENCE DISTANCE, IN FEET
Figure 17. Streambed-elevation profiles measured at transect 2. (Streambed reference distance is measured from the right bank looking downstream. Location of transect is shown in fig. 2a.)
1997). The removal of the dam in 2000 continued to move sediment into this reach. Stream-habitat GLEAS Procedure 51 scores rated fair (68) for the pre-removal assessment, fair (68) for the removal assessment, and fair (54) for the post-removal assessment (table 11).
The most noticeable change after the dam removal was a substantial increase in siltation and embeddedness. Cobbles, boulders, and logs that had been 70-percent covered with sand and silt became as much as 90-100-percent embedded. Some of the deeper pools were almost completely filled in with sand. The reach that formerly contained some riffles and pools basically became one long run of fairly uniform depth
Streambed-elevation profiles
Streambed elevations were monitored at 39 transects stretching from the upstream edge of reach A to the bottom of the study area downstream from reach E in an effort to measure elevation responses to the dam removal (fig. 2). The reach above the dam site can be divided into two sections: (1) an area upstream from transect 6, where there appears to be little or no change in bed elevation because of dam removal and (2) the area between transect 6 and the dam site (fig. 2), where transects showed various degrees of erosion because of dam removal. Transect 2 for the April 2000 pre-removal and the September 2001 post-removal assessments is shown in figure 17. Only minor elevation changes in the Streambed result, most likely due to regular daily sediment transport (fig. 17).
36

LU LLJ
J >LJJ-" <LU
co
<LLJ_l LJJ
891
890
889
888
887
886
885
884
883
882
881
PROFILE DATE
6/8/00
5/21/02
40 80 120 160 200 240 280
STREAM BED REFERENCE DISTANCE, IN FEET
320 360
Figure 18. Streambed-elevation profiles measured at transect 12. (Streambed reference distance is measured from the right bank as you look downstream. Flat lines at water level represent islands or rock cribs that extend above the water surface. Location of transect is presented in figure 2a.)
The lowering of the water level with the removal of the dam increased velocity in the reach downstream from transect 6 (fig. 2). Erosional effects in this reach varied from the removal of a small layer of sand and silt at transects 7, 8, and 9 to the deepening of the river channel at transect 12. Transect 12 is at the downstream edge of the group of three islands just upstream from the dam site. When the water level was lowered, the river channel was narrowed along the island, and active bed cutting commenced. Streambed-elevation profiles measured pre-dam removal in June 2000 and approximately 2 years after the dam removal in May 2002 are shown in figure 18. Bed elevations have been lowered on average more than I ft across the transect. The islands are shown as flat lines at the water level. The flat line at approximately 160 ft is a rock crib that was missed during the June 2000 measurement.
Transect 13 just downstream from transect 12 showed no erosion.
Transects 14, 15, and 16 are in the reach just upstream from the dam site (fig. 2) and in an area that was affected by dredging of bottom sediment prior to dam removal. The Streambed-elevation profiles show a lowering of the bed from approximately 0.5 ft for transect 15 to greater than 1 ft for transect 16. The profiles from June 2000 and September 2001 for transect 16 are shown in figure 19.
37

20 40 60 80 100 120 140 160 180 200 220 240 260 280 300
STREAM BED REFERENCE DISTANCE, IN FEET
Figure 19. Streambed-elevation profiles measured at transect 16. (Streambed reference distance is measured from the right bank looking downstream. Location of transect is shown in fig. 2a.)
38

At the time these profiles were measured, piers from an old railroad bridge remained in the river at this transect. Most of the streamflow during the September 2001 profile was flowing through a channel that centered between some of the piers at 120 ft from the right bank. The deep channel at the position reflects this flow.
Transects 17 and 18 are between the dam site and cofferdam site, and transects 19 and 20 are the first two transects downstream from the cofferdam site (fig. 2). The area between the dam and the cofferdam was used as a sediment trap until the cofferdam was removed (1 year after the dam.) The profiles for transect 18 and, to a lesser degree transect 17, show the aggradation of sediment behind the cofferdam and the subsequent removal of that sediment through dredging and erosion. Four streambed-elevation profiles for transect 19 that also reflect the sediment processes at transect 20 are shown in figure 20. The first two profiles, from June 2000 and October 2000, almost are identical and show no aggradation or erosion at this transect during the period of dam removal. The September 2001 profile shows aggradation of the deeper channel, with more than 2 ft of additional sediment. The June 2002 profile measured after the removal of the cofferdam, however, shows that a substantial amount of sediment was remoblized and moved downstream.
From transect 21 downstream to transect 30 (fig. 2), the Muskegon River channel is a series of runs, riffles, and pools. For the most part, profiles at the transects in this reach show little or no aggradation or erosion since dam removal. The exception is transect 24, where approximately 1 ft of sediment filled the deep channel between the profiles from June 2000 and September 2001.
A comparison of profiles measured at transect 23 during April 2000 and June 2002 show little change in bed elevation (fig. 21). This transect is the downstream transect of stream-habitat reach C. Assessments of this habitat reach and of habitat reach D noted that stream velocities in these reaches were high enough to keep sediment mobilized and that the most noticeable change in the streambed was an increase in siltation and embeddedness.
Downstream from transect 31 (fig. 2) the river channel deepens, the right bank steepens and contains some noticeable areas of bank erosion, and parts of the channel still show effects from the 1966 sediment release. A local resident at transect 32 said that the deeper pools lost in the late 1960s returned to the river in the late 1990s. Bed-elevation profiles measured at transects 31 through 39 show that in the year after the
removal of the dam, there was noticeable aggradation in some areas of this reach; the pools were filled. The assessment for stream habitat reach E noted that embeddedness had increased and that the reach had become one long run of fairly uniform depth.
Streambed-elevation profiles measured in May 2002 show that, once again, some of the deposited sediment was remobilized and moved out of the study reach. The profiles for transect 36 are the best illustration of sediment movement in the reach (fig. 22). A comparison of the April 2000 and September 2001 profiles shows a substantial deposition of sediment during that time. The deeper channels were filled in and a layer of sediment had aggredated the entire channel bed. By May 2002, the profiles show the deeper channel scoured back to its initial elevation and part of the sediment layer had eroded.
PERSISTENCE OF THE MEASURED ENVIRONMENTAL EFFECTS
Removal of the dam and cofferdam had both undesirable and desirable effects on the habitat of the Muskegon River. Undesirable effects measured during this study, however, were or are short term (days, weeks, and months), whereas the desirable effects of the dam removal appear to be long term (years).
The undesirable effects included the dissolved- oxygen concentration depression at the beginning of the dam removal and the degradation of downstream habitat during the first year after dam removal. The dissolved-oxygen concentration depression lasted less than 2 weeks in early July 2000, during which the minimum daily mean dissolved-oxygen concentration was 4.2 mg/L on July 6 (Blumer and others, 2001). Degradation of downstream habitat was slight and mainly caused by increased siltation and embeddedness. Streambed-elevation profiles measured 9 months after the post-dam removal stream-habitat assessments showed the sediment that caused this degradation was moving out of the study area.
The most desirable effect of the dam removal for the city of Big Rapids was the elimination of the danger of dam and cofferdam to recreational users of the river. With regard to the riverine environment, GLEAS 51 assessment scores for the reach above the dam site showed that the stream habitat in this reach has improved substantially. Without some outside interference, the habitat in this reach should continue to be excellent. In addition, the Muskegon River is in the process of returning to its natural gradient and flow condition in the dam-site reach.
39

PROFILE DATE 6/27/00
10/17/00
9/18/01
6/13/02
0 20 40 60 80 100 120
STREAMBED REFERENCE DISTANCE, IN FEET
Figure 20. Streambed-elevation profiles measured at transect 19. (Streambed reference distance is measured from the right bank looking downstream. Location of transect is shown in fig. 2b.)
40

LLJ LJJ
LJJ >LJJ
LJJ COLJJ
O OQ
O
§LJJ_l LJJ
878
877
876
875
874
873
872
871
870
869
868
PROFILE DATE *-4/19/00
- 6/14/02
20 40 60 80 100 120 140 160 180 200
STREAMBED REFERENCE DISTANCE, IN FEET
Figure 21. Streambed-elevation profiles measured at transect 23. (Streambed reference distance is measured from the right bank looking downstream. Location of transect is shown in fig. 2b.)
41

PROFILE DATE 4/18/00
LLJ
20 40 60 80 100 120 140
STREAMBED REFERENCE DISTANCE, IN FEET
160 180 200
Figure 22. Streambed-elevation profiles measured at transect 36. (Streambed reference distance is measured from the right bank looking downstream. Location of transect is shown in fig. 2c.)
42

SUMMARY AND CONCLUSIONS
The USGS, in cooperation with the city of Big Rapids, Mich., applied a multidiscipline approach to study the effects of a dam removal on the environment of the Muskegon River. This dam was located in the northern part of Big Rapids in the north-central part of the Lower Peninsula of Michigan. The approximately 1,751 mi2 basin upstream from the dam was underlain by a varying thickness of glacial deposits covering mainly Mississippian and Pennsylvanian age sedimentary-type bedrock. The primary land use/land cover in the basin is forest; the secondary land use is agriculture.
The USGS study determined the water quality, sediment character, stream habitat, and geomorphic changes before and after dam removal. Continuous water-quality data and discrete water-quality samples were collected, the movement of suspended and bedload sediment measured, streambed elevations at 39 transects were surveyed, and changes in stream habitat assessed. In a complementary study, MDNR monitored the effects of the dam removal on fish and macroinvertebrate populations.
Analyses of the continuous water-quality data and the analytical data from the discrete samples showed that the dam did not affect water quality. During the beginning of the dam removal, dissolved-oxygen concentrations were depressed for a short period. Otherwise, no effects were seen in the continuous data.
The total sediment load entering the study area at White's Bridge and leaving the dam reach at the M-20 Bridge were estimated and compared. For the period during July 2000 through March 2002, the total sediment load at White's Bridge was 31,500 yd3 ; the total sediment load at the M-20 Bridge was 45,300 yd3 . The 13,800 yd3 additional sediment at the M-20 Bridge represents sediment remobilized upstream from the dam, bank erosion when the impoundment was lowered, and contributions from tributaries between the sites.
Stream-habitat assessment reaches varied in their responses to the dam removal. Reach A, the upstream reference reach, was not affected. Reach B, within the impoundment area, underwent dramatic habitat changes after the dam was removed. Stream-habitat ratings went from fair in April 2000 to excellent in September 2001. Reach C underwent slight habitat degradation after the dam was removed, but the habitat ratings remained good. Reach D underwent slight habitat degradation after the dam was removed. Stream-habitat rating went from excellent in April 2000 to good in September 2001. Reach E is in an area that still is affected by the 1966 sediment release, and the 2000 removal of the
dam continued to move sediment into this reach. The stream habitat rated fair in April 2000 and remained fair in September 2001. The most noticeable habitat change in the three reaches downstream from the dam site (C, D, and E) was a measurable increase in siltation and embeddedness.
After the dam removal in summer 2000, streambed-elevation profiles conveyed a reduction of bed material upstream from the dam site by means of dredging and remobilization as suspended sediment and bedload. Part of the remobilized sediment was caught in the sediment trap upstream from the cofferdam, whereas the remainder moved downstream to deposit in the reaches of the study area below the cofferdam. Deposition in these reaches was dependent on the streamflow velocities. Deposition was greater in the deeper, slower moving pools than the shallower, faster moving riffles. For the most part, the depositional layers were less than 1 ft thick. In the year following the removal of the cofferdam, much of the deposited sediment was remobilized and moved downstream out of the reaches in the study area.
REFERENCES
Blumer, S.P., 1993, Michigan-Stream water quality, in Paulson, R.W., Chase, E.B., Williams, J.S., and Moody, D.W., eds., 1993, National water summary 1990-91 Hydrologic events and stream water quality: U.S. Geological Survey Water-Supply Paper 2400, p. 325-334.
Blumer, S.P., Behrendt, T.E., Ellis, J.M., Minnerick, R.J., LeuVoy, R.L., and Whited, C.R., 2000, Water resources data Michigan water year 1999: U.S. Geological Survey Water-Data Report MI-99-1, 408 p.
Blumer, S.P., Behrendt, T.E., Ellis, J.M., Minnerick, RJ., LeuVoy, R.L., and Whited, C.R., 2001, Water resources data Michigan water year 2000: U.S. Geological Survey Water-Data Report MI-00-1, 428 p.
Breton, R.W, and Arnett, T.L., 1993, Methods of analysis by the U.S. Geological Survey National Water Quality Laboratory Determination of dissolved organic carbon by uv-promoted persulfate oxidation and infrared spectrometry: U.S. Geological Survey Open-File Report 92-480, 12 p.
Buchanan, T.J., and Somers, W.P., 1969, Discharge measurements at gaging stations: U.S. Geological Survey Techniques of Water-Resources Investigations, book 3, chap. A8, 65 p.
43
Edwards, T.K., and Glysson, G.D., 1999, Field methods for the measurement of fluvial sediment: U.S. Geological Survey Techniques of Water-Resources Investigations, book 3, chap. C2, 89 p.
Ferris State University, 2000, Removal of the Big Rapids dam remnant An environmental assessment: Environmental Management Studies Center, Ferris State University, Big Rapids, Mich., 69 p.
Fishman, M.J., 1993, Methods of analysis by the U.S. Geological Survey National Water Quality Laboratory Determination of inorganic and organic constituents in water and fluvial sediments: U.S. Geological Survey Open-File Report 93-125, 217 p.
Fishman, M.J., andFriedman, L.C., 1989, Methods for determination of inorganic substances in water and fluvial sediments: U.S. Geological Survey Techniques of Water-Resources Investigations, book 5, chap. Al, 545 p.
Garbarino, J.R., and Struzeski, T.M., 1998, Methods of analysis by the U.S. Geological Survey National Water Quality Laboratory Determination of elements in whole-water digests using inductively coupled plasma-optical emission spectrometry and inductively coupled plasma-mass spectrometry: U.S. Geological Survey Open-File Report 98-165, 101 p.
Guy, H.P., 1969, Laboratory theory and methods for fluvial analysis: U.S. Geological Survey Techniques of Water-Resources Investigations, book 5, chap. Cl, 59 p.
Hegarty, J. R., 2001, Putting the BIG back intoRAPIDS, in Michigan Out-of-Doors, May 2001, Publisher-Michigan United Conservation Clubs, Lansing, Mich., p. 72-74.
Helsel D.R., and Hirsch, R.M., 1992, Statistical methods in water resources: Amsterdam, The Netherlands, Elsvier Science Publishers, 449 p.
Hem, J.D., 1985, Study and interpretation of the chemical characteristics of natural water (3d ed.): U.S. Geological Survey Water-Supply Paper 2254, 263 p.
Jones, S.R., and Garbarino, J.R., 1999, Methods of analysis by the U.S. Geological Survey National Water Quality Laboratory Determination of arsenic and selenium in water and sediment by graphite furnace-atomic absorption spectrometry: U.S. Geological Survey Open-File Report 98-639, 39 p.
Jones, S.R., and McLain, B.J., 1997, Methods of analysis by the U.S. Geological Survey National Water Quality Laboratory Determination of molybdenum in water by graphite furnace atomic absorption spectrophotometry: U.S. Geological Survey Open-File Report 97-198, 25 p.
Leverett, Frank, and Taylor, F.B., 1915, The Pleistocene of Indiana and Michigan and history of the Great Lakes: U.S. Geological Survey Monogram 53, 529 p.
McLain, B.J., 1993, Methods of analysis by the U.S. Geological Survey National Water Quality Laboratory Determination of chromium in water by graphite furnace atomic absorption spectrophotometry: U.S. Geological Survey Open-File Report 93-449, 16 p.
Meador, M.R., Hupp, C.R., Cuffhey, T.F., and Gurtz, M.E., 1993, Methods for characterizing stream habitat as part of the National Water Quality Assessment Program: U.S. Geological Survey Open-File Report 93-408, 48 p.
Michigan Department of Natural Resources, 1991, Great Lakes and Environmental Assessment Section (GLEAS) procedure 51, revised June 1991 Qualitative biological and habitat survey protocols for wadable streams and rivers: Surface Water Quality Division, 40 p.
Michigan Department of Natural Resources, 1992, Water quality and pollution control in Michigan: Michigan 305(b) report: Surface Water Quality Division, v. 12, 307 p.
Michigan Department of Natural Resources, 1997, 2000, Aquatic habitat and fisheries implications of the removal of Big Rapids dam; Michigan Department of Natural Resources, Fisheries Division, [prepared May 14, 1997, edited May 10, 2000] 5 p.
Milstein, R.L., compiler, 1987, Bedrock geology of southern Michigan: Michigan Department of Natural Resources, Geological Survey Division, map, 1 sheet.
Patton, C.J., and Truitt, E.P., 1992, Methods of analysis by the U.S. Geological Survey National Water Quality Laboratory Determination of total phosphorus by a Kjeldahl digestion method and an automated colorimetric finish that includes dialysis: U.S. Geological Survey Open-File Report 92-146, 39 p.
Porterfield, George, 1972, Computations of fluvial- sediment discharge: U.S. Geological Survey
44

Techniques of Water-Resources Investigations book 3, chap. C3, 66 p.
Pritt, J.W., and Raese, J.W., 1995, Quality assurance/ quality control manual National Water Quality Laboratory: U.S. Geological Survey Open-File Report 95-443, 35 p.
Rantz, S.E., and others, 1982, Measurement andcomputation of streamflow: volume 2. Computation of discharge: U.S. Geological Survey Water-Supply Paper 2175, 631 p.
The Heinz Center, 2002, Dam removal science and decision making: Washington D.C., The H. John Heinz III Center for Science, Economics, and the Environment, 221 p.
U.S. Environmental Protection Agency, 1991, Methods for the determination of metals in environmental samples: Environmental Monitoring Systems Laboratory, EPA/600/4-91-010, v. 1, (variously paged).
U.S. Environmental Protection Agency, 1993, Methods for the determination of inorganic substances in environmental samples: Environmental Monitoring Systems Laboratory, EPA/600/R-93/0100, v. 1. [variously paged].
U.S. Geological Survey, 1986, Land use and land cover data from 1:250,000- and l:100,000-scale maps: National Mapping Program, technical instructions, data user's guide 4, 36 p.
U.S. Geological Survey, 1986, Natural WaterInformation System Web Data for Michigan, at http: mi.waterdata.usgs.gov/nwis.
Wagner, R.J., Mattraw, H.C., Ritz, G.F., and Smith, B.A., 2000, Guidelines and standard procedures for continuous water-quality monitors site selection, field operation, calibration, record computation, and reporting: U.S. Geological Survey Water- Resources Investigations Report 00-4252, 53 p.
Westjohn, D.B., 1997, Stratigraphy, sedimentology, and volume of sediments behind a dam relic on the Muskegon River, Big Rapids, Michigan: U.S. Geological Survey Water-Resources Investigations Report 97-4069, 14 p.
Wilde, F.D., and Radtke, D.B., 1998, Fieldmeasurements National field manual for the collection of water-quality data: U.S. Geological Survey Techniques of Water-Resources Investigations, book 9, chap A6, 246 p.
Wilde, F.D., Radtke, D.B., Gibs, J., and Iwatsubo, R.T., 1999a, Collection of water samples National
field manual for the collection of water-quality data: U.S. Geological Survey Techniques of Water- Resources Investigations, book 9, chap A4, 103 p.
Wilde, F.D., Radtke, D.B., Gibs, J., and Iwatsubo, R.T., 1999b, Processing of water samples National field manual for the collection of water-quality data: U.S. Geological Survey Techniques of Water- Resources Investigations, book 9, chap A5, 128 p.
Zaugg, S.D., Sandstrom, M.W, Smith, S.G., and Fehlberg, K.M., 1995, Methods of analysis by the U.S. Geological Survey National Water Quality Laboratory Determination of pesticides in water by C-18 solid-phase extraction and capillary- column gas chromatography/mass spectrometry with selected-ion monitoring: U.S. Geological Survey Open-File Report 95-181, 60 p.
45

Appendix 1.-- Tables listing constituents, parameter codes, reporting levels, units, analytical method and method reference.
Table 1A. Dissolved major and trace elements, solids, turbidity, nutrient, and organic carbon.
Table IB. Whole-water recoverable major and trace element.
Table 1C. Dissolved pesticide.
46
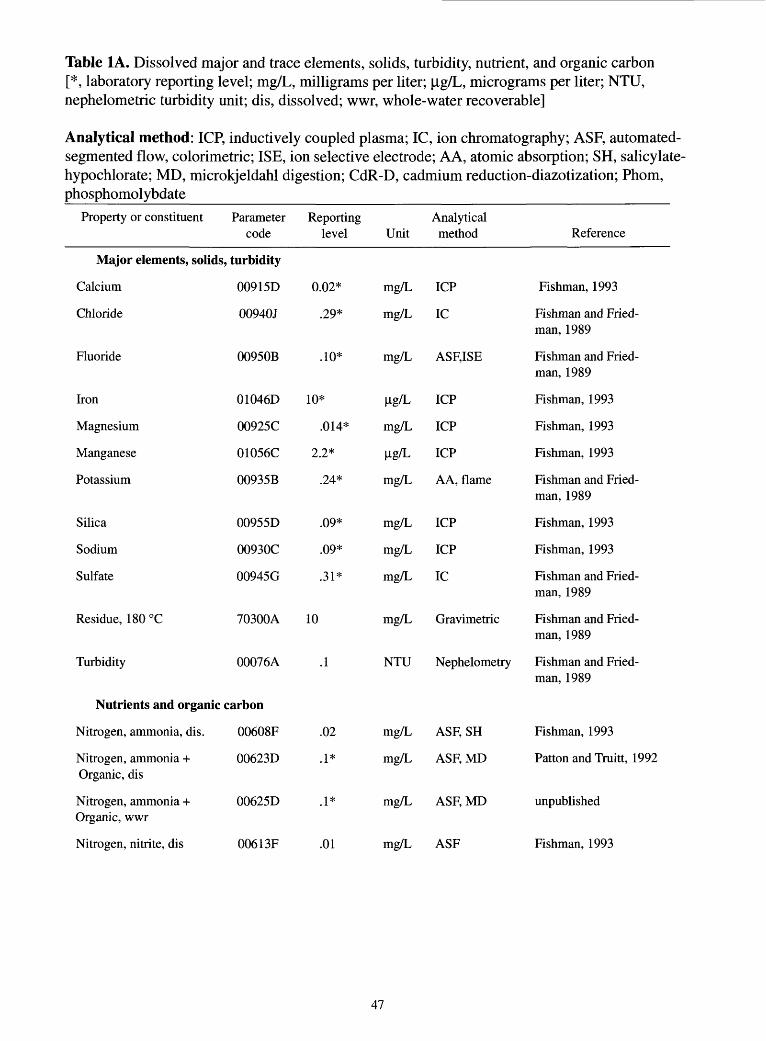
Table 1A. Dissolved major and trace elements, solids, turbidity, nutrient, and organic carbon [*, laboratory reporting level; mg/L, milligrams per liter; jig/L, micrograms per liter; NTU, nephelometric turbidity unit; dis, dissolved; wwr, whole-water recoverable]
Analytical method: ICP, inductively coupled plasma; 1C, ion chromatography; ASF, automated- segmented flow, colorimetric; ISE, ion selective electrode; A A, atomic absorption; SH, salicylate- hypochlorate; MD, microkjeldahl digestion; CdR-D, cadmium reduction-diazotization; Phom, phosphomolybdate
Property or constituent Parameter code
Reporting level Unit
Analytical method Reference
Major elements, solids, turbidity
Calcium
Chloride
Fluoride
Iron
Magnesium
Manganese
Potassium
Silica
Sodium
Sulfate
Residue, 180 °C
Turbidity
00915D
00940J
00950B
01046D
00925C
01056C
00935B
00955D
00930C
00945G
70300A
00076A
0.02*
.29*
.10*
10*
.014*
2.2*
.24*
.09*
.09*
.31*
10
.1
mg/L
mg/L
mg/L
Mg/L
mg/L
Mg/L
mg/L
mg/L
mg/L
mg/L
mg/L
NTU
ICP
1C
ASF,ISE
ICP
ICP
ICP
AA, flame
ICP
ICP
1C
Gravimetric
Nephelometry
Fishman, 1993
Fishman and Fried- man, 1989
Fishman and Fried- man, 1989
Fishman, 1993
Fishman, 1993
Fishman, 1993
Fishman and Fried- man, 1989
Fishman, 1993
Fishman, 1993
Fishman and Fried- man, 1989
Fishman and Fried- man, 1989
Fishman and Fried- man, 1989
Nutrients and organic carbon
Nitrogen, ammonia, dis.
Nitrogen, ammonia +
00608F
00623D
.02
.1*
mg/L
mg/L
ASF, SH
ASF, MD
Fishman, 1993
Patton and Truitt, 1992Organic, dis
Nitrogen, ammonia + 00625D .1* Organic, wwr
Nitrogen, nitrite, dis 00613F .01
mg/L ASF, MD
mg/L ASF
unpublished
Fishman, 1993
47
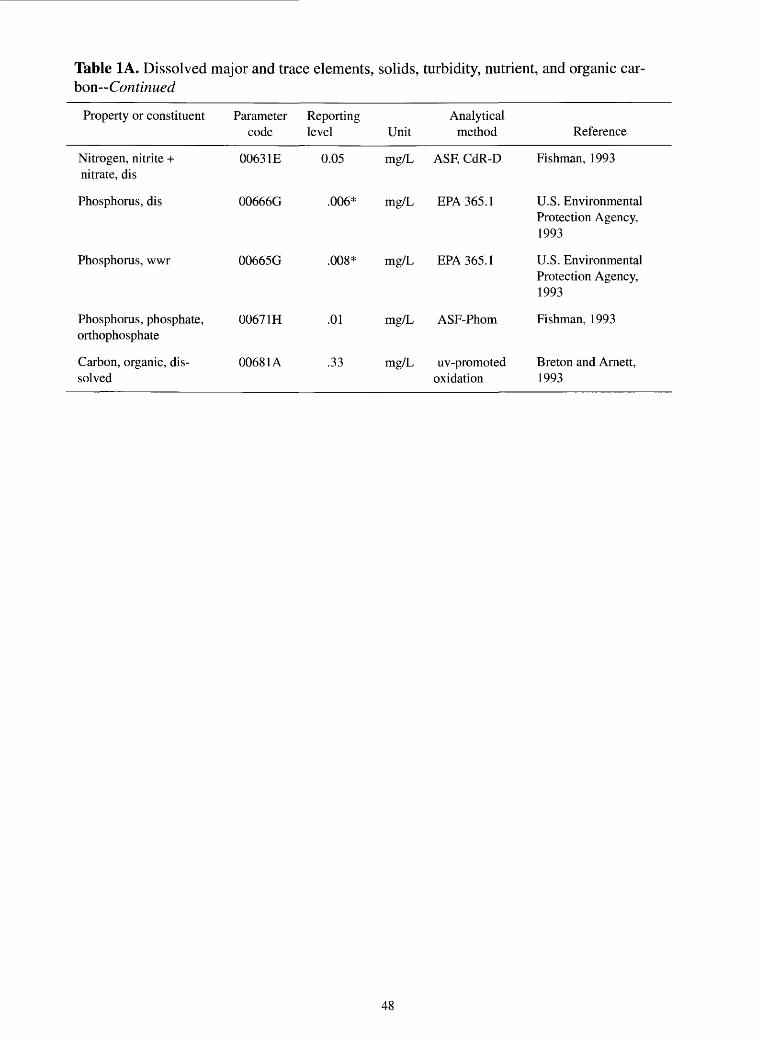
Table 1A. Dissolved major and trace elements, solids, turbidity, nutrient, and organic car bon Continued
Property or constituent Parameter Reporting Analytical code level Unit method Reference
Nitrogen, nitrite + nitrate, dis
Phosphorus, dis
Phosphorus, wwr
Carbon, organic, dis solved
0063 IE
00666G
00665G
Phosphorus, phosphate, 00671H orthophosphate
00681A
0.05 mg/L ASF, CdR-D Fishman, 1993
.006* mg/L EPA 365.1
.008* mg/L EPA 365.1
.01 mg/L ASF-Phom
.33 mg/L uv-promoted oxidation
U.S. Environmental Protection Agency, 1993
U.S. Environmental Protection Agency, 1993
Fishman, 1993
Breton and Arnett, 1993
48

Table IB. Whole-water recoverable major and trace elements
[*, laboratory reporting level; (ig/L, micrograms per liter; mg/L, milligrams per liter ]
Analytical method: ICP, inductively coupled plasma; GFAA, graphite furnace atomic absorption; AA, atomic absorption; MCV, manual cold vapor
Constituent
Aluminum
Antimony
Arsenic
Barium
Beryllium
Cadmium
Calcium
Chromium
Cobalt
Copper
Iron
Lead
Lithium
Magnesium
Manganese
Mercury
Molybdenum
Nickel
Potassium
Selenium
Silver
Sodium
Strontium
Zinc
Parameter code
01105D
01097C
01002E
01007C
01012C
01027F
009 16C
01034E
01037F
01042G
01045C
01051F
01132B
00927C
01055D
71900B
01062B
01067F
00937B
01147D
01077F
00929C
01082B
01092C
Reporting level
28*
1
2.6*
.9*
5*
.11*
.033*
1*
1.8*
20*
21*
1*
7*
.024*
2.8*
.3*
1
1.8*
.1
2.6*
1
.18*
.18*
31*
Unit
^g/L
[ig/L
[ig/L
[ig/L
[ig/L
[ig/L
mg/L
^g/L
[ig/L
[ig/L
[ig/L
[ig/L
[ig/L
mg/L
[ig/L
[ig/L
[ig/L
[ig/L
mg/L
[ig/L
[ig/L
mg/L
[ig/L
[ig/L
Analytical method
ICP
GFAA EPA 200.9
GFAA
ICP
ICP
GFAA
ICP
GFAA
GFAA
ICP
ICP
GFAA
ICP
ICP
ICP
AA,
MCV
GFAA
GFAA
AA, flame
GFAA
GFAA
ICP
ICP
ICP
Reference
Garbarino and Struzeski, 1998
U.S. Environmental Protection Agency, 1991
Jones and Gabarino, 1999
Garbarino and Struzeski, 1998
Garbarino and Struzeski, 1998
Fishman, 1993
Garbarino and Struzeski, 1998
McLain, 1993
Fishman, 1993
Garbarino and Struzeski, 1998
Garbarino and Struzeski, 1998
Fishman, 1993
Garbarino and Struzeski, 1998
Garbarino and Struzeski, 1998
Garbarino and Struzeski, 1998
Fishman and Friedman, 1989
Jones and McLain, 1997
Fishman, 1993
Fishman and Friedman, 1989
Jones and Gabarino, 1999
Fishman, 1993
Garbarino and Struzeski, 1998
Garbarino and Struzeski, 1998
Garbarino and Struzeski, 1998
49
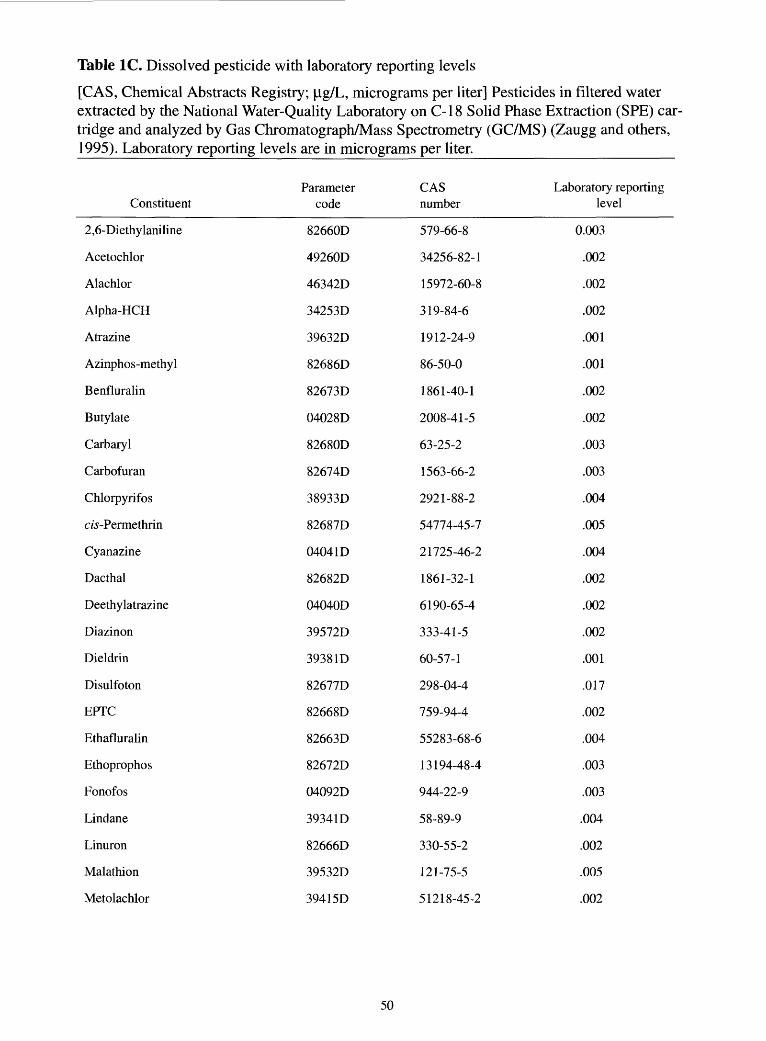
Table 1C. Dissolved pesticide with laboratory reporting levels
[CAS, Chemical Abstracts Registry; (ig/L, micrograms per liter] Pesticides in filtered water extracted by the National Water-Quality Laboratory on C-18 Solid Phase Extraction (SPE) car tridge and analyzed by Gas Chromatograph/Mass Spectrometry (GC/MS) (Zaugg and others, 1995). Laboratory reporting levels are in micrograms per liter.
Constituent
2,6-Diethylaniline
Acetochlor
Alachlor
Alpha-HCH
Atrazine
Azinphos-methyl
Benfluralin
Butylate
Carbaryl
Carbofuran
Chlorpyrifos
czs-Permethrin
Cyanazine
Dacthal
Deethylatrazine
Diazinon
Dieldrin
Disulfoton
EPTC
Ethafluralin
Ethoprophos
Fonofos
Lindane
Linuron
Malathion
Metolachlor
Parameter code
82660D
49260D
46342D
34253D
39632D
82686D
82673D
04028D
82680D
82674D
38933D
82687D
04041D
82682D
04040D
39572D
39381D
82677D
82668D
82663D
82672D
04092D
39341D
82666D
39532D
39415D
CAS number
579-66-8
34256-82-1
15972-60-8
319-84-6
1912-24-9
86-50-0
1861-40-1
2008-41-5
63-25-2
1563-66-2
2921-88-2
54774.45.7
21725-46-2
1861-32-1
6190-65-4
333-41-5
60-57-1
298-04-4
759-94-4
55283-68-6
13194-48-4
944-22-9
58-89-9
330-55-2
121-75-5
51218-45-2
Laboratory reporting level
0.003
.002
.002
.002
.001
.001
.002
.002
.003
.003
.004
.005
.004
.002
.002
.002
.001
.017
.002
.004
.003
.003
.004
.002
.005
.002
50

Table 1C. Dissolved pesticide with laboratory reporting levels Continued
Constituent
Metribuzin
Molinate
Napropamide
Parathion
Parathion-methyl
Pebulate
Pendimethalin
Phorate
p,p'-DDE
Prometon
Propachlor
Propanil
Propargite
Propyzamide
Simazine
Tebuthiuron
Terbacil
Terbufos
Terbuthylazine
Thiobencarb
Tri-allate
Trifluralin
Parameter code
82630D
8267 ID
82684D
39542D
82667D
82669D
82683D
82664D
34653D
04037D
04024D
82679D
82685D
82676D
04035D
82670D
82665D
82675D
04022D
8268 ID
82678D
82661D
CASnumber
21087-64-9
2212-67-1
15299-99-7
56-38-2
298-00-0
1114-71-2
40487-42-1
298-02-2
72-55-9
1610-18-0
1918-16-7
709-98-8
2312-35-8
23950-58-5
122-34-9
34014-18-1
5902-51-2
13071-79-9
5915-41-3
28249-77-6
2303-17-5
1582-09-8
Laboratory reporting level
0.004
.004
.003
.004
.006
.004
.004
.002
.006
.018
.007
.004
.013
.003
.005
.010
.007
.013
.100
.002
.001
.002
51

Appendix 2. - Tables listing bed-sediment data.
Table 2A. Bed-sediment data collected at White's Bridge.
Table 2B. Bed-sediment data collected at the M-20 Bridge.
52
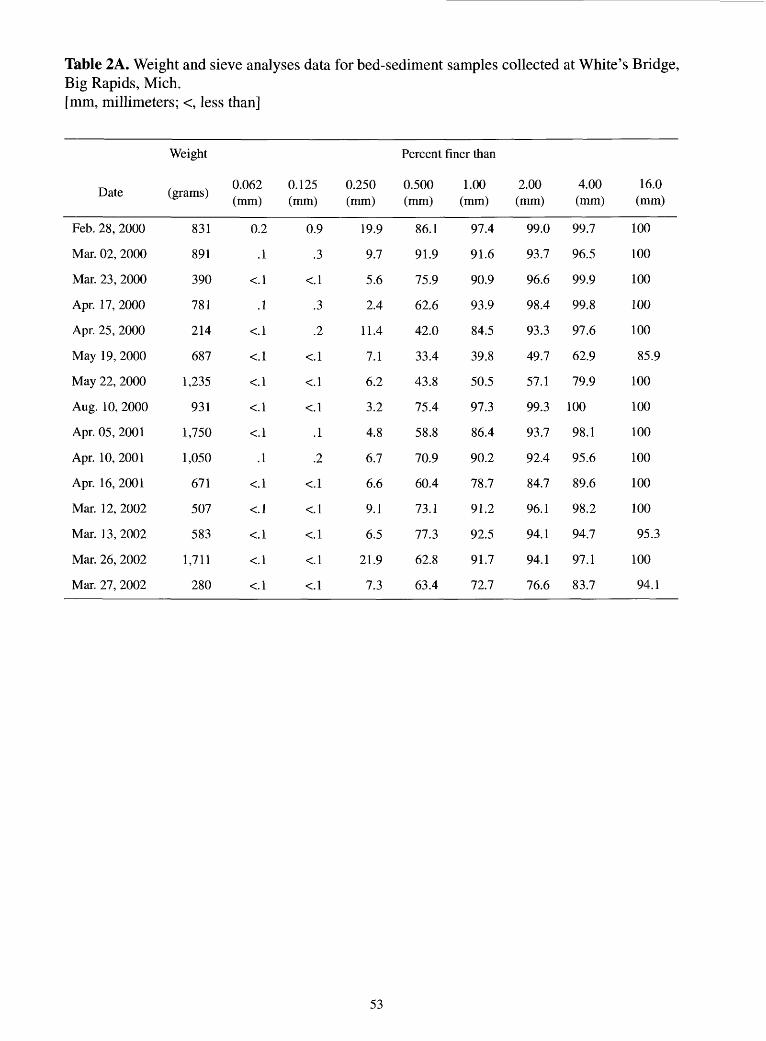
Table 2A. Weight and sieve analyses data for bed-sediment samples collected at White's Bridge,Big Rapids, Mich.[mm, millimeters; <, less than]
Date
Feb. 28, 2000
Mar. 02, 2000
Mar. 23, 2000
Apr. 17, 2000
Apr. 25, 2000
May 19, 2000
May 22, 2000
Aug. 10, 2000
Apr. 05, 2001
Apr. 10, 2001
Apr. 16, 2001
Mar. 12, 2002
Mar. 13, 2002
Mar. 26, 2002
Mar. 27, 2002
Weight
0.062 (grams) (mm)
831 0.2
891 .1
390 <.l
781 .1
214 <.l
687 <.l
1,235 <.l
931 <.l
1,750 <.l
1,050 .1
671 <.l
507 <.l
583 <.l
1,711 <.l
280 <.l
0.125 0.250 (mm) (mm)
0.9 19.9
.3 9.7
<.l 5.6
.3 2.4
.2 11.4
<.l 7.1
<.l 6.2
<.l 3.2
.1 4.8
.2 6.7
<.l 6.6
<.l 9.1
<.l 6.5
<.l 21.9
<.l 7.3
Percent finer than
0.500 1.00 (mm) (mm)
86.1
91.9
75.9
62.6
42.0
33.4
43.8
75.4
58.8
70.9
60.4
73.1
77.3
62.8
63.4
97.4
91.6
90.9
93.9
84.5
39.8
50.5
97.3
86.4
90.2
78.7
91.2
92.5
91.7
72.7
2.00 (mm)
99.0
93.7
96.6
98.4
93.3
49.7
57.1
99.3
93.7
92.4
84.7
96.1
94.1
94.1
76.6
4.00 (mm)
99.7
96.5
99.9
99.8
97.6
62.9
79.9
100
98.1
95.6
89.6
98.2
94.7
97.1
83.7
16.0 (mm)
100
100
100
100
100
85.9
100
100
100
100
100
100
95.3
100
94.1
53

Table 2B. Weight and sieve analyses for bed-sediment samples collected at M-20 Bridge, BigRapids, Mich.[mm, millimeters; <, less than]
Date
Feb. 29,
Mar. 03,
Mar. 22,
Apr. 17,
Apr. 25,
May 23,
Aug. 08,
Nov. 15,
Mar. 23,
Apr. 05,
Apr. 10.
Apr. 16,
May 17,
Mar. 13,
Mar. 26,
Mar. 27,
2000
2000
2000
2000
2000
2000
,2000
2000
2001
2001
2001
2001
2001
2002
2002
2002
Weight
0.062 (grams) (mm)
596 0.1
495 .1
32.1 <.l
15.0 .1
158 .2
1,650 <.l
137 <.l
38.8 <.l
1,320 .1
667 <.l
3,330 <.l
4,760 <.l
2,320 <.l
828 <.l
220 <.l
726 <.l
0.125 (mm)
0.3
.2
.1
.3
.4
<.l
.4
.3
.3
.1
.1
<1
.1
<.l
<.l
<.l
0.250 (mm)
8.2
5.4
12.6
3.7
5.8
4.1
12.1
23.0
9.7
7.3
5.0
2.9
4.3
2.5
8.0
1.7
Percent finer than
0.500 1.00 (mm) (mm)
93.2
74.5
84.8
54.0
86.4
69.8
47.2
46.0
93.9
87.0
66.3
44.4
62.2
50.7
74.8
71.7
99.
91.
95.
94.
100
91.
64,
98.
.3
.1
,3
.7
,6
,5
,8
98.7
97.
88.
77.
86.
87.
87.
99.
.8
,0
,6
.1
.3
.9
.6
2.00 (mm)
100
95.3
100
97.9
100
95.8
71.3
100
99.3
99.0
90.3
85.5
90.4
92.1
91.7
99.8
4.00 (mm)
100
97.
100
99.
100
97.
87.
100
99.
99,
,8
.2
,6
.1
,6
.6
94.4
91.
94,
95.
95.
100
.8
,1
,5
.3
16.0 mm
100
100
100
100
100
99.7
100
100
100
100
99.5
99.7
99.6
100
100
100
54