Embed Size (px)
Citation preview

Federal Aviation Administration
EUROCONTROL
US/Europe comparison of ATM-related operational performance
Joint study between FAA and PRU
September 21, 2011
Hartmut Koelman (Eurocontrol-PRU)
Dave Knorr (FAA-ATO)

2 Federal Aviation Administration
EUROCONTROL
FAA-DFS comparison draft Nov20-
08
Objective & Scope
OBJECTIVES
• to provide a high-level comparison of operational performance between the US and Europe Air Navigation systems.
• Initial focus on the development of a set of comparable performance indicators for high level comparisons between countries and world regions.
SCOPE
• Predictability and Efficiency of operations
• Link to “Environment” when evaluating additional fuel burn.
• Continental US airspace (Oceanic and Alaska excluded)
• EUROCONTROL States (excluding oceanic areas and the Canary Islands)
• Focus on data subset (traffic from/to top 34 airports) due to better data quality (OEP airports) and comparability (general aviation).
• Commercial IFR flights
NOT in SCOPE
• Safety, Cost effectiveness, Capacity
• Trade-offs and other performance
affecting factors (weather, etc.)

3 Federal Aviation Administration
EUROCONTROL
FAA-DFS comparison draft Nov20-
08
Key characteristics of the two systems
[1] Eurocontrol States plus the Estonia and Latvia, but excluding oceanic areas and Canary Islands.
[2] Area, flight hours and center count refers to CONUS only. The term US CONUS refers to the 48 contiguous States located on the North American continent south of the border with
Canada, plus the District of Columbia, excluding Alaska, Hawaii and oceanic areas.
[3] Total of 503 facilities of which 263 are FAA staffed and 240 contract towers.
Calendar Year 2008 Europe[1] USA[2] Difference
Geographic Area (million km2) 11.5 10.4 -10%
Number of en-route Air Navigation Service Providers 38 1
Number of Air Traffic Controllers (ATCOs in OPS) 16 800 14 000 -17%
Total staff 56 000 35 000 -40%
Controlled flights (IFR) (million) 10 17 +70%
Share of General Air Traffic 4% 23% x5.5
Flight hours controlled (million) 14 25 +80%
Average length of flight (within region) 541 NM 497 NM -8%
Nr. of en-route centers 65 20 - 70%
En-route sectors at maximum configuration 679 955 +40%
Nr. of airports with ATC services 450 263 [3] -38%
Of which are slot controlled > 73 3
Source Eurocontrol FAA/ATO

4 Federal Aviation Administration
EUROCONTROL
FAA-DFS comparison draft Nov20-
08
Airspace Density Comparison (CONUS & European Centers)
Density (flight Hr per Sq.Km)
< 1
< 2
< 3
< 4
< 5
>= 5
*Note due to Mercator projection, northern areas appear larger
• Actual sizes are comparable (USA 10.4 vs Europe 11.5 M km2)
• Relative density (flight hours per km2) is 1.2 in Europe and 2.4 in US

5 Federal Aviation Administration
EUROCONTROL
FAA-DFS comparison draft Nov20-
08
Some facts about the main airports in the US and in Europe
Main 34 airports in 2008 Europe US Difference US
vs. Europe
Average number of annual movements per airport (‘000) 265 421 +59%
Average number of annual passengers per airport (million) 25 32 +29%
Passengers per movement 94 76 -19%
Average number of runways per airport 2.5 4.0 +61%
Annual movements per runway (‘000) 106 107 +1%
Annual passengers per runway (million) 10.0 8.1 -19%
• Traffic to/from the main 34 airports represents some 68% of all IFR flights in Europe
and 64% in the US.
• The share of general aviation to/from the main 34 airports is more comparable with
4% in the US and 1.6% in Europe.
• Average number of runways (+61%) and the number of movements (+59%) are
significantly higher in the US;
• Number of passengers per movement in the US (-19%) are much lower than in
Europe.

6 Federal Aviation Administration
EUROCONTROL
FAA-DFS comparison draft Nov20-
08
Air traffic growth in the US and in Europe (IFR flights)
• After 2004, number of controlled flights did not increase in the US, and increased approximately +25% in Europe (~4% p.a.).
• Average values mask contrasted growth rates within the US and Europe
50
60
70
80
90
100
110
120
130
19
99
20
00
20
01
20
02
20
03
20
04
20
05
20
06
20
07
20
08
Ind
ex (
19
99
=1
00
)
US
Europe
Source: EUROCONTROL/ FAA

7 Federal Aviation Administration
EUROCONTROL
FAA-DFS comparison draft Nov20-
08
Average seats per scheduled flight in the US and in Europe
• Average seat size per scheduled flight differs in the two systems with
Europe having a higher percentage of flights using “Large” aircraft than
the US.
90
95
100
105
110
115
120
20
00
20
01
20
02
20
03
20
04
20
05
20
06
20
07
20
08
av
g. s
ea
ts p
er
flig
ht
Scheduled services (Main 34 airports)
Scheduled services (all)
90
95
100
105
110
115
120
20
00
20
01
20
02
20
03
20
04
20
05
20
06
20
07
20
08
Scheduled services (OEP 34 airports)
Scheduled services (all)
IINTRA-European Flights US DOMESTIC Flights (CONUS)
Source: FAA/ PRC analysis

8 Federal Aviation Administration
EUROCONTROL
FAA-DFS comparison draft Nov20-
08
70%
72%
74%
76%
78%
80%
82%
84%
86%
88%
90%2
00
2
20
03
20
04
20
05
20
06
20
07
20
08
Departures (<=15min.) Arrivals (<=15min.)
70%
72%
74%
76%
78%
80%
82%
84%
86%
88%
90%
20
02
20
03
20
04
20
05
20
06
20
07
20
08
On-time performance compared to schedule
(flights to/from the 34 main airports)
Europe US
Source: E-CODA Source: ASQP data
On-time performance in the US and in Europe
Similar pattern in US and Europe with a comparable level of arrival on time performance;
The gap between departure and arrival punctuality is significant in the US and quasi nil in Europe suggesting differences in flow management strategies
Punctuality –
Arrivals/ departures
delayed by less than
15 minutes versus
schedule

9 Federal Aviation Administration
EUROCONTROL
FAA-DFS comparison draft Nov20-
08
Airline Scheduling: Evolution of block times
Europe: Block times remain relatively stable (left side)
US: In addition to decreasing on time performance (previous slide), there is a clear
increase in scheduled block times (right side)
Seasonal effects are visible in the US and in Europe (due to wind)
Scheduled block
times compared
to the long term
average at city
pair level.
-2
-1
0
1
2
3
4
Ja
n-0
0
Ja
n-0
1
Ja
n-0
2
Ja
n-0
3
Ja
n-0
4
Ja
n-0
5
Ja
n-0
6
Ja
n-0
7
Ja
n-0
8
min
ute
s
-2
-1
0
1
2
3
4
Ja
n-0
0
Ja
n-0
1
Ja
n-0
2
Ja
n-0
3
Ja
n-0
4
Ja
n-0
5
Ja
n-0
6
Ja
n-0
7
Ja
n-0
8
Europe US (conus)
Source: FAA/PRU
Evolution of Scheduled Block Times
(flights to/from 34 main airports)

10 Federal Aviation Administration
EUROCONTROL
FAA-DFS comparison draft Nov20-
08
Comparison of operational performance by phase of flight
Consistent measures being established in the US and Europe
100 n
m
40 n
m
Feb 15th 2008
0h01-23h59
GATE-to-GATEDEPARTURE
ANS-relatedHolding at the
Gate (ATFM/
EDCT)
Taxi-outefficiency
En-route
Flight
efficiency
IFR flights
To/from
Main 34
airports
Efficiency
In last
100NM
Taxi-inefficiency
IFR flights
To/from
Main 34
airports

11 Federal Aviation Administration
EUROCONTROL
FAA-DFS comparison draft Nov20-
08
Efficiency: ANS-related departure delays
• ATFM/EDCT delays are delays taken on the ground
at the departure airports (mostly at the gate)
• Both systems use ground delays programs to
manage traffic but to a various extent
– Mainly used in US in case of severe capacity constraints at the
arrival airports
– Extensively used in Europe to manage both En-route and
airport capacity limitation
GATE-to-GATEDEPARTURE
ANS-related
Holding at the
Gate (ATFM/EDCT)
Taxi-out
efficiency
En-route
Flight
efficiency
Efficiency
In last
100NM

12 Federal Aviation Administration
EUROCONTROL
FAA-DFS comparison draft Nov20-
08
Efficiency: ANS-related departure delays
2008 En-route related delays >15
min. (EDCT/ATFM)
Airport related delays >15 min.
(EDCT/ATFM)
IFR
fligh
ts
(M)
% o
f fligh
ts
dela
yed>
15
min
.
dela
y per
fligh
t (min
.)
dela
y per
dela
yed flig
ht
(min
.)
% o
f fligh
ts
dela
yed>
15
min
.
dela
y per
fligh
t (min
.)
dela
y per
dela
yed flig
ht
(min
.)
US 9.2 0.1% 0.1 57 2.6% 1.8 70
Europe 5.6 5.0% 1.4 28 3.0% 0.9 32
US: En-route delays are much lower per flight, but the delay per delayed flight is
significantly higher;
Europe: Higher share of flights affected (than US) but with a lower average delay.
In the US, ground delays (EDCT) are used when other options such as MIT are not
sufficient, whereas, in Europe ground delays (ATFM) are the main ATM tool for
balancing demand with capacity
GATE-to-GATEDEPARTURE
ANS-related
Holding at the
Gate (ATFM/EDCT)
Taxi-out
efficiency
En-route
Flight
efficiency
Efficiency
In last
100NM

13 Federal Aviation Administration
EUROCONTROL
FAA-DFS comparison draft Nov20-
08
Additional time in the taxi out phase GATE-to-GATEDEPARTURE
ANS-related
Holding at the
Gate (ATFM/EDCT)
Taxi-out
efficiency
En-route
Flight
efficiency
Efficiency
In last
100NM
• Measured as the time from off-block to take-off in excess of
an unimpeded time.
– Unimpeded time is representative
of the time needed to complete
an operation in period of low traffic
– Unimpeded time may not be a realistic
reference in period of high traffic
• Additional time in the taxi-out phase may be due to runway
capacity constraints or results from local en-route departure
and miles in trails restriction

14 Federal Aviation Administration
EUROCONTROL
FAA-DFS comparison draft Nov20-
08
Additional time in the taxi out phase
Additional times in the taxi out phase are higher in the US (6.2 min.) than in Europe
(4.3 min.)
For the US, excess times also include delays due to local en-route departure and
miles in trail restrictions. .
GATE-to-GATEDEPARTURE
ANS-related
Holding at the
Gate (ATFM/EDCT)
Taxi-out
efficiency
En-route
Flight
efficiency
Efficiency
In last
100NM
0
5
10
15
20
London
(LH
R)
Rom
e
(FC
O)
London
(LG
W)
Paris (
CD
G)
Dublin
(DU
B)
Barc
elo
na
(BC
N)
Ista
nbul
(IS
T)
Am
ste
rdam
(AM
S)
Munic
h
(MU
C)
Madrid
(MA
D)
Dusseld
orf
(DU
S)
Mila
n (
MX
P)
Zurich
(ZR
H)
London
(ST
N)
Mancheste
r
(MA
N)
Copenhagen
(CP
H)
Stu
ttgart
(ST
R)
Vie
nna
(VIE
)
Geneva
(GV
A)
Wars
aw
(WA
W)
min
ute
s p
er
de
pa
rtu
reEurope main 34 average (4.3 min.)
0
5
10
15
20
New
ark
(EW
R)
New
York
(JF
K)
New
York
(LG
A)
Atlanta
(AT
L)
Phila
delp
hia
(PH
L)
Charlotte
(CLT
)
Chic
ago
(OR
D)
Detr
oit
(DT
W)
Bosto
n
(BO
S)
Las V
egas
(LA
S)
Salt L
ake
City (
SLC
)
Phoenix
(PH
X)
Min
neapolis
(MS
P)
Washin
gto
n
(DC
A)
Washin
gto
n
(IA
D)
Mem
phis
(ME
M)
Cin
cin
nati
(CV
G)
Ft.
Lauderd
ale
Housto
n
(IA
H)
Denver
(DE
N)
US OEP 34 average (6.2 min.)
Source: FAA/ PRC analysis/ CODA/ CFMU
Average additional time in the taxi out phase(Only the first 20 airports are shown)

15 Federal Aviation Administration
EUROCONTROL
FAA-DFS comparison draft Nov20-
08
En-route flight Efficiency: Approach
40 NM
Airport A
Airport B
GD
A En-route
extension
Actual route
(A)
Great Circle
(G)
Direct Course
(D)
Direct route
extension
TMA interface
• Indicator is the difference between the length of the actual trajectory (A) and the
Great Circle Distance (G) between the departure and arrival terminal areas.
• Direct route extension is measured as the difference between the actual route (A)
and the direct course between the TMA entry points (D).
• This difference is an ideal (and unachievable) situation where each aircraft would
be alone in the sky and not subject to any constraints (i.e. safety, capacity).
•Focus on
horizontal flight
efficiency
•Distance based
approach
GATE-to-GATEDEPARTURE
ANS-related
Holding at the
Gate (ATFM/EDCT)
Taxi-out
efficiency
En-route
Flight
efficiency
Efficiency
In last
100NM
16 Federal Aviation Administration
EUROCONTROL
FAA-DFS comparison draft Nov20-
08
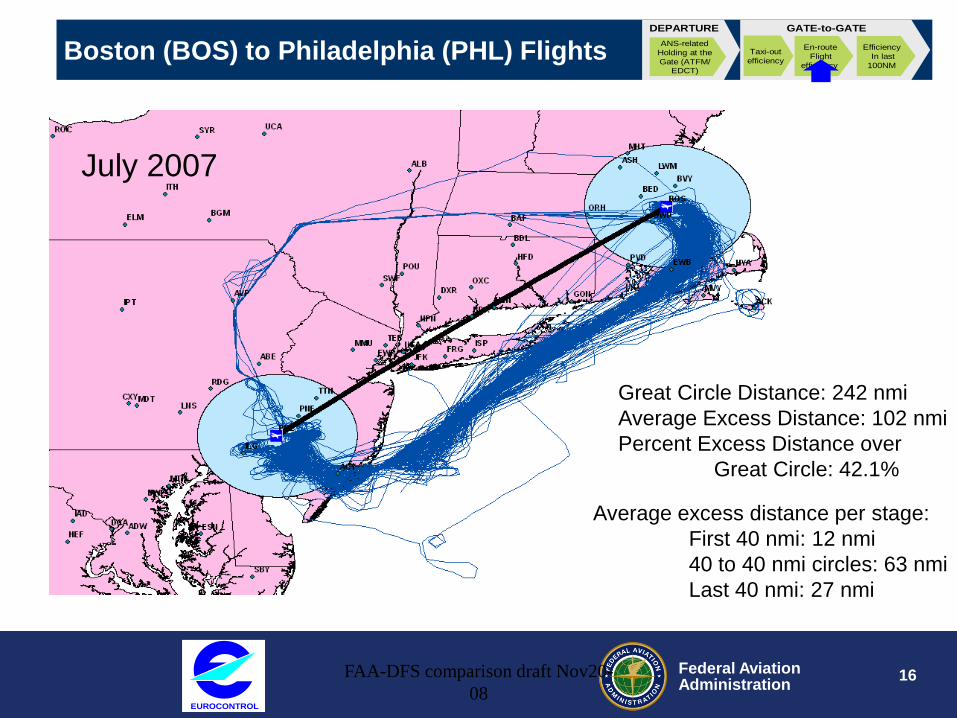
Boston (BOS) to Philadelphia (PHL) Flights
Great Circle Distance: 242 nmi
Average Excess Distance: 102 nmi
Percent Excess Distance over
Great Circle: 42.1%
Average excess distance per stage:
First 40 nmi: 12 nmi
40 to 40 nmi circles: 63 nmi
Last 40 nmi: 27 nmi
GATE-to-GATEDEPARTURE
ANS-related
Holding at the
Gate (ATFM/EDCT)
Taxi-out
efficiency
En-route
Flight
efficiency
Efficiency
In last
100NM
July 2007

17 Federal Aviation Administration
EUROCONTROL
FAA-DFS comparison draft Nov20-
08
IAD to FLL
Number of Flights 1488
Direct Flight Indicator Total (A-G) 41.9
Direct Between TMA (A-D) 20.3
TMA Interface (G-D) 21.5

18 Federal Aviation Administration
EUROCONTROL
FAA-DFS comparison draft Nov20-
08
Sample „Inefficient“ DFS Routes

19 Federal Aviation Administration
EUROCONTROL
FAA-DFS comparison draft Nov20-
08
Efficiency: Additional time in the last 100NM
100 n
m
40 n
m
Feb 15th 2008
0h01-23h59
• Capture tactical arrival control measures (sequencing, flow integration, speed
control, spacing, stretching, etc.), irrespective of local strategies.
• Standard “Arrival Sequencing and Metering Area” (ASMA) is defined as two
consecutive rings with a radius of 40NM and 100NM around each airport.
• In Europe delay absorption at departure airport or around the arrival airport while in
the US sequencing can span back to the departure airports (MIT)
GATE-to-GATEDEPARTURE
ANS-related
Holding at the
Gate (ATFM/EDCT)
Taxi-out
efficiency
En-route
Flight
efficiency
Efficiency
In last
100NM
• At Frankfurt as much as
an extra 15 minutes can
be absorbed inside the
Terminal Airspace
• Long Final alternative to
holding stacks like in
Heathrow

20 Federal Aviation Administration
EUROCONTROL
FAA-DFS comparison draft Nov20-
08
Efficiency: Excess time in the last 100NM
• Time based measure
• Captures type of A/C
• ARC Entry point and
runway configuration
• Nominal derived from
20th percentile
• Excess – time above
nominal for each
category
100 nmi
40 nmi
x
Arrival
Airport
Arrival Fix
Actual Route
Notional Optimal
Route
2.5%

21 Federal Aviation Administration
EUROCONTROL
FAA-DFS comparison draft Nov20-
08
Flight efficiency: Direct Route Extension
• Direct route extension is approximately 1% lower in the US
• US: Miles in trail restrictions are passed back from constrained airports
• Europe: Fragmentation of airspace, location of shared civil/military
airspace
GATE-to-GATEDEPARTURE
ANS-related
Holding at the
Gate (ATFM/EDCT)
Taxi-out
efficiency
En-route
Flight
efficiency
Efficiency
In last
100NM
0%
2%
4%
6%
8%
10%
12%
EUR US EUR US EUR US EUR US EUR US EUR US
0-199 NM 200-399 NM 400-599 NM 600-799 NM 800-999 NM >1000 NM
En
-ro
ute
exte
nsio
n (
%)
TMA interface (D-G)/G
Direct route extension (A-D)/G
0%
10%
20%
30%
40%
% o
f fl
igh
ts
En-route extension flights to/from the main 34 airports (2008)
Great circle distance between 40 NM circles (D40-A40)
EUR US
TOTAL

22 Federal Aviation Administration
EUROCONTROL
FAA-DFS comparison draft Nov20-
08
Additional time within the last 100NM
Average additional time is similar in Europe (2.8 min.) and the US (2.9 min.)
Mainly driven by London Heathrow (LHR) which is clearly an outlier
Performance at LHR is consistent with the 10 minute average delay criteria agreed
by the airport scheduling committee.
GATE-to-GATEDEPARTURE
ANS-related
Holding at the
Gate (ATFM/EDCT)
Taxi-out
efficiency
En-route
Flight
efficiency
Efficiency
In last
100NM
0
2
4
6
8
10
London
(LH
R)
Fra
nkfu
rt
(FR
A)
Ath
ens
(AT
H)
Vie
nna
(VIE
)
Madrid
(MA
D)
Munic
h
(MU
C)
London
(LG
W)
Zurich
(ZR
H)
Geneva
(GV
A)
Nic
e (
NC
E)
Rom
e
(FC
O)
Dusseld
orf
(DU
S)
Dublin
(DU
B)
Ham
burg
(HA
M)
Barc
elo
na
(BC
N)
Mancheste
r
(MA
N)
Mila
n
(MX
P)
Paris
(OR
Y)
London
(ST
N)
Oslo
(O
SL)
min
ute
s p
er
arr
iva
l
Average additional time within the last 100NM miles(only the first 20 airports in 2008 are shown)
Europe main 34 average (2.8 min.)
0
2
4
6
8
10
Phila
delp
hia
(PH
L)
New
York
(JF
K)
New
York
(LG
A)
New
ark
(EW
R)
Charlotte
(CLT
)
Atlanta
(AT
L)
Mem
phis
(ME
M)
Bosto
n
(BO
S)
Chic
ago
(OR
D)
Washin
gto
n
(IA
D)
Baltim
ore
(BW
I)
Min
neapolis
(MS
P)
Chic
ago
(MD
W)
San
Fra
ncis
co
Tam
pa
(TP
A)
Orlando
(MC
O)
Washin
gto
n
(DC
A)
Denver
(DE
N)
Seattle
(SE
A)
Phoenix
(PH
X)
min
ute
s p
er
arr
iva
l
US OEP 34 average (2.9 min.)
Source: FAA/ PRC analysis

23 Federal Aviation Administration
EUROCONTROL
FAA-DFS comparison draft Nov20-
08
Continuous Descent Arrival
CDA is an arrival procedure designed to eliminate
level segments flown below cruise altitude, thus
minimizing fuel burn, emissions and noise.
In a CDA, these level segments
would be flown at cruise altitude
Continuous Descent
Arrival
Standard Arrival

24 Federal Aviation Administration
EUROCONTROL
FAA-DFS comparison draft Nov20-
08
What ATM can do ?
ATM can help improving performance by :
• Maximizing throughput so as to minimize total delay
– Making the best use of capacity available
– Optimizing Departure/landing sequences
• Minimizing the impact of delay
– Priority between flights
– Minimizing fuel impact by managing the Phase of Flight where necessary delay is applied
• But be careful
– Delaying aircraft on the ground (engine off) is not always more fuel efficient than airborne delays !
– Continuous descent approach can burn more fuel than interrupted Descent
25 Federal Aviation Administration
EUROCONTROL
FAA-DFS comparison draft Nov20-
08
Conclusions
• High value in global comparisons and benchmarking in order to optimise performance and identify best practice;
• Arrival punctuality is similar in the US and in Europe, albeit with a higher level of variability in the US.
• The estimated inefficiency pool actionable by ANS and associated fuel burn appear to be similar in the US and Europe (estimated to be between 6-8% of the total fuel burn) but with notable differences in the distribution by phase of flight.
• Inefficiencies have a different impact (fuel burn, time) on airspace users,
depending on the phase of flight (airborne vs. ground) and the level of
predictability (strategic vs. tactical). Further work is needed to assess the
impact of efficiency and predictability on airspace users, the utilisation of
capacity, and the environment.
• A more comprehensive comparison of service performance would also need to address Safety, Capacity and other performance affecting factors such as weather and governance.