Embed Size (px)
Citation preview

Bathymetry of Walker Lake, West-Central Nevada
Scientific Investigations Report 2007–5012
Prepared in cooperation with the Bureau of Reclamation
U.S. Department of the InteriorU.S. Geological Survey

Cover: Photograph of Walker Lake looking south toward the town of Walker Lake and Mount Grant, Nevada. (Photograph taken by Thomas Lopes, U.S. Geological Survey, February 28, 2005.)

Bathymetry of Walker Lake, West-Central Nevada
By Thomas J. Lopes and J. LaRue Smith
Prepared in cooperation with the Bureau of Reclamation
Scientific Investigations Report 2007–5012
U.S. Department of the InteriorU.S. Geological Survey

U.S. Department of the InteriorDIRK KEMPTHORNE, Secretary
U.S. Geological SurveyMark D. Myers, Director
U.S. Geological Survey, Reston, Virginia: 2007
For product and ordering information: World Wide Web: http://www.usgs.gov/pubprod Telephone: 1-888-ASK-USGS
For more information on the USGS--the Federal source for science about the Earth, its natural and living resources, natural hazards, and the environment: World Wide Web: http://www.usgs.gov Telephone: 1-888-ASK-USGS
Any use of trade, product, or firm names is for descriptive purposes only and does not imply endorsement by the U.S. Government.
Although this report is in the public domain, permission must be secured from the individual copyright owners to reproduce any copyrighted materials contained within this report.
Suggested citation:Lopes, T.J., and Smith, J.L., 2007, Bathymetry of Walker Lake, West-Central Nevada: U.S. Geological Survey Scientific Investigations Report 2007-5012, 26 p.

iii
Contents
Abstract ...........................................................................................................................................................1Introduction.....................................................................................................................................................1
Purpose and Scope ..............................................................................................................................3Description of Walker River Basin .....................................................................................................3
Methods...........................................................................................................................................................4Data Collection ......................................................................................................................................4
Bathymetry ....................................................................................................................................4Lidar ...........................................................................................................................................6High Resolution Imagery ............................................................................................................6Side-Scan Sonar ..........................................................................................................................6
Data Processing ....................................................................................................................................7Bathymetry ....................................................................................................................................7Lidar ...........................................................................................................................................7Merging of Data Sets ..................................................................................................................9Calculation of Surface Area and Storage Volume .................................................................9
Bathymetry of Walker Lake ........................................................................................................................10Description of Walker Lake ...............................................................................................................10Comparison to Bathymetry by Rush ................................................................................................19Estimation of 1882 Lake-Surface Altitude .......................................................................................20
Summary........................................................................................................................................................20References Cited..........................................................................................................................................21Appendix A. Lake-Surface Altitude, Surface Area, and Storage Volume of Walker Lake,
Nevada .............................................................................................................................................23Appendix B. Locations and Heights of Mounds and Anomalies Detected in Walker Lake,
Nevada .............................................................................................................................................25

iv
Figures Figure 1. Map showing selected features of the Walker River basin, California and
Nevada …………………………………………………………………………… 2 Figure 2. Map showing dissolved-solids concentration and lake-surface altitude
versus time for Walker Lake, Nevada …………………………………………… 3 Figure 3. Map showing locations of survey transects, side-scan sonar survey, and the
4,120-foot contour which is the extent of surface-area and storage-volume calculations for Walker Lake, Nevada …………………………………………… 5
Figure 4. Screen captures showing example of survey transect (A) before removal of outliers and (B) after removal of outliers and averaging depth every 328 feet, Walker Lake, Nevada …………………………………………………………… 8
Figure 5. Graphs showing errors in (A) surface-area and (B) storage-volume estimates versus lake-surface altitude of Walker Lake, Nevada …………………………… 10
Figure 6. Graphs showing bathymetry along transects at select locations in Walker Lake, Nevada ……………………………………………………………………… 11
Figure 7. Graphs showing example of anomalies detected by the single-beam echosounder ……………………………………………………………………… 16
Figure 8. Photograph showing tufa towers along the shore of Mono Lake, California ……… 16 Figure 9. Side-scan sonar image of lake bottom along the cliffs north of the town of
Walker Lake, Nevada …………………………………………………………… 17 Figure 10. Map showing locations and estimated heights of mounds, anomalies, and
faults in and around Walker Lake, Nevada ……………………………………… 18 Figure 11. Map showing lake-surface altitude versus surface area and storage volume
for Walker Lake, Nevada ………………………………………………………… 19
Plate [in pocket] Plate 1. Bathymetric Map of Walker Lake, Nevada.
v
Conversion Factors, Datums, and Acronyms
Conversion Factors
Multiply By To obtain
Lengthfoot (ft) 0.3048 meter (m)
mile (mi) 1.609 kilometer (km)
Areaacre 4,047 square meter (m2)acre 0.4047 hectare (ha)square foot (ft2) 929.0 square centimeter (cm2)square mile (mi2) 259.0 hectare (ha)square mile (mi2) 2.590 square kilometer (km2)
Volumeacre-foot (acre-ft) 1,233 cubic meter (m3)
Flow rateacre-foot per year (acre-ft/yr) 1,233 cubic meter per year (m3/yr)cubic foot per second (ft3/s) 0.02832 cubic meter per second (m3/s)foot per year (ft/yr) 0.3048 meter per year (m/yr)mile per hour (mi/h) 1.609 kilometer per hour (km/h)
Temperature in degrees Celsius (°C) may be converted to degrees Fahrenheit (°F) as follows:
°F=(1.8×°C)+32.
Temperature in degrees Fahrenheit (°F) may be converted to degrees Celsius (°C) as follows:
°C=(°F-32)/1.8.
Concentrations of chemical constituents in water are given in milligrams per liter (mg/L).
Datums
Vertical coordinate information is referenced to the National Geodedic Vertical Datum of 1929 (NGVD 29).
Horizontal coordinate information is referenced to the North American Datum of 1983 (NAD 83).
Altitude, as used in this report, refers to distance above the vertical datum.
Acronyms
Acronym MeaningALPS Airborne Lidar Processing SystemDEM Digital Elevation ModelDGPS Differential Global Positioning SystemEARRL Experimental Advanced Airborne Research LidarLidar Light Detection and RangingNASA National Aeronauatics and Space AdministrationUSGS U.S. Geological SurveyUTM universal transverse mercator

vi
This page is intentionally left blank.

AbstractWalker Lake lies within a topographically closed basin in
west-central Nevada and is the terminus of the Walker River. Much of the streamflow in the Walker River is diverted for irrigation, which has contributed to a decline in lake-surface altitude of about 150 feet and an increase in dissolved solids from 2,500 to 16,000 milligrams per liter in Walker Lake since 1882. The increase in salinity threatens the fresh-water ecosystem and survival of the Lahontan cutthroat trout, a species listed as threatened under the Endangered Species Act. Accurately determining the bathymetry and relations between lake-surface altitude, surface area, and storage volume are part of a study to improve the water budget for Walker Lake. This report describes the updated bathymetry of Walker Lake, a comparison of results from this study and a study by Rush in 1970, and an estimate of the 1882 lake-surface altitude.
Bathymetry was measured using a single-beam echosounder coupled to a differentially-corrected global positioning system. Lake depth was subtracted from the lake-surface altitude to calculate the altitude of the lake bottom. A Lidar (light detection and ranging) survey and high resolution aerial imagery were used to create digital elevation models around Walker Lake. The altitude of the lake bottom and digital elevation models were merged together to create a single map showing land-surface altitude contours delineating areas that are currently or that were submerged by Walker Lake. Surface area and storage volume for lake-surface altitudes of 3,851.5–4,120 feet were calculated with 3-D surface-analysis software.
Walker Lake is oval shaped with a north-south trending long axis. On June 28, 2005, the lake-surface altitude was 3,935.6 feet, maximum depth was 86.3 feet, and the surface area was 32,190 acres. The minimum altitude of the lake bottom from discrete point depths is 3,849.3 feet near the center of Walker Lake. The lake bottom is remarkably smooth except for mounds near the shore and river mouth that could be boulders, tree stumps, logs, or other submerged objects.
The echosounder detected what appeared to be mounds in the deepest parts of Walker Lake, miles from the shore and river mouth. However, side-scan sonar and divers did not confirm the presence of mounds. Anomalies occur in two northwest trending groups in northern and southern Walker Lake. It is hypothesized that some anomalies indicate spring
discharge along faults based on tufa-like rocks that were observed and the northwest trend parallel to and in proximity of mapped faults. Also, evaporation measured from Walker Lake is about 50 percent more than the previous estimate, indicating more water is flowing into the lake from sources other than the Walker River. Additional studies need to be done to determine what the anomalies are and whether they are related to the hydrology of Walker Lake.
Most differences in surface area and storage volume between this study and a study by Rush in 1970 were less than 1 percent. The largest differences occur at lake-surface altitudes less than 3,916 feet. In general, relations between lake-surface altitude, surface area, and storage volume from Rush’s study and this study are nearly identical throughout most of the range in lake-surface altitude.
The lake-surface altitude in 1882 was estimated to be between 4,080 feet and 4,086 feet with a probable altitude of 4,082 feet. This estimate compares well with two previous estimates of 4,083 feet and 4,086 feet. Researchers believe the historic highstand of Walker Lake occurred in 1868 and estimated the highstand was between 4,089 feet and 4,108 feet. By 1882, Mason Valley was predominantly agricultural. The 7–26 feet decline in lake-surface altitude between 1868 and 1882 could partially be due to irrigation diversions during this time.
IntroductionWalker Lake lies within a topographically closed basin
in west-central Nevada and is the terminus of the Walker River (fig. 1). Walker River is the main source of inflow, but small tributaries from adjacent mountains and subsurface flow also discharge to Walker Lake (Thomas, 1995). The only outflow from Walker Lake occurs by evaporation from the lake surface. Since the latter half of the 1800s, much of the streamflow in the Walker River has been diverted for irrigation (Russell, 1885). Since 1882 diversions have reduced flow into Walker Lake which contributed to a decline in lake-surface altitude of about 150 ft and an increase in dissolved solids from 2,500 to 16,000 mg/L since 1882 (fig. 2). The increase in salinity threatens the fresh-water ecosystem and survival of the Lahontan cutthroat trout, a species listed as threatened under the Endangered Species Act.
Bathymetry of Walker Lake, West-Central Nevada
By Thomas J. Lopes and J. LaRue Smith

38°15'
30'
45'
39°00'
39º15'119°30' 15' 119°00' 45' 30' 118°15'
NEVADA
CALIFORNIA
Alt
Alt
359
167
338
338
182
108
208
89
208
339
MonoLake
MonoLake
Topaz LakeTopaz Lake
BridgeportReservoirBridgeportReservoir
Weber ReservoirWeber Reservoir
Walker Lake
Walker LakeW
est
Wes
t Fork
Fork
EastEast
For
k F
ork
WalkerWalker
RiverRiver
Wal
ker
Wal
ker
Riv
erR
iver Walker River
Indian ReservationWalker River
Indian Reservation
Walker RiverHydrographic Area
Walker RiverHydrographic Area
Smith Valley
Smith Valley
Smith Valley
Mason Valley
Mason Valley
Mason Valley W
assuk RangeW
assuk Range
MountGrantMountGrant
Antelope ValleyAntelope ValleyAntelope Valley
Gillis Range
Gillis Range
LasVegas
Reno
SanFrancisco
Los Angeles
CALIFORNIA
NEVADA
MAP AREA
Honey Lake Valley
Base from U.S. Geological Survey digital data 1:100,000 1979-1985Universal Transverse Mercator projection, Zone 11Shaded Relief Base from 1:250,000 scale Digital Elevation Model;sun illumination from northwest at 30 degrees above horizon
0 5 10 15 20 MILES
0 5 10 15 20 KILOMETERS
Figure 1. Selected features of the Walker River basin, California and Nevada.
� Bathymetry of Walker Lake, West-Central Nevada

Figure �. Dissolved-solids concentration and lake-surface altitude versus time for Walker Lake, Nevada.
3,930
3,950
3,970
3,990
4,010
4,030
4,050
4,070
4,090LA
KE-S
URFA
CE A
LTIT
UDE,
IN F
EET
ABOV
E SE
A LE
VEL,
N
ATIO
NAL
GEO
DETI
C VE
RTIC
AL D
ATUM
OF
1929
2,500
4,000
5,500
7,000
8,500
10,000
11,500
13,000
14,500
16,000
DISS
OLVE
D-SO
LIDS
CON
CEN
TRAT
ION
,IN
MIL
LIGR
AMS
PER
LITE
R
1880 1890 1900 1910 1920 1930 1940 1950 1960 1970 1980 1990 2000 2010
YEAR
Lake-surface altitude
Dissolved-solids concentration
Measurement or estimateLake sample
Topaz Lake (1921)
Topaz Lake storageincreased (1937)
Weber Reservoir (1934)
Bridgeport Reservoir (1924)
Section 2507 of Public Law 107-171 (2002 Farm Bill) provided $200,000,000 to be used by the Secretary of Interior, acting through the Commissioner of Reclamation, to provide water to at-risk natural desert terminal lakes. This bill was later amended under Public Law 108-7, section 207 to include language “Restoration of fish, wildlife, and associated habitats in watersheds of certain lakes”. The amendment specified that only Pyramid, Summit, and Walker Lakes in Nevada were to be considered under Section 2507, Public Law 107-171.
In response to the 2002 Farm Bill, the U.S. Geological Survey (USGS), in cooperation with the Bureau of Reclamation, began a study to better estimate the water budget for Walker Lake and to develop the capability to predict how changes in irrigation practices will affect flows in the lower Walker River (Lopes, 2005). Bathymetry is the measurement of water depth, which can be used to make contours of equal water depth and equal altitude of submerged land. Bathymetry is needed to relate the water-surface altitude to the surface area and storage volume of the water body. Accurately determining the surface area and the evaporation rate is necessary to quantify outflow from Walker Lake. Rush (1970) mapped the bathymetry of Walker Lake using 877 soundings made in 1957. Rush (1970) and Thomas (1995) used this bathymetry to estimate the volume of water that evaporates from Walker Lake. To improve on these water budgets, bathymetry was measured using instruments that automatically collect thousands of accurate data points.
Purpose and Scope
This report presents a description of the updated bathymetry of Walker Lake; comparisons of relations between lake-surface altitude, surface area, and storage volume from this study and Rush (1970); and an estimate of the 1882 lake-surface altitude. Relations between lake-surface altitude, surface area, and storage volume were made to an altitude of 4,120 ft because of uncertainty in the earliest (1882) measured depth of Walker Lake (Adams, 2007).
Description of Walker River Basin
The Walker River Basin is about 4,050 mi2 and straddles the California-Nevada border. About 25 percent (1,002 mi2) of the basin is in California. Most precipitation in the basin occurs as snow in the Sierra Nevada Range, which has peaks that reach a maximum altitude of 12,264 ft at Matterhorn Peak. Snowmelt from the Sierra Nevada and other ranges flows down the east and west forks of the Walker River, which merge into the Walker River in Mason Valley, Nev., and continues flowing downstream into the northern end of Walker Lake. Walker Lake is bounded on the west by the Wassuk Range and on the east by the Gillis Range. The Wassuk Range rises abruptly from the lake by more than 7,000 ft and has a maximum altitude of 11,239 ft at Mt. Grant. The Gillis Range is not as steep and has a maximum altitude of 7,887 ft. The lowest altitude is 3,849.3 ft at the deepest part of Walker Lake.
Introduction �
Walker Lake is a depression within the Walker Lane, a broad zone of mostly north-northwest trending faults that extends from near Las Vegas, Nev. to Honey Lake Valley, Calif. (Bonham, 1969; Stewart, 1988). The Walker Lane is a complex fault system consisting of both extensional and right-lateral, strike-slip faulting and as much as 40 mi of lateral displacement in the Walker Lake area (Wesnonsky, 2005). Several faults have been mapped adjacent to and north of Walker Lake. Some of these faults or associated fault strands could underlie Walker Lake.
Mason Valley has long had the most agricultural activity in the Walker River Basin and is one of the most productive agricultural areas in the State. Most of Mason Valley was mapped as agricultural by Russell (1885), who described “irrigable lands where abundant harvests are annually secured.” Russell (1885) did not map agriculture in Smith and Antelope Valleys, which have had irrigation diversions at least since 1931 and 1943, respectively (Pahl, 2000). On June 4, 1881, Russell (1885) measured 400 ft3/s near Schurz, Nev., about 3 miles upstream from the mouth of the Walker River. In October 1882, the river at this location was dry and “little, if any, water reached the lake from this source.” According to Russell (1885), the lack of streamflow was “due in a great measure to the extensive use of its waters for irrigation in Mason Valley.”
A total of 88,600 acres of irrigated land was mapped in the Walker River Basin using Landsat satellite imagery acquired in 2000. Total irrigated land included 39,100 acres (44 percent) in Mason Valley; 18,900 acres (21 percent) in Smith Valley; 15,900 acres (18 percent) upstream from Bridgeport Reservoir; 7,700 acres (9 percent) in Antelope Valley; 3,500 acres (4 percent) along the east fork of the Walker River below Bridgeport Reservoir; 3,000 acres (3 percent) in the Walker River Indian Reservation; and 500 acres (<1 percent) south of Hawthorne, Nev. The primary crop is alfalfa, except for upstream from Bridgeport where fields are irrigated for pasture grass. Other crops that are grown in the basin include onion, garlic, corn, and winter wheat.
Methods
Data Collection
BathymetryBathymetric data were collected over the navigable
areas of Walker Lake from February through April, 2005 using the same equipment as Baskin (2005) in the Great Salt Lake. Depth and position data were collected using an automated system consisting of a single-beam echosounder (fathometer) coupled to a real-time, differentially-corrected global positioning system (GPS). Digital data were logged into a navigational computer, and a paper chart was used to
backup digital data in case of computer malfunction. Depths were derived indirectly by measuring the time required for a sonar (SOund NAvigation and Ranging) signal to travel from the transmitter to the bottom of the lake and back to a receiver. Measured sound velocities were used to correct the basic time-of-travel data and provide a velocity-corrected distance between the transmitter and receiver. Distance from the water surface to the transceiver face was measured and added to the distance between the transducer and the lake bottom to derive the calculated depth of the lake. Paper charts were collected for all transects to cross-check digital readings and to more easily see bottom features during data collection. Temperature or salinity were measured during the survey but there were no gradients, indicating the lake was well mixed (U.S. Geological Survey, 2006). Thus, the sonar signal was not affected by thermoclines or picnoclines.
About 250 mi of transects were collected primarily on east-west transects spaced about 0.31 mi apart (fig. 3). North-south transects were spaced 0.62 mi apart. Transects also were done along the shore of most of the lake. Positional data were recorded at about a 1-second rate and depth data at about 10 points per second. Boat speed was limited to less than 10 mi/h to maximize the number of depth measurements gathered during the data-collection phase. For quality control purposes, data were collected when the lake surface had waves generally less than 1 ft. Because of limitations in the instrumentation and navigating in shallow water, data collection was limited to areas deeper than about 3 ft.
Water depth was measured with a survey-grade Reson, Inc., model 210 single-beam echosounder using a 2.7-degree beam width and 200 kilohertz (kHz) transducer. Manufacturer specifications for this echosounder indicate that the depth of operation is from 0.7 to 1,969 ft and that the depth measurement accuracy is 0.4 in. Speed of sound was set at a constant 5,250 ft/s during data collection. Speed-of-sound corrections were subsequently applied during data processing.
Sound-velocity data were collected with a direct “time-of-flight” sound-velocity sensor at two locations in Walker Lake at 3.28-ft vertical intervals. The sound-velocity sensor used during this study was accurate to ±0.8 ft/s in water with a 0.7 ft/s resolution. These data were transferred to sound-velocity correction files and used during data processing.
Latitude and longitude of depth measurements were obtained with a Trimble AG132 integrated Global Positioning System/Differential Global Positioning System (GPS/DGPS) coupled with an OmniSTAR Wide Area DGPS Solution. The integrated GPS/DGPS is capable of improving regular GPS accuracies to sub-meter accuracy by solving for atmospheric delays and weighting of distant base stations. Data were collected and processed while surveying and recorded with the unprocessed depth data while in the field. Position data were collected only during times of good satellite visibility and when OmniSTAR Wide Area DGPS Solution differential corrections were available. Differentially-corrected data were acquired for all data obtained during this study and positional accuracy is estimated to be 3.28 ft or less.
� Bathymetry of Walker Lake, West-Central Nevada

Figure �. Locations of survey transects, side-scan sonar survey, and the 4,120-foot contour which is the extent of surface-area and storage-volume calculations for Walker Lake, Nevada.
WalkerLake
WalkerLake
East Fork Walker River
East Fork Walker River
Walker
Walker
River
River
1985Lake level
1985Lake level
118º52’30” 118º37’30”45’
38º37’30”
38º52’30”
45’
EXPLANATION
Walker River Indian Reservation
Hawthorne Ammunition Depot
Nevada State land
Private land
U.S. Forest Service land
U.S. Bureau of Land Management land
Water-level contour—4,120 feet
Transects for single-beam echosounder—Transects in bold are shown in figure 6
Area of side-scan sonar survey
Base from U. S. Geological Survey digital data 1:100,000, 1978-89. Universal Transverse Mercator Projection, Zone 11, North American Datum of 1983. Bathymetric surface from single-beam echosounder. Shaded-relief base from 10-meter National Elevation Dataset; sun illumination from northwest at 30 degrees above horizon
0 5 MILES
0 5 KILOMETERS
Methods �

The PC-based Windows navigational and bathymetric mapping software, Hypack Max, was used to plan and manage the bathymetric surveys and edit and manage the data collected along each lake transect. This software was installed on a portable computer interfaced with the DGPS and survey-grade depth sounder for navigational use. Hypack Max was configured to display and track the boat position against a background of survey control lines and later used for processing of the bathymetric data.
LidarLidar (Light Detection and Ranging) is an active remote
sensing technique that was used in this study to accurately measure land-surface altitude. Similar to the echosounder, Lidar determines distance by measuring the time for a pulse of photons transmitted from a laser to reflect off the land surface and return to a sensor (Wehr and Lohr, 1999). The National Aeronautics and Space Administration’s (NASA) Experimental Advanced Airborne Research Lidar (EAARL) was used during this study to map land-surface altitude of the valley floor and adjacent foothills from Hawthorne to Wabuska, Nev. EAARL is a raster-scanning, waveform-resolving, green-wavelength Lidar system designed to map near-shore bathymetry, topography, and vegetation structure simultaneously. The EAARL sensor records the time history of the reflected energy within a small area, called the footprint, for each laser pulse. The time history enables characterizing vegetation canopy structure in addition to “bare-earth” altitude under a variety of vegetation types.
The EAARL has been operational since the summer of 2001, when it surveyed a coral reef tract in the northern Florida Keys (Wright and Brock, 2002; Brock and others, 2004). The EAARL sensor suite includes a high-resolution multi-spectral color infrared camera, two precision dual-frequency kinematic carrier-phase GPS receivers, and an integrated digital miniature altitude reference system which provides for sub-meter geo-referencing of each laser pulse. The EAARL is operated from a twin-engine Cessna 310 aircraft. Flights were based out of the Reno/Tahoe International Airport. A GPS base station was set up at the airport during the survey to obtain dual-phased differentially-corrected aircraft trajectories.
The EAARL laser samples up to 10,000 times per second from a short (1.2 nanoseconds) pulse of photons. The 1.2 nanosecond pulse is approximately 7 in. long in air and 5 in. long underwater. The system can measure distance with 0.8 to 2 in. accuracy depending on variations in the target reflectivity from pulse to pulse. The footprint of the pulse is 8 in. in diameter at a nominal flying altitude of 1,000 ft. The surveyed swath width, perpendicular to the line of flight, is 790 ft. Sample spacing along the swath is about 8 ft. Swaths are approximately 6.6 ft apart when the aircraft travels at 112 mi/h. The digitally recorded return signal for each transmitted laser pulse is a time history of the reflected photons within the laser footprint.
The EAARL flight survey around Walker Lake was collected from May 26 to June 2, 2005. The 31.3 hour survey acquired 42.5 gigabytes of data including 2.2 million small-footprint waveforms, and a total of 132,064 color infrared digital camera images. The total land area surveyed was 437 mi2.
High Resolution ImageryHigh resolution imagery was collected in the Walker
Lake area by EarthData International, LLC, on June 28, 2005. Aerial imagery was collected at an approximate altitude of 20,500 ft above mean terrain using a Leica ADS40 airborne digital system, which incorporates optics, electronics, data transfer, and storage. Natural color and color infrared ortho-images were produced at 3-ft pixel resolution over an area of 1,364 mi2.
Ortho-rectification processing of the imagery was performed using various programs in the ISTAR system. Using several tools that are part of the ISTAR workflow, a Digital Elevation Model (DEM) was correlated at a post spacing of 6.6 ft depending on terrain and land cover. The ISTAR correlation algorithm computes the latitude, longitude, and altitude for each DEM post utilizing every stereo angle that is available. A series of DEM files were created for each acquisition block. A mosaic was then created from the separate DEM files. The best vertical value for each posting was selected from all look angles compared against the aero-triangulation adjustment, which is incorporated into the mosaic. EarthData then edited the surface to the level required to support the ortho-photo production. A root mean square value was calculated based on the imagery utilized in the production of the tile by comparing the aero-triangulation latitude and longitude coordinates. This value represents an estimate of the accuracy of the horizontal coordinate measurements in the tile expressed in meters. A final data set of 13.1 ft, latitude, longitude, and altitude posting was distributed by EarthData.
Side-Scan SonarSide-scan sonar is a specialized sonar system for
mapping and detecting submerged objects. Side-scan sonar continuously transmits sound energy and analyzes the return signal, called the echo, that bounced off submerged objects and the lake bottom. The energy is transmitted directly under the sonar in the shape of a fan along the lake bottom on both sides of the sonar “towfish.” The strength of the echo primarily depends on the density, surface roughness, and angle of the reflecting surface. Objects that are dense, have a rough texture, and protrude from the bottom at a high angle have a strong echo that creates a bright image. Little or no echo behind the objects creates dark shadows. Most side-scan sonars produce clear images of objects on the lake bottom, however, they cannot provide depth information. The frequency of the
� Bathymetry of Walker Lake, West-Central Nevada

side-scan sonar controls the spatial resolution of the returned image. Higher frequencies yield better resolution, but have less range. The spatial resolution or pixel size of the 600 kHz side-scan sonar is about 4 in. The 1,200 kHz side-scan sonar has a pixel size of about 1.6 in.
During the week of September 12, 2005, a survey of south-central Walker Lake was done using side-scan sonar to acquire images of anomalies which appeared to be mounds that were located by the single-beam echosounder (fig. 3). The survey was done by the USGS Center for Coastal and Watershed Studies. The main survey area covered about 5 mi2 along 96 mi of surveyed lines. A survey grid was laid out with a swath width of 246 ft and line spacing of 328 ft. The swath width was later reduced in the field to 162 ft. A few additional swaths were done at selected coordinates on the east and north-center of the lake where additional anomalies were located.
The Marines Sonic Technology, Ltd. (MSTL) 600 kHz side-scan sonar towfish was the primary sonar used and towed 16 to 39 ft behind a boat and about 33 ft above lake bottom. A MSTL 1200 kHz side-scan system also was used to acquire more detailed images in a few areas. The MSTL Sea Scan PC side-scan system controlled the survey acquisition. The Canadian Systems International Wide Area Augmentation System-enabled DGPS was used to locate position. By August 2005, a thermocline had developed at a depth of about 43 ft (U.S. Geological Survey, 2006). About 80 percent of the data were acquired when the towfish was below the thermocline and were useful.
Data Processing
BathymetryQuality assurance included removal of data that showed
systematic roll or vertical boat movement. Relative positions of the DGPS antenna and echosounder transducer were fixed during the survey period to assure accurate horizontal control. Depth of the transducer below water was measured with a tape, recorded in the field, and used in processing of the data. Raw data were processed in Hypack Max and exported in a latitude, longitude, and depth format for importing into a geographic information system (GIS).
Initial processing of the data included the manual removal of spurious data points (outliers) such as single-point depths located substantially above or below the general lake-bottom trend (fig. 4A and B), zero depths, or data that showed roll or vertical boat movement. Outliers could have resulted for various reasons such as submerged debris, gas bubbles in the water column, or sudden changes in sound velocity. Sound-velocity profile data were then used to correct the raw
depth data, resulting in a correction of ≤4 in. Depth from the lake surface to the transducer was added to the sound-velocity-corrected depths to calculate depth below the water surface.
Depth data were recorded at a high frequency [10 hertz (Hz)] because it was unknown how much detail was needed to accurately define the lake bottom. Differentially-corrected positional data were recorded at a frequency of 1 hertz. As a result, about two to five depth measurements were recorded for every meter of survey line depending on actual vessel speed. A total of 889,797 discrete depth measurements were initially collected along more than 250 mi of transects and processed during this survey. This was much more data than was needed because most of the bottom of Walker Lake is smooth. To reduce the number of data points and to remove minor bottom-surface variations, an average depth was calculated every 328 ft along each transect. The averaged depth below the water surface was used in defining the bathymetric surface of the lake (fig. 4B). A total of 4,072 averaged depth points were calculated and used in the final data analysis.
Depth and location data were imported into ArcGIS® for additional processing. Average daily lake-surface altitude, measured to 0.01 ft, was calculated from lake-stage measurements made every 15 minutes at USGS station 10288500, Walker Lake near Hawthorne, Nev. Corrected depth-to-lake-bottom values were subtracted from the average daily lake-surface altitude for the day the original data were collected and rounded to the nearest 0.1 ft to determine lake-bottom altitude along the transects. The lake boundary of June 28, 2005, identified from high resolution imagery, was digitized about every 328 ft. Selected locations of near-shore transects also were digitized. The lake-bottom altitude, altitude of the lake boundary, and altitude of selected near-shore points were used in the ArcGIS® kriging module to interpolate lake-bottom altitudes between data points. The ordinary kriging method was used with a spherical semi-variogram model, variable search radius, and a minimum of twelve data points to interpolate values for 16-ft cells.
LidarLidar data were processed using NASA’s Airborne
Lidar Processing System (ALPS). ALPS is written in Yorick and Ytk programming languages running in a Linux environment. Custom processing modules handle raw position and waveform data and organize the data in buffered 1.24 × 1.24 mi index tiles. Bare-earth elevation values were computed by determining the time of the last return within the individual small-footprint waveforms. The Random Consensus Filter algorithm was used to separate the vegetation clutter or anomalous elevations from the bare-earth returns (Nayegandhi and others, 2006). Data were then converted from units of time to points of latitude, longitude, and altitude.
Methods �

Figure �. Example of survey transect (A) before removal of outliers and (B) after removal of outliers and averaging depth every 328 feet, Walker Lake, Nevada.
B
Track line: Relation between transect line and course of boat
Profile: Relation between depth to lake bottom and course of boat
20
10
0
24
20
16
12
8
4
20
10
0
24
20
16
12
8
4
Track line: Relation between transect line and course of boat
Profile: Relation between depth to lake bottom and course of boat
ADI
STAN
CE, I
N M
ETER
SDI
STAN
CE, I
N M
ETER
SDE
PTH,
IN M
ETER
SDE
PTH,
IN M
ETER
S
� Bathymetry of Walker Lake, West-Central Nevada

A DEM was created using ArcGIS® software. The latitude, longitude, and altitude points were used to produce a 6.6-ft cell size raster surface. The inverse distance weighted algorithm was used to create the surface and required two points to determine the cell value. If 2 points were not within 16 ft of the cell, no datum value was determined. The resulting surface still had spurious cell values. A 5 × 5 cell median filter was then run over the surface. Each 1.24 × 1.24 mi tile was processed and then mosaicked together.
Merging of Data SetsThe bathymetry and DEM data were merged together to
create a single map showing land-surface altitude contours delineating areas that are currently or were submerged by Walker Lake. The Lidar DEM primarily covered the valley floor and did not include measurements in the lake. The DEM from high resolution imagery covered the valley floor and mountains and incorporated a much larger area than the Lidar data. Paleohydrologic research suggests the lake-surface altitude of Walker Lake has not exceeded 4,120 ft throughout the Holocene (Adams, 2007). Contours were mapped up to 4,120 ft because of the uncertainty in the historic lake-surface altitude and to aid future paleoclimatic studies.
The original horizontal datum for the bathymetry data was WGS 84 and the vertical datum for lake-surface altitude was NGVD 29. The original horizontal and vertical datum for the Lidar and high resolution imagery DEMs was WGS 84. The horizontal datum was set to NAD 83 and vertical datum was set to NGVD 29 for all data sets. Using National Geodetic Survey software and comparison to known lake-surface elevations, the Lidar DEM was adjusted by 79.7 ft. Land-surface altitudes determined from Lidar were re-sampled every 16 ft from the 6.6-ft cell size. Problems were encountered with acquisition of Lidar data on May 26, 2005, that could not be reduced and consequently were not used. The flight on this day passed over the Wassuk Range on the western side of Walker Lake. An inverse distance weighting algorithm was used to create a surface of 16-ft cells from the high resolution imagery DEM, which was used where Lidar data was missing.
The three data sets of 16-ft cells then were merged together. Bathymetry data were used up to the lake boundary. Lidar data were used for the rest of the study area, except for the Wassuk Range. The high resolution imagery DEM was used to fill in remaining areas with no data. This produced a final DEM of 1,364 mi2.
Errors were found in the merged data mostly along the north, south, and eastern shores. Errors occur where Lidar data indicate land-surface altitudes that are less than the lake-surface altitude. These errors could be due to moist soils along the shore affecting the return of photons from the Lidar. Errors up to 16 ft were found in 3 percent of the area within 328 ft from the shore. Errors were corrected by calculating the mean of 10 pixels that have valid land-surface altitudes and are adjacent to the pixel with invalid data, then replacing the invalid data with the mean value. The altitude of the shoreline was raised by 0.328 ft to ensure the mean value was greater than the lake-surface altitude.
Calculation of Surface Area and Storage VolumeSurface area and storage volume were calculated at 0.5-ft
intervals for lake-surface altitudes of 3,851.5 ft, the minimum averaged depth, to 4,120 ft using the 3-D surface-analysis software in ArcGIS® 9.0 (Environmental Systems Research Institute, Inc., 2004). For each interval, the raster grid was examined to determine the surface area and storage volume of each cell contained within the limits of that particular altitude. The sum of these cells is the surface area and storage volume at that lake-surface altitude (appendix A).
Estimating the error in surface area and storage volume will help evaluate the uncertainty in the water budget. Errors in surface-area and storage-volume were estimated by assuming the error in altitude of the merged data set is ±0.5 ft. Error was then calculated as the difference between two consecutive surface-area and storage-volume values in appendix A. Errors in surface area range from 60 to 660 acres; most errors are between 100 and 200 acres (fig. 5A). Percent error in surface area ranges from 0.1 to 54 percent and generally is less than 1 percent for lake-surface altitudes ≥3,880 ft. Errors in storage volume range from 50 to 44,000 acre-feet and increase with lake-surface altitude (fig. 5B). Percent error in storage-volume ranges from 0.3 to 75 percent and generally is less than 1 percent for lake-surface altitudes ≥3,930 ft. Error in surface area contributes little to the uncertainty in estimating evaporation from the lake. Percent errors are small, but a small error in storage volume on a percentage basis is a large volume of water. Estimating changes in storage volume may be the largest uncertainty in the water budget.
Methods �

Figure �. Errors in (A) surface-area and (B) storage-volume estimates versus lake-surface altitude of Walker Lake, Nevada.
Bathymetry of Walker Lake
Description of Walker Lake
Walker Lake is oval shaped with a north-south trending long axis (pl. 1). The minimum altitude from discrete point depths is 3,849.3 ft near the center of Walker Lake. At a lake-surface altitude of 4,120 ft, the storage volume is 11,837,000 acre-ft and the surface area is 81,360 acres (appendix A). On June 28, 2005, the lake-surface altitude was 3,935.6 ft, maximum width was 5.5 mi, maximum length was 12.7 mi, maximum depth was 86.3 ft, storage was 1,779,000 acre-ft, and the surface area was 32,190 acres.
ErrorPercent error
A
B
ErrorPercent error
0 100 200 300 400 500 600 700ERROR IN SURFACE AREA, IN ACRES
3,8503,8803,9103,9403,9704,0004,0304,0604,0904,1204,150
LAKE
-SUR
FACE
ALT
ITUD
E, IN
FEE
T AB
OVE
SEA
LEVE
L,
NAT
ION
AL G
EODE
TIC
VERT
ICAL
DAT
UM O
F 19
29
0 10,000 20,000 30,000 40,000 50,000
ERROR IN STORAGE VOLUME, IN ACRE-FEET
3,8503,8803,9103,9403,9704,0004,0304,0604,0904,1204,150 0 10 20 30 40 50 60 70 80
PERCENT ERROR IN STORAGE VOLUME
0 10 20 30 40 50 60PERCENT ERROR IN SURFACE AREA
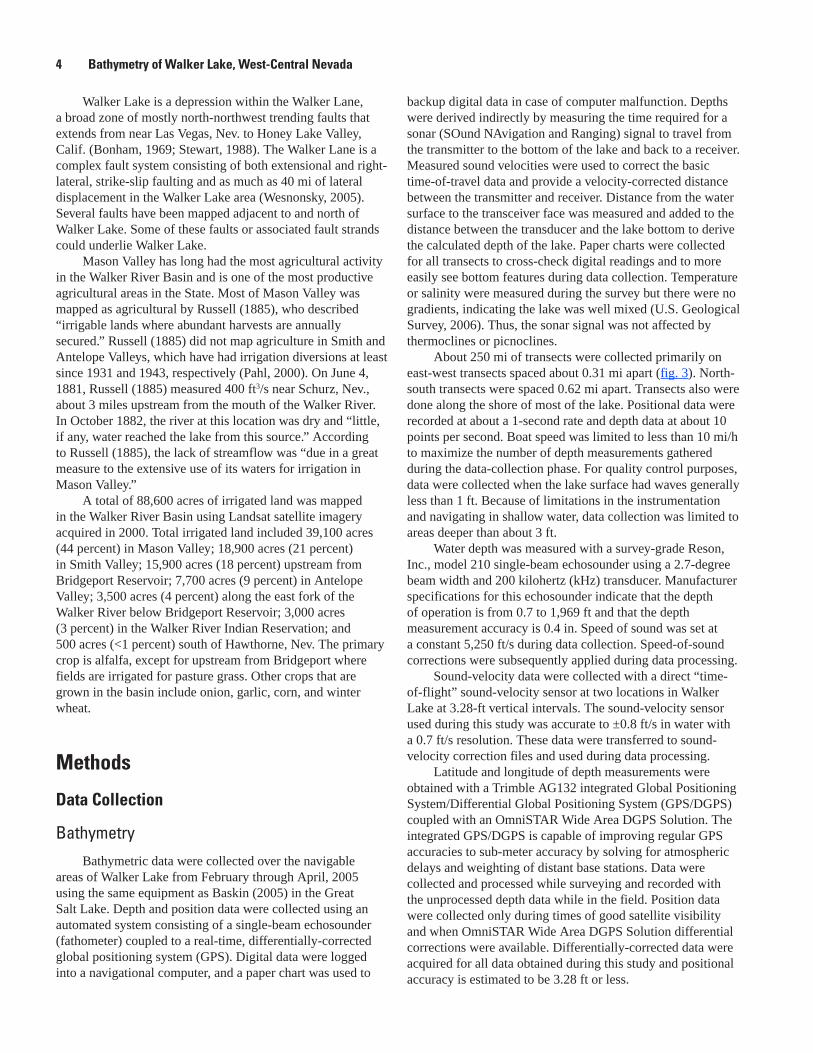
The lake bottom is steepest along the western shore, moderately steep along the eastern shore, shallowest at the northern and southern ends, and becomes fairly flat about 0.3 mi from the western and eastern shores (pl. 1, fig. 6A‑D). Scour channels up to 425 ft wide were observed along the most northern transect near the mouth of the Walker River (fig. 6A). Deltaic sediments created a broad mound up to 6.5 ft tall and 1 mi wide that extends about 2.8 mi south from the mouth of the Walker River. Algal growth abruptly appeared near the river mouth and in water about 20-ft deep along much of the eastern shore. Less algal growth was observed in other parts of the lake. The lake bottom along the transect at universal transverse mercator (UTM) northing 4275000 has a sudden drop of about 4 ft, which could be fault offset (fig. 6C). The rest of the lake bottom is remarkably smooth, except for mounds near the shore and river mouth.
10 Bathymetry of Walker Lake, West-Central Nevada

Figure �. Bathymetry along transects at select locations in Walker Lake, Nevada.
Bathymetry of Walker Lake 11
Figure �.—Continued.
1� Bathymetry of Walker Lake, West-Central Nevada

Figure �.—Continued.
Bathymetry of Walker Lake 1�

Figure �.—Continued.
1� Bathymetry of Walker Lake, West-Central Nevada

Mounds are indicated by sonar return signals that abruptly ramp up and down with no return signals beneath the mounds. Logs, fish, or other objects floating near the bottom of the lake are distinguished from mounds because return signals appear underneath the objects. Mounds near the mouth of the Walker River could be stumps of trees that grew during long periods of low lake-surface altitude (Adams, 2007) or partially buried logs carried in from the river. Some of the mounds, especially those near the western shore, likely are boulders that tumbled into the lake or were deposited by prograding alluvial fans during long periods of low lake-surface altitude. Using a submersible camera, piles of boulders south of the town of Walker Lake were observed along the shore and in water about 30-ft deep. Large piles of boulders also could be at the western end of the transect at UTM northing 4276000 (fig. 6C) and the southern end of the transect at UTM easting 348000 (fig. 6D).
The echosounder detected what appeared to be mounds in the deepest parts of Walker Lake, miles from the shore and river mouth (figs. 6A–D). Sonar return signals from the anomalies were the same as signals from boulders or other solid objects lying on the bottom (fig. 7). However, side-scan sonar and divers did not verify their presence. The vertical exaggeration in figure 7 makes anomalies appear similar to tufa towers along the shores of Mono Lake (fig. 8). However, about 75 percent of the mounds and anomalies in Walker Lake are low, broad features with a width that is at least twice the height. Tufa typically forms as tall structures along the margins of lakes and not in the deepest waters.
The three anomalies in figure 7 were located on March 3 and again on March 4, 2005, when the lake bottom was viewed with a submersible camera. Rocks were observed that appeared to be tufa and the lake bottom was pock marked with many holes. In August 2006, divers determined that the holes were burrows made by mayfly larvae and red worms. The lake was well mixed when bathymetry was done and there is no indication that the equipment malfunctioned, so it is unknown what caused the anomalous return signals.
A number of objects and features were seen during the side-scan sonar survey. Numerous strong reflections were imaged almost immediately upon starting the survey, but their shadows were separate from their reflection. The pattern of the reflections and separation from their shadows indicated the reflections likely were schools of fish. Images of large boulders were taken along the cliffs north of the town of Walker Lake (fig. 9). The line in the center of figure 9 is the
course of the towfish. Side-scan sonar obtains images on both sides of the towfish but not underneath it, which is why there is a dark area in the center of figure 9. Images were taken of a few mounds, but generally these were less than 3-ft tall.
A total of 93 mounds and anomalies ≥3-ft tall with a maximum height of 32.3 ft were located in Walker Lake (fig. 10; appendix B). East-west and north-south transects detected mounds and anomalies in the same areas in the northern and southern parts of the lake. The two groups have a roughly northwest trend and about the same number of mounds. The northern group extends from the northwestern to mid-eastern sides of Walker Lake and is at the southern end of a northwest trending fault that crosses the Wassuk Range. This fault or associated fault strands could continue southeast and underlie the lake. The southern group extends from about 2.5 mi northeast of the town of Walker Lake to the southern end of the lake. The steep slope north of the town of Walker Lake likely is a fault scarp (fig. 6B). The northwest trend parallel to and in proximity of mapped faults suggests that anomalies could be related to faults.
The measured evaporation rate from Walker Lake is almost 6 ft/yr (Allander and others, 2006), which is nearly 50 percent more than 4.1 ft/yr estimated by Harding (1965) and used in previous water budgets (Rush, 1970; Thomas, 1995). To balance the higher evaporation rate, more water must be flowing into the lake from sources other than the Walker River than previously estimated. It is hypothesized that some anomalies indicate spring discharge along faults based on the tufa-like rocks, the northwest trend parallel to and in proximity of mapped faults, and the measured evaporation rate. Schaefer (1980) estimated 11,000 acre-ft/yr of water discharges from the alluvial aquifer into northern Walker Lake. This discharge could be occurring along a fault, forming the northern group of northwest-trending anomalies. Mt. Grant could be the source of water if the southern anomalies are active springs. The town of Walker Lake was built on an alluvial fan formed by sediments from the Cottonwood Creek drainage, the highest and largest drainage along the eastern Wassuk Range and just west of the southern group (fig. 10). Snowmelt could infiltrate as it flows across the alluvial fan, flowing through layers of sand and gravel that deposited on the lake bed. Offset of these layers by faults could cause ground water to discharge, forming the southern group of anomalies. Additional studies need to be done to determine what the anomalies are and whether they are related to the hydrology of Walker Lake.
Bathymetry of Walker Lake 1�

Figure �. Example of anomalies detected by the single-beam echosounder. Data points on the right are probable noise. Course of the boat is in the top frame.
Figure �. Tufa towers along the shore of Mono Lake, California.
DEPT
H, IN
MET
ERS
DIST
ANCE
, IN
MET
ERS 20
10
17
23
22
21
20
19
18
Track line: Relation between transect line and course of boat
Profile: Relation between depth to lake bottom and course of boat
Vertical exaggeration is about 50X
1� Bathymetry of Walker Lake, West-Central Nevada

Figure �. Lake bottom along the cliffs north of the town of Walker Lake, Nevada. The top of the image is north and the line in the center is the course of the towfish. Boulders from the cliffs, just beyond the left side of the image, can be seen in the left side of the image. The two boulders at the lower left are about 3 and 6 feet tall.
Bathymetry of Walker Lake 1�

Walker
Lake
Walker
Lake
WalkerWalker
Cot
tonw
ood
Cot
tonw
ood
CreekCreek
River
River
WalkerLake
0 4 8 KILOMETERS2
0 5 MILES
Base from U. S. Geological Survey digital data 1:100,000, 1978-89. Universal Transverse Mercator Projection, Zone 11, North American Datum of 1983. Faults from U.S. Geological Survey and Nevada Bureau of Mines and Geology Quaternary fault and fold database for the United States, 2006. Background image from Landsat Enhanced Thematic Mapper Plus, panchromatic band 8, April 6, 2000.
118º52’30” 118º37’30”118º45’
38º37’30”
38º45’
EXPLANATION
Anomalous mounds— Height, in meters
Faults
Concealed
Exposed
Inferred
1.0–2.5
2.6–4.0
4.1–5.5
5.5–7.0
7.1–8.5
8.6–9.9
Figure 10. Locations and estimated heights of mounds, anomalies, and faults in and around Walker Lake, Nevada.
1� Bathymetry of Walker Lake, West-Central Nevada

Comparison to Bathymetry by Rush
The bathymetry from this study was compared to the bathymetry of Rush (1970) to determine how much error could be in previous water budgets due to inaccurate surface-area estimates (Rush, 1970; Thomas, 1995). Comparisons were made for lake-surface altitudes of 3,851.5–4,083 ft, which is the highest altitude that surface area and storage volume calculated for by Rush (1970; fig. 11). Differences between the two data sets were calculated assuming values estimated from this study were the most accurate value.Differences in surface area ranged from -45.6 to 100 percent with a median of 1.0 percent and a mean of 0.1 percent. Differences in storage volume ranged from -150 to 100 percent with a median of 0.5 percent and a mean of 0.0 percent. The largest
differences in surface area and storage volume occur at lake-surface altitudes <3,890 ft. Most differences at higher altitudes are between -1 and 1 percent.
A paired t-test indicated the bathymetry of Rush (1970) was statistically different than the bathymetry from this study and slightly overestimated surface area and storage volume. However, the two bathymetries are nearly identical throughout most of the range in lake-surface altitude (fig. 11). Thus, errors in surface area contributed little to errors in evaporation of previous water-budget estimates. The small difference between the two bathymetries largely is due to the simple oval shape and smooth lake bottom. The small difference also is evidence of the accuracy of the soundings made in 1957 and Rush’s (1970) computation of the bathymetric and topographic data.
Figure 11. Lake-surface altitude versus surface area and storage volume for Walker Lake, Nevada.
0 10,000 20,000 30,000 40,000 50,000 60,000 70,000 80,000 90,0003,850
3,870
3,890
3,910
3,930
3,950
3,970
3,990
4,010
4,030
4,050
4,070
4,090
4,110
4,130
4,150
LAKE
-SUR
FACE
ALT
ITUD
E, IN
FEE
T AB
OVE
SEA
LEVE
L,N
ATIO
NAL
GEO
DETI
C VE
RTIC
AL D
ATUM
OF
1929
0 2,000,000 4,000,000 6,000,000 8,000,000 10,000,000 12,000,000 14,000,000
This study
Rush (1970)
Surface area
Storage volume
SURFACE AREA, IN ACRES
STORAGE VOLUME, IN ACRE-FEET
Bathymetry of Walker Lake 1�

Estimation of 1��� Lake-Surface Altitude
The earliest (1882) recorded depth of Walker Lake was 225 ft by Russell (1885). The location of this measurement, estimated from Russell’s map on plate XV, was about latitude 38o 41.7’ and longitude 118 o 42.1’. Unknown to Russell, this was not the deepest part of the lake. Russell did not state what the lake-surface altitude was at the time of the measurement. The altitude of the lake bottom within 0.62 mi of the location ranges from 3,854.5 ft to 3,860.8 ft with an average of 3,857 ft and standard deviation of 1.3 ft. Assuming Russell’s sounding was accurate, the lake-surface altitude in 1882 was between 4,080 ft and 4,086 ft with a probable altitude of 4,082 ft. This estimate of the 1882 lake-surface altitude compares well to the estimate of 4,083 ft by Rush (1970). Harding (1965) estimated the 1882 lake-surface altitude was 4,086 ft, which is within the range of possible altitudes.
Researchers estimate that Walker Lake reached its historic highstand in 1868. Previous studies estimated the 1868 lake-surface altitude was 4,089 ft (Harding, 1965), 4,101 ft (Davis, 1982; Link and others, 1985), and 4,108 ft (Blair and McPherson, 1994). Adams (2007) notes that, because the 1860s was a wet decade, Walker Lake could have reached a highstand of 4,108 ft in 1868 and declined to 4,101 ft by 1882. However, an 1882 lake-surface altitude of 4,101 ft is well outside the possible range. Assuming lake-surface altitude in 1882 was 4,082 ft, Walker Lake declined about 7 to 26 ft between 1868 and 1882. By the time Russell (1885) reached the area, Mason Valley was predominantly agricultural. The difference in lake-surface altitude between 1868 and 1882 could at least partly be due to irrigation diversions during this time.
SummaryWalker Lake lies within a topographically closed basin in
west-central Nevada and is the terminus of the Walker River. Streamflow in the Walker River is diverted for irrigation, which has contributed to a decline in lake-surface altitude of about 150 ft and an increase in dissolved solids from 2,500 to 16,000 milligrams per liter in Walker Lake since 1882. The increase in salinity threatens the fresh-water ecosystem and survival of the Lahontan cutthroat trout, a species listed as threatened under the Endangered Species Act. Accurately determining the bathymetry is one component of a study to improve the water budget for Walker Lake. This report describes the bathymetry of Walker Lake, a comparison of relations between lake-surface altitude, surface area, and storage volume from this study and a study by Rush in 1970, and an estimate of the 1882 lake-surface altitude.
Depth and position data of the lake bottom were collected using an automated system consisting of a single-beam echosounder coupled to a real-time, differentially-corrected GPS. Depth was measured along about 250 mi of transects from February through April 2005. Lidar data and
high resolution aerial imagery were acquired around Walker Lake in May and June, 2005 and used to make DEMs. In September 2005 and August 2006, side-scan sonar and divers were used to verify the presence of mounds in the deepest part of the lake that were detected by the single-beam echosounder.
The bathymetric data and DEMs were merged together to create a single map showing land-surface altitude contours delineating areas that are currently or that were submerged by Walker Lake. Paleohydrologic research suggests the lake-surface altitude of Walker Lake has not exceeded 4,120 ft throughout the Holocene. Contours were mapped up to 4,120 ft because of the uncertainty in the historic lake-surface altitude and to aid future paleoclimatic studies. Surface area and storage volume were calculated at 0.5-ft intervals for lake-surface altitudes of 3,851.5–4,120 ft with 3-D surface-analysis software.
Walker Lake is oval shaped with a north-south trending long axis. On June 28, 2005, the lake-surface altitude was 3,935.6 ft, maximum width was 5.5 mi, maximum length was 12.7 mi, maximum depth was 86.3 ft, storage was 1,779,000 acre-ft, and the surface area was 32,190 acres. The minimum altitude from discrete point depths is 3,849.3 ft near the center of Walker Lake.
The lake bottom is remarkably smooth, except for 93 mounds and anomalies ≥3 ft tall with a maximum of height of 32.3 ft. Mounds near the shore and river mouth could be boulders, tree stumps, logs, and other submerged objects. Anomalies occur in the deepest parts of Walker Lake, miles from the shore and river mouth so it is unlikely that these anomalies are boulders or debris from the Walker River. Rocks and concretions that appear to be tufa were observed around the anomalies with a submersible camera. However, side-scan sonar and divers did not verify the presence of the anomalies. Anomalies occur in two northwest trending groups in northern and southern Walker Lake. It is hypothesized that some anomalies indicate spring discharge along faults based on the tufa-like rocks, the northwest trend parallel to and in proximity of mapped faults, and a measured evaporation rate that is about 50 percent higher than the previous estimate. Additional studies are needed to determine what the anomalies are and whether they are related to the hydrology of Walker Lake.
Differences in surface area between this study and the study by Rush in 1970 ranged from -45.6 to 100 percent with a median of 1.0 percent and a mean of 0.1 percent. Differences in storage volume ranged from -150 to 100 percent with a median of 0.5 percent and a mean of 0.0 percent. In general, the bathymetry by Rush in 1970 and from this study are nearly identical throughout most of the range in lake-surface altitude.
The lake-surface altitude in 1882 was estimated to be between 4,080 and 4,086 ft with a probable altitude of 4,082 ft. This estimate compares well with previous estimates of 4,083 and 4,086 ft. Researchers believe the historic highstand of Walker Lake occurred in 1868 and estimated the highstand was between 4,089 and 4,108 ft. By 1882, Mason Valley was predominantly agricultural. The 7–26 ft decline in lake-surface altitude between 1868 and 1882 could partially be due to irrigation diversions during this time.
�0 Bathymetry of Walker Lake, West-Central Nevada
References Cited
Adams, K.D., 2007, Late Holocene sedimentary environments and lake-level fluctuations at Walker Lake, Nevada, USA: Geological Society of America Bulletin, v. 119, no. 1–2, p. 126–139.
Allander, K.K., Smith, J.L., Johnson, M.J., and Pattison, Robert, 2006, Evapotranspiration (ET) in the lower Walker River Basin, West-Central Nevada: Nevada Water Resources Association 2006 Annual Conference, Mesquite, Nevada, February 23, 2006, accessed August 2, 2006, at http://nevada.usgs.gov/walker/presentations/nwra.20060223.allander.pdf
Baskin, R.L., 2005, Calculation of area and volume for the south part of Great Salt Lake, Utah, 2005: U.S. Geological Survey Open-File Report 2005–1327, 6 p.
Blair, T.C., and McPherson, J.G., 1994, Historical adjustments by Walker River to lake-level fall over a tectonically tilted half-graben floor, Walker Lake Basin, Nevada: Sedimentary Geology, v. 92, p. 7–16.
Bonham, H.F., 1969, Geology and mineral deposits of Washoe and Storey Counties, Nevada: Nevada Bureau of Mines and Geology Bulletin 70, 140 p.
Brock, J.C., Wright, C.W., Clayton, T.D., and Nayegandhi, Amar, 2004, LIDAR Optical Rugosity of Coral Reefs in Biscayne National Park, Florida: Coral Reefs, v. 23, no. 1, p. 48–59.
Davis, J.O., 1982, Bits and pieces: the last 35,000 years in the Lahontan Basin, in Madsen, D.B., and O’Connell, J.F., eds., Man and Environment in the Great Basin, Society of American Archeology Papers, no. 2, p. 53–75.
Environmental Systems Research Institute, Inc., 2004, ArcToolbox: About surfaces and surface models, ArcGIS 9.0 Desktop Help, accessed June 2005 at http://webhelp.esri.com/arcgisdesktop/
Harding, S.T., 1965, Recent variations in the water supply of the Western Great Basin: University of California—Berkeley, Water Resources Center Archives, 226 p.
Link, M.H., Roberts, M.T., and Newton, M.S., 1985, Walker Lake Basin, Nevada: An example of Late Tertiary (?) to Recent sedimentation in a basin adjacent to an active strike-slip fault, in Biddle, K.T., and Christie-Blink, N., eds, Strike-slip deformation, basin formation, and sedimentation: Tulsa, Society of Economic Paleontologists and Mineralogists, p. 105–125.
Lopes, T.J., 2005, Science to sustain terminal lakes: Walker River Basin Study: U.S. Geological Survey Fact Sheet 2005–3124.
Nayegandhi, Amar, Brock, J.C., Wright, C.W., and O’Connell, M., 2006, Evaluating small-footprint waveform-resolving lidar over coastal vegetated communities: Journal of Photogrammetric Engineering and Remote Sensing—Forestry Lidar Special Issue, v. 72, no. 12, p. 1407-1417.
Pahl, Randy, 2000, Walker River Basin Irrigation Diversions—Summary of historic surface water irrigation diversions: Nevada Division of Water Planning, Nevada Water Basin Information and Chronology Series, 15 p.
Reheis, M.C., 1999, Extent of Pleistocene lakes in the western Great Basin: U.S. Geological Survey Miscellaneous Field Studies Map 2323, 1 map.
Rush, F.E., 1970, Hydrologic regimen of Walker Lake, Mineral County, Nevada: U.S. Geological Survey Hydrologic Investigations Atlas HA-415, scale 1:62,500
Russell, I.C., 1885, Geologic history of Lake Lahontan-A Quaternary lake in northwestern Nevada: U.S. Geological Survey Monograph 11, 288 p.
Schaefer, D.H., 1980, An appraisal of the water resources of the Walker River Indian Reservation, Nevada: U.S. Geological Survey Open-File Report 80–427, 65 p.
Stewart, J.H., 1988, Tectonics of the Walker Lane Belt, Western Great Basin: in Ernst, W.G., ed., Metamorphism and crustal evolution of the Western United States: Rubey Volume VII, Prentice Hall, p. 683–713.
Thomas, J.M., 1995, Water budget and salinity of Walker Lake, Western Nevada: U.S. Geological Survey Fact Sheet FS–115–95.
U.S. Geological Survey, 2006, Annual water data report, 2005: U.S. Geological Survey Open-File Report, URL accessed August 1, 2006, at http://web10capp.er.usgs.gov/imf/sites/adr/pdfs/384443118430901.2005.pdf
Wehr, Aloysius, and Lohr, Uwe, 1999, Airborne laser scanning—an introduction and overview: Journal of Photogrammetric Engineering and Remote Sensing, v. 54, nos. 2–3, p. 68–82.
Wesnonsky, S.G., 2005, The San Andreas and Walker Lane fault systems, western North America: transpression, transtension, cumulative slip, and the structural evolution of a major transform plate boundary: Journal of Structural Geology, v. 27, p. 1505–1515.
Wright, C.W., and Brock, J.C., 2002, EAARL: a Lidar for Mapping Shallow Coral Reefs and Other Coastal Environments: in Proceedings of the Seventh International Conference on Remote Sensing for Marine and Coastal Environments, May 20–22, 2002, Miami, FL.
References Cited �1

This page is intentionally left blank.
�� Bathymetry of Walker Lake, West-Central Nevada

Appendix A. Lake-Surface Altitude, Surface Area, and Storage Volume of Walker Lake, Nevada
Appendix A data are available in an Excel data base for download at URL: http://pubs.water.usgs.gov/sir20075012.
Appendix A. ��

This page is intentionally left blank.
�� Bathymetry of Walker Lake, West-Central Nevada

Appendix B. Locations and Heights of Mounds and Anomalies Detected in Walker Lake, Nevada
Appendix B data are available in an Excel data base for download at URL: http://pubs.water.usgs.gov/sir20075012.
Appendix B. ��

This page is intentionally left blank.
�� Bathymetry of Walker Lake, West-Central Nevada

For more information contact: Director, Nevada Water Science Center U.S. Geological Survey 2730 N. Deer Run Road Carson City, Nevada 89701 http://nevada.usgs.gov

SIR 2007–5012Lopes and Sm
ithB
athymetry of W
alker Lake, West-Central N
evada