Embed Size (px)
Citation preview

USING 3D SENSING AND PROJECTING
TECHNOLOGY TO IMPROVE THE MOBILITY
OF PARKINSON'S DISEASE PATIENTS
A thesis submitted for the degree of
Doctor of Philosophy
by
Amin Amini
Supervisor:
Dr. Konstantinos Banitsas
Department of Electronics and Computer Engineering
College of Engineering, Design and Physical Sciences
Brunel University London
February 2018

Abstract
Parkinson’s is a neurological condition in which parts of the brain responsible for
movements becomes incapacitated over time due to the abnormal dopamine
equilibrium. Freezing of Gait (FOG) is one of the main Parkinson’s Disease (PD)
symptoms that affects patients not only physically but also psychologically as it
prevents them from fulfilling simple tasks such as standing up or walking. Different
auditory and visual cues have been proven to be very effective in improving the
mobility of People with Parkinson’s (PwP). Nonetheless, many of the available
methods require user intervention or devices to be worn, charged, etc. to activate
the cues.
This research suggests a system that can provide an unobtrusive facility to detect
FOG and falling in PwP as well as monitoring and improving their mobility using
laser-based visual cues casted by an automated laser system. It proposes a new
indoor method for casting a set of two parallel laser lines as a dynamic visual cue
in front of a subject’s feet based on the subject’s head direction and 3D location in
a room. The proposed system controls the movement of a set of pan/tilt servo
motors and laser pointers using a microcontroller based on the real-time skeletal
information acquired from a Kinect v2 sensor. A Graphical User Interface (GUI) is
created that enables users to control and adjust the settings based on the user
preferences.
The system was tested and trained by 12 healthy participants and reviewed by 15
PwP who suffer from frequent FOG episodes. The results showed the possibility
of employing the system as an indoor and on-demand visual cue system for PwP
that does not rely on the subject’s input or introduce any additional complexities to
operate. Despite limitations regarding its outdoor use, feedback was very positive
in terms of domestic usability and convenience, where 12/15 PwP showed interest
in installing and using the system at their homes.

Dedication
To my parents, Ali Akbar & Aghdas.

Acknowledgements
I would like to acknowledge Parkinson’s UK foundation for facilitating the process
of recruiting PwP for our focus groups. Most importantly, I would like to thank my
supervisor, Dr. Konstantinos Banitsas whose comments, observations and ideas
have greatly enriched this project.

Declaration
I hereby declare that this submission is my own work and the use of all material
from other sources has been properly and fully acknowledged, and I confirm that
this thesis has not been and will not be, submitted in whole or in part to another
University for the award of any other degree.
Signature: ………………

vii | P a g e
Contents
Table of Contents
Abstract ................................................................................................................ 3
Dedication ............................................................................................................ 4
Acknowledgements .............................................................................................. 5
Declaration ........................................................................................................... 6
Contents ............................................................................................................. vii
Figures .................................................................................................................. x
Equation ............................................................................................................. xiv
Tables ................................................................................................................ xiv
Abbreviations ...................................................................................................... xv
Publications........................................................................................................ xvi
Chapter 1: Introduction ...................................................................................... 18
1.1 Motivation ............................................................................................. 18
1.2 Parkinson’s Disease ............................................................................. 18
1.3 Freezing of Gait (FOG) ......................................................................... 19
1.4 Possible Treatments ............................................................................. 20
1.4.1 Sensory Stimulation ....................................................................... 21
1.5 Research Question ............................................................................... 22
1.6 Aims and Objectives ............................................................................. 22
1.7 Contribution to Knowledge .................................................................... 23
1.8 Thesis Structure .................................................................................... 23
Chapter 2: Literature Review ............................................................................. 25
2.1 Introduction ........................................................................................... 25
2.2 The Effect of Visual Cue on PD Locomotion ......................................... 25

viii | P a g e
2.3 FOG Monitoring and Detection ............................................................. 29
2.3.1 Footstep detection .......................................................................... 33
2.4 Fall Monitoring and Detection ............................................................... 35
2.5 Summary .............................................................................................. 38
Chapter 3: Background of Sensors Technology ................................................ 39
3.1 Introduction ........................................................................................... 39
3.2 Microsoft Kinect .................................................................................... 39
3.2.1 Open Source Drivers and SDKs ..................................................... 43
3.2.2 Microsoft Kinect SDK for Windows ................................................. 47
3.2.3 Microsoft Kinect v2 ......................................................................... 53
3.3 Summary .............................................................................................. 54
Chapter 4: Methodology ..................................................................................... 56
4.1 Introduction ........................................................................................... 56
4.2 Fall Detection ........................................................................................ 56
4.2.1 Heuristic Approach ......................................................................... 57
4.2.2 Machine Learning Approach .......................................................... 60
4.2.3 Testing Environment and Subjects ................................................. 64
4.3 FOG and Footstep detection ................................................................. 64
4.3.1 Joint Height Footstep detection ...................................................... 65
4.3.2 Knee Angle Based Footstep detection ........................................... 71
4.4 Software Development.......................................................................... 73
4.4.1 FOG Detection ............................................................................... 76
4.5 Hardware Development ........................................................................ 77
4.5.1 Servo Motors Angle Detection ........................................................ 77
4.5.2 Motor Control ................................................................................. 81
4.5.3 Design of the Prototype System ..................................................... 81
4.6 Focus Group and Patients Participation................................................ 84
4.7 Summary .............................................................................................. 85
Chapter 5: Results and Discussion .................................................................... 87

ix | P a g e
5.1 Introduction ........................................................................................... 87
5.2 Experimental Setup .............................................................................. 87
5.2.1 System Specifications .................................................................... 87
5.2.2 Testing Environment ...................................................................... 87
5.2.3 Test Cases ..................................................................................... 89
5.3 Kinect v1 Frame Rate Analysis ............................................................. 89
5.4 Fall Detection ........................................................................................ 92
5.5 FOG and Footstep Detection ................................................................ 98
5.5.1 Ankle Distance to Ground Approach .............................................. 99
5.5.2 Knee Angle Approach .................................................................. 108
5.6 Laser System ...................................................................................... 111
5.7 Focus group try outs and used feedback ............................................ 113
5.8 Summary ............................................................................................ 117
Chapter 6: Conclusions and Future Work ........................................................ 118
6.1 Conclusion .......................................................................................... 118
6.2 Future Work ........................................................................................ 122
References....................................................................................................... 124
Appendices ...................................................................................................... 136
A. Laser Project Registration and RA Class 3B-4 Form & risk assessment . 137
B. Approval Letter from Brunel for inviting Parkinson's patients ................... 141
C. Consent Form for Focus Group participation .......................................... 142
D. Approval of collaboration with Parkinson’s UK ......................................... 142
E. Patient and Public Involvement Request Form ........................................ 146
F. Invitation to Focus Group Days ................................................................ 149
G. Invitation to Participate to the focus groups ............................................. 152
H. Participant Information Sheet ................................................................... 153
I. Participant Feedback Form ........................................................................ 158
J. 3D design for laser pointers’ mount .......................................................... 162
K. QR code for the system’s demonstration video ........................................ 162
x | P a g e
Figures
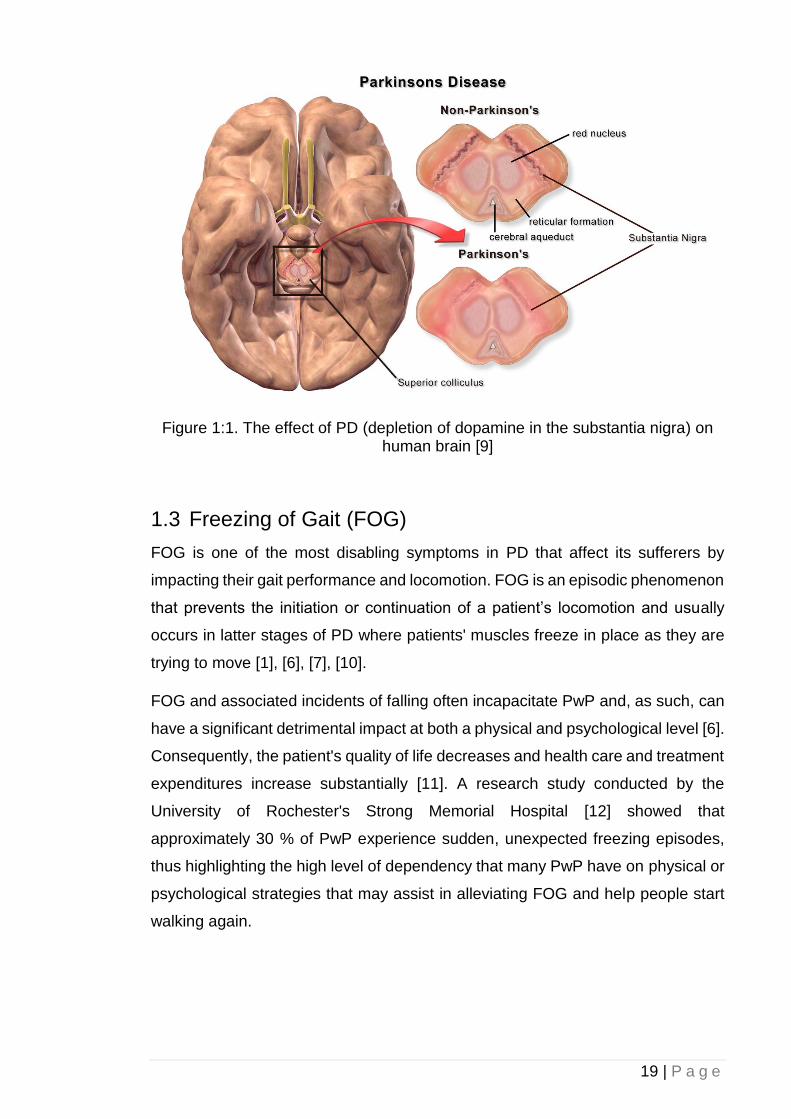
Figure 1:1. The effect of PD (depletion of dopamine in the substantia nigra) on
human brain [9] ........................................................................................... 19
Figure 1:2. PD physical symptoms [9] ................................................................ 20
Figure 2:1. A pair of laser-mounted shoes for visual cue [35] ............................ 26
Figure 2:2. A SMLD coupled with a controlling laptop and laser line projection
system for PD patient’s visual cue purposes [31] ....................................... 27
Figure 2:3. A goggle used to project VCS [30] ................................................... 28
Figure 2:4. A VCS system virtual cue projection mechanism [23] ...................... 29
Figure 2:5. A pair of accelerometers and a smart phone used for gait analysis
and FOG assessments in PwP [39] ............................................................ 30
Figure 2:6. Shoe-embedded inertial sensors for FOG assessment and gait
performance analysis. Upon a possible FOG detection, a wireless headset
would provide auditory cues [40] ................................................................ 31
Figure 2:7. A Kinect-driven rehabilitation and movement exercise game for PwP
[44] .............................................................................................................. 32
Figure 2:8. Subject’s fall and inactivity detection based on 3D bounding box [81]
.................................................................................................................... 36
Figure 2:9. A Kinect camera face-down approach for fall detection based on the
raw depth data and head-to-floor proximity [79] .......................................... 37
Figure 3:1. Microsoft Kinect v1 internal components [84] .................................. 40
Figure 2:2 Kinect Infrared Depth Sensor [86] ..................................................... 41
Figure 2:3. Panel (a) is the perceived IR image by the Kinect. Panel (b)
represents the depth information for each pixel colour coded based on their
distance to the camera [88]......................................................................... 42
Figure 2:4. OpenNI Framework [90] ................................................................... 44
Figure 2:5. Calibration of Psi Pose [95] .............................................................. 46
Figure 2:6. NITE Tracked Joints [94] ................................................................. 47
Figure 2:7. Microsoft Kinect for Windows SDK Architecture [97] ....................... 49
Figure 2:8. Microsoft Kinect SDK for Windows Traceable Joints [100] .............. 50
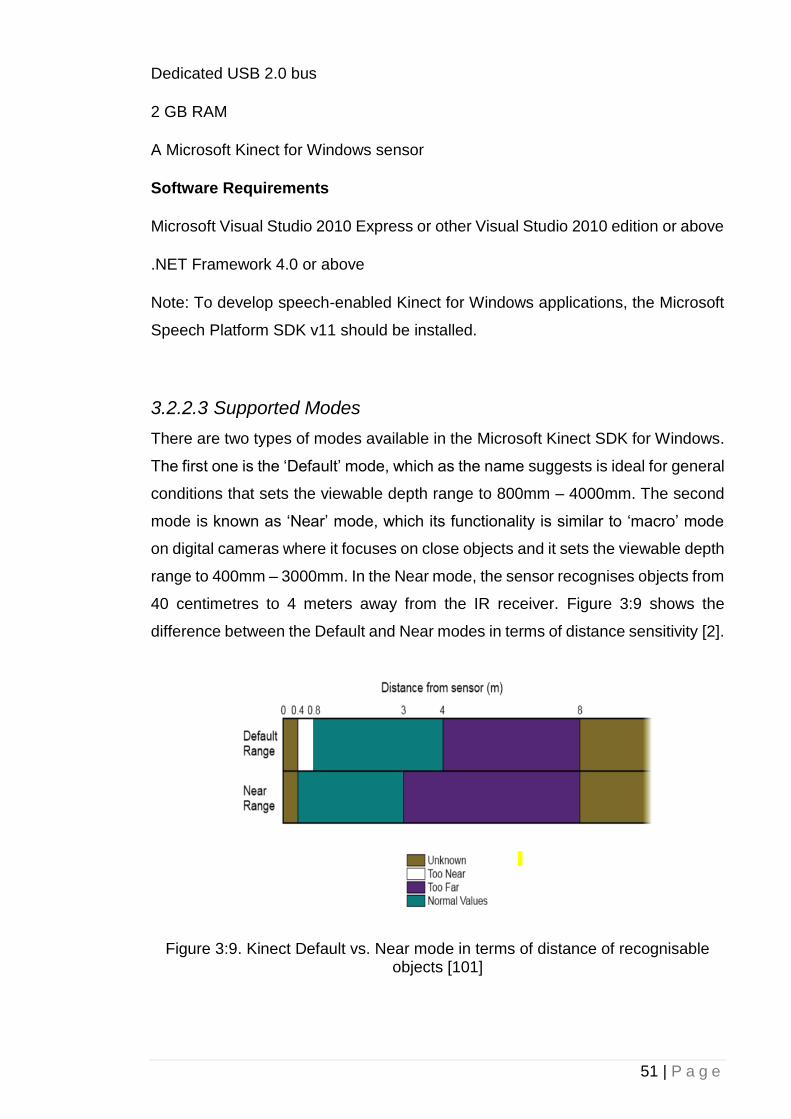
Figure 2:9. Kinect Default vs. Near mode in terms of distance of recognisable
objects [101] ............................................................................................... 51
xi | P a g e
Figure 2:10. Standing vs. Seated modes [102] .................................................. 52
Figure 2:11. Microsoft Kinect v2 [105] ................................................................ 53
Figure 2:12. Trackable body joints from the skeletal data Kinect v1 vs Kinect v2
[46] .............................................................................................................. 54
Figure 4:1. Heuristic approach software in action (objects partially blocking the
sensor’s view) ............................................................................................. 58
Figure 4:2. Heuristic approach software in action (partial obstructed field of view)
.................................................................................................................... 59
Figure 4:3. Visual Gesture Builder data flow diagram [109] ............................... 61
Figure 4:4. Visual Gesture Builder software ....................................................... 62
Figure 4:5. Machine learning approach software in action (objects partially
blocking the sensor’s view) ......................................................................... 63
Figure 4:6. Machine learning approach software in action (partial obstructed field
of view) ....................................................................................................... 63
Figure 4:7. Subject's joints height to the ground in a gait cycle .......................... 68
Figure 4:8 Foot step detection algorithm flowchart ............................................ 69
Figure 4:9. Panel (a) shows a subject's left ankle height to the ground at different
distances from the Kinect camera. Panel (b) shows the subject’s ankle Z-
axis distance from the Kinect camera ......................................................... 70
Figure 4:10. Determination of 𝜃 using hip and ankle joints ................................ 72
Figure 4:11. Step detection (foot-off and foot contact) process flowchart .......... 73
Figure 4:14. Network connection diagram including outgoing and incoming data
packets over the internet............................................................................. 74
Figure 4:15. Design of the system’s companion smartphone application .......... 75
Figure 4:16. Graphical User Interface for the developed software ..................... 76
Figure 4:17. Vertical angle determination .......................................................... 78
Figure 4:18. Subject’s lower body joints distance to the Kinect camera in the Z-
axis during a walking session ..................................................................... 79
Figure 4:19. Subject’s left foot distance to the camera in Z-axis using Kinect v2
and Vicon T10 ............................................................................................. 79
Figure 4:20. Horizontal angle determination (note that Kinect sees a mirrored
image thus shoulders are reversed) ........................................................... 80
Figure 4:21. Developed prototype of the automatic visual cue system. a) The two
step motors controlling the horizontal and vertical alignment of the system.
b) A top view of the Kinect v2 combined with the micro controller and voltage
regulators c) A view of the prototype system in action ................................ 82
xii | P a g e
Figure 4:22. Schematic diagram of the designed prototype hardware ............... 83
Figure 4:12. The testing environment: the subject is walking diagonally towards
the Kinect camera while his body joints are being tracked ......................... 88
Figure 4:13. 3D data acquisition using Kinect v2 and Vicon T10 cameras ........ 89
Figure 5:1. System Performance in FPS ............................................................ 91
Figure 5:2. Heuristic – Subject’s head fall velocity (true positives and false
positives are shown as green and red circles, respectively) ....................... 92
Figure 5:3. Heuristic – Subject’s head height to floor ......................................... 93
Figure 5:4. Heuristic – Filtered true positive fall detection’s confidence level (true
positives are shown as green circles) ......................................................... 93
Figure 5:5. Machine learning – Subject’s fall velocity threshold confidence level
(false positives and true positives are shown as red and green circles,
respectively) ................................................................................................ 95
Figure 5:6. Machine learning – Subject’s distance to the ground confidence level
.................................................................................................................... 95
Figure 5:7. Number of true positives and flase positives detected by Kinect based
on the size of the training dataset [113] ...................................................... 96
Figure 5:8. Machine learning – Fall detection overall confidence from combining
the threshold fall velocity and distance to the floor factors (false positives
and true positives are shown as red and green circles, respectively) ......... 97
Figure 5:9. Machine learning – Filtered fall detections’ confidence level (true
positives and false positives are shown as green and red circles,
respectively) ................................................................................................ 97
Figure 5:10. Subject's left ankle height to the ground at different distances from
the Kinect camera after correction algorithm was applied. The dotted line
represents the subject’s actual ankle height in stand still position .............. 99
Figure 5:11. Comparison between the original and corrected subject ankle’s
height and the effect of the joint to the camera. ........................................ 100
Figure 5:12. Kinect data collection accuracy before and after the correction
algorithm being applied at different angle to the ground. The dotted line
represents the subject’s actual ankle height in stand still position. ........... 106
Figure 5:13. Knee joint angle value during a gait cycle .................................... 109
Figure 5:14. Knee joint angle and its distance to the camera during a gait cycle
.................................................................................................................. 109
Figure 5:15. Ankle joint distance-to-ground value during a gait cycle .............. 110
xiii | P a g e
Figure 5:16. Vertical servo motor angle relation to the subject’s foot joint distance
to the Kinect camera in Z-axis .................................................................. 111
Figure 5:17. Horizontal servo motor angle changes according to the subject’s
body orientation and direction during a test .............................................. 112
Figure 5:18. A PD patient volunteering to try out the system’s capabilities in
detecting FOG. Visual cues are projected in front of him, on the floor based
on his whereabouts ................................................................................... 114
Figure 5:19. System’s companion smartphone application in action................ 115
xiv | P a g e
Equations
Equation 4:1. The scalar equation of plane ........................................................ 59
Equation 4:2. The Kinect’s skeletal joint distance to the ground ........................ 60
Equation 4:3. The Kinect’s skeletal joint velocity................................................ 60
Equation 4:4. Correlation between a joint’s Z-axis and Y-axis ........................... 66
Equation 4:5. Corrected value for a joint’s Y-axis .............................................. 66
Equation 4:6. Joint distance-to-ground correction technique ............................. 67
Equation 4:7. Knee joint 3D angle determination ............................................... 72
Equation 4:8. Horizonal Servo Motor Angle Determination ................................ 80
Tables
Table 3:1. Microsoft Kinect Specifications [85][89]............................................. 42
Table 3:2. Open Source Kinect Drivers and SDKs ............................................. 45
Table 3:3. Comparison of OpenNI and Microsoft Kinect SDK ............................ 48
Table 4:1. Test Subjects’ Characteristics (n=11; 8 males, 3 females) ............... 64
Table 4:2. Patients Participants (* indicates those who volunteered to try them
system) ....................................................................................................... 85
Table 5:1. Frame rate comparison of different Kinect v1 capturing settings ...... 90
Table 5:2. Heuristic and machine learning fall detection success rate comparison
.................................................................................................................... 98
Table 5:3. Kinect v2 accuracy in detecting subjects’ ankle height before and after
the correction algorithm being applied ...................................................... 107
Table 5:4. Focus Group Questioner Feedback ................................................ 116
xv | P a g e
Abbreviations
AAL Ambient Assisted Living
ADC analogue-to-digital converter
ALF Assisted Living Facilities
API Application Programming Interface
CMOS Complementary metal–oxide–semiconductor
DLL Dynamic-Link Library
FOG Freezing of Gait
FPS Frame per second
GUI Graphical User Interface
IR Infrared
MOA-B Monoamine oxidase-B
PCM pulse code modulation
PD Parkinson's Disease
PwP People with Parkinson’s
RGB Red Green Blue
ROS Robot Operating System
SD Standard Deviation
SDK Software Development Kit
SMLD subject mounted light device
SVM Support Vector Machine
ToF Time-of-Flight
USB Universal Serial Bus
VCS Virtual Cueing Spectacles
VGA Video Graphics Array
VGB Visual Gesture Builder
WPF Windows Presentation Foundation
xvi | P a g e
Publications
[1] A. Amini; K. Banitsas, “A Prototype System Using Microsoft Kinect to
Recognize Freezing of Gait in Parkinson’s Disease Patients,” in International
Conference of the IEEE Engineering in Medicine and Biology Society (EMBC),
Chicago, Illinois, USA, 2014.
[2] A. Amini, “An Unobtrusive System For Detecting Parkinson’s FOG
Episodes,” in 7th Annual Student Research Conference (ResCon’14), London,
UK, 2014.
[3] A. Amini; K. Banitsas; A. Badii; j.Cosmas, “Recognition of Postures and
FOG on Parkinson’s Disease Patients Using Microsoft Kinect Sensor,” in
International IEEE EMBS Neural Engineering Conference, Montpellier, France,
2015.
[4] A. Amini; K. Banitsas; j.Cosmas, “A comparison between heuristic and
machine learning techniques in fall detection using Kinect v2” in 2016 IEEE
International Symposium on Medical Measurements and Applications (MeMeA),
Benevento, Italy, 2016.
[5] A. Amini; K. Banitsas; S. Hosseinzadeh, “A New Technique for Foot-Off
and Foot Contact Detection in a Gait Cycle Based on the Knee Joint Angle Using
Microsoft Kinect v2” in 2017 IEEE International Conference on Biomedical and
Health Informatics (BHI), Orlando, FL, USA, 2017.
[6] A. Amini, K. Banitsas, W. R. Young, “Kinect4FOG: Monitoring and
Improving Mobility in People with Parkinson’s using a Novel system incorporating
the Microsoft Kinect v2” Disability and Rehabilitation: Assistive Technology (Under
Review).
[7] A. Amini, K. Banitsas, A. A. Amini Maghsoud Beigi, “An Improved
Technique for Increasing the Accuracy of Joint-to-Ground Distance Tracking in
Kinect v2 for Foot-Off and Foot Contact Detection” The Imaging Science Journal
(Under Review).
[8] A. Amini, K. Banitsas, “Using Kinect v2 to Control a Laser Visual Cue
System for Parkinson’s Disease Patients” Assistive Technology Journal (Under
Review).

17 | P a g e

18 | P a g e
1 Chapter 1: Introduction
1.1 Motivation
One of the main physical symptoms among PwP is FOG. Studies have shown that
a visual aid projected in front of a patient (e.g. lines, stairs, etc.) experiencing such
episodes could be beneficial to the “unfreezing” of those patients.
At the same time and within the last three years, there was an unparalleled bloom
in gaming machines capable of detecting the gamer and his/her gestures. The
most famous of these is the Microsoft Kinect that, although initially developed as
a “wireless joystick”, soon found its way into many other applications, including
medicine, healthcare, rehabilitation, etc.
This research proposes a system that takes advantage of the abilities of a
Microsoft Kinect, to improve the mobility and locomotion of PwP experiencing FOG
episodes. Moreover, it provides a facility for healthcare providers and doctors to
monitor the gait performance of their patients remotely. Additionally, the system
can detect fall incidents that are common among PwP and inform the people
responsible to take further actions if required.
1.2 Parkinson’s Disease
Parkinson’s disease (PD), caused by the depletion of dopamine in the substantia
nigra, is a degenerative neurological condition affecting the initiation and control
of movements, particularly those related to walking [1], [2]. There are many
physical symptoms associated with PD including akinesia, hypokinesia, and
Bradykinesia [3]. An additional symptom is FOG, usually presenting in advanced
stages of Parkinson’s [4]–[7]. FOG is one of the most debilitating and least
understood symptoms associated with Parkinson’s. It is exacerbated by several
factors including the need to walk through narrow spaces, turning as well as
stressful situations [7], [8].
19 | P a g e
Figure 1:1. The effect of PD (depletion of dopamine in the substantia nigra) on human brain [9]
1.3 Freezing of Gait (FOG)
FOG is one of the most disabling symptoms in PD that affect its sufferers by
impacting their gait performance and locomotion. FOG is an episodic phenomenon
that prevents the initiation or continuation of a patient’s locomotion and usually
occurs in latter stages of PD where patients' muscles freeze in place as they are
trying to move [1], [6], [7], [10].
FOG and associated incidents of falling often incapacitate PwP and, as such, can
have a significant detrimental impact at both a physical and psychological level [6].
Consequently, the patient's quality of life decreases and health care and treatment
expenditures increase substantially [11]. A research study conducted by the
University of Rochester's Strong Memorial Hospital [12] showed that
approximately 30 % of PwP experience sudden, unexpected freezing episodes,
thus highlighting the high level of dependency that many PwP have on physical or
psychological strategies that may assist in alleviating FOG and help people start
walking again.

20 | P a g e
Figure 1:2. PD physical symptoms [9]
1.4 Possible Treatments
There is no proven therapy to eradicate the PD or slow down its progression. As
a result, the focus of the medical therapy is on the treating or reducing the effect
of its symptoms [13]. There are different treatments available to improve PwP living
standards and help deal with the symptoms including supportive therapies,
medications and surgery.
Supportive therapies focus towards pain relieve using different methods including
physiotherapy that relieves joint pain and muscle stiffness as well as exercises
and occupational therapy that provide support for day-to-day activities of PwP and
programmes that help them maintain their independence. Moreover, supportive
therapies also cover dietary advice that would be beneficial to some extent for
symptom relieve. Lastly, speech and language therapy can also help PwP
improving speech impairment caused by the disease or reduce the patient’s
swallowing difficulties (dysphagia), also related to PD [14].
Medication are also beneficial in reducing the frequency or effect of PD’s main
symptoms including FOG and tremors. Nonetheless, there usually are possible
21 | P a g e
short and long-term side effects in these methods. The three types of the
mainstream medication for PwP are [14]:
• Levodopa
Levodopa help the increase of dopamine production by the nerve cells; an agent
for message transmission between brain parts and nerves responsible of
controlling movement. Consequently, this would improve the patient’s movement
irregularities and locomotion [13] [15].
• Dopamine agonists
These chemical act as a substitute for the imbalanced dopamine level in the brain,
that yields similar effect as levodopa. Dopamine agonists could have many side
effects including hallucinations and confusion [13], [15].
• Monoamine oxidase-B inhibitors
Monoamine oxidase-B (MOA-B) inhibitors aim at blocking the effect of an enzyme
responsible of breaking down dopamine. As a result, the dopamine level would be
increased. MOA-B can improve the PD symptoms and can be prescribed to be
used alongside other medications such as dopamine agonists or levodopa [13],
[15].
Finally, a pulse generator can be surgically implanted into the subject’s chest wall
connected using wires to a specific part of the brain. This acts as a deep brain
stimulation that produces a tiny electrical current which stimulates the brain in
order to ease PD symptoms [16].
1.4.1 Sensory Stimulation
Many studies suggest that auditory [17]–[20] and visual cues [10], [19]–[31] can
improve PwP’s gait performance, especially during FOG. Rubinstein et al., [32],
observed that in the presence of an external ’movement trigger’ (i.e., a sensory
cue), a patient’s self-paced actions such as walking, can be significantly improved;
a phenomenon known as ‘kinesia paradoxica’.
22 | P a g e
1.5 Research Question
This study investigates the question of whether it is feasible to implement an
unobtrusive approach for real-time FOG monitoring, by utilising commercially
available 3D camera sensors based on the Microsoft Kinect architecture. The
research also studied the applicability of using the 3D sensing cameras in
conjunction with a moving laser projection system acting as a visual cue with the
aim of decreasing the frequency/duration of “freezing” episodes and improving the
mobility of patients diagnosed with Parkinson's disease. Studies have shown that
such an approach will be beneficiary on reducing the FOG episodes in PwP, both
in frequency and in duration. The system can also detect fall incidents that are
common among Parkinson’s disease patients and automatically alert
relatives/healthcare providers.
1.6 Aims and Objectives
The main aim of this study is to research on an affordable, reliable, and
unobtrusive system for monitoring/detecting FOG and fall incidents in PwP as well
as to provide mobility improvement and locomotion enhancement during a FOG
incident using an automatic and dynamic visual cueing system based on laser
projection. Additionally, different methods in detecting a subject’s footsteps, an
important part in unobtrusive FOG detection, is presented and evaluated.
The individual objectives of the project are:
• To improve PwP locomotion with an automatic and dynamic visual cue system.
• To build a user interface for healthcare providers and doctors to monitor the
patients’ activities remotely and get notification should a critical incident such
as unrecoverable fall happens.
• To investigate, through a focus group of real PwP on how such a combination
of discreet and inexpensive hardware can possibly assist PwP that have
frequent FOG episodes.
• To use a 3D sensing technology such as a Microsoft Kinect sensor to detect
and monitor PD FOG and fall incidents unobtrusively.

23 | P a g e
The proposed research focuses on the sensory stimulation therapy and
rehabilitations side of the PD treatment using laser-based visual cues. In
conjunction with the current system, the project’s researchers developed a
companion smartphone application and a client software that enables doctors,
healthcare providers and family members to monitor and receive notifications
regarding possible incidents. Upon the detection of a fall, the system can
automatically capture the event alongside an appropriate time stamp and notify a
relevant person via email, live video feed (through the smartphone companion
app), skype conversation or developed client software.
1.7 Contributions to Knowledge
This research study leads to improve upon existing and previous works by:
• Introducing two new footstep detection techniques one based on the
subject’s knee angle and one based on the subject’s ankle vertical height
to the ground; Reducing the Microsoft Kinect’s intrinsic inaccuracies in
skeletal data reading for the subject’s ankle vertical height to the ground
footstep detection technique; resulting in the increase in accuracy for the
footstep detection algorithm by introducing a new correction algorithm.
• Providing an automatic and remotely manageable monitoring system for
PwP gait analysis and fall detection.
1.8 Thesis Structure
This thesis consists of six chapters supplemented by references and appendices.
The outline and a brief description of each chapter are as follow:
Chapter 2: This chapter evaluates similar studies carried out in the field. these will
be analysed, and their shortcomings will be discussed.
Chapter 3: This chapter focuses on the description of technical terms and
technologies used in this project. Different technologies will be analysed and
evaluated. Their advantages and disadvantages will also be discussed.

24 | P a g e
Chapter 4: This section focuses on the implementation phase of the proposed
approach including the execution of the prototype system both in hardware and
software level. Moreover, the algorithm employed in this study will also be
discussed.
Chapter 5: The aim of this chapter is to discuss the outcomes of this research
including the empirical results and evaluation of the research study product. The
data will be compared against the initial requirements and the aims and objectives
of the project and its effectiveness will also be discussed.
Chapter 6: In the final chapter the project carried out will be summarised and
compared against the initial aims. Additionally, the obstacles and issues
encountered during the project development as well as the future works would be
discussed.
25 | P a g e
2 Chapter 2: Literature Review
2.1 Introduction
This literature review covers the existing research and studies that focused on
similar field as this research. Different studies in fall detection, especially in PwP
will be analysed; Solutions based on visual cue for locomotion improvement during
a FOG for PwP as well as systems for rehabilitations and monitoring of these
patients are reviewed. Approaches towards detecting PD symptoms including
FOG are discussed including sensor-based and computer vision methods.
Moreover, different procedures that help detecting FOG based on computer vision
approach such as footstep detection are evaluated. Finally, these studies are then
analysed, and their possible shortcomings will be discussed.
2.2 The Effect of Visual Cue on PD Locomotion
Many previous studies have developed methods for monitoring FOG behaviours
and intervening to improve motor symptoms with the use of external visual cues.
Many studies utilised computer vision technologies to minimize the need for
patients to wear measurement devices, which can be cumbersome and also have
potential to alter a person’s movement characteristics. Since the release of the
Microsoft Kinect camera several attempts have been made to use the Kinect
sensor as a non-invasive approach for monitoring PD-related gait disorders. Many
previous research studies have focussed on rehabilitation outcomes and
experimental methods for monitoring patients’ activities.
For instance, in Takač, et al., [33], a home tracking system was developed using
Microsoft Kinect sensors to help PwP who experience regular FOG. The research
interconnected multiple Kinect sensors together to deliver a wider coverage of the
testing environment. The model operated by collectively gathering data from
multiple Kinect sensors into a central computer and storing them in a centralised
database for further analysis and processing. The research employed a model
based on the subject’s histogram colour and height together with the known
average movement delays between each camera. Nonetheless, as a Kinect
26 | P a g e
camera produces a raw RGB data stream, analysing multiple Kinect colour data
stream for the histogram of colour in real-time requires a very powerful processor
and significant amount of computer memory. Moreover, the synchronisation
between each camera feed would add extra computation for this approach.
Previous research has demonstrated that dynamic visual cues (such as laser lines
projected on the floor) can deliver a profound improvement to walking
characteristics in PwP [20]. Furthermore, strong evidence now exists suggesting
that it is not only the presence of sensory information (or an external ‘goal’ for
movement) that ‘drives’ improvements/kinesia paradoxia, but rather the presence
of continuous and dynamic sensory information. This was first demonstrated by
Azulay et al., [34], who showed that the significant benefits to gait gained when
walking on visual stepping targets were lost when patients walked on the same
targets under conditions when the room was illuminated by strophic lighting; thus
making the visual targets appear static. Similar observations have also been made
in the auditory domain [3].
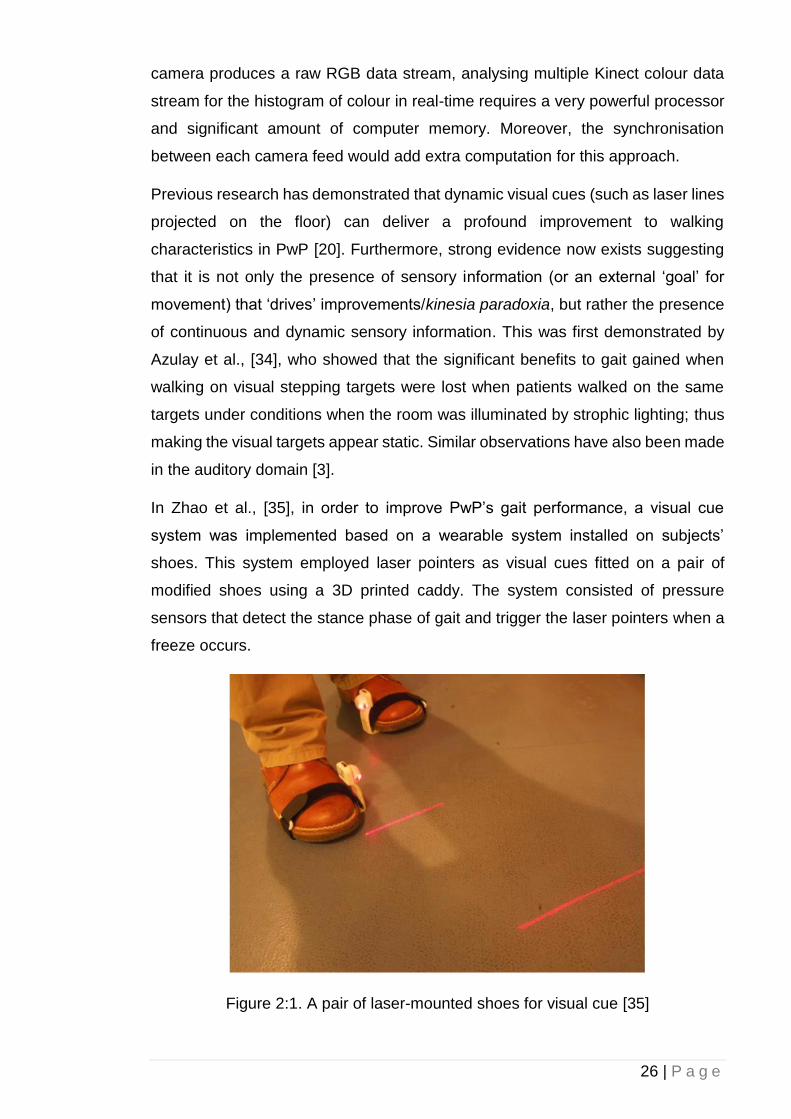
In Zhao et al., [35], in order to improve PwP’s gait performance, a visual cue
system was implemented based on a wearable system installed on subjects’
shoes. This system employed laser pointers as visual cues fitted on a pair of
modified shoes using a 3D printed caddy. The system consisted of pressure
sensors that detect the stance phase of gait and trigger the laser pointers when a
freeze occurs.
Figure 2:1. A pair of laser-mounted shoes for visual cue [35]
27 | P a g e
While effective and intuitive to use, the reliance on any attachable/wearable
apparatus can be cumbersome and also required users to remember to attach
appropriate devices, even around the house; where many people experience
significant problems with FOG at times when they are not wearing their shoes.
In another approach based on wearable devices [36], the effect of a subject
mounted light device (SMLD) projecting visual step length markers on the floor
was evaluated. The study showed that a SMLD induced a statically significant
improvement on subjects’ gait performance. Nevertheless, it was suggested that
the requirement of wearing SMLD might lead to practical difficulties both in terms
of comfort and on the potential for the devices impacting on patients’ movements
characteristics.
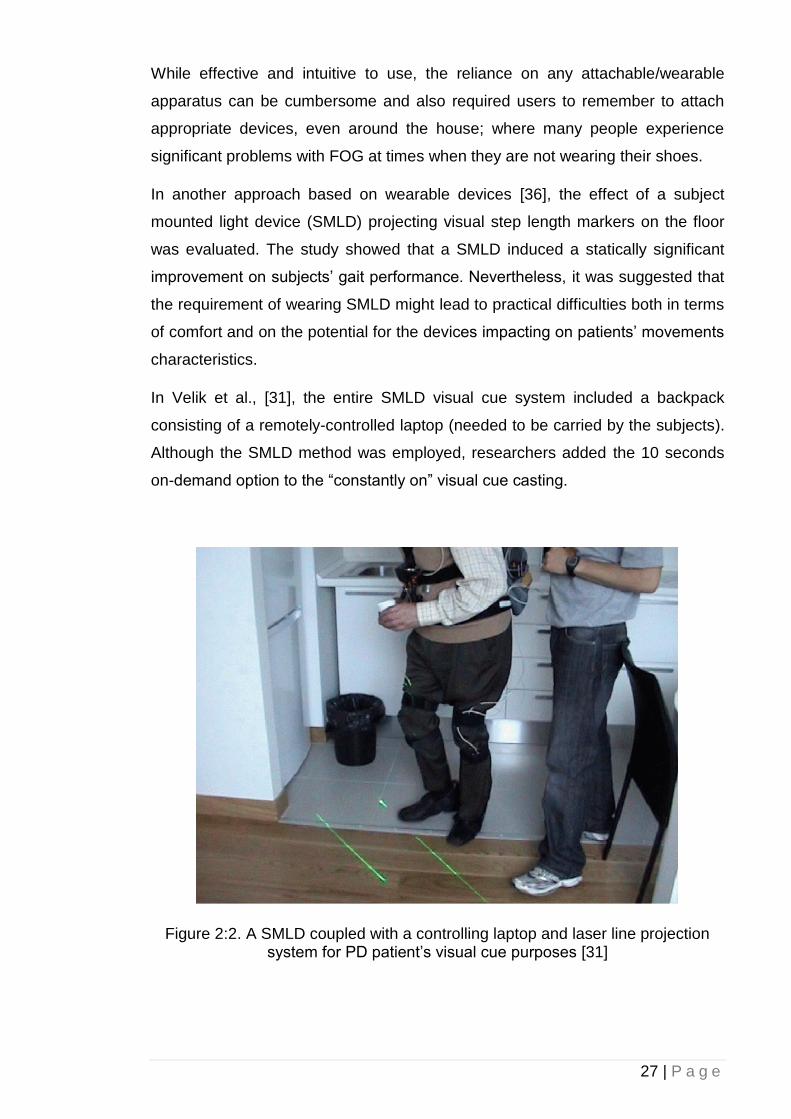
In Velik et al., [31], the entire SMLD visual cue system included a backpack
consisting of a remotely-controlled laptop (needed to be carried by the subjects).
Although the SMLD method was employed, researchers added the 10 seconds
on-demand option to the “constantly on” visual cue casting.
Figure 2:2. A SMLD coupled with a controlling laptop and laser line projection system for PD patient’s visual cue purposes [31]
28 | P a g e
Moreover, similar to the aforementioned technologies, the laser visual cues are
always turned on, regardless of the subject’s FOG status of gait performance.
McAuley et al., and Kaminsky et al., [22], [23], proposed the use of Virtual Cueing
Spectacles (VCS) that, similar to approaches that project targets on the floor;
project virtual visual targets on to a user’s spectacles. The use of VCS might
eliminate major disadvantages introduced by SMLD (or other wearable
approaches), but these systems still need to either be sensitive to a FOG onset,
or constantly turned on, even when not required.
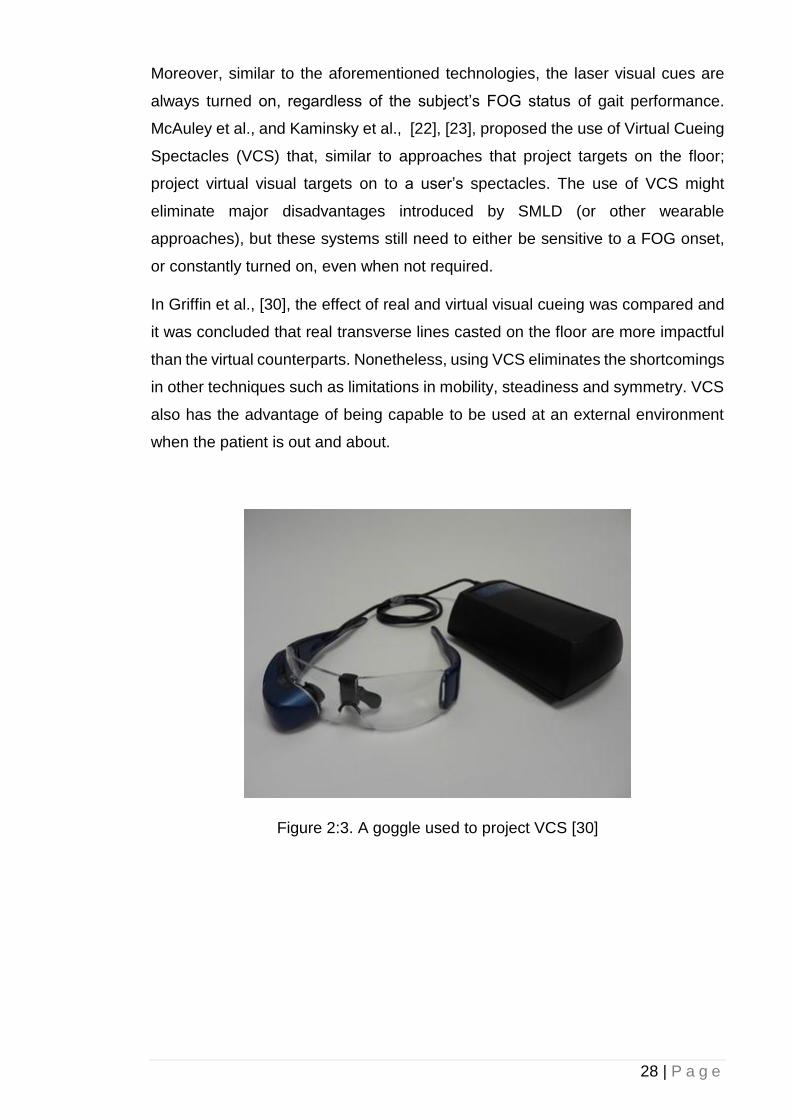
In Griffin et al., [30], the effect of real and virtual visual cueing was compared and
it was concluded that real transverse lines casted on the floor are more impactful
than the virtual counterparts. Nonetheless, using VCS eliminates the shortcomings
in other techniques such as limitations in mobility, steadiness and symmetry. VCS
also has the advantage of being capable to be used at an external environment
when the patient is out and about.
Figure 2:3. A goggle used to project VCS [30]
29 | P a g e
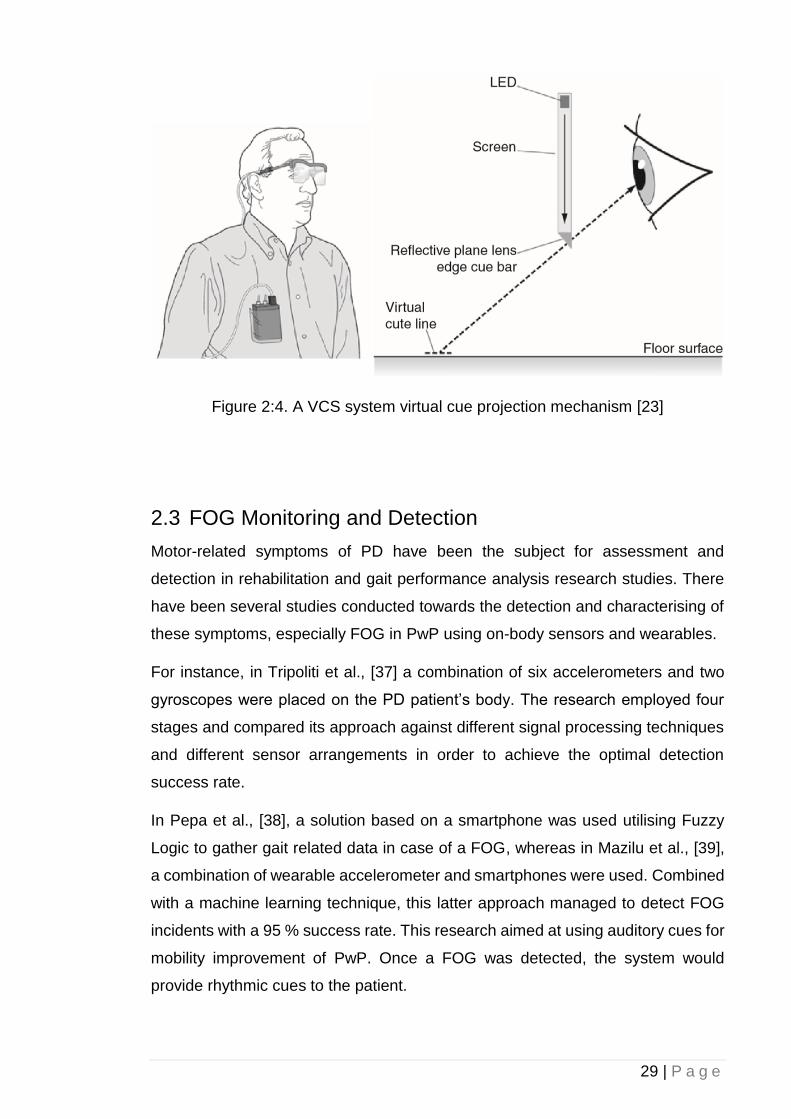
Figure 2:4. A VCS system virtual cue projection mechanism [23]
2.3 FOG Monitoring and Detection
Motor-related symptoms of PD have been the subject for assessment and
detection in rehabilitation and gait performance analysis research studies. There
have been several studies conducted towards the detection and characterising of
these symptoms, especially FOG in PwP using on-body sensors and wearables.
For instance, in Tripoliti et al., [37] a combination of six accelerometers and two
gyroscopes were placed on the PD patient’s body. The research employed four
stages and compared its approach against different signal processing techniques
and different sensor arrangements in order to achieve the optimal detection
success rate.
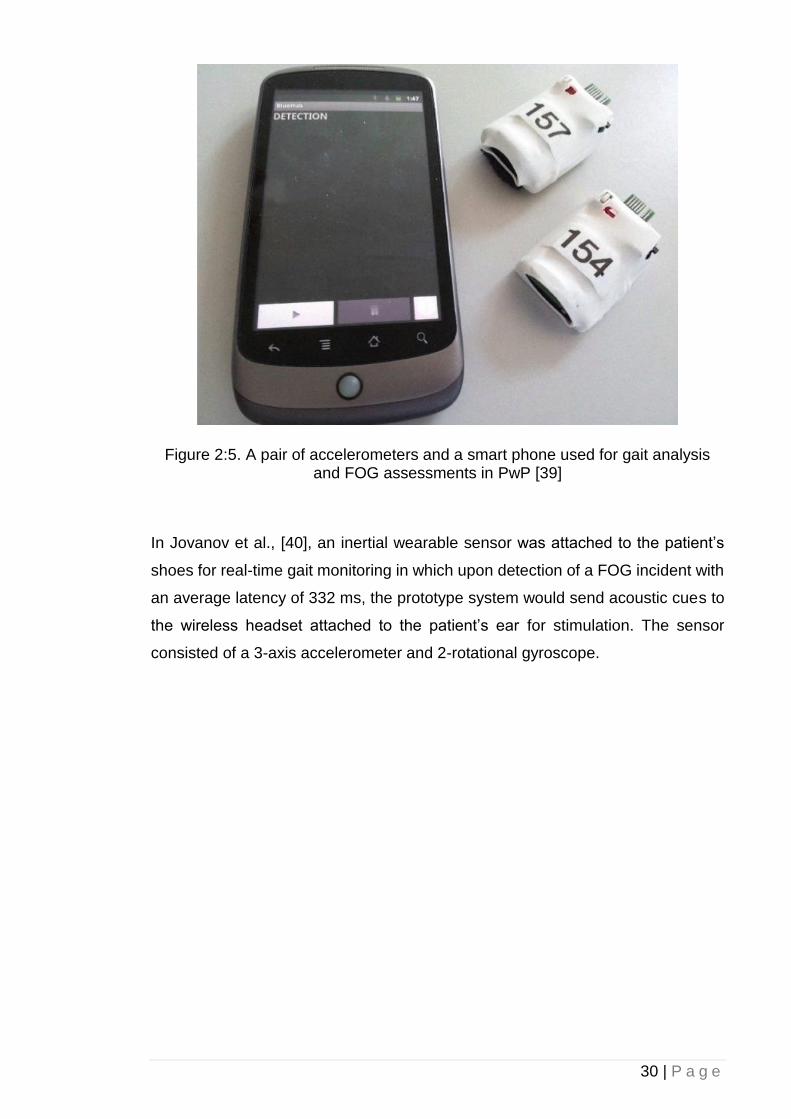
In Pepa et al., [38], a solution based on a smartphone was used utilising Fuzzy
Logic to gather gait related data in case of a FOG, whereas in Mazilu et al., [39],
a combination of wearable accelerometer and smartphones were used. Combined
with a machine learning technique, this latter approach managed to detect FOG
incidents with a 95 % success rate. This research aimed at using auditory cues for
mobility improvement of PwP. Once a FOG was detected, the system would
provide rhythmic cues to the patient.
30 | P a g e
Figure 2:5. A pair of accelerometers and a smart phone used for gait analysis and FOG assessments in PwP [39]
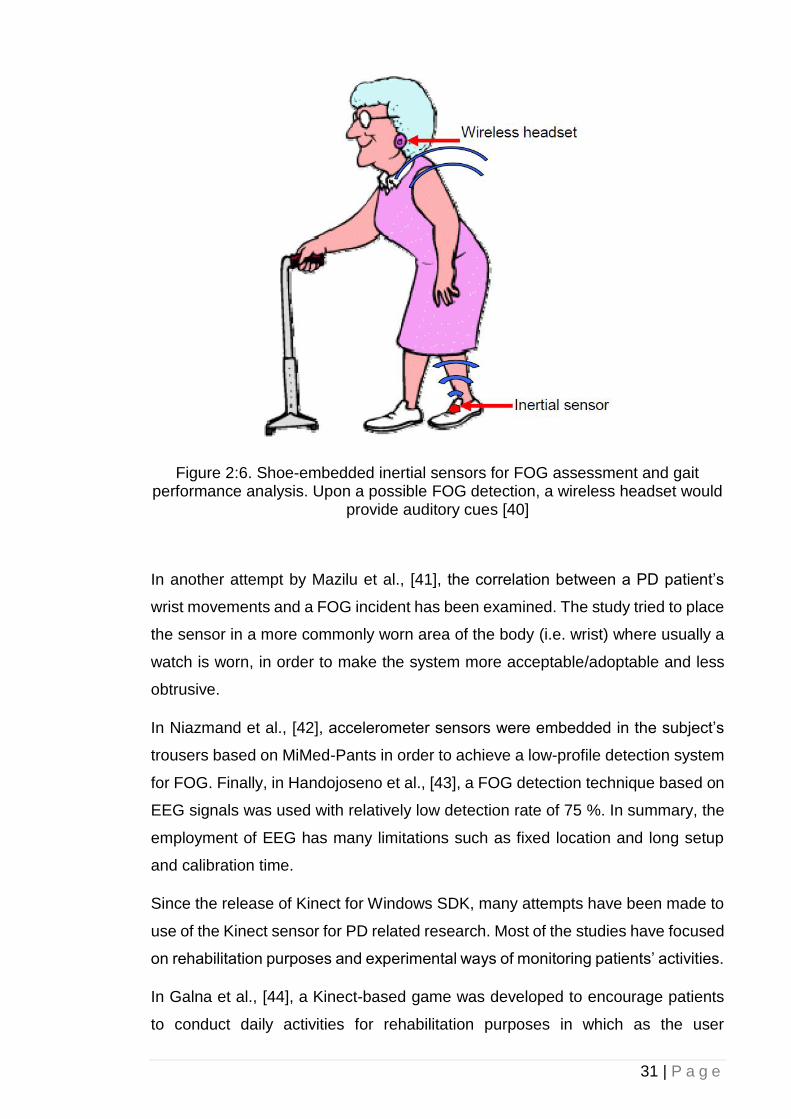
In Jovanov et al., [40], an inertial wearable sensor was attached to the patient’s
shoes for real-time gait monitoring in which upon detection of a FOG incident with
an average latency of 332 ms, the prototype system would send acoustic cues to
the wireless headset attached to the patient’s ear for stimulation. The sensor
consisted of a 3-axis accelerometer and 2-rotational gyroscope.
31 | P a g e
Figure 2:6. Shoe-embedded inertial sensors for FOG assessment and gait performance analysis. Upon a possible FOG detection, a wireless headset would
provide auditory cues [40]
In another attempt by Mazilu et al., [41], the correlation between a PD patient’s
wrist movements and a FOG incident has been examined. The study tried to place
the sensor in a more commonly worn area of the body (i.e. wrist) where usually a
watch is worn, in order to make the system more acceptable/adoptable and less
obtrusive.
In Niazmand et al., [42], accelerometer sensors were embedded in the subject’s
trousers based on MiMed-Pants in order to achieve a low-profile detection system
for FOG. Finally, in Handojoseno et al., [43], a FOG detection technique based on
EEG signals was used with relatively low detection rate of 75 %. In summary, the
employment of EEG has many limitations such as fixed location and long setup
and calibration time.
Since the release of Kinect for Windows SDK, many attempts have been made to
use of the Kinect sensor for PD related research. Most of the studies have focused
on rehabilitation purposes and experimental ways of monitoring patients’ activities.
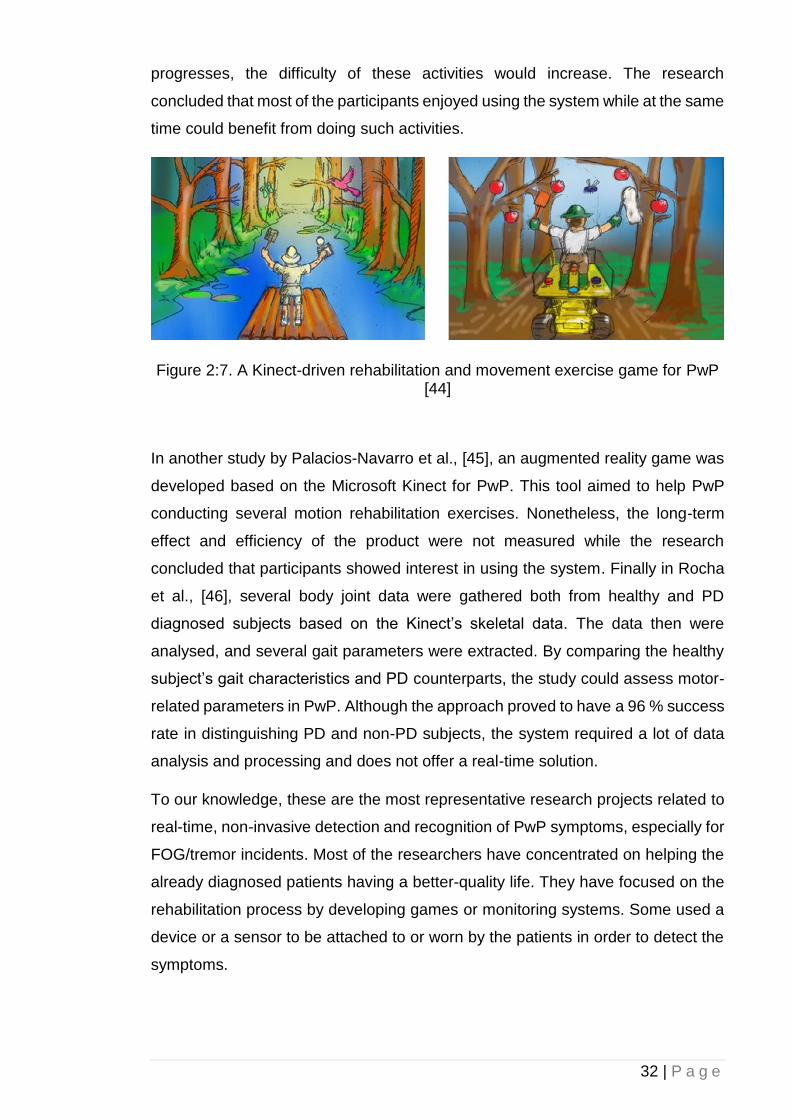
In Galna et al., [44], a Kinect-based game was developed to encourage patients
to conduct daily activities for rehabilitation purposes in which as the user
32 | P a g e
progresses, the difficulty of these activities would increase. The research
concluded that most of the participants enjoyed using the system while at the same
time could benefit from doing such activities.
Figure 2:7. A Kinect-driven rehabilitation and movement exercise game for PwP [44]
In another study by Palacios-Navarro et al., [45], an augmented reality game was
developed based on the Microsoft Kinect for PwP. This tool aimed to help PwP
conducting several motion rehabilitation exercises. Nonetheless, the long-term
effect and efficiency of the product were not measured while the research
concluded that participants showed interest in using the system. Finally in Rocha
et al., [46], several body joint data were gathered both from healthy and PD
diagnosed subjects based on the Kinect’s skeletal data. The data then were
analysed, and several gait parameters were extracted. By comparing the healthy
subject’s gait characteristics and PD counterparts, the study could assess motor-
related parameters in PwP. Although the approach proved to have a 96 % success
rate in distinguishing PD and non-PD subjects, the system required a lot of data
analysis and processing and does not offer a real-time solution.
To our knowledge, these are the most representative research projects related to
real-time, non-invasive detection and recognition of PwP symptoms, especially for
FOG/tremor incidents. Most of the researchers have concentrated on helping the
already diagnosed patients having a better-quality life. They have focused on the
rehabilitation process by developing games or monitoring systems. Some used a
device or a sensor to be attached to or worn by the patients in order to detect the
symptoms.
33 | P a g e
2.3.1 Footstep detection
Detecting footsteps plays an important role in gait cycle analysis and rehabilitation
purposes, as many diseases feature physical symptoms, especially gait disorders.
Having an unobtrusive gait detection system can significantly improve the
accuracy of footsteps analysis, as due to the nature of the case, on-body sensors
can sometimes be problematic and have a direct effect on the gait performance
and behaviour. Different methods have been used in extracting accurate
information related to footstep detection such as pressure-based mapping, in
which foot contacts and foot-offs can be detected based on the variance in
pressure in different areas of a foot sole [47], [48], inertial-based sensing using
different wearable sensors attached to the body [68], [75], [76], instrumented
treadmills [51]–[53] and computer vision [54], [55]. Most methods in gait analysis,
especially footstep detection, are obtrusive and expensive to implement.
As an alternative approach to the aforementioned techniques, one could consider
the employment of unobtrusive depth cameras such as Microsoft Kinect v2. As the
Kinect was designed as a replacement for conventional game controllers, it is very
effective in reading body joints data, especially from upper extremities that are
more active in a gaming session. Nevertheless, due to the Kinect’s intrinsic
inaccuracies in data acquisition, particularly for lower extremities [56], innovative
approaches have been made to compensate these issues. Moreover, due to the
nature of some degenerative diseases such as PD that feature gait related
symptoms including FOG, minor inaccuracies either greatly affect the data
collection or render the entire acquired data unusable.
Since the introduction of the Microsoft Kinect sensor, many studies have been
conducted based on the Kinect camera with regards to gait performance analysis
[57]–[63]. Nonetheless, the Kinect skeletal-based detection of footsteps in
particular, is a challenging feat due to Kinect’s margin of error, especially for lower
extremities [61]. Additionally there are disadvantages to this method such as
higher computational power required for signal analysis and image processing and
intrinsic data acquisition inaccuracies, especially in Kinect sensors [64]. Moreover,
Kinect v2 in particular, lacks built-in features available in the first iteration of Kinect
such as ‘Joint Filtering’ that could compensate the sensor’s erroneous data
acquisition to some extent. This led to some innovation methods to compensate
the Kinect’s aforementioned inaccuracies. For instance, in Ahmed et al., [65], a
new Kinect-based gait recognition technique was used in which human gait
34 | P a g e
signatures were analysed using spatio-temporal changes in different skeletal
joints’ angles. Having a joint relative angle for stride detection eliminates the Kinect
sensor’s inaccuracies caused the subject’s direction or distance from the camera
[59], [66]–[68]. The research used the spine joint as the reference point as its
relative 3D coordination remains almost stationary during a gait cycle.
Nevertheless, by employing such a technique, foot contacts and foot-offs phases
will not be directly detected, but instead be estimated based on the distance and
angle of skeletal joints.
In Auvinet et al., [69], heel-strikes were estimated by calculating the distance
between knees’ joint centre along the longitudinal walking axis. To eliminate the
Kinect depth-map inaccuracies in localising joints according to a subject’s distance
from the sensor during a gait cycle (especially for foot contact detection [61]), knee
height was estimated based on anthropometric data. In another attempt by Geerse
et al., [70], a series of four Kinect v2 sensors were placed in pre-determined
locations to compensate each Kinect’s depth inaccuracies in farther distances and
have an overall wider range of coverage. This method provided promising results
but at the expense of using an array of Kinect v2 cameras that required precise
alignment between each sensor and increased the cost considerably. Xu et al.,
[71] used a Kinect camera mounted on a treadmill while the subject performed gait
cycles in order to keep the subject’s distance to the camera consistent. In Sun et
al., [72] a rather innovative technique was employed by putting the subject in a
Kinect-mounted cart to keep the subject’s distance from the Kinect consistent while
walking.
Most of the aforementioned methods can affect gait performance accuracy as they
influence the subject’s natural way of walking, while others require expensive or
difficult-to-implement improvisations. More importantly, some gait performance
analysis and step-detection scenarios such as detecting FOG in PwP, mandate
precise data reading; minor inaccuracies in joint localisation, may render the entire
data reading pointless. This research on the other hand, analyses the data
gathered from different subjects in different conditions in order to correct the
Kinect’s joint-to-ground distance data reading issues according to camera’s 3D
Cartesian Z-axis.
This research proposed two new techniques in footstep detection, one using
skeletal data and plane detection technique and another approach that is solely
based on the subject’s knee joint angle to determine foot-offs and foot contacts,
35 | P a g e
regardless of the changes of signal acquisition accuracy due to the subject’s
location or distance to the camera in a 3D environment. The research also
evaluated the data gathered from different subjects in different conditions in order
to correct the Kinect’s joint-to-ground distance data reading issues according to
camera’s 3D Cartesian Z-axis.
2.4 Fall Monitoring and Detection
Similar to the technological developments described above, several attempts have
been made to design automated methods for detecting falls in older adults based
on a variety of techniques such as wearable devices [73]–[76] and computer vision
[77]–[79]. As falls are a major problem in PwP with FOG (during 2017 it was
determined to be a top research priority for Parkinson’s UK [80]), such
developments are particularly relevant, and should ideally be integrated with
attempts to provide sensory cues for movement. The Microsoft Kinect was also
used as a non-invasive approach for fall detection. Different techniques were used
for fall detection such as the use of Kinect depth sensor [79], [81], skeleton tracking
[58] and subject-to-floor distance determination. Additionally, some used a single
Kinect sensor while some employed a system of multi-Kinect configuration to have
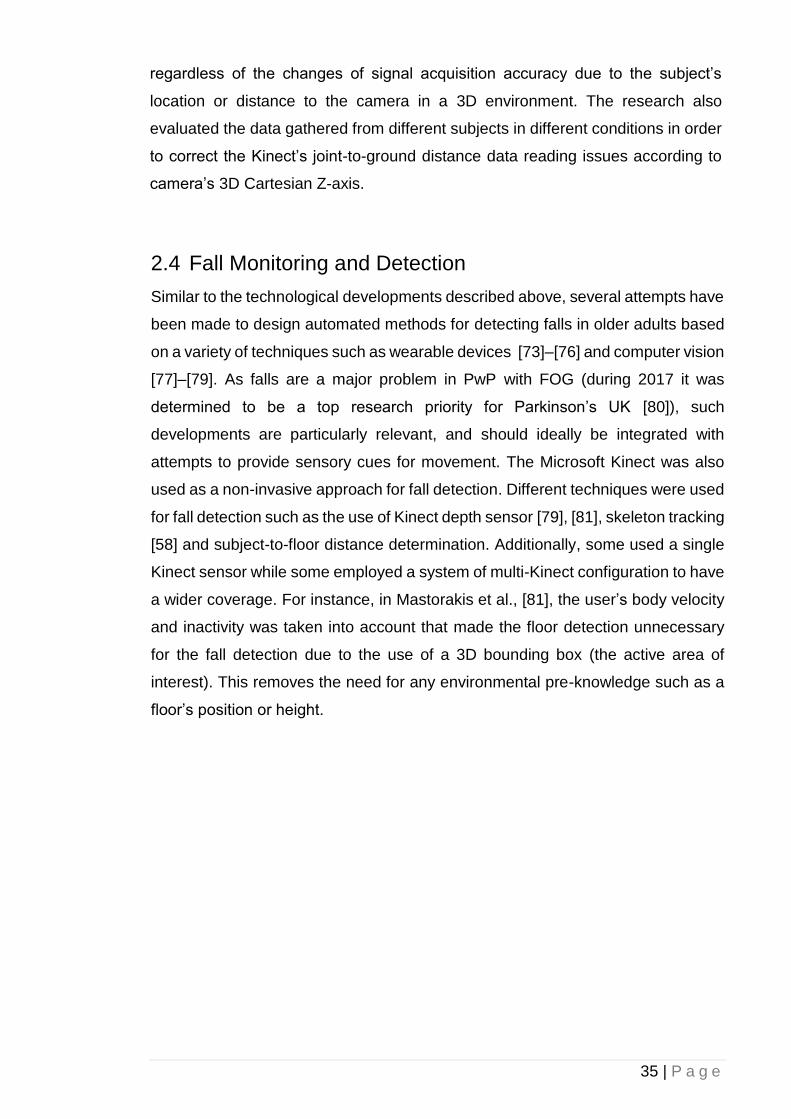
a wider coverage. For instance, in Mastorakis et al., [81], the user’s body velocity
and inactivity was taken into account that made the floor detection unnecessary
for the fall detection due to the use of a 3D bounding box (the active area of
interest). This removes the need for any environmental pre-knowledge such as a
floor’s position or height.
36 | P a g e
Figure 2:8. Subject’s fall and inactivity detection based on 3D bounding box [81]
Moreover, in Stone et al., [77], an algorithm was developed that determines a
subject’s vertical state in each frame to trigger a detected fall using a decision tree
and feature extraction. The research used 454 simulated falls and nine real fall
incidents for the trial.
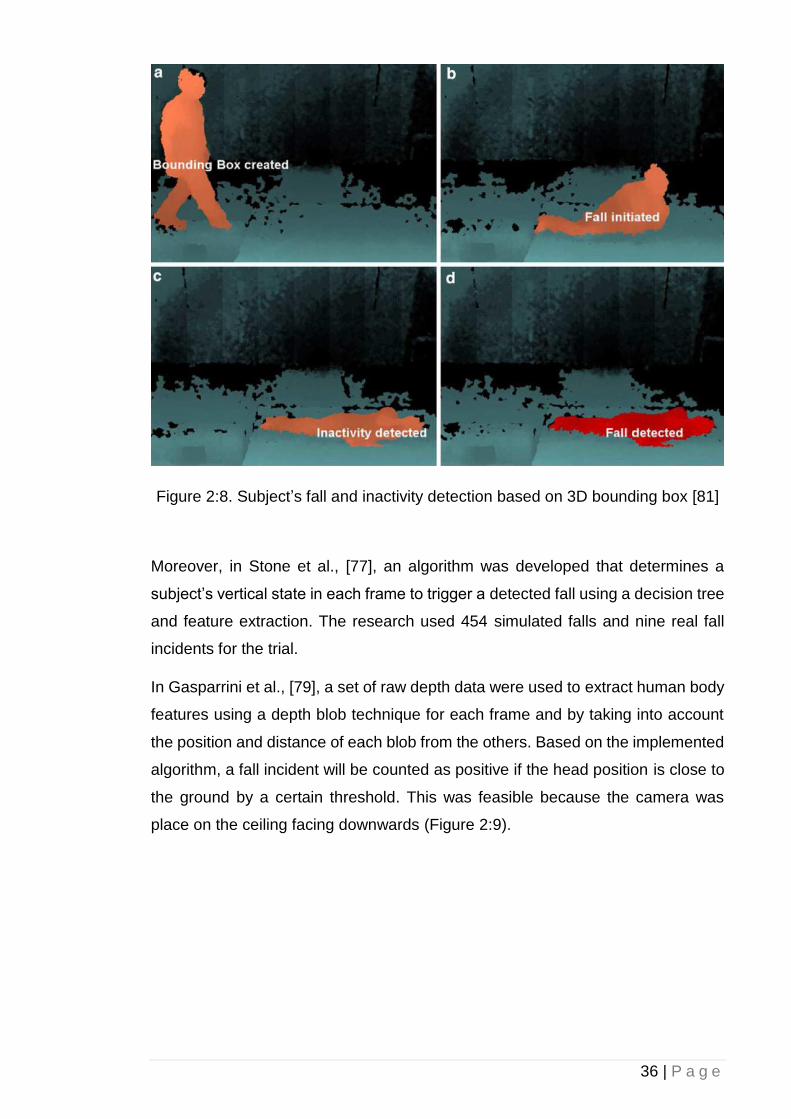
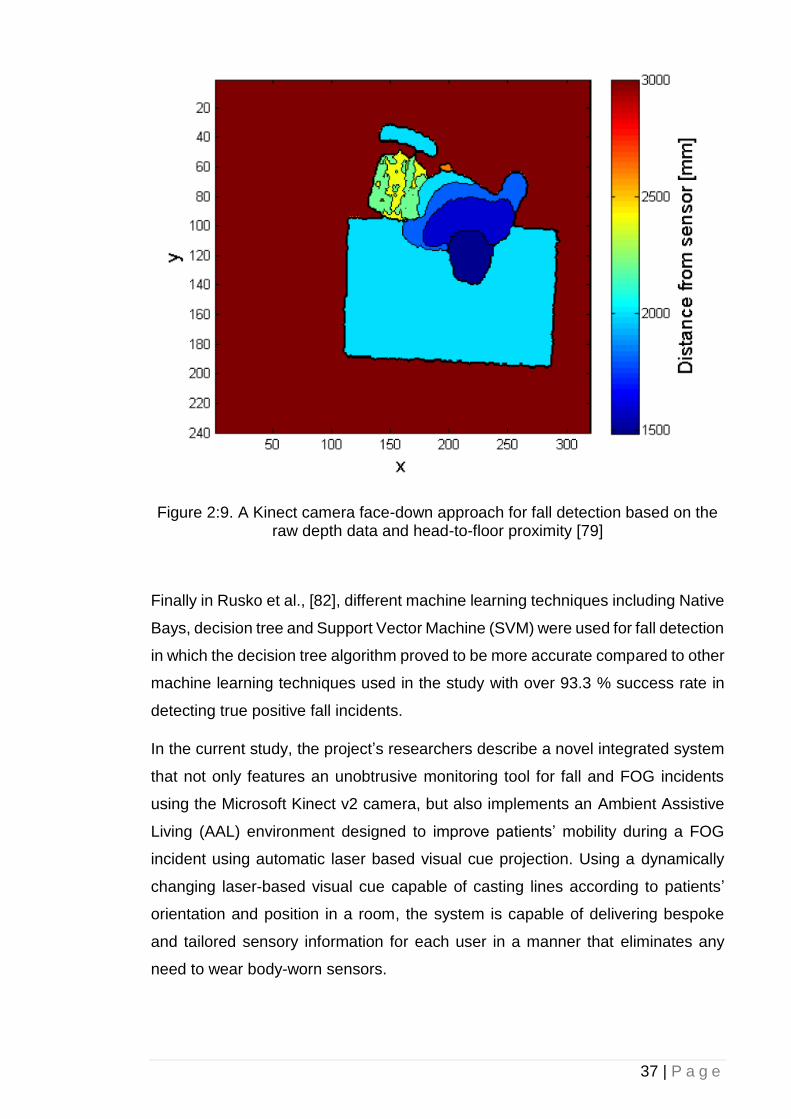
In Gasparrini et al., [79], a set of raw depth data were used to extract human body
features using a depth blob technique for each frame and by taking into account
the position and distance of each blob from the others. Based on the implemented
algorithm, a fall incident will be counted as positive if the head position is close to
the ground by a certain threshold. This was feasible because the camera was
place on the ceiling facing downwards (Figure 2:9).
37 | P a g e
Figure 2:9. A Kinect camera face-down approach for fall detection based on the raw depth data and head-to-floor proximity [79]
Finally in Rusko et al., [82], different machine learning techniques including Native
Bays, decision tree and Support Vector Machine (SVM) were used for fall detection
in which the decision tree algorithm proved to be more accurate compared to other
machine learning techniques used in the study with over 93.3 % success rate in
detecting true positive fall incidents.
In the current study, the project’s researchers describe a novel integrated system
that not only features an unobtrusive monitoring tool for fall and FOG incidents
using the Microsoft Kinect v2 camera, but also implements an Ambient Assistive
Living (AAL) environment designed to improve patients’ mobility during a FOG
incident using automatic laser based visual cue projection. Using a dynamically
changing laser-based visual cue capable of casting lines according to patients’
orientation and position in a room, the system is capable of delivering bespoke
and tailored sensory information for each user in a manner that eliminates any
need to wear body-worn sensors.
38 | P a g e
2.5 Summary
Footstep detection is an important measurement in rehabilitation and gait analysis
studies, as many disorders feature symptoms that directly or indirectly affect
patients’ gait cycle and walking style. There are different techniques used in
detecting footstep and evaluating gait cycles based on on-body sensors that,
although accurate, they can affect the subject’s walking style and consequently,
the data reading as the subject must wear special clothing embedded with on-body
sensors during the gait performance analysis. Consequently, an unobtrusive
approach based on the Microsoft Kinect v2 sensor would be an ideal method that
not only meets the aims and objectives of this research study, but also explores
the importance of footstep detection for FOG analysis.
Different fall detection methods have also been reviewed. From on-body sensors
to computer vision-based approaches as well as different paths in computer vision-
based detection including heuristic and machine-vision. Additionally, the attempts
towards analysing and evaluating the effect of different cueing system for FOG as
well as detection and characterisation of FOG in PwP have also been reviewed.
This laid the foundation of the methodology described in the following chapter to
Introduce two new footstep detection techniques one based on the subject’s knee
angle and one based on the subject’s ankle vertical height to the ground; Reducing
the Microsoft Kinect’s intrinsic inaccuracies in skeletal data reading for the
subject’s ankle vertical height to the ground footstep detection technique; resulting
in the increase in accuracy for the footstep detection algorithm by introducing a
new correction algorithm. Moreover, the research would provide an automatic and
remotely manageable monitoring system for PwP gait analysis and fall detection.
39 | P a g e
3 Chapter 3: Background of Sensors
Technology
3.1 Introduction
In this chapter, technologies used throughout this research will be explained and
the reason behind their selection will be discussed. This chapter covers an in-
depth analysis of the Microsoft Kinect sensor, the main component for receiving
data and input for this research. Moreover, all the available drivers and SDKs for
the Kinect sensor are evaluated, and the best solution will be chosen accordingly.
Additionally, this chapter focuses on different available approaches for utilising
Kinect technologies to be used throughout this research. Different systems will be
analysed and compared against others. Their advantages and disadvantages will
also be evaluated.
3.2 Microsoft Kinect
Kinect is an add-on peripheral developed by Microsoft for its Xbox gaming console.
It is a motion sensing apparatus that can take human natural body motions as an
input. It consists of two cameras/sensors including a colour sensor and an Infrared
(IR) depth sensor that receives and interprets IR signals, allowing it to work in the
dark. By casting IR lights on objects and calculating the traverse time each beam
takes to be bounced back and received by the sensor's IR receiver, a depth map
can be drawn making motion sensing technology possible in a 3D environment.
Many believe that the original idea of the Kinect sensor came from the previous
attempts made by Sony for PlayStation EYE motion camera and Nintendo for Wii
remote, which were aimed at broadening the audiences beyond hard-core/typical
gamers.
Microsoft has made the Kinect sensor available beyond the Xbox 360 console to
home computers with a dedicated Software Development Kit (Kinect SDK) and
related documentations [83]. This enabled developers to take advantage of the
Kinect sensor hardware capabilities, creating a plethora of innovative applications;
many related to medicine and biomedical engineering.
40 | P a g e
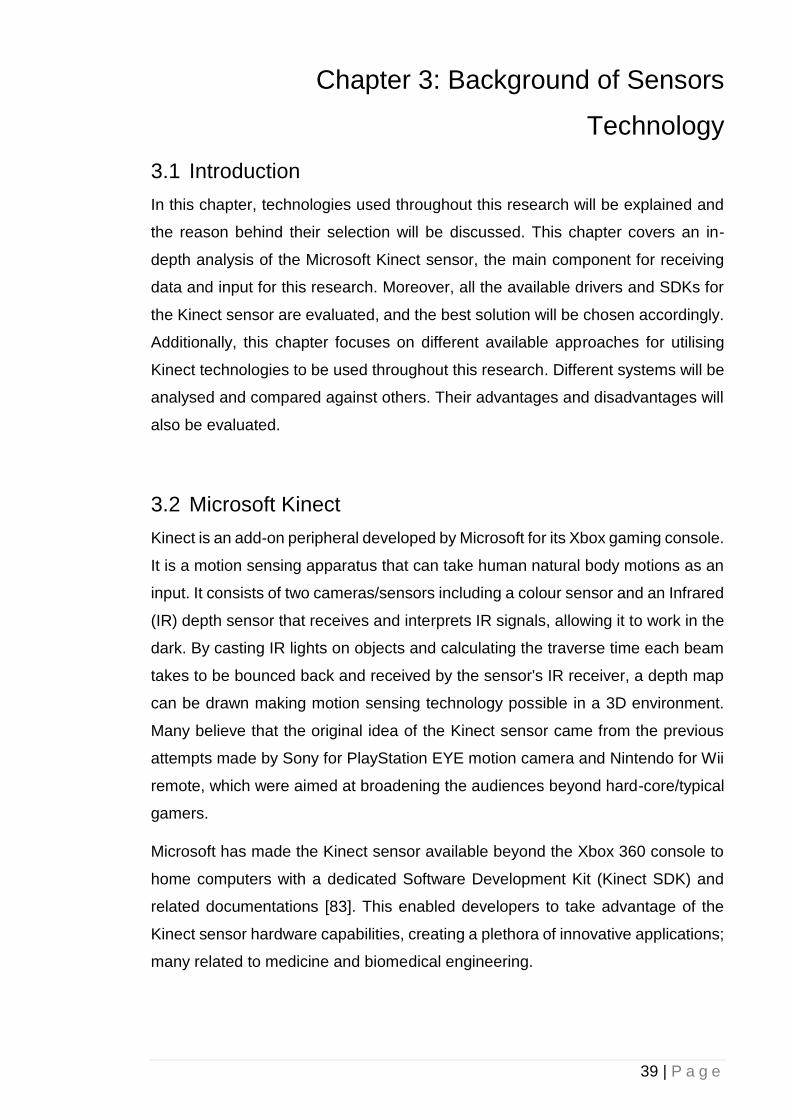
The Kinect sensor (Figure 3:1) has an IR emitter, which casts IR waves on the
object that can be later received by the IR depth receiver in order to render 3D
images.
Additionally, it features a set of four microphones known as Array Microphone,
which are aligned in a specific way to cancel out ambient noise and improve
sensitivity in pinpointing the source of the incoming signal.
Finally, yet importantly, it employs a motorised tilt to automatically change the
viewing angle based on the user’s vertical position.
Figure 3:1. Microsoft Kinect v1 internal components [84]
By employing the depth sensor and a microphone array, the Kinect does not
require any glove or accessories to be worn by players in order to interpret their
movements; unlike other attempts made in movement-based controls.
The RGB sensor in the Kinect receives 2-dimensional colour video feeds for facial
recognition and UI purposes. The four-microphone array, which is located along
the bottom of the horizontal bar, makes speech recognition possible with echo
cancellation and ambient noise suppression. The four microphones used in the
Kinect device are arranged in a way that minimise the environmental noise while
being able to pinpoint to the source of the voice location [85].
41 | P a g e
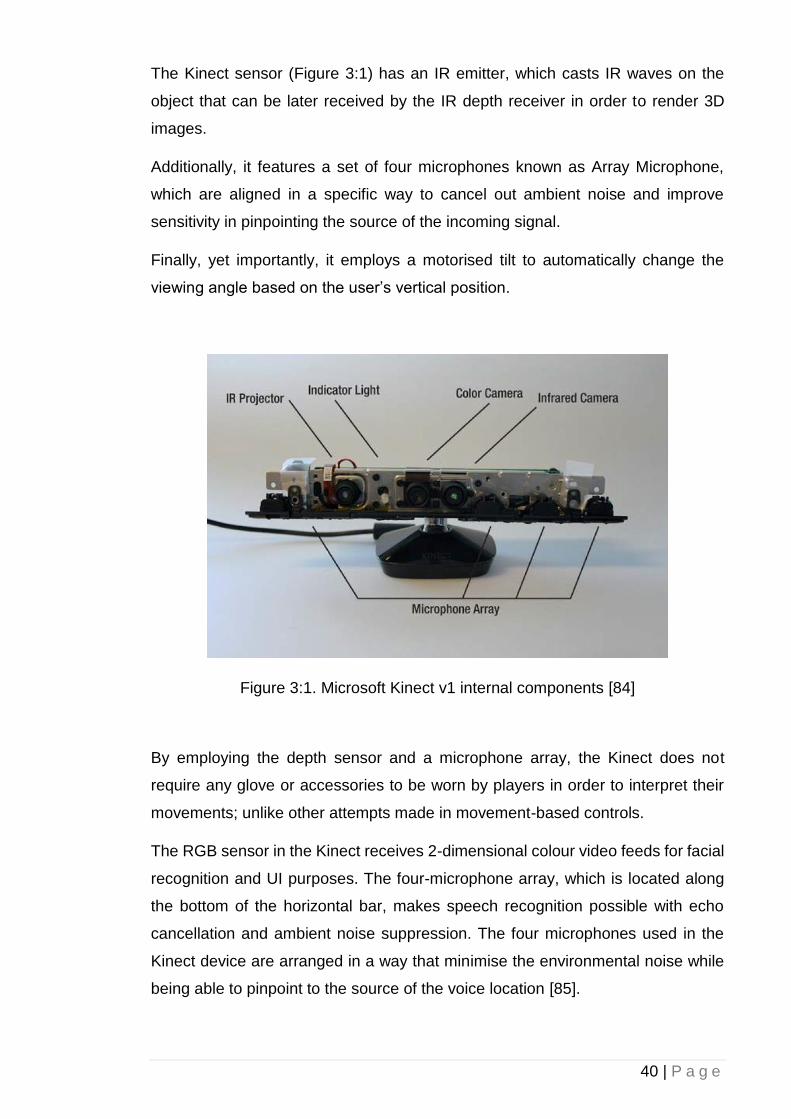
Figure 3:2 demonstrates the Kinect’s two sensors, IR emitter and IR depth sensor
(monochrome CMOS sensor) that together can capture depth data from the
environment [85]. The Kinect, using these two sensors coupled with a trained
machine learning algorithm within its SDK, is able to recognise gestures and track
body joints and skeleton. The emitter, projects IR light so the receiver can capture
the reflected infrared signals for further processing. The emitter casts grid-
patterned infrared lights on the target, which leads to the creation of the depth map
information by the receiver. The generated depth map contains the information
about the position of the object in three dimensions [86].
Figure 3:2 Kinect Infrared Depth Sensor [86]
Many other depth-sensing systems similar to the Kinect, determine the depth map
of the scene based on the time it takes for the light to return to the receiver after
bouncing off objects in the sensor’s view also known as Time of Flight (ToF)
method. However, the Kinect encodes data in the IR light as it is sent and analyses
the distortions in the signal after it returns in order to get a more detailed 3D picture
of the scene in addition to the above method [85]. This 3D depth image is then
processed in software to perform human skeletal tracking.
The Kinect camera measures the depth data based on a triangulation process [87]
in which the IR emitter casts a single beam that splits into multiple beams using
diffraction grating in order to construct a dotted pattern of the scenery. The IR
receiver then captures the projected pattern, which is then compared against a
reference pattern made from a known distance plane saved on the Kinect’s
memory. Depending on the distance difference of the projected speckles and the
reference plane to the perspective centre of the IR camera, the projected speckles’
42 | P a g e
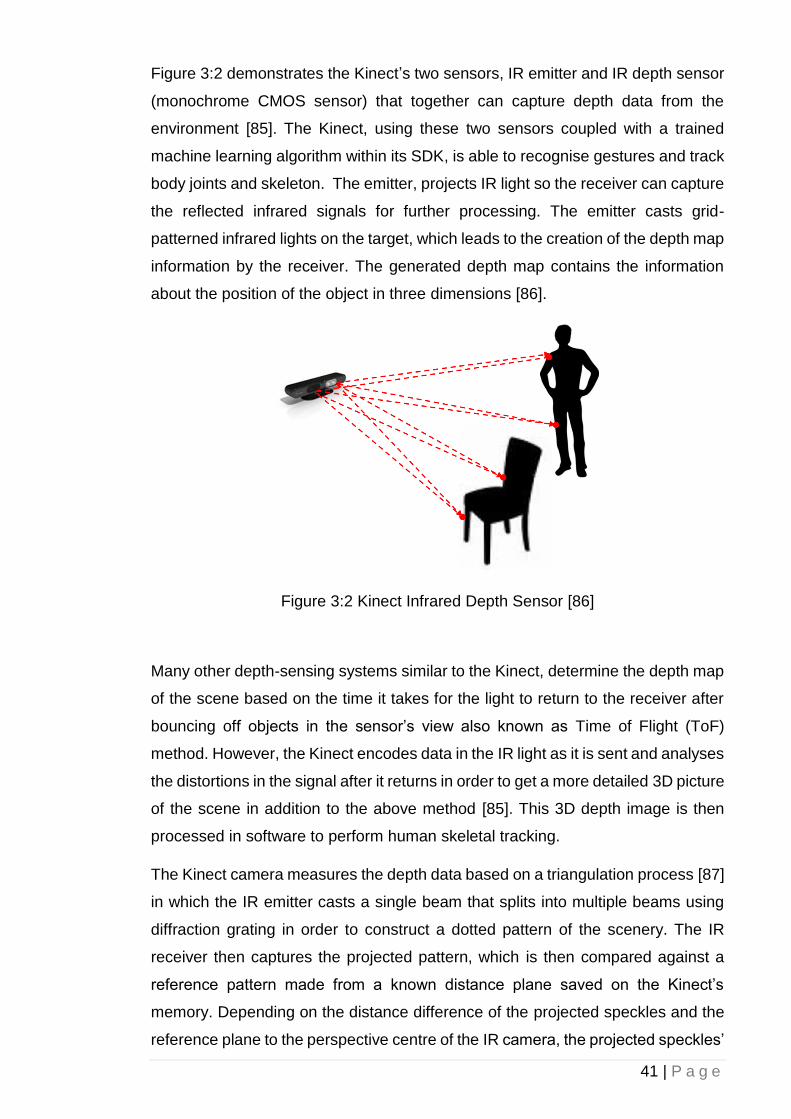
position will be shifted in the baseline direction between the IR emitter and IR
receiver. This would result in a disparity image that enables the camera to
calculate the distance of each pixel from the corresponding disparity [88].
Figure 3:3. Panel (a) is the perceived IR image by the Kinect. Panel (b) represents the depth information for each pixel colour coded based on their
distance to the camera [88]
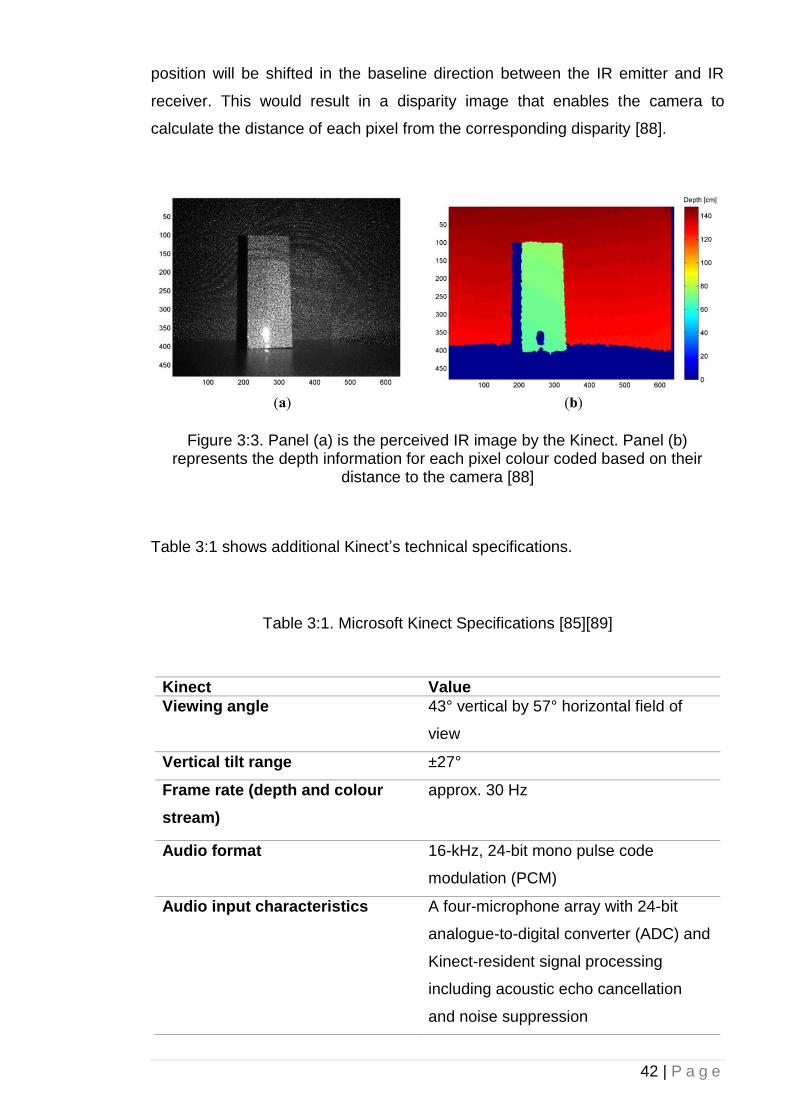
Table 3:1 shows additional Kinect’s technical specifications.
Table 3:1. Microsoft Kinect Specifications [85][89]
Kinect Value Viewing angle 43° vertical by 57° horizontal field of
view
Vertical tilt range ±27°
Frame rate (depth and colour
stream)
approx. 30 Hz
Audio format 16-kHz, 24-bit mono pulse code
modulation (PCM)
Audio input characteristics A four-microphone array with 24-bit
analogue-to-digital converter (ADC) and
Kinect-resident signal processing
including acoustic echo cancellation
and noise suppression
43 | P a g e
Accelerometer characteristics A 2G/4G/8G accelerometer configured
for the 2G range, with a 1° accuracy
upper limit.
Depth Sensor Range 1.2 to 3.5 meters
Depth Image Stream 320 x 240 16-bit, 30 fps
Angular Field-of-View 57◦ horz., 43◦ vert.
Nominal spatial range 640 x 480 (VGA)
Nominal spatial resolution (at 2m
distance)
3 mm
Nominal depth range 0.8 m - 3.5 m
Nominal depth resolution (at 2m
distance)
1 cm
Device connection type USB (+ external power)
3.2.1 Open Source Drivers and SDKs
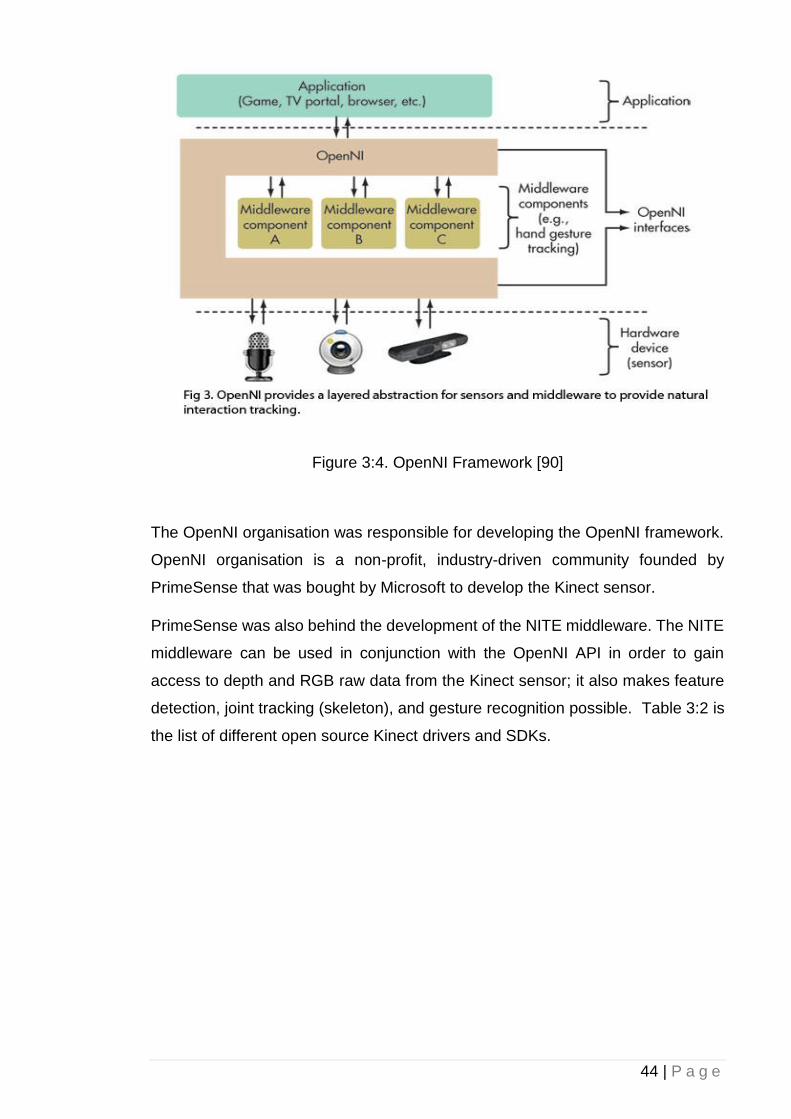
One of the examples of the attempts made in the Kinect open source driver
development was OpenNI Framework. It consisted of a series of Application
Programming Interfaces (APIs) for the use of programming natural interface
peripherals by making use of raw information received from the device’s
audio/video sensors. Because of its capability on interpreting raw visual and
auditory data and due to the fact that the Kinect is in fact a natural interface device,
the OpenNI framework became a good candidate for the Kinect open source
API/SDK/Driver project. The following figure demonstrates the interaction between
each component of a system based on the OpenNI Framework [90].
44 | P a g e
Figure 3:4. OpenNI Framework [90]
The OpenNI organisation was responsible for developing the OpenNI framework.
OpenNI organisation is a non-profit, industry-driven community founded by
PrimeSense that was bought by Microsoft to develop the Kinect sensor.
PrimeSense was also behind the development of the NITE middleware. The NITE
middleware can be used in conjunction with the OpenNI API in order to gain
access to depth and RGB raw data from the Kinect sensor; it also makes feature
detection, joint tracking (skeleton), and gesture recognition possible. Table 3:2 is
the list of different open source Kinect drivers and SDKs.
45 | P a g e
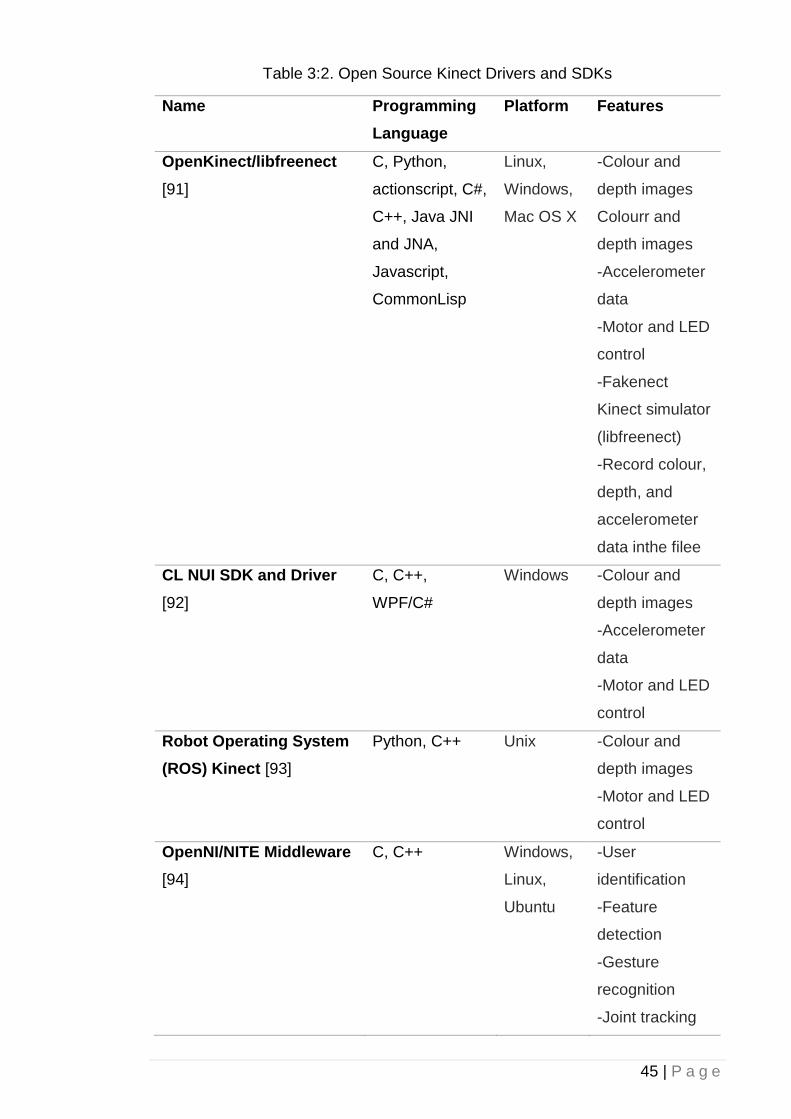
Table 3:2. Open Source Kinect Drivers and SDKs
Name Programming
Language
Platform Features
OpenKinect/libfreenect
[91]
C, Python,
actionscript, C#,
C++, Java JNI
and JNA,
Javascript,
CommonLisp
Linux,
Windows,
Mac OS X
-Colour and
depth images
Colourr and
depth images
-Accelerometer
data
-Motor and LED
control
-Fakenect
Kinect simulator
(libfreenect)
-Record colour,
depth, and
accelerometer
data inthe filee
CL NUI SDK and Driver
[92]
C, C++,
WPF/C#
Windows -Colour and
depth images
-Accelerometer
data
-Motor and LED
control
Robot Operating System
(ROS) Kinect [93]
Python, C++ Unix -Colour and
depth images
-Motor and LED
control
OpenNI/NITE Middleware
[94]
C, C++ Windows,
Linux,
Ubuntu
-User
identification
-Feature
detection
-Gesture
recognition
-Joint tracking
46 | P a g e
-Colour and
depth images
-Record colour
and depth data
in file
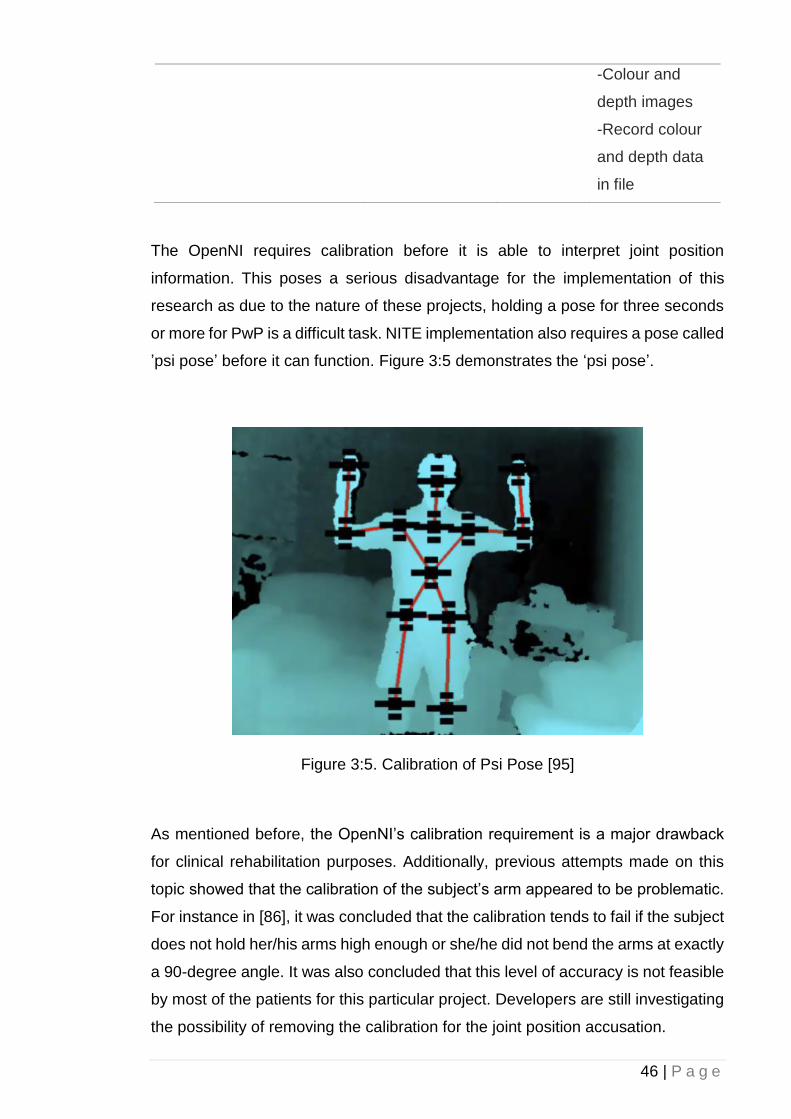
The OpenNI requires calibration before it is able to interpret joint position
information. This poses a serious disadvantage for the implementation of this
research as due to the nature of these projects, holding a pose for three seconds
or more for PwP is a difficult task. NITE implementation also requires a pose called
’psi pose’ before it can function. Figure 3:5 demonstrates the ‘psi pose’.
Figure 3:5. Calibration of Psi Pose [95]
As mentioned before, the OpenNI’s calibration requirement is a major drawback
for clinical rehabilitation purposes. Additionally, previous attempts made on this
topic showed that the calibration of the subject’s arm appeared to be problematic.
For instance in [86], it was concluded that the calibration tends to fail if the subject
does not hold her/his arms high enough or she/he did not bend the arms at exactly
a 90-degree angle. It was also concluded that this level of accuracy is not feasible
by most of the patients for this particular project. Developers are still investigating
the possibility of removing the calibration for the joint position accusation.
47 | P a g e
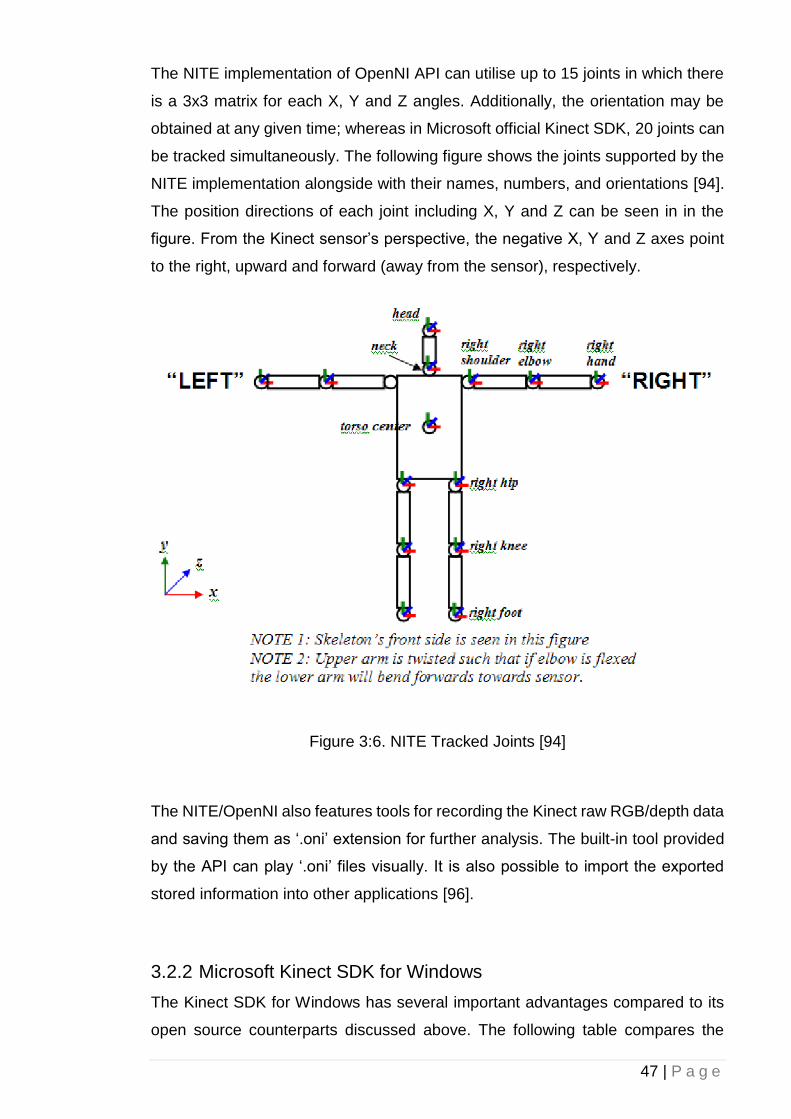
The NITE implementation of OpenNI API can utilise up to 15 joints in which there
is a 3x3 matrix for each X, Y and Z angles. Additionally, the orientation may be
obtained at any given time; whereas in Microsoft official Kinect SDK, 20 joints can
be tracked simultaneously. The following figure shows the joints supported by the
NITE implementation alongside with their names, numbers, and orientations [94].
The position directions of each joint including X, Y and Z can be seen in in the
figure. From the Kinect sensor’s perspective, the negative X, Y and Z axes point
to the right, upward and forward (away from the sensor), respectively.
Figure 3:6. NITE Tracked Joints [94]
The NITE/OpenNI also features tools for recording the Kinect raw RGB/depth data
and saving them as ‘.oni’ extension for further analysis. The built-in tool provided
by the API can play ‘.oni’ files visually. It is also possible to import the exported
stored information into other applications [96].
3.2.2 Microsoft Kinect SDK for Windows
The Kinect SDK for Windows has several important advantages compared to its
open source counterparts discussed above. The following table compares the
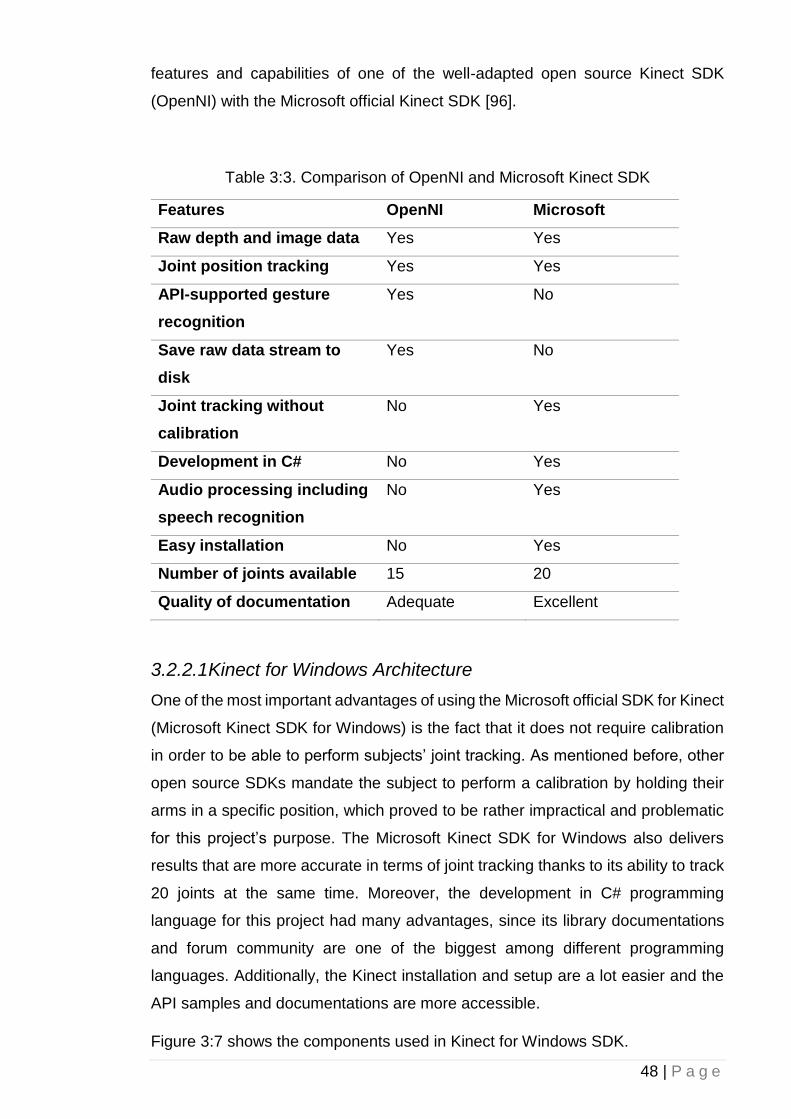
48 | P a g e
features and capabilities of one of the well-adapted open source Kinect SDK
(OpenNI) with the Microsoft official Kinect SDK [96].
Table 3:3. Comparison of OpenNI and Microsoft Kinect SDK
Features OpenNI Microsoft
Raw depth and image data Yes Yes
Joint position tracking Yes Yes
API-supported gesture
recognition
Yes No
Save raw data stream to
disk
Yes No
Joint tracking without
calibration
No Yes
Development in C# No Yes
Audio processing including
speech recognition
No Yes
Easy installation No Yes
Number of joints available 15 20
Quality of documentation Adequate Excellent
3.2.2.1 Kinect for Windows Architecture
One of the most important advantages of using the Microsoft official SDK for Kinect
(Microsoft Kinect SDK for Windows) is the fact that it does not require calibration
in order to be able to perform subjects’ joint tracking. As mentioned before, other
open source SDKs mandate the subject to perform a calibration by holding their
arms in a specific position, which proved to be rather impractical and problematic
for this project’s purpose. The Microsoft Kinect SDK for Windows also delivers
results that are more accurate in terms of joint tracking thanks to its ability to track
20 joints at the same time. Moreover, the development in C# programming
language for this project had many advantages, since its library documentations
and forum community are one of the biggest among different programming
languages. Additionally, the Kinect installation and setup are a lot easier and the
API samples and documentations are more accessible.
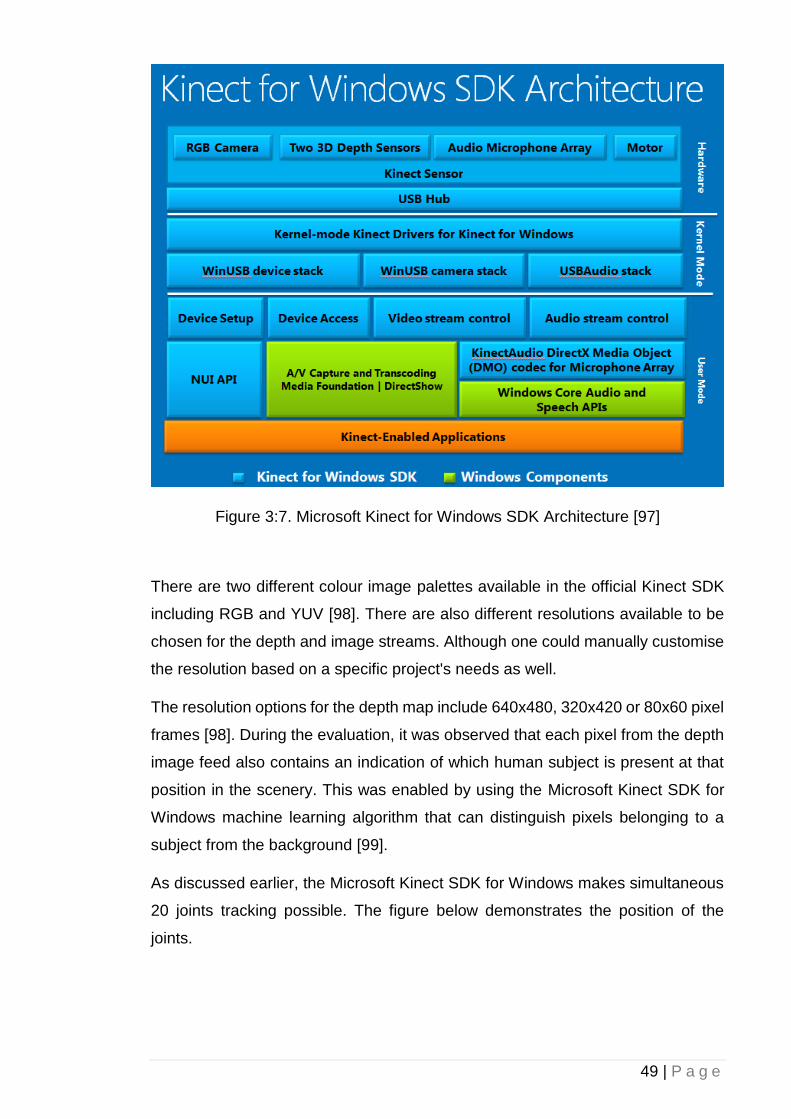
Figure 3:7 shows the components used in Kinect for Windows SDK.
49 | P a g e
Figure 3:7. Microsoft Kinect for Windows SDK Architecture [97]
There are two different colour image palettes available in the official Kinect SDK
including RGB and YUV [98]. There are also different resolutions available to be
chosen for the depth and image streams. Although one could manually customise
the resolution based on a specific project's needs as well.
The resolution options for the depth map include 640x480, 320x420 or 80x60 pixel
frames [98]. During the evaluation, it was observed that each pixel from the depth
image feed also contains an indication of which human subject is present at that
position in the scenery. This was enabled by using the Microsoft Kinect SDK for
Windows machine learning algorithm that can distinguish pixels belonging to a
subject from the background [99].
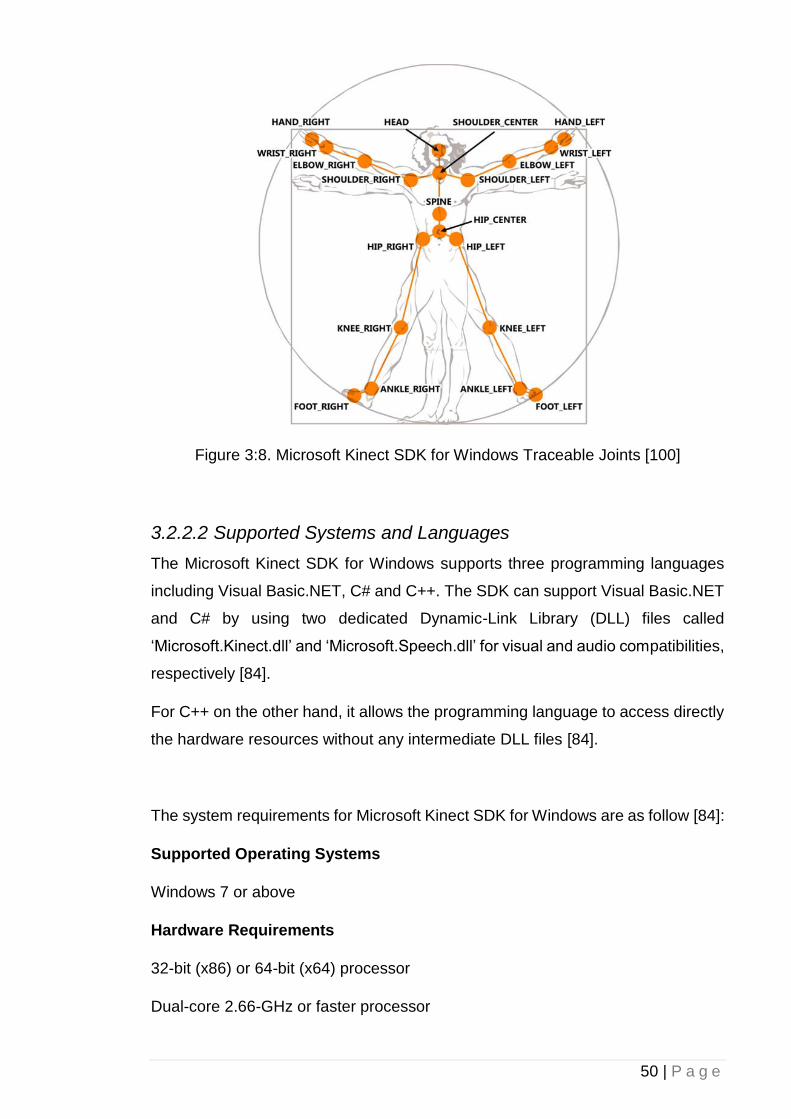
As discussed earlier, the Microsoft Kinect SDK for Windows makes simultaneous
20 joints tracking possible. The figure below demonstrates the position of the
joints.
50 | P a g e
Figure 3:8. Microsoft Kinect SDK for Windows Traceable Joints [100]
3.2.2.2 Supported Systems and Languages
The Microsoft Kinect SDK for Windows supports three programming languages
including Visual Basic.NET, C# and C++. The SDK can support Visual Basic.NET
and C# by using two dedicated Dynamic-Link Library (DLL) files called
‘Microsoft.Kinect.dll’ and ‘Microsoft.Speech.dll’ for visual and audio compatibilities,
respectively [84].
For C++ on the other hand, it allows the programming language to access directly
the hardware resources without any intermediate DLL files [84].
The system requirements for Microsoft Kinect SDK for Windows are as follow [84]:
Supported Operating Systems
Windows 7 or above
Hardware Requirements
32-bit (x86) or 64-bit (x64) processor
Dual-core 2.66-GHz or faster processor
51 | P a g e
Dedicated USB 2.0 bus
2 GB RAM
A Microsoft Kinect for Windows sensor
Software Requirements
Microsoft Visual Studio 2010 Express or other Visual Studio 2010 edition or above
.NET Framework 4.0 or above
Note: To develop speech-enabled Kinect for Windows applications, the Microsoft
Speech Platform SDK v11 should be installed.
3.2.2.3 Supported Modes
There are two types of modes available in the Microsoft Kinect SDK for Windows.
The first one is the ‘Default’ mode, which as the name suggests is ideal for general
conditions that sets the viewable depth range to 800mm – 4000mm. The second
mode is known as ‘Near’ mode, which its functionality is similar to ‘macro’ mode
on digital cameras where it focuses on close objects and it sets the viewable depth
range to 400mm – 3000mm. In the Near mode, the sensor recognises objects from
40 centimetres to 4 meters away from the IR receiver. Figure 3:9 shows the
difference between the Default and Near modes in terms of distance sensitivity [2].
Figure 3:9. Kinect Default vs. Near mode in terms of distance of recognisable objects [101]
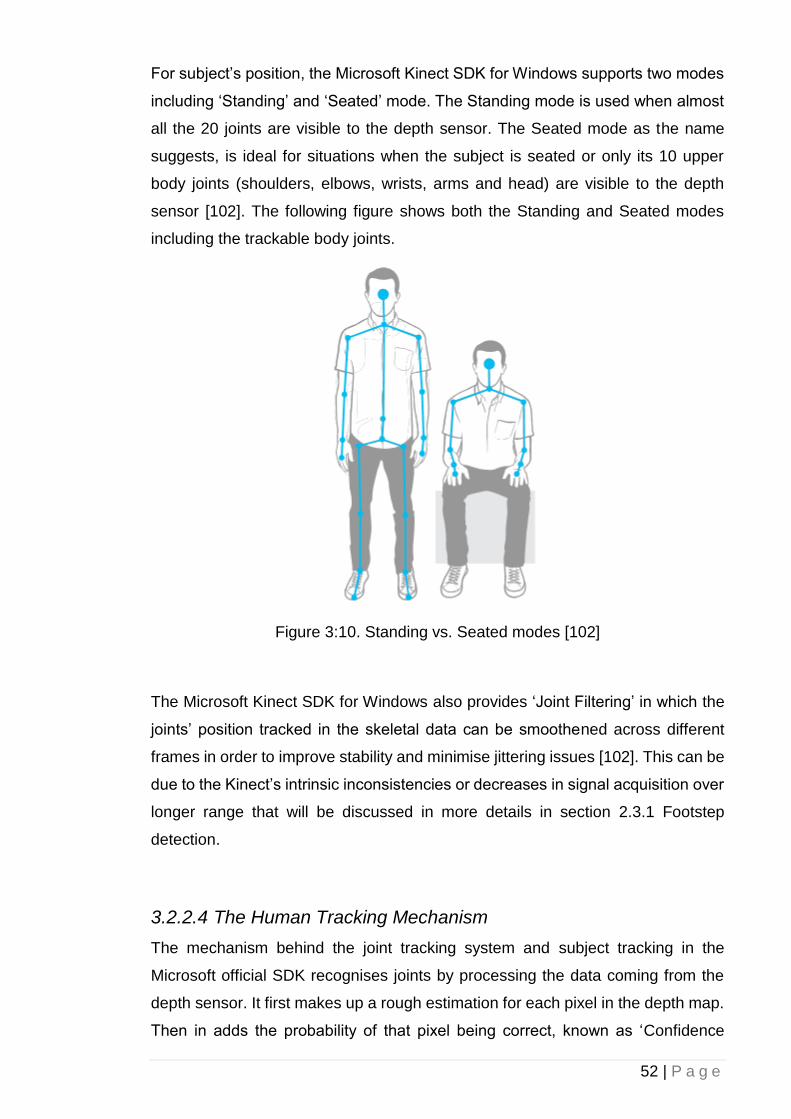
52 | P a g e
For subject’s position, the Microsoft Kinect SDK for Windows supports two modes
including ‘Standing’ and ‘Seated’ mode. The Standing mode is used when almost
all the 20 joints are visible to the depth sensor. The Seated mode as the name
suggests, is ideal for situations when the subject is seated or only its 10 upper
body joints (shoulders, elbows, wrists, arms and head) are visible to the depth
sensor [102]. The following figure shows both the Standing and Seated modes
including the trackable body joints.
Figure 3:10. Standing vs. Seated modes [102]
The Microsoft Kinect SDK for Windows also provides ‘Joint Filtering’ in which the
joints’ position tracked in the skeletal data can be smoothened across different
frames in order to improve stability and minimise jittering issues [102]. This can be
due to the Kinect’s intrinsic inconsistencies or decreases in signal acquisition over
longer range that will be discussed in more details in section 2.3.1 Footstep
detection.
3.2.2.4 The Human Tracking Mechanism
The mechanism behind the joint tracking system and subject tracking in the
Microsoft official SDK recognises joints by processing the data coming from the
depth sensor. It first makes up a rough estimation for each pixel in the depth map.
Then in adds the probability of that pixel being correct, known as ‘Confidence
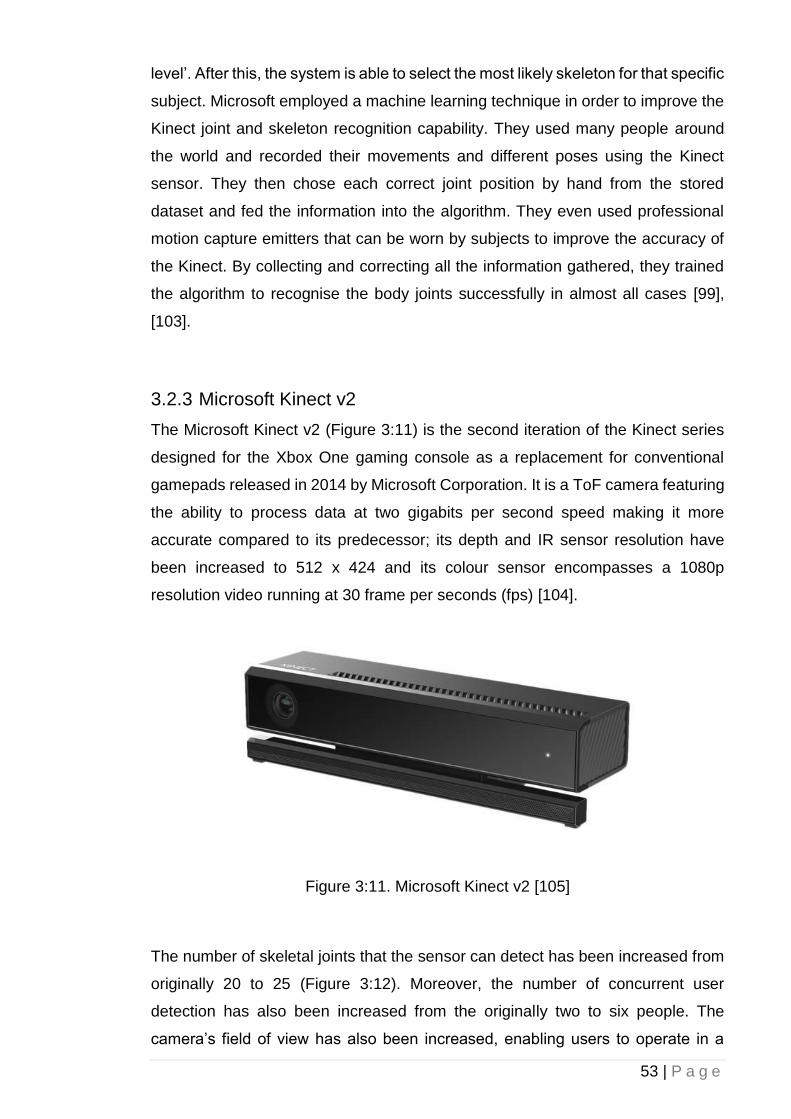
53 | P a g e
level’. After this, the system is able to select the most likely skeleton for that specific
subject. Microsoft employed a machine learning technique in order to improve the
Kinect joint and skeleton recognition capability. They used many people around
the world and recorded their movements and different poses using the Kinect
sensor. They then chose each correct joint position by hand from the stored
dataset and fed the information into the algorithm. They even used professional
motion capture emitters that can be worn by subjects to improve the accuracy of
the Kinect. By collecting and correcting all the information gathered, they trained
the algorithm to recognise the body joints successfully in almost all cases [99],
[103].
3.2.3 Microsoft Kinect v2
The Microsoft Kinect v2 (Figure 3:11) is the second iteration of the Kinect series
designed for the Xbox One gaming console as a replacement for conventional
gamepads released in 2014 by Microsoft Corporation. It is a ToF camera featuring
the ability to process data at two gigabits per second speed making it more
accurate compared to its predecessor; its depth and IR sensor resolution have
been increased to 512 x 424 and its colour sensor encompasses a 1080p
resolution video running at 30 frame per seconds (fps) [104].
Figure 3:11. Microsoft Kinect v2 [105]
The number of skeletal joints that the sensor can detect has been increased from
originally 20 to 25 (Figure 3:12). Moreover, the number of concurrent user
detection has also been increased from the originally two to six people. The
camera’s field of view has also been increased, enabling users to operate in a
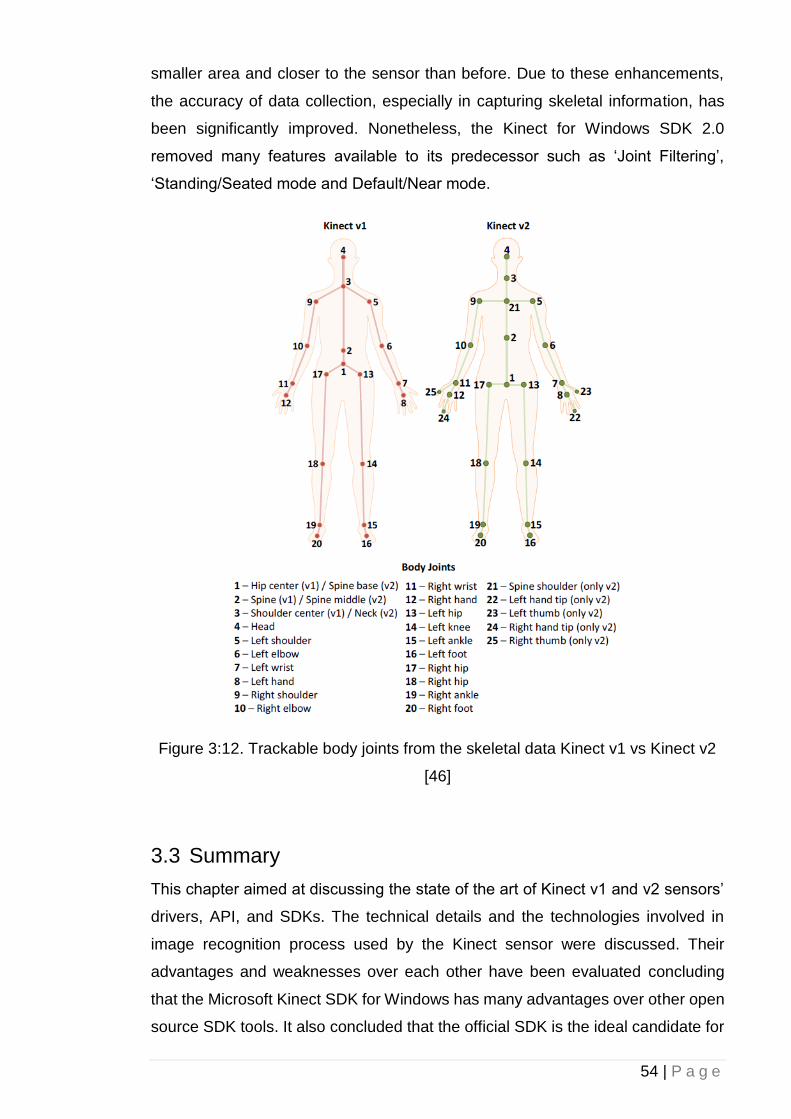
54 | P a g e
smaller area and closer to the sensor than before. Due to these enhancements,
the accuracy of data collection, especially in capturing skeletal information, has
been significantly improved. Nonetheless, the Kinect for Windows SDK 2.0
removed many features available to its predecessor such as ‘Joint Filtering’,
‘Standing/Seated mode and Default/Near mode.
Figure 3:12. Trackable body joints from the skeletal data Kinect v1 vs Kinect v2
[46]
3.3 Summary
This chapter aimed at discussing the state of the art of Kinect v1 and v2 sensors’
drivers, API, and SDKs. The technical details and the technologies involved in
image recognition process used by the Kinect sensor were discussed. Their
advantages and weaknesses over each other have been evaluated concluding
that the Microsoft Kinect SDK for Windows has many advantages over other open
source SDK tools. It also concluded that the official SDK is the ideal candidate for
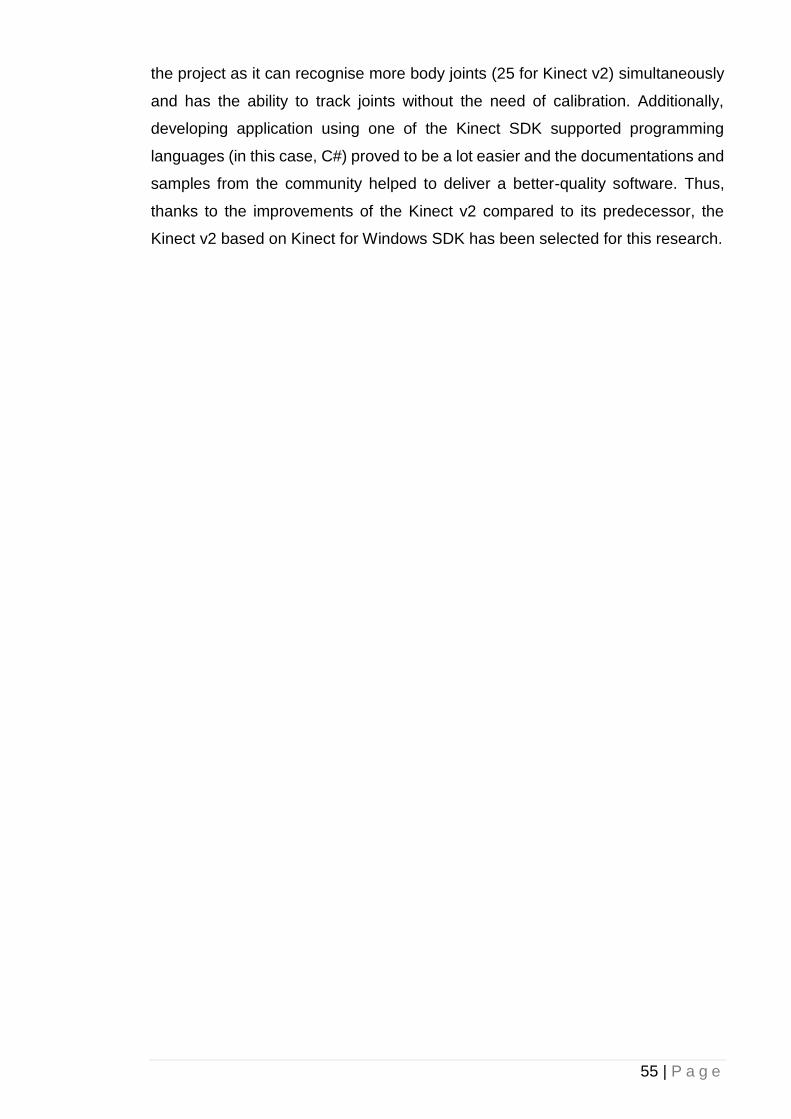
55 | P a g e
the project as it can recognise more body joints (25 for Kinect v2) simultaneously
and has the ability to track joints without the need of calibration. Additionally,
developing application using one of the Kinect SDK supported programming
languages (in this case, C#) proved to be a lot easier and the documentations and
samples from the community helped to deliver a better-quality software. Thus,
thanks to the improvements of the Kinect v2 compared to its predecessor, the
Kinect v2 based on Kinect for Windows SDK has been selected for this research.
56 | P a g e
4 Chapter 4: Methodology
4.1 Introduction
In this chapter, the research’s experimental setup and conditions are explained.
Moreover, different types of fall detection methods including heuristic and machine
learning approaches are explored in order to find the most reliable method suitable
for this study. Furthermore, as a requirement for FOG detection, two approaches
in footstep detection one based on the subject’s ankles distance to the ground and
one based on indirect observation via subject’s knees angles during a gait cycle
are also evaluated. This chapter also focuses on the software design and
hardware prototype for the study including the GUI, serial connection and signal
differentiation, and data segmentation. Last but not least, the ethical approval
process is also mentioned.
4.2 Fall Detection
Automatic fall detection is one of the most widespread research topics in
healthcare and AAL as many physical conditions include falls as one of their main
symptoms. Having a system that can autonomously detect a fall incident could
decrease the risk of injuries and consequently the treatment expenditures.
Furthermore, it helps to evaluate gait performance and fall analysis and provides
valuable data for further studies.
There have been significant studies such as [73]–[76], [106], [107] with regards to
fall detection using different techniques over the past two decades, each with its
advantages and drawbacks. Some of the earliest approaches in fall detection were
based on wearable devices and attached sensors. Although accurate, they
mandate the user to carry extra devices, charge batteries, wear special clothing or
sensors to be attached to the body, making them uncomfortable to use. Moreover,
these apparatuses may interrupt the normal daily activity and consequently gait
performance analyses. In this research study, two different techniques (heuristic
and machine learning) were tested and compared using the Microsoft Kinect v2
sensor. The above techniques are fundamentally different in their performance
under diverse situations.
57 | P a g e
4.2.1 Heuristic Approach
For the heuristic fall detection approach, an algorithm was developed to track a
subject's head 3D Cartesian coordinate location at all times. By using the Kinect
skeleton tracking, the spatio-temporal position of each joint, with respect to other
joints, can be determined. The proposed system holds the information of the
subject head's position and velocity in one second time buffer at all times. This is
required to calculate the average velocity of the subject’s head. Based on the
vector that the subject’s head is moving towards and the distance between the
head and the floor, a fall incident can be detected if the average velocity reaches
1 m/s and the subject’s head distance to ground is less than 10 cm. These
thresholds were determined experimentally during the testing phase; after setting
different values, the results proved that the above values provided the least false
positive detection rate. This minimises the chances for false positives’ occurrence
by not taking into account low-velocity falls such as laying down or high ground
distance incidents such as sitting on a chair. Additionally, the system is designed
to distinguish between different types of falls such as critical falls in which the
subject is unable to stand up and recover after the incident. This is achievable by
adding a timer that can be user-defined to set a threshold for the maximum time
elapsed before it reaches a critical falling point.
Figure 4:1 demonstrates the developed fall detection technique using the heuristic
approach. It shows a subject has fallen (on the floor) and the system recorded his
velocity, direction, and distance to the floor when an object partially blocked the
Kinect’s camera view. Figure 4:2 shows the system’s capability to compensate
when the Kinect’s camera field of view is partial obstructed.
58 | P a g e
Figure 4:1. Heuristic approach software in action (objects partially blocking the sensor’s view)
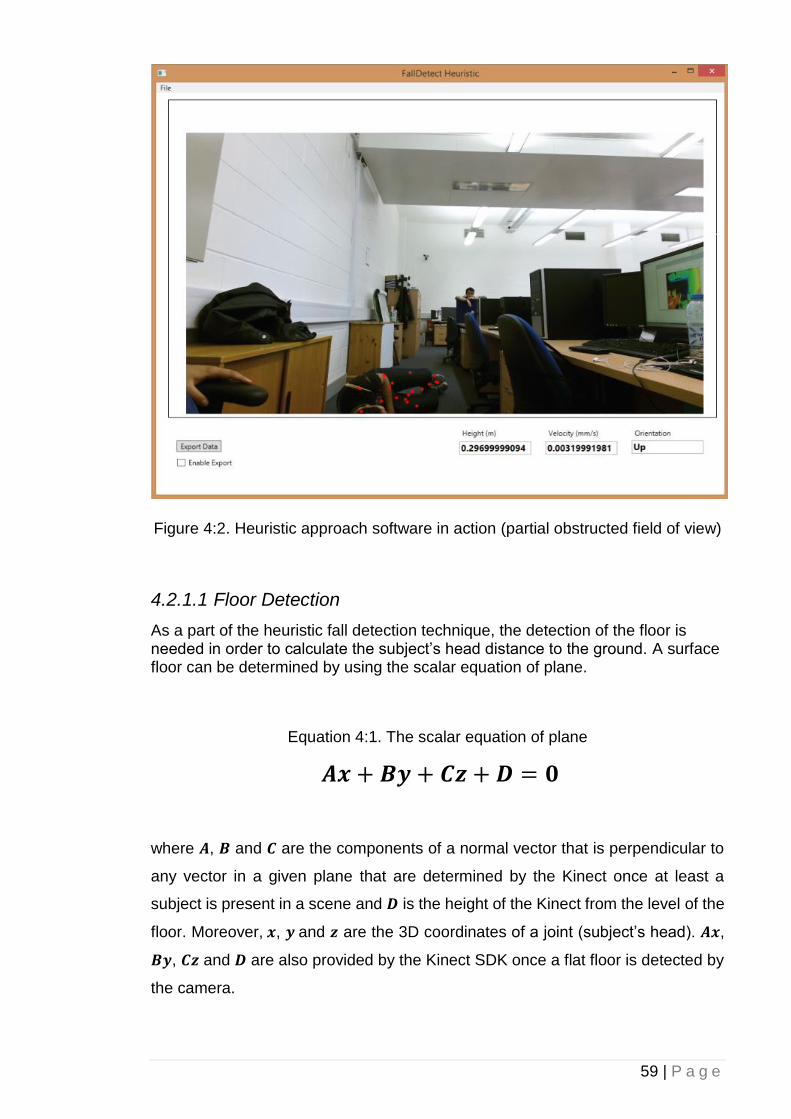
59 | P a g e
Figure 4:2. Heuristic approach software in action (partial obstructed field of view)
4.2.1.1 Floor Detection
As a part of the heuristic fall detection technique, the detection of the floor is needed in order to calculate the subject’s head distance to the ground. A surface floor can be determined by using the scalar equation of plane.
Equation 4:1. The scalar equation of plane
𝑨𝒙 + 𝑩𝒚 + 𝑪𝒛 + 𝑫 = 𝟎
where 𝑨, 𝑩 and 𝑪 are the components of a normal vector that is perpendicular to
any vector in a given plane that are determined by the Kinect once at least a
subject is present in a scene and 𝑫 is the height of the Kinect from the level of the
floor. Moreover, 𝒙, 𝒚 and 𝒛 are the 3D coordinates of a joint (subject’s head). 𝑨𝒙,
𝑩𝒚, 𝑪𝒛 and 𝑫 are also provided by the Kinect SDK once a flat floor is detected by
the camera.
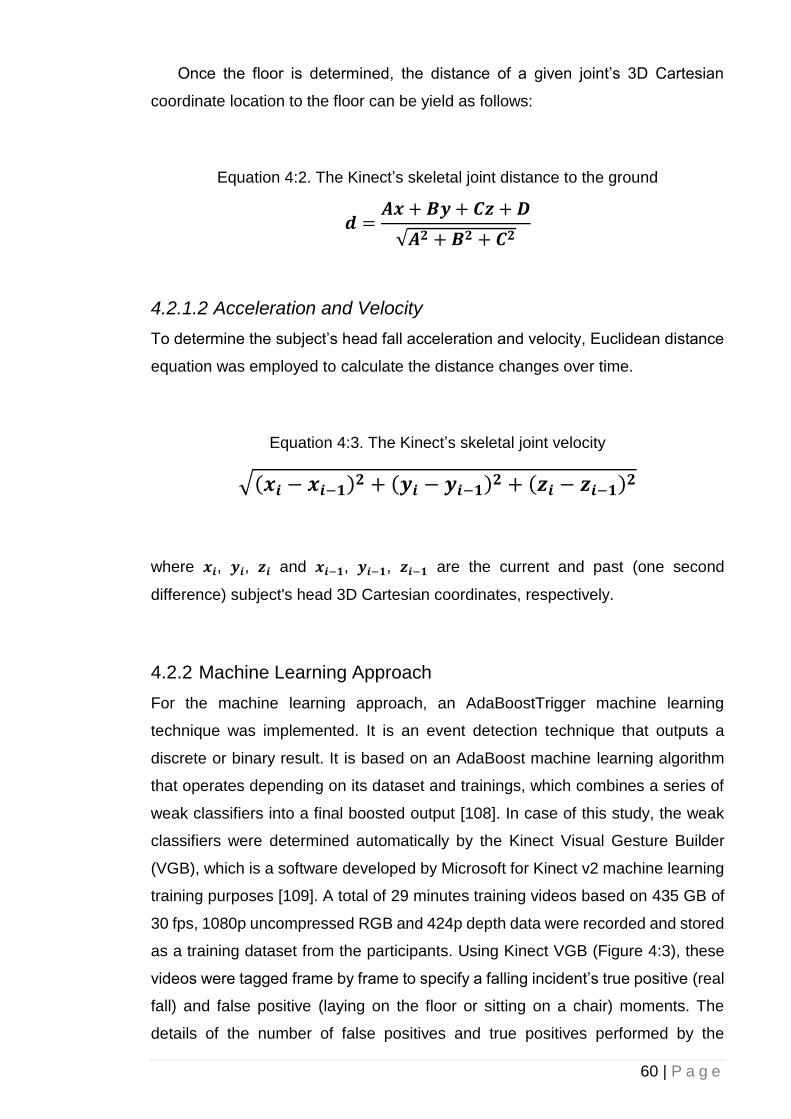
60 | P a g e
Once the floor is determined, the distance of a given joint’s 3D Cartesian
coordinate location to the floor can be yield as follows:
Equation 4:2. The Kinect’s skeletal joint distance to the ground
𝒅 =𝑨𝒙 + 𝑩𝒚 + 𝑪𝒛 + 𝑫
√𝑨𝟐 + 𝑩𝟐 + 𝑪𝟐
4.2.1.2 Acceleration and Velocity
To determine the subject’s head fall acceleration and velocity, Euclidean distance
equation was employed to calculate the distance changes over time.
Equation 4:3. The Kinect’s skeletal joint velocity
√(𝒙𝒊 − 𝒙𝒊−𝟏)𝟐 + (𝒚𝒊 − 𝒚𝒊−𝟏)
𝟐 + (𝒛𝒊 − 𝒛𝒊−𝟏)𝟐
where 𝒙𝒊, 𝒚𝒊, 𝒛𝒊 and 𝒙𝒊−𝟏, 𝒚𝒊−𝟏, 𝒛𝒊−𝟏 are the current and past (one second
difference) subject's head 3D Cartesian coordinates, respectively.
4.2.2 Machine Learning Approach
For the machine learning approach, an AdaBoostTrigger machine learning
technique was implemented. It is an event detection technique that outputs a
discrete or binary result. It is based on an AdaBoost machine learning algorithm
that operates depending on its dataset and trainings, which combines a series of
weak classifiers into a final boosted output [108]. In case of this study, the weak
classifiers were determined automatically by the Kinect Visual Gesture Builder
(VGB), which is a software developed by Microsoft for Kinect v2 machine learning
training purposes [109]. A total of 29 minutes training videos based on 435 GB of
30 fps, 1080p uncompressed RGB and 424p depth data were recorded and stored
as a training dataset from the participants. Using Kinect VGB (Figure 4:3), these
videos were tagged frame by frame to specify a falling incident’s true positive (real
fall) and false positive (laying on the floor or sitting on a chair) moments. The
details of the number of false positives and true positives performed by the
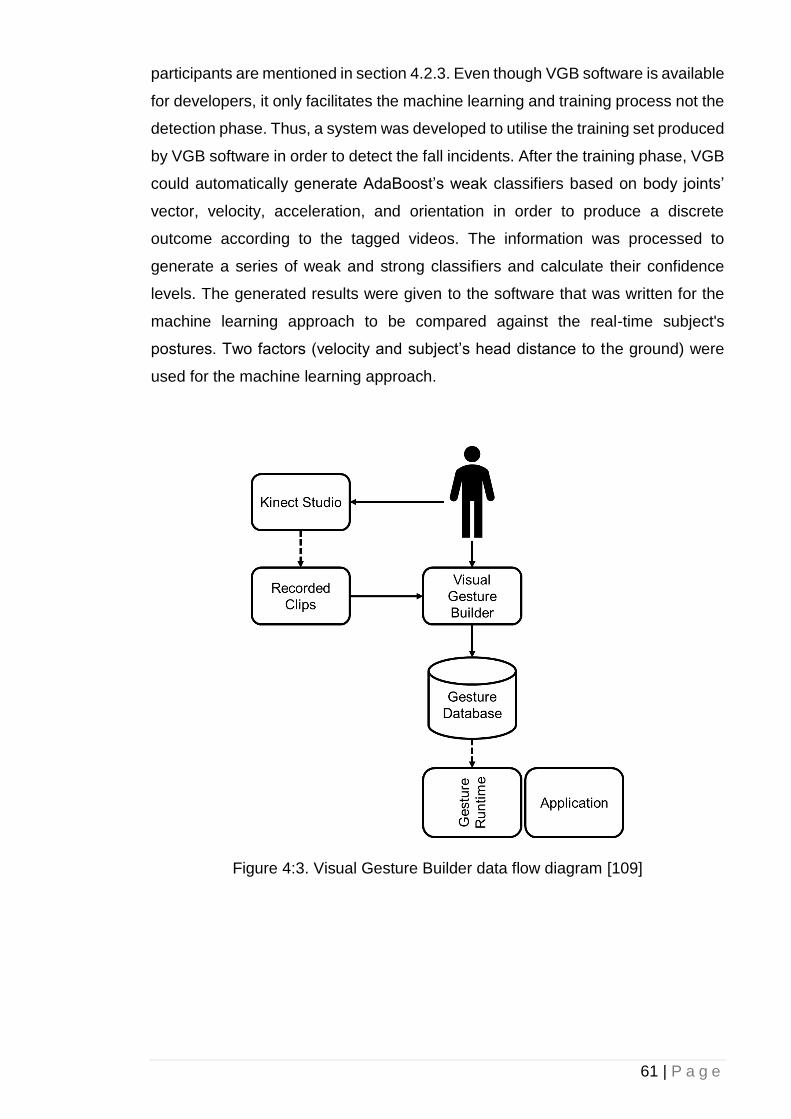
61 | P a g e
participants are mentioned in section 4.2.3. Even though VGB software is available
for developers, it only facilitates the machine learning and training process not the
detection phase. Thus, a system was developed to utilise the training set produced
by VGB software in order to detect the fall incidents. After the training phase, VGB
could automatically generate AdaBoost’s weak classifiers based on body joints’
vector, velocity, acceleration, and orientation in order to produce a discrete
outcome according to the tagged videos. The information was processed to
generate a series of weak and strong classifiers and calculate their confidence
levels. The generated results were given to the software that was written for the
machine learning approach to be compared against the real-time subject's
postures. Two factors (velocity and subject’s head distance to the ground) were
used for the machine learning approach.
Figure 4:3. Visual Gesture Builder data flow diagram [109]
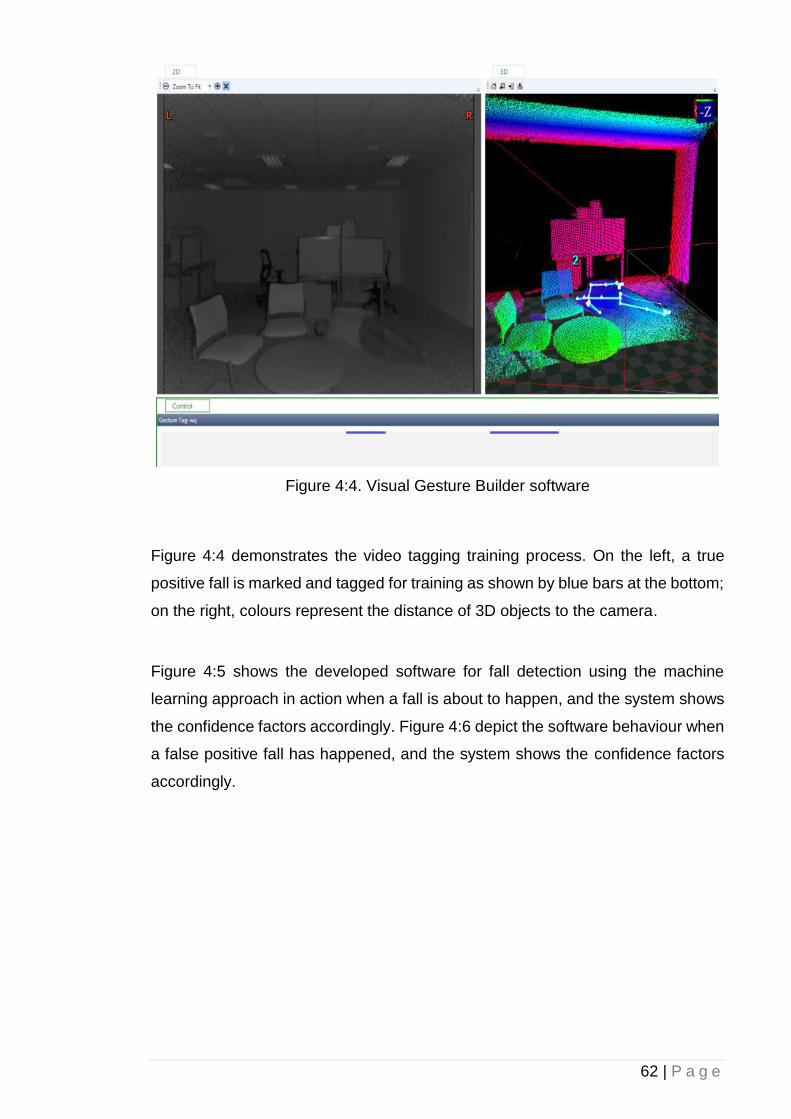
62 | P a g e
Figure 4:4. Visual Gesture Builder software
Figure 4:4 demonstrates the video tagging training process. On the left, a true
positive fall is marked and tagged for training as shown by blue bars at the bottom;
on the right, colours represent the distance of 3D objects to the camera.
Figure 4:5 shows the developed software for fall detection using the machine
learning approach in action when a fall is about to happen, and the system shows
the confidence factors accordingly. Figure 4:6 depict the software behaviour when
a false positive fall has happened, and the system shows the confidence factors
accordingly.
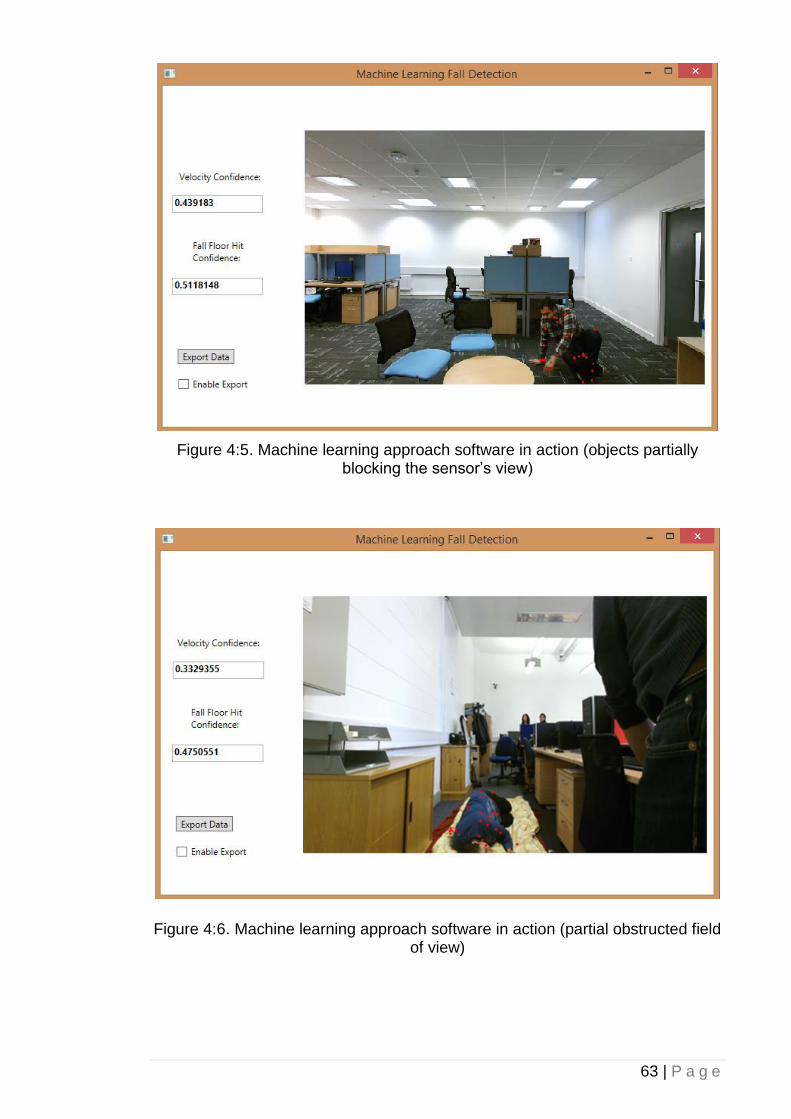
63 | P a g e
Figure 4:5. Machine learning approach software in action (objects partially blocking the sensor’s view)
Figure 4:6. Machine learning approach software in action (partial obstructed field of view)
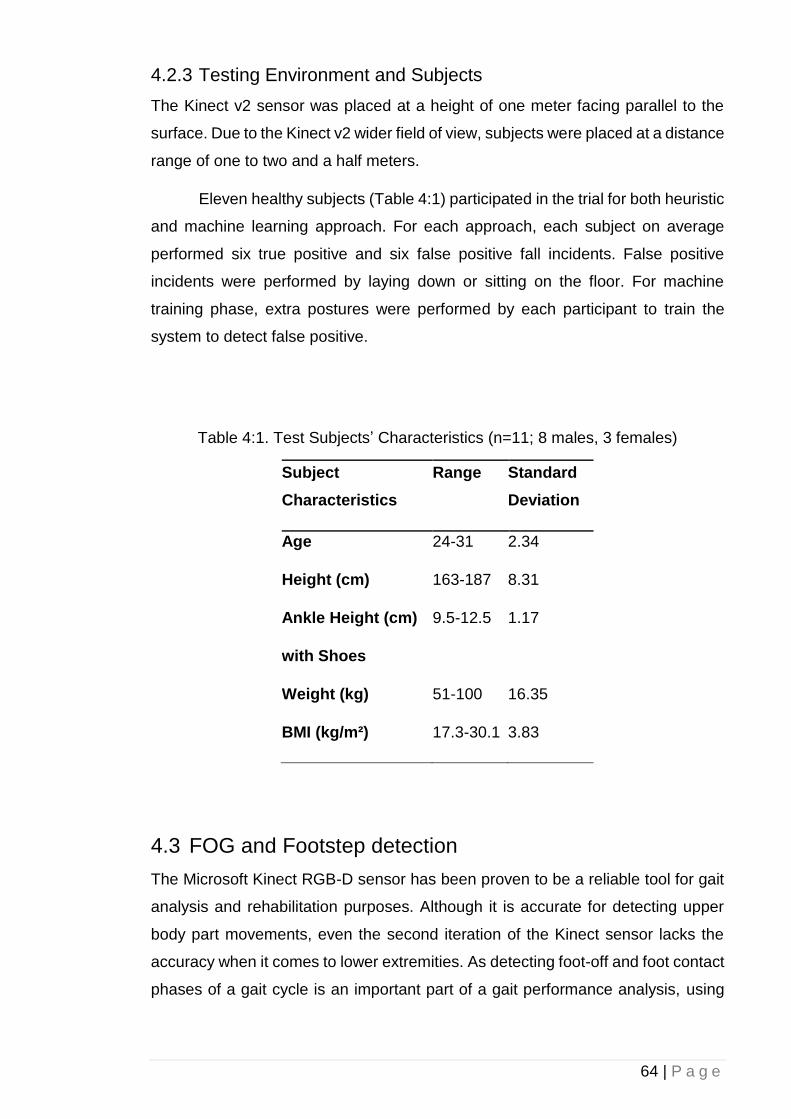
64 | P a g e
4.2.3 Testing Environment and Subjects
The Kinect v2 sensor was placed at a height of one meter facing parallel to the
surface. Due to the Kinect v2 wider field of view, subjects were placed at a distance
range of one to two and a half meters.
Eleven healthy subjects (Table 4:1) participated in the trial for both heuristic
and machine learning approach. For each approach, each subject on average
performed six true positive and six false positive fall incidents. False positive
incidents were performed by laying down or sitting on the floor. For machine
training phase, extra postures were performed by each participant to train the
system to detect false positive.
Table 4:1. Test Subjects’ Characteristics (n=11; 8 males, 3 females)
Subject
Characteristics
Range Standard
Deviation
Age 24-31 2.34
Height (cm) 163-187 8.31
Ankle Height (cm)
with Shoes
9.5-12.5 1.17
Weight (kg) 51-100 16.35
BMI (kg/m²) 17.3-30.1 3.83
4.3 FOG and Footstep detection
The Microsoft Kinect RGB-D sensor has been proven to be a reliable tool for gait
analysis and rehabilitation purposes. Although it is accurate for detecting upper
body part movements, even the second iteration of the Kinect sensor lacks the
accuracy when it comes to lower extremities. As detecting foot-off and foot contact
phases of a gait cycle is an important part of a gait performance analysis, using
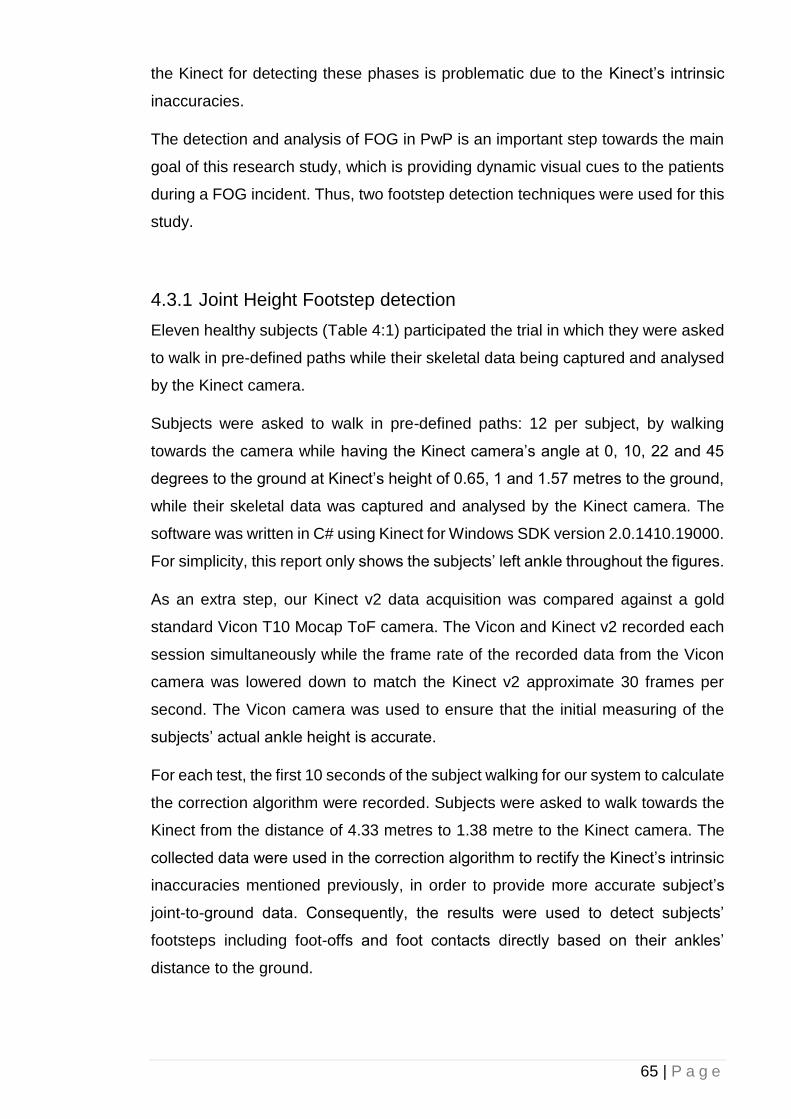
65 | P a g e
the Kinect for detecting these phases is problematic due to the Kinect’s intrinsic
inaccuracies.
The detection and analysis of FOG in PwP is an important step towards the main
goal of this research study, which is providing dynamic visual cues to the patients
during a FOG incident. Thus, two footstep detection techniques were used for this
study.
4.3.1 Joint Height Footstep detection
Eleven healthy subjects (Table 4:1) participated the trial in which they were asked
to walk in pre-defined paths while their skeletal data being captured and analysed
by the Kinect camera.
Subjects were asked to walk in pre-defined paths: 12 per subject, by walking
towards the camera while having the Kinect camera’s angle at 0, 10, 22 and 45
degrees to the ground at Kinect’s height of 0.65, 1 and 1.57 metres to the ground,
while their skeletal data was captured and analysed by the Kinect camera. The
software was written in C# using Kinect for Windows SDK version 2.0.1410.19000.
For simplicity, this report only shows the subjects’ left ankle throughout the figures.
As an extra step, our Kinect v2 data acquisition was compared against a gold
standard Vicon T10 Mocap ToF camera. The Vicon and Kinect v2 recorded each
session simultaneously while the frame rate of the recorded data from the Vicon
camera was lowered down to match the Kinect v2 approximate 30 frames per
second. The Vicon camera was used to ensure that the initial measuring of the
subjects’ actual ankle height is accurate.
For each test, the first 10 seconds of the subject walking for our system to calculate
the correction algorithm were recorded. Subjects were asked to walk towards the
Kinect from the distance of 4.33 metres to 1.38 metre to the Kinect camera. The
collected data were used in the correction algorithm to rectify the Kinect’s intrinsic
inaccuracies mentioned previously, in order to provide more accurate subject’s
joint-to-ground data. Consequently, the results were used to detect subjects’
footsteps including foot-offs and foot contacts directly based on their ankles’
distance to the ground.
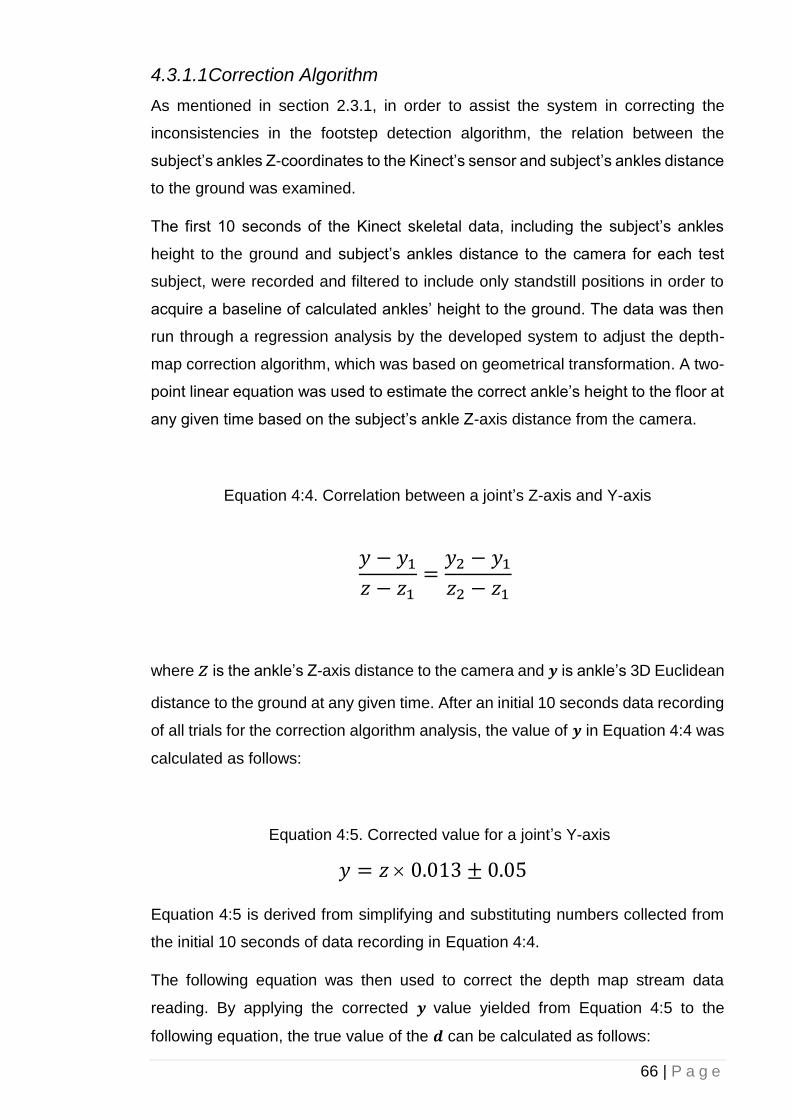
66 | P a g e
4.3.1.1 Correction Algorithm
As mentioned in section 2.3.1, in order to assist the system in correcting the
inconsistencies in the footstep detection algorithm, the relation between the
subject’s ankles Z-coordinates to the Kinect’s sensor and subject’s ankles distance
to the ground was examined.
The first 10 seconds of the Kinect skeletal data, including the subject’s ankles
height to the ground and subject’s ankles distance to the camera for each test
subject, were recorded and filtered to include only standstill positions in order to
acquire a baseline of calculated ankles’ height to the ground. The data was then
run through a regression analysis by the developed system to adjust the depth-
map correction algorithm, which was based on geometrical transformation. A two-
point linear equation was used to estimate the correct ankle’s height to the floor at
any given time based on the subject’s ankle Z-axis distance from the camera.
Equation 4:4. Correlation between a joint’s Z-axis and Y-axis
𝑦 − 𝑦1
𝑧 − 𝑧1=
𝑦2 − 𝑦1
𝑧2 − 𝑧1
where 𝑧 is the ankle’s Z-axis distance to the camera and 𝒚 is ankle’s 3D Euclidean
distance to the ground at any given time. After an initial 10 seconds data recording
of all trials for the correction algorithm analysis, the value of 𝒚 in Equation 4:4 was
calculated as follows:
Equation 4:5. Corrected value for a joint’s Y-axis
𝑦 = 𝑧 0.013 ± 0.05
Equation 4:5 is derived from simplifying and substituting numbers collected from
the initial 10 seconds of data recording in Equation 4:4.
The following equation was then used to correct the depth map stream data
reading. By applying the corrected 𝒚 value yielded from Equation 4:5 to the
following equation, the true value of the 𝒅 can be calculated as follows:
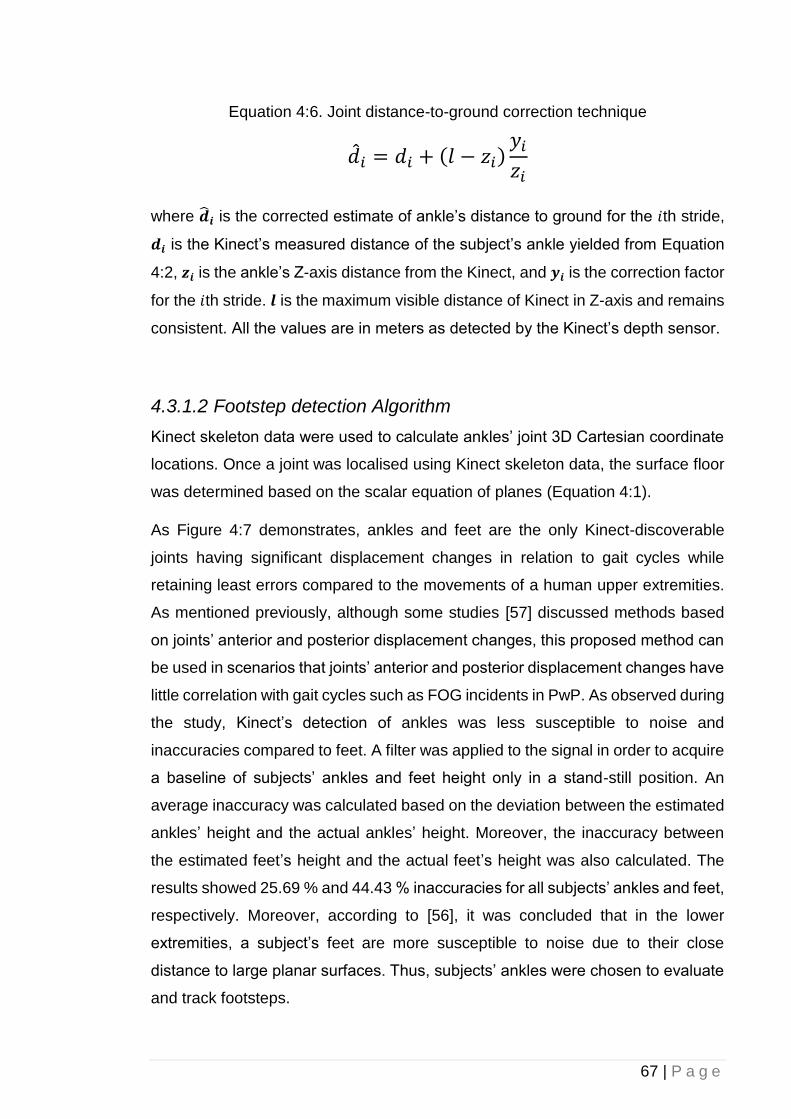
67 | P a g e
Equation 4:6. Joint distance-to-ground correction technique
�̂�𝑖 = 𝑑𝑖 + (𝑙 − 𝑧𝑖)𝑦𝑖
𝑧𝑖
where �̂�𝒊 is the corrected estimate of ankle’s distance to ground for the 𝑖th stride,
𝒅𝒊 is the Kinect’s measured distance of the subject’s ankle yielded from Equation
4:2, 𝒛𝒊 is the ankle’s Z-axis distance from the Kinect, and 𝒚𝒊 is the correction factor
for the 𝑖th stride. 𝒍 is the maximum visible distance of Kinect in Z-axis and remains
consistent. All the values are in meters as detected by the Kinect’s depth sensor.
4.3.1.2 Footstep detection Algorithm
Kinect skeleton data were used to calculate ankles’ joint 3D Cartesian coordinate
locations. Once a joint was localised using Kinect skeleton data, the surface floor
was determined based on the scalar equation of planes (Equation 4:1).
As Figure 4:7 demonstrates, ankles and feet are the only Kinect-discoverable
joints having significant displacement changes in relation to gait cycles while
retaining least errors compared to the movements of a human upper extremities.
As mentioned previously, although some studies [57] discussed methods based
on joints’ anterior and posterior displacement changes, this proposed method can
be used in scenarios that joints’ anterior and posterior displacement changes have
little correlation with gait cycles such as FOG incidents in PwP. As observed during
the study, Kinect’s detection of ankles was less susceptible to noise and
inaccuracies compared to feet. A filter was applied to the signal in order to acquire
a baseline of subjects’ ankles and feet height only in a stand-still position. An
average inaccuracy was calculated based on the deviation between the estimated
ankles’ height and the actual ankles’ height. Moreover, the inaccuracy between
the estimated feet’s height and the actual feet’s height was also calculated. The
results showed 25.69 % and 44.43 % inaccuracies for all subjects’ ankles and feet,
respectively. Moreover, according to [56], it was concluded that in the lower
extremities, a subject’s feet are more susceptible to noise due to their close
distance to large planar surfaces. Thus, subjects’ ankles were chosen to evaluate
and track footsteps.
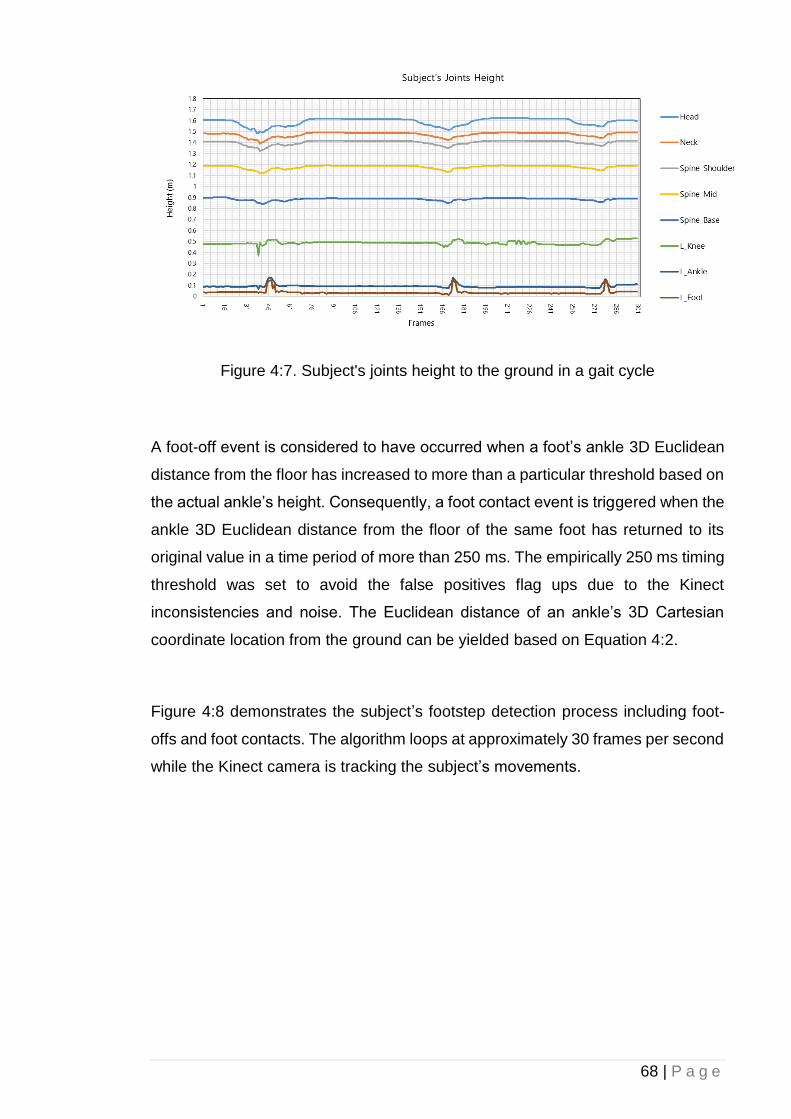
68 | P a g e
Figure 4:7. Subject's joints height to the ground in a gait cycle
A foot-off event is considered to have occurred when a foot’s ankle 3D Euclidean
distance from the floor has increased to more than a particular threshold based on
the actual ankle’s height. Consequently, a foot contact event is triggered when the
ankle 3D Euclidean distance from the floor of the same foot has returned to its
original value in a time period of more than 250 ms. The empirically 250 ms timing
threshold was set to avoid the false positives flag ups due to the Kinect
inconsistencies and noise. The Euclidean distance of an ankle’s 3D Cartesian
coordinate location from the ground can be yielded based on Equation 4:2.
Figure 4:8 demonstrates the subject’s footstep detection process including foot-
offs and foot contacts. The algorithm loops at approximately 30 frames per second
while the Kinect camera is tracking the subject’s movements.
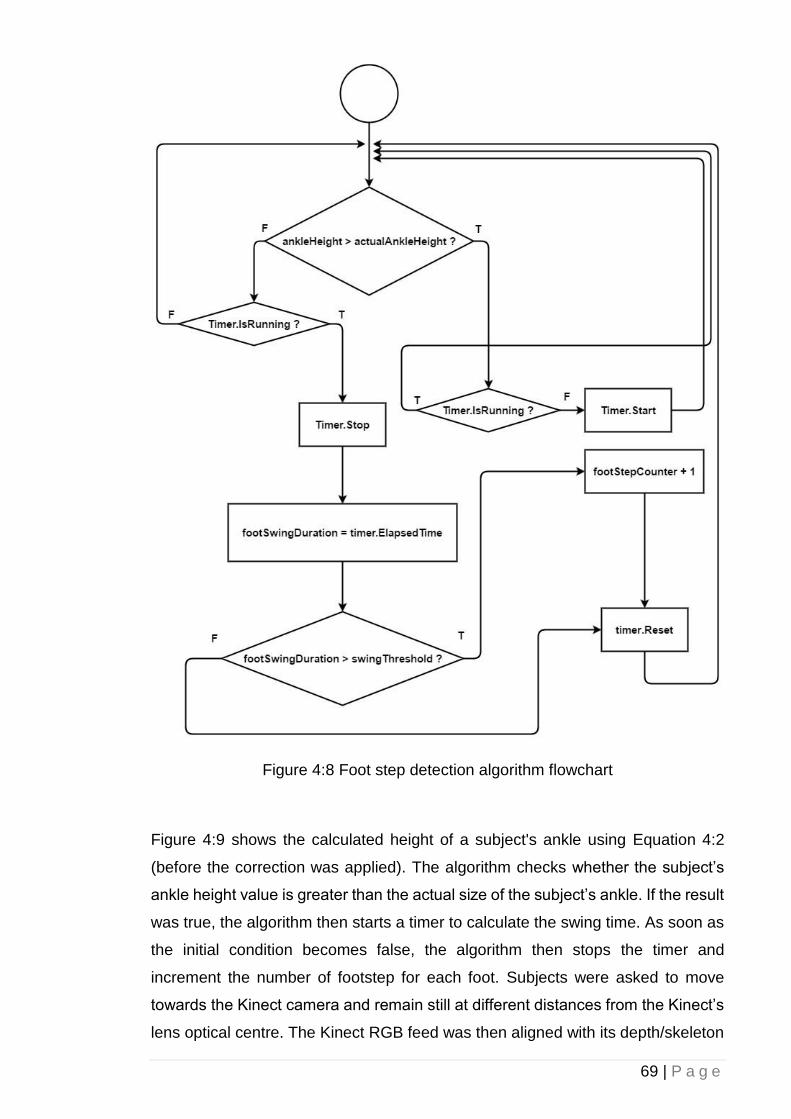
69 | P a g e
Figure 4:8 Foot step detection algorithm flowchart
Figure 4:9 shows the calculated height of a subject's ankle using Equation 4:2
(before the correction was applied). The algorithm checks whether the subject’s
ankle height value is greater than the actual size of the subject’s ankle. If the result
was true, the algorithm then starts a timer to calculate the swing time. As soon as
the initial condition becomes false, the algorithm then stops the timer and
increment the number of footstep for each foot. Subjects were asked to move
towards the Kinect camera and remain still at different distances from the Kinect’s
lens optical centre. The Kinect RGB feed was then aligned with its depth/skeleton
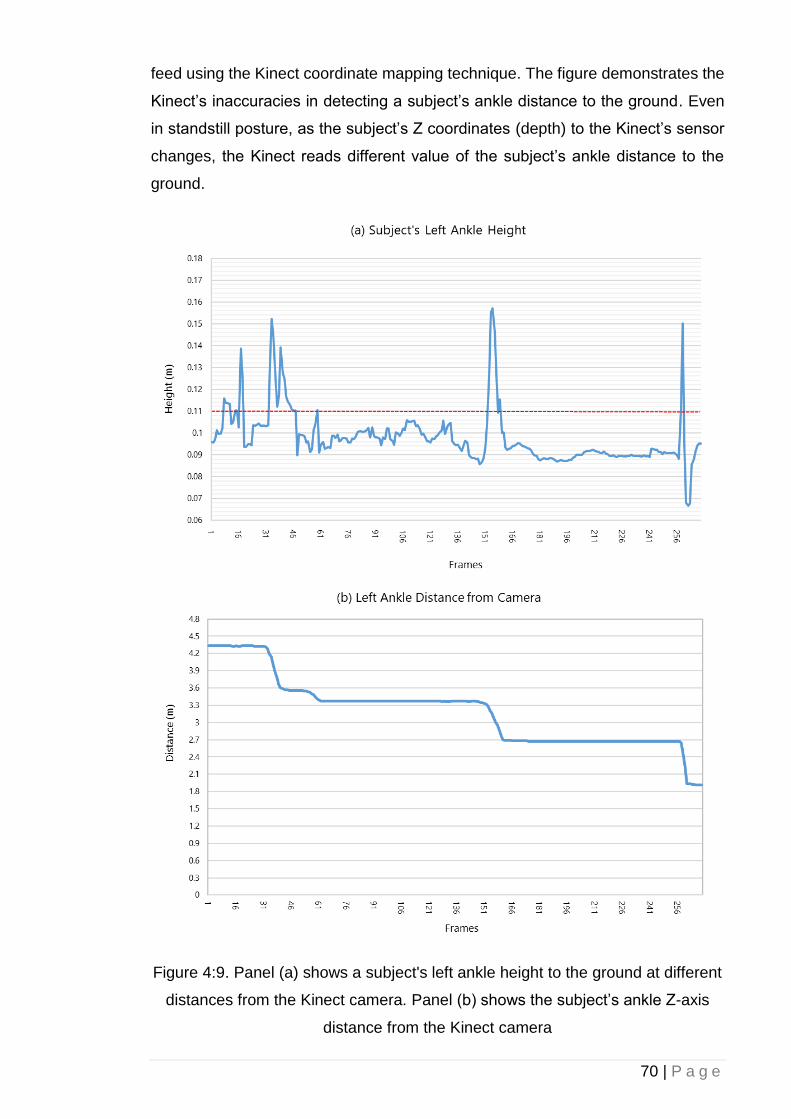
70 | P a g e
feed using the Kinect coordinate mapping technique. The figure demonstrates the
Kinect’s inaccuracies in detecting a subject’s ankle distance to the ground. Even
in standstill posture, as the subject’s Z coordinates (depth) to the Kinect’s sensor
changes, the Kinect reads different value of the subject’s ankle distance to the
ground.
Figure 4:9. Panel (a) shows a subject's left ankle height to the ground at different
distances from the Kinect camera. Panel (b) shows the subject’s ankle Z-axis
distance from the Kinect camera
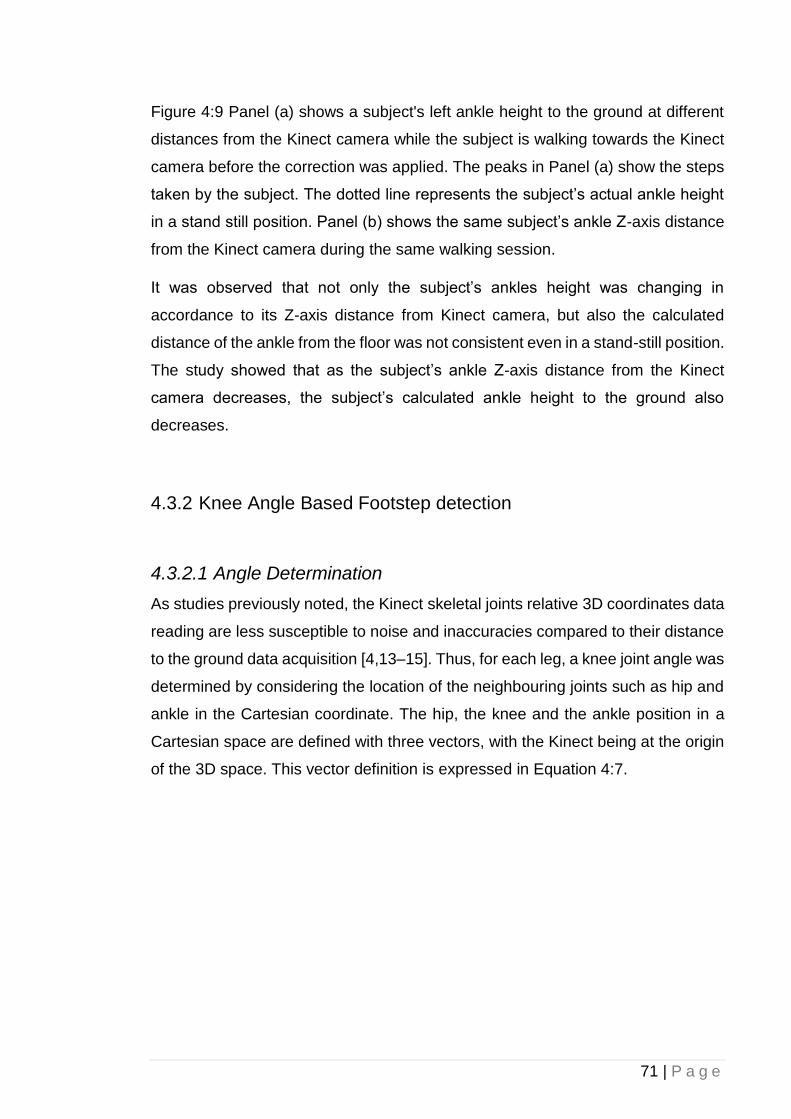
71 | P a g e
Figure 4:9 Panel (a) shows a subject's left ankle height to the ground at different
distances from the Kinect camera while the subject is walking towards the Kinect
camera before the correction was applied. The peaks in Panel (a) show the steps
taken by the subject. The dotted line represents the subject’s actual ankle height
in a stand still position. Panel (b) shows the same subject’s ankle Z-axis distance
from the Kinect camera during the same walking session.
It was observed that not only the subject’s ankles height was changing in
accordance to its Z-axis distance from Kinect camera, but also the calculated
distance of the ankle from the floor was not consistent even in a stand-still position.
The study showed that as the subject’s ankle Z-axis distance from the Kinect
camera decreases, the subject’s calculated ankle height to the ground also
decreases.
4.3.2 Knee Angle Based Footstep detection
4.3.2.1 Angle Determination
As studies previously noted, the Kinect skeletal joints relative 3D coordinates data
reading are less susceptible to noise and inaccuracies compared to their distance
to the ground data acquisition [4,13–15]. Thus, for each leg, a knee joint angle was
determined by considering the location of the neighbouring joints such as hip and
ankle in the Cartesian coordinate. The hip, the knee and the ankle position in a
Cartesian space are defined with three vectors, with the Kinect being at the origin
of the 3D space. This vector definition is expressed in Equation 4:7.
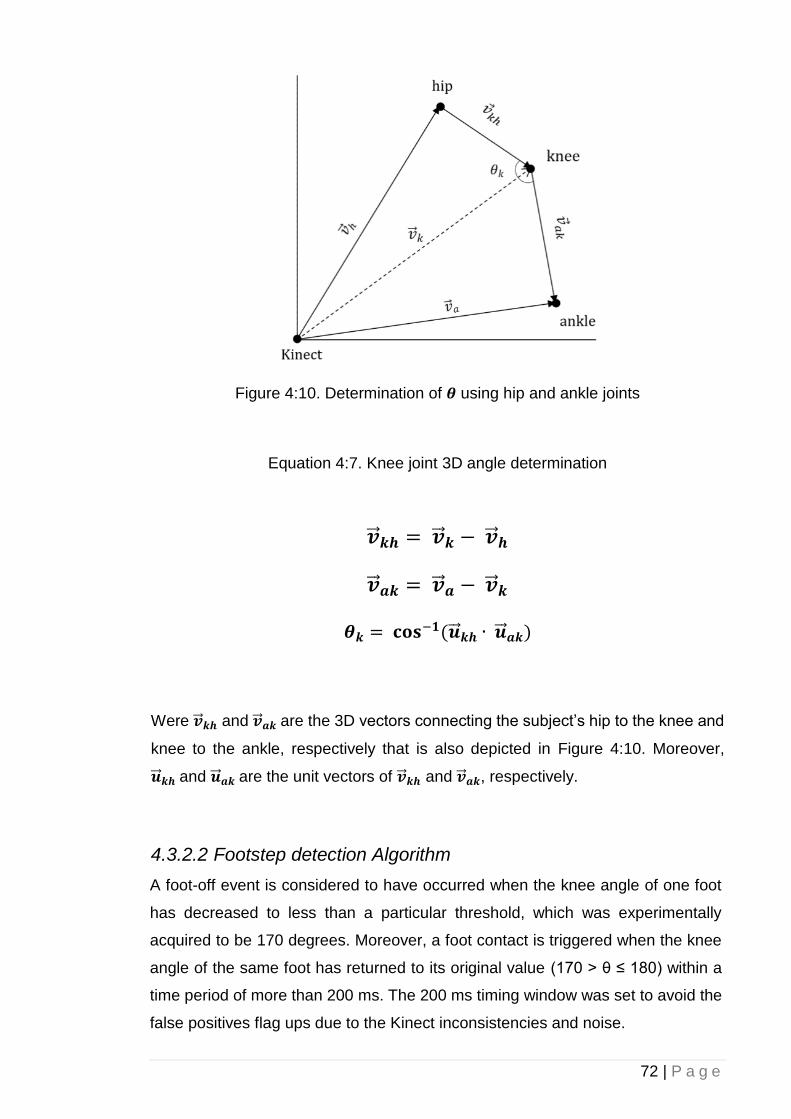
72 | P a g e
Figure 4:10. Determination of 𝜽 using hip and ankle joints
Equation 4:7. Knee joint 3D angle determination
�⃗⃗� 𝒌𝒉 = �⃗⃗� 𝒌 − �⃗⃗� 𝒉
�⃗⃗� 𝒂𝒌 = �⃗⃗� 𝒂 − �⃗⃗� 𝒌
𝜽𝒌 = 𝐜𝐨𝐬−𝟏(�⃗⃗� 𝒌𝒉 ∙ �⃗⃗� 𝒂𝒌)
Were �⃗⃗� 𝒌𝒉 and �⃗⃗� 𝒂𝒌 are the 3D vectors connecting the subject’s hip to the knee and
knee to the ankle, respectively that is also depicted in Figure 4:10. Moreover,
�⃗⃗� 𝒌𝒉 and �⃗⃗� 𝒂𝒌 are the unit vectors of �⃗⃗� 𝒌𝒉 and �⃗⃗� 𝒂𝒌, respectively.
4.3.2.2 Footstep detection Algorithm
A foot-off event is considered to have occurred when the knee angle of one foot
has decreased to less than a particular threshold, which was experimentally
acquired to be 170 degrees. Moreover, a foot contact is triggered when the knee
angle of the same foot has returned to its original value (170 > θ ≤ 180) within a
time period of more than 200 ms. The 200 ms timing window was set to avoid the
false positives flag ups due to the Kinect inconsistencies and noise.
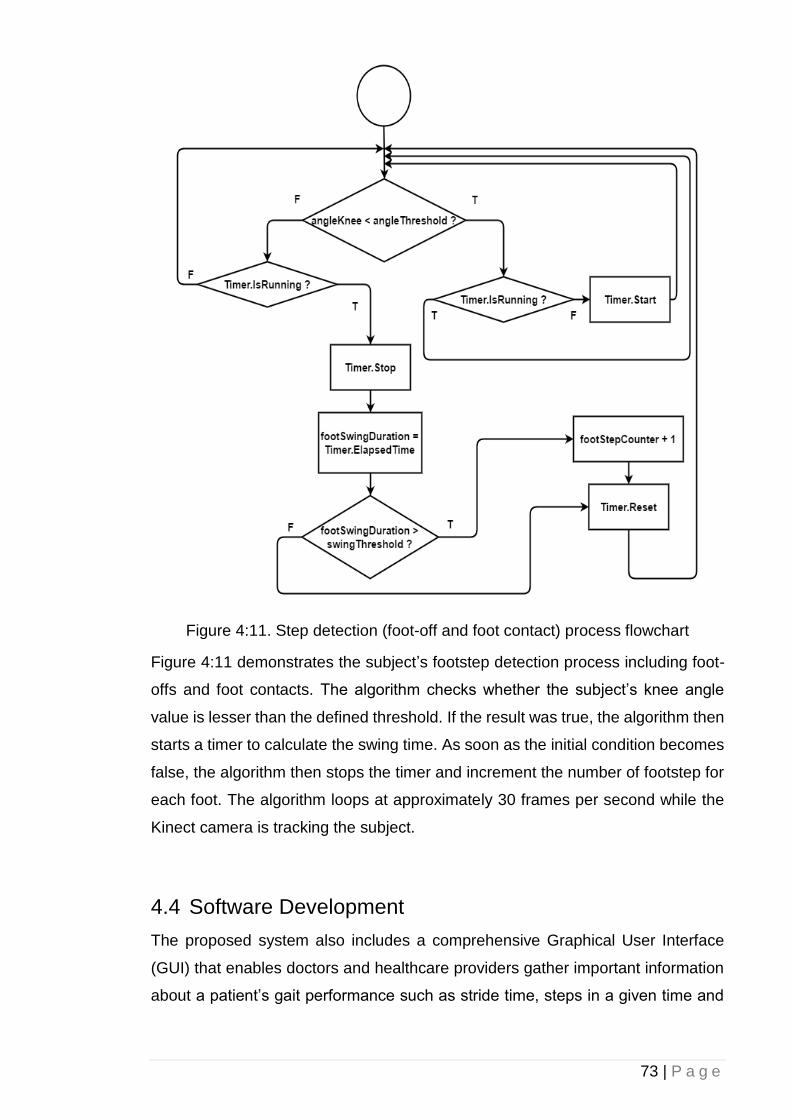
73 | P a g e
Figure 4:11. Step detection (foot-off and foot contact) process flowchart
Figure 4:11 demonstrates the subject’s footstep detection process including foot-
offs and foot contacts. The algorithm checks whether the subject’s knee angle
value is lesser than the defined threshold. If the result was true, the algorithm then
starts a timer to calculate the swing time. As soon as the initial condition becomes
false, the algorithm then stops the timer and increment the number of footstep for
each foot. The algorithm loops at approximately 30 frames per second while the
Kinect camera is tracking the subject.
4.4 Software Development
The proposed system also includes a comprehensive Graphical User Interface
(GUI) that enables doctors and healthcare providers gather important information
about a patient’s gait performance such as stride time, steps in a given time and
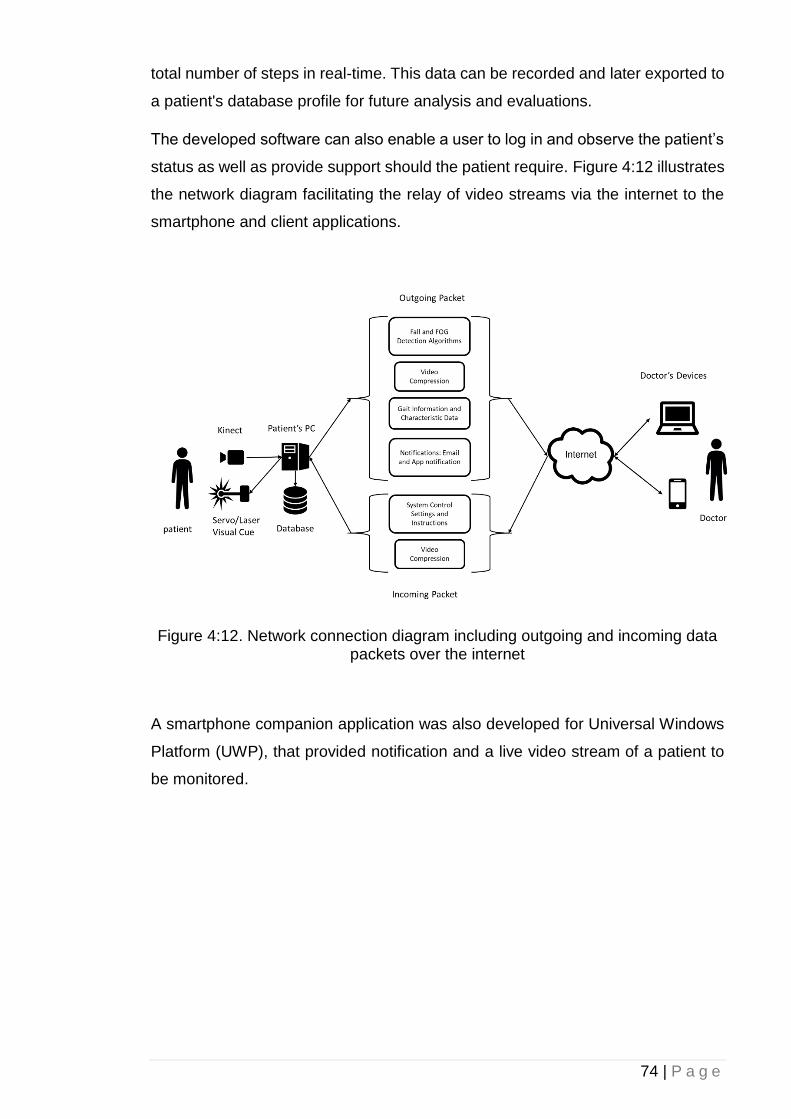
74 | P a g e
total number of steps in real-time. This data can be recorded and later exported to
a patient's database profile for future analysis and evaluations.
The developed software can also enable a user to log in and observe the patient’s
status as well as provide support should the patient require. Figure 4:12 illustrates
the network diagram facilitating the relay of video streams via the internet to the
smartphone and client applications.
Figure 4:12. Network connection diagram including outgoing and incoming data packets over the internet
A smartphone companion application was also developed for Universal Windows
Platform (UWP), that provided notification and a live video stream of a patient to
be monitored.
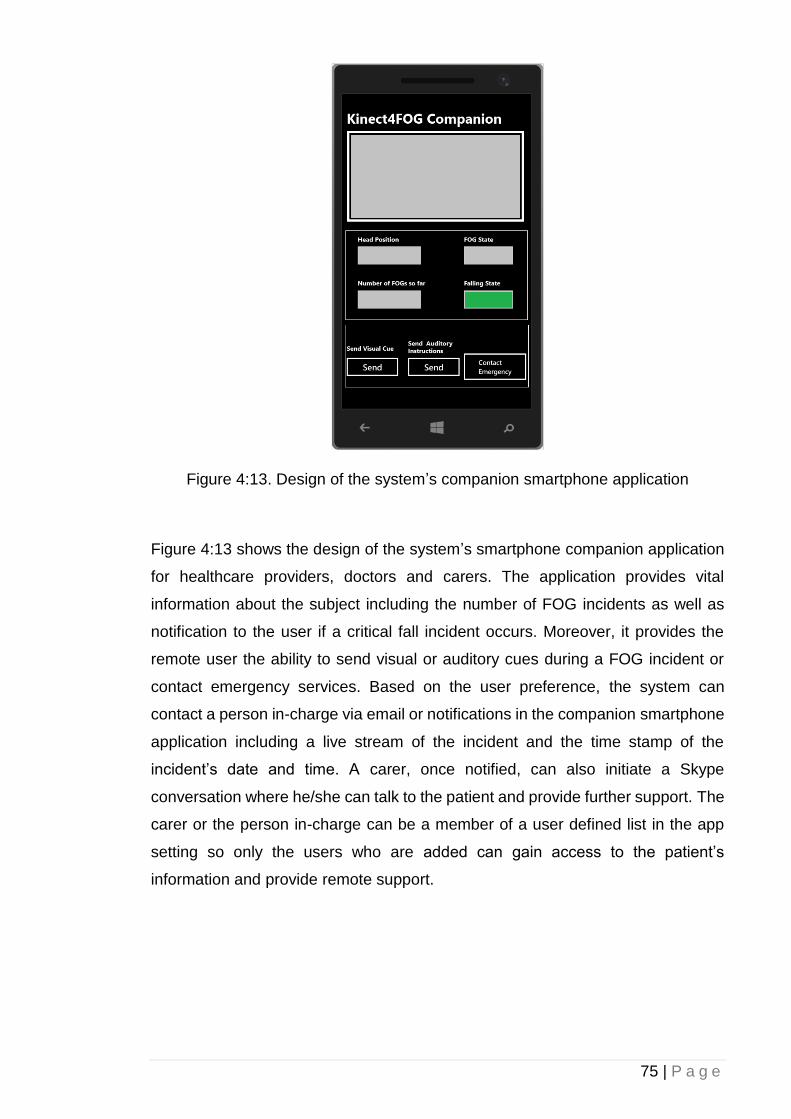
75 | P a g e
Figure 4:13. Design of the system’s companion smartphone application
Figure 4:13 shows the design of the system’s smartphone companion application
for healthcare providers, doctors and carers. The application provides vital
information about the subject including the number of FOG incidents as well as
notification to the user if a critical fall incident occurs. Moreover, it provides the
remote user the ability to send visual or auditory cues during a FOG incident or
contact emergency services. Based on the user preference, the system can
contact a person in-charge via email or notifications in the companion smartphone
application including a live stream of the incident and the time stamp of the
incident’s date and time. A carer, once notified, can also initiate a Skype
conversation where he/she can talk to the patient and provide further support. The
carer or the person in-charge can be a member of a user defined list in the app
setting so only the users who are added can gain access to the patient’s
information and provide remote support.
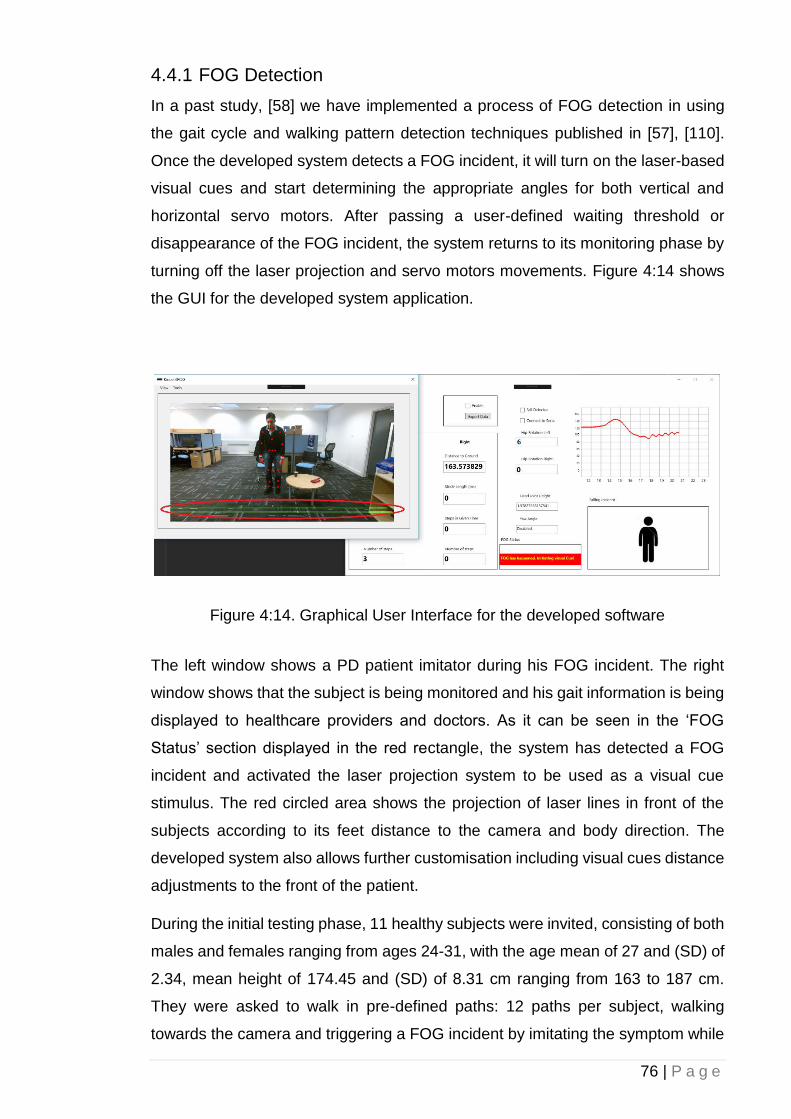
76 | P a g e
4.4.1 FOG Detection
In a past study, [58] we have implemented a process of FOG detection in using
the gait cycle and walking pattern detection techniques published in [57], [110].
Once the developed system detects a FOG incident, it will turn on the laser-based
visual cues and start determining the appropriate angles for both vertical and
horizontal servo motors. After passing a user-defined waiting threshold or
disappearance of the FOG incident, the system returns to its monitoring phase by
turning off the laser projection and servo motors movements. Figure 4:14 shows
the GUI for the developed system application.
Figure 4:14. Graphical User Interface for the developed software
The left window shows a PD patient imitator during his FOG incident. The right
window shows that the subject is being monitored and his gait information is being
displayed to healthcare providers and doctors. As it can be seen in the ‘FOG
Status’ section displayed in the red rectangle, the system has detected a FOG
incident and activated the laser projection system to be used as a visual cue
stimulus. The red circled area shows the projection of laser lines in front of the
subjects according to its feet distance to the camera and body direction. The
developed system also allows further customisation including visual cues distance
adjustments to the front of the patient.
During the initial testing phase, 11 healthy subjects were invited, consisting of both
males and females ranging from ages 24-31, with the age mean of 27 and (SD) of
2.34, mean height of 174.45 and (SD) of 8.31 cm ranging from 163 to 187 cm.
They were asked to walk in pre-defined paths: 12 paths per subject, walking
towards the camera and triggering a FOG incident by imitating the symptom while
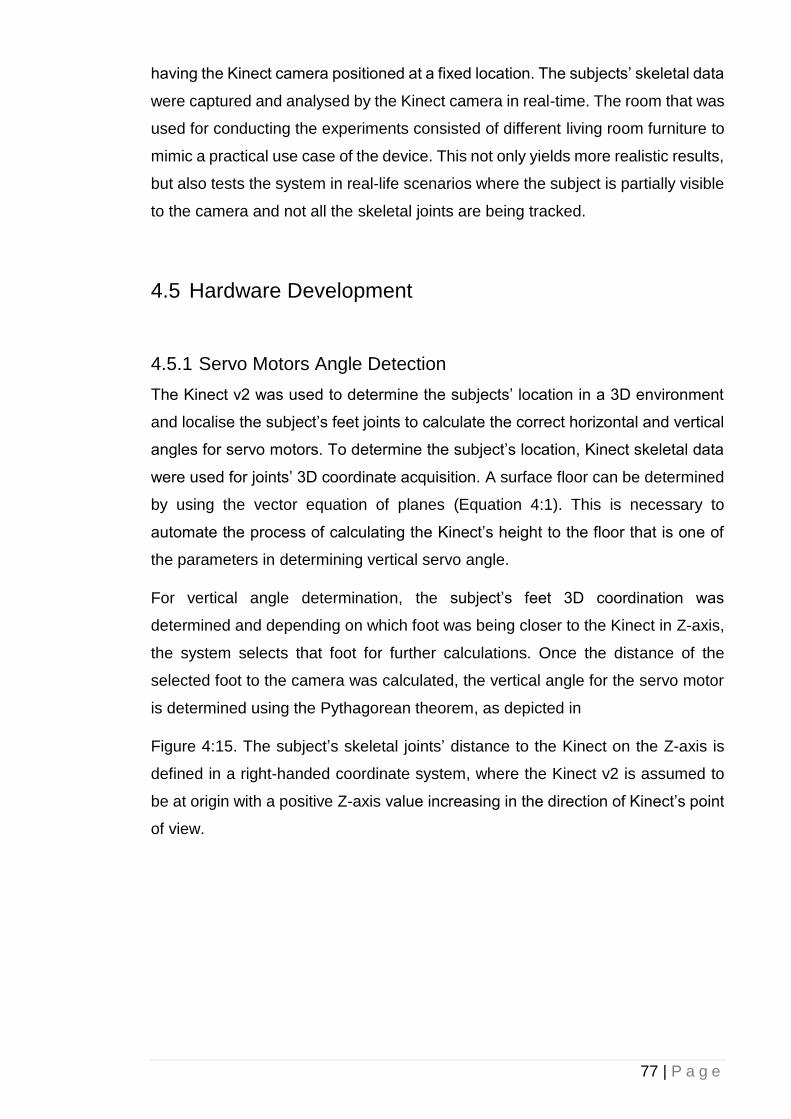
77 | P a g e
having the Kinect camera positioned at a fixed location. The subjects’ skeletal data
were captured and analysed by the Kinect camera in real-time. The room that was
used for conducting the experiments consisted of different living room furniture to
mimic a practical use case of the device. This not only yields more realistic results,
but also tests the system in real-life scenarios where the subject is partially visible
to the camera and not all the skeletal joints are being tracked.
4.5 Hardware Development
4.5.1 Servo Motors Angle Detection
The Kinect v2 was used to determine the subjects’ location in a 3D environment
and localise the subject’s feet joints to calculate the correct horizontal and vertical
angles for servo motors. To determine the subject’s location, Kinect skeletal data
were used for joints’ 3D coordinate acquisition. A surface floor can be determined
by using the vector equation of planes (Equation 4:1). This is necessary to
automate the process of calculating the Kinect’s height to the floor that is one of
the parameters in determining vertical servo angle.
For vertical angle determination, the subject’s feet 3D coordination was
determined and depending on which foot was being closer to the Kinect in Z-axis,
the system selects that foot for further calculations. Once the distance of the
selected foot to the camera was calculated, the vertical angle for the servo motor
is determined using the Pythagorean theorem, as depicted in
Figure 4:15. The subject’s skeletal joints’ distance to the Kinect on the Z-axis is
defined in a right-handed coordinate system, where the Kinect v2 is assumed to
be at origin with a positive Z-axis value increasing in the direction of Kinect’s point
of view.
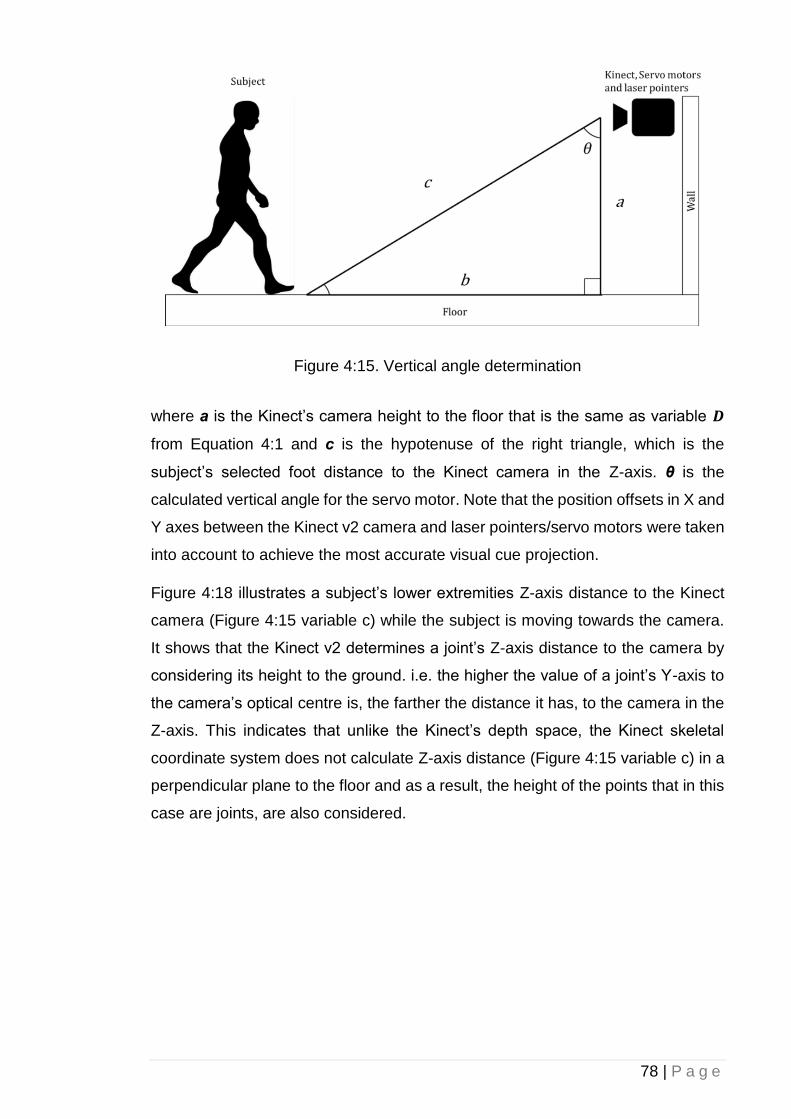
78 | P a g e
Figure 4:15. Vertical angle determination
where a is the Kinect’s camera height to the floor that is the same as variable 𝑫
from Equation 4:1 and c is the hypotenuse of the right triangle, which is the
subject’s selected foot distance to the Kinect camera in the Z-axis. θ is the
calculated vertical angle for the servo motor. Note that the position offsets in X and
Y axes between the Kinect v2 camera and laser pointers/servo motors were taken
into account to achieve the most accurate visual cue projection.
Figure 4:18 illustrates a subject’s lower extremities Z-axis distance to the Kinect
camera (Figure 4:15 variable c) while the subject is moving towards the camera.
It shows that the Kinect v2 determines a joint’s Z-axis distance to the camera by
considering its height to the ground. i.e. the higher the value of a joint’s Y-axis to
the camera’s optical centre is, the farther the distance it has, to the camera in the
Z-axis. This indicates that unlike the Kinect’s depth space, the Kinect skeletal
coordinate system does not calculate Z-axis distance (Figure 4:15 variable c) in a
perpendicular plane to the floor and as a result, the height of the points that in this
case are joints, are also considered.
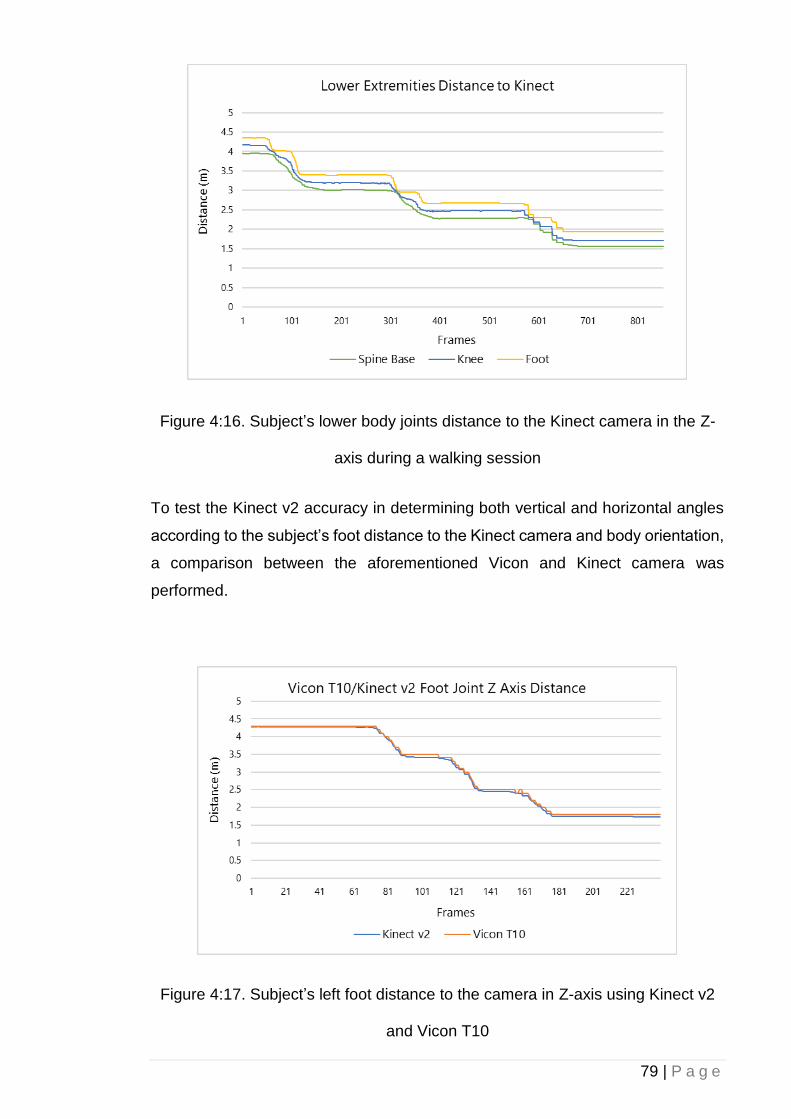
79 | P a g e
Figure 4:16. Subject’s lower body joints distance to the Kinect camera in the Z-
axis during a walking session
To test the Kinect v2 accuracy in determining both vertical and horizontal angles
according to the subject’s foot distance to the Kinect camera and body orientation,
a comparison between the aforementioned Vicon and Kinect camera was
performed.
Figure 4:17. Subject’s left foot distance to the camera in Z-axis using Kinect v2
and Vicon T10
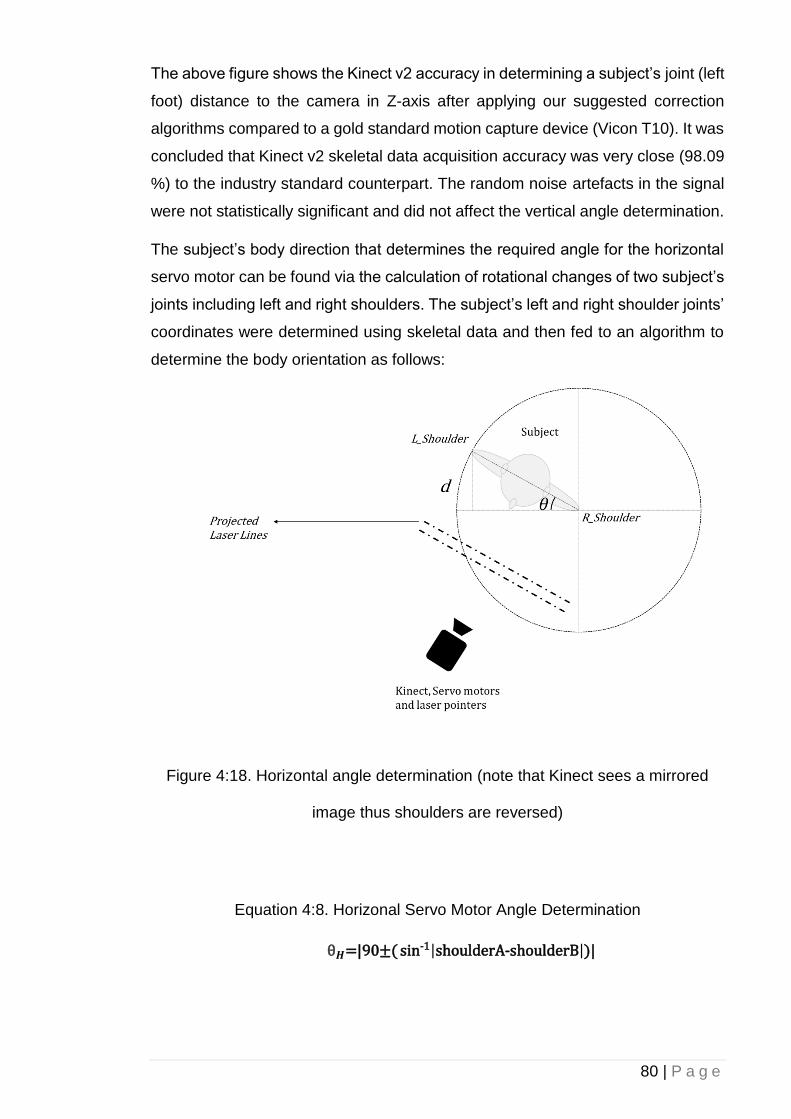
80 | P a g e
The above figure shows the Kinect v2 accuracy in determining a subject’s joint (left
foot) distance to the camera in Z-axis after applying our suggested correction
algorithms compared to a gold standard motion capture device (Vicon T10). It was
concluded that Kinect v2 skeletal data acquisition accuracy was very close (98.09
%) to the industry standard counterpart. The random noise artefacts in the signal
were not statistically significant and did not affect the vertical angle determination.
The subject’s body direction that determines the required angle for the horizontal
servo motor can be found via the calculation of rotational changes of two subject’s
joints including left and right shoulders. The subject’s left and right shoulder joints’
coordinates were determined using skeletal data and then fed to an algorithm to
determine the body orientation as follows:
Figure 4:18. Horizontal angle determination (note that Kinect sees a mirrored
image thus shoulders are reversed)
Equation 4:8. Horizonal Servo Motor Angle Determination
θ𝑯=|90±( sin-1|shoulderA-shoulderB|)|
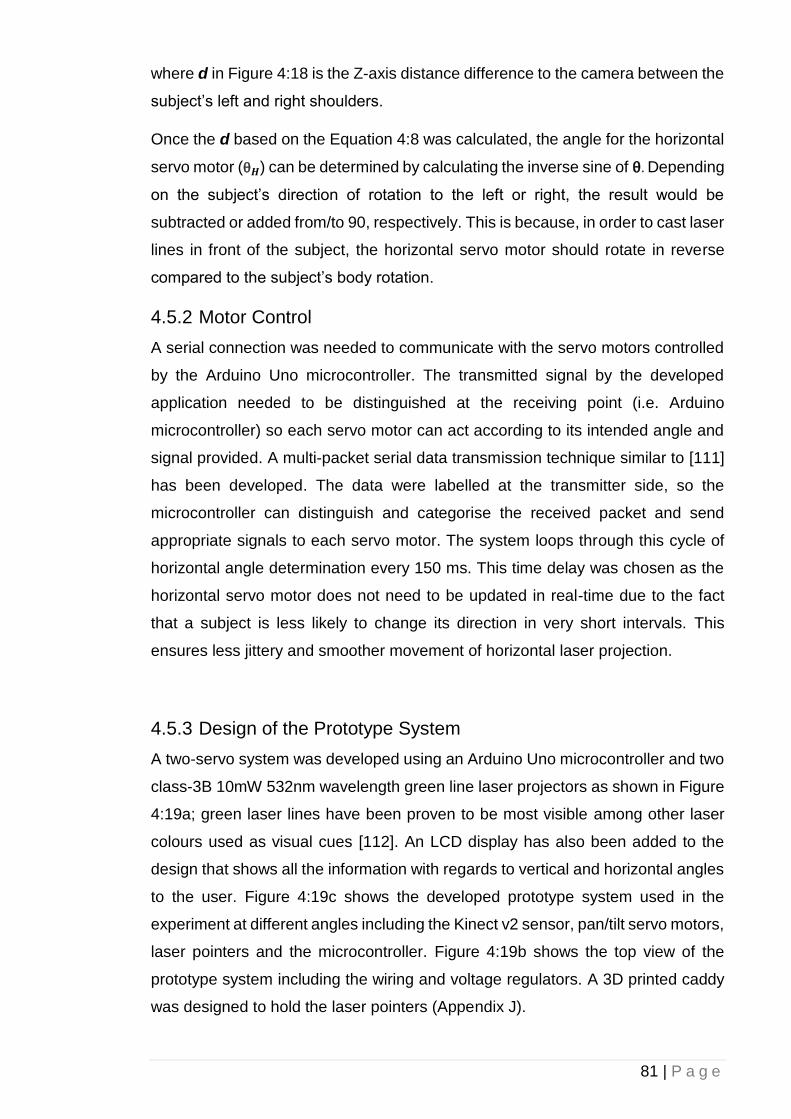
81 | P a g e
where d in Figure 4:18 is the Z-axis distance difference to the camera between the
subject’s left and right shoulders.
Once the d based on the Equation 4:8 was calculated, the angle for the horizontal
servo motor (θ𝑯) can be determined by calculating the inverse sine of θ. Depending
on the subject’s direction of rotation to the left or right, the result would be
subtracted or added from/to 90, respectively. This is because, in order to cast laser
lines in front of the subject, the horizontal servo motor should rotate in reverse
compared to the subject’s body rotation.
4.5.2 Motor Control
A serial connection was needed to communicate with the servo motors controlled
by the Arduino Uno microcontroller. The transmitted signal by the developed
application needed to be distinguished at the receiving point (i.e. Arduino
microcontroller) so each servo motor can act according to its intended angle and
signal provided. A multi-packet serial data transmission technique similar to [111]
has been developed. The data were labelled at the transmitter side, so the
microcontroller can distinguish and categorise the received packet and send
appropriate signals to each servo motor. The system loops through this cycle of
horizontal angle determination every 150 ms. This time delay was chosen as the
horizontal servo motor does not need to be updated in real-time due to the fact
that a subject is less likely to change its direction in very short intervals. This
ensures less jittery and smoother movement of horizontal laser projection.
4.5.3 Design of the Prototype System
A two-servo system was developed using an Arduino Uno microcontroller and two
class-3B 10mW 532nm wavelength green line laser projectors as shown in Figure
4:19a; green laser lines have been proven to be most visible among other laser
colours used as visual cues [112]. An LCD display has also been added to the
design that shows all the information with regards to vertical and horizontal angles
to the user. Figure 4:19c shows the developed prototype system used in the
experiment at different angles including the Kinect v2 sensor, pan/tilt servo motors,
laser pointers and the microcontroller. Figure 4:19b shows the top view of the
prototype system including the wiring and voltage regulators. A 3D printed caddy
was designed to hold the laser pointers (Appendix J).
82 | P a g e
Figure 4:19. Developed prototype of the automatic visual cue system. a) The two
step motors controlling the horizontal and vertical alignment of the system. b) A
top view of the Kinect v2 combined with the micro controller and voltage
regulators c) A view of the prototype system in action
As mentioned before, a micro controller based on Arduino Uno was employed to
controller the movement of both horizontal and vertical servo motors as well as
providing signals to the laser pointers. The board was also used to provide
information to the LCD panel during the monitoring phase. Figure 4:20 illustrates
the schematic diagram of the designed prototype hardware and the connection
between each component.
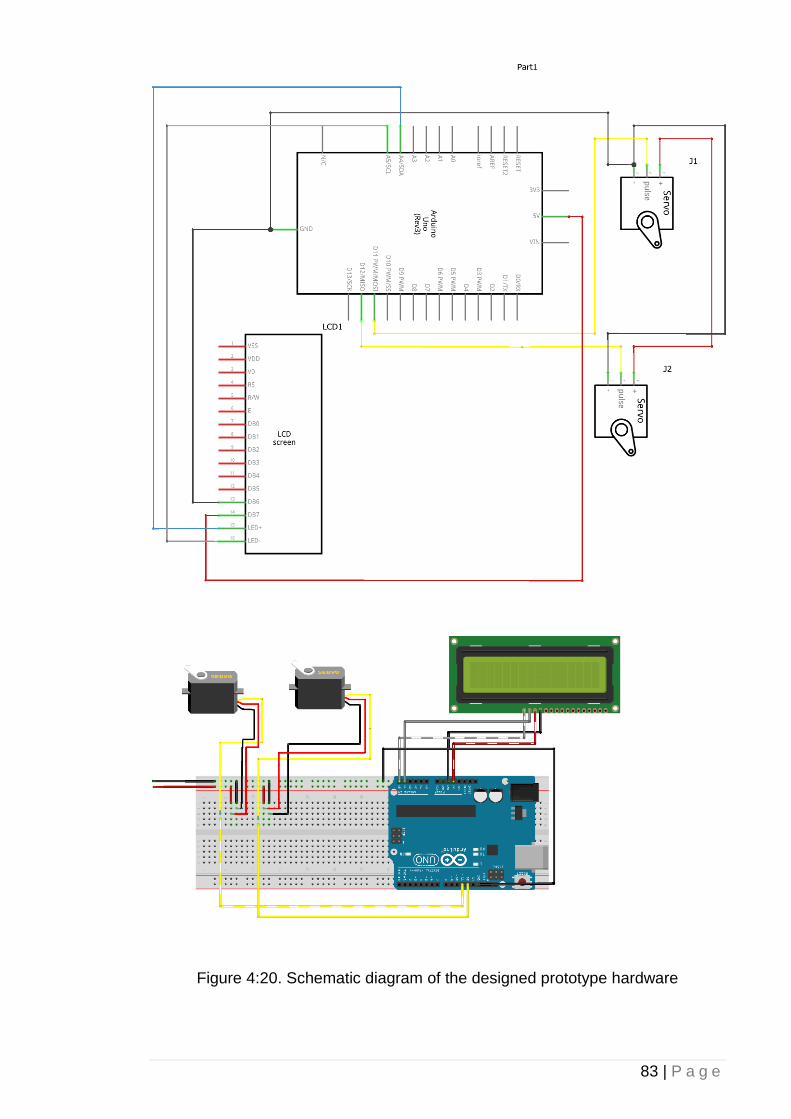
83 | P a g e
Figure 4:20. Schematic diagram of the designed prototype hardware

84 | P a g e
4.6 Focus Group and Patients Participation
Once the prototype system including the hardware, software and algorithms were
chosen for the study, PwP where invited to participate in a focus group. The aim
of the focus group was to review the functionality and performance of the
developed system and provide valuable feedback on how to improve the prototype
system. Fifteen PwP (12 male, 3 female) participated in the focus group in which
seven PwP volunteered to directly interact with and evaluate the system. The 15
volunteers were split up in to three groups of five people.
They were invited to attend an event where the system’s capabilities were
demonstrated in terms of monitoring patient’s FOG status, fall-detection, and
providing sensory cues for improving locomotion during FOG. Participants were
provided the opportunity to experience the system themselves as an option. They
were allowed to walk towards the camera while being monitored, assess the
system’s capabilities for visual cues projection and observe the dynamic laser lines
in action, as majority suffer frequent FOG. Moreover, the falling incidents were
simulated by a healthy adult to demonstrates the system’s fall detection and live
support capabilities. Seven of those 15 participants tested the system.
Nonetheless, all 15 of them observed the prototype system in operation. Seven
patients who volunteered to test the system were split in to three groups, attending
in three different sessions.
Participants were recruited from local support groups managed by Parkinson’s UK
(Appendix E). Potential participants were given written information about the study
and were invited to participate (Appendices F and G). They were reminded that
they were under no obligation to take part and could withdraw at any time. All
participants provided written and informed consent (Appendix C). All investigations
were carried out according to the principles laid down by the Declaration of Helsinki
of 1975, revised in 2008. Ethical approval for the research was granted by Brunel
University London’s ethics committee (Appendices B and D). A risk assessment
investigation was also conducted in order to assess the testing environment and
laser projection system (Appendix A).
The population age of the 15 PwP participating in the focus group ranged from 54-
78, with a standard deviation (SD) of 8.01 years of having PD, population (SD) of
4.99 ranging from 0.5 to 18 years and daily FOG frequency population (SD) of 4.31
ranging from 3 to 20 episodes (Table 4:2). The aim of the focus group was to
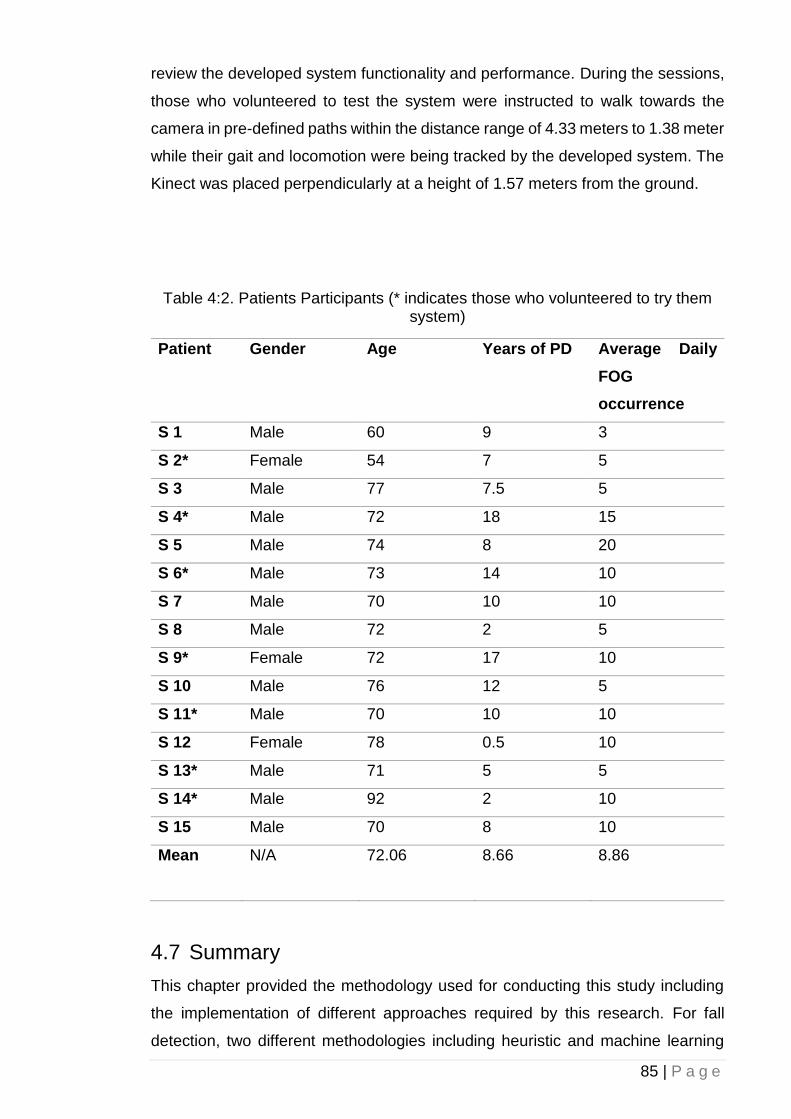
85 | P a g e
review the developed system functionality and performance. During the sessions,
those who volunteered to test the system were instructed to walk towards the
camera in pre-defined paths within the distance range of 4.33 meters to 1.38 meter
while their gait and locomotion were being tracked by the developed system. The
Kinect was placed perpendicularly at a height of 1.57 meters from the ground.
Table 4:2. Patients Participants (* indicates those who volunteered to try them system)
Patient Gender Age Years of PD Average Daily
FOG
occurrence
S 1 Male 60 9 3
S 2* Female 54 7 5
S 3 Male 77 7.5 5
S 4* Male 72 18 15
S 5 Male 74 8 20
S 6* Male 73 14 10
S 7 Male 70 10 10
S 8 Male 72 2 5
S 9* Female 72 17 10
S 10 Male 76 12 5
S 11* Male 70 10 10
S 12 Female 78 0.5 10
S 13* Male 71 5 5
S 14* Male 92 2 10
S 15 Male 70 8 10
Mean N/A 72.06 8.66 8.86
4.7 Summary
This chapter provided the methodology used for conducting this study including
the implementation of different approaches required by this research. For fall
detection, two different methodologies including heuristic and machine learning
86 | P a g e
were used. In order to estimate FOG events, footsteps occurrences were also
explored using two different methods one based on knee angle and one based on
the subject’s ankles height to the floor, in which a new correction algorithm was
introduced to address the Kinect’s intrinsic inaccuracies. Moreover, the prototype
design of the system including the software and hardware was developed during
this stage and put on test. Several PwP were also invited to test the prototype as
part of a focus group. The detailed information about the results of the experiments
will be explained in the next chapter.

87 | P a g e
5 Chapter 5: Results and Discussion
5.1 Introduction
This capture covers the results and data found during this research. The conditions
for each experiment conducted in this study will be indicated and analysed.
Moreover, this chapter includes the comparison of the results of this study against
previous findings in related studies mentioned in the literature.
5.2 Experimental Setup
5.2.1 System Specifications
The system’s hardware specifications used in all the computations and collection
of the data phases as well as the machine learning and testing process are as
follow:
Model: Viglen Genie Full
CPU: Intel (R) Core(TM) i7-4790 CPU @ 3.60GHz
Internal Memory (RAM): 24.00 GB (23.8 usable) DDR3 in Dual Channel mode
Graphics Card: AMD FirePro W5000 (2 GB VRAM)
System Type: 64-bit Operating System, x64-based processor
Operating System: Windows 8 Enterprise upgraded to Windows 10 Education
The developed software was written in C# using Kinect for Windows SDK version
2.0.1410.19000 while the companion smartphone application was based on
Windows 10 Mobile (10.0; Build 10240) and the client software was developed
using Windows Presentation Foundation (WPF).
5.2.2 Testing Environment
A testing environment was used to carry out the trials as below:
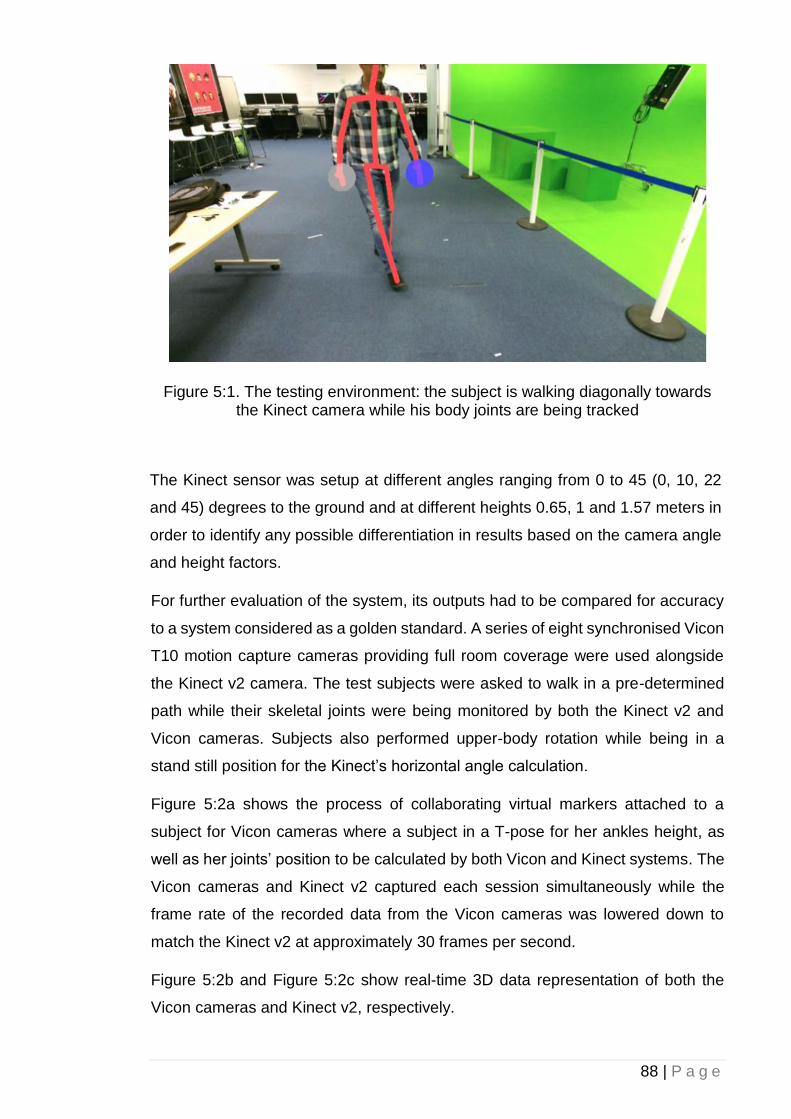
88 | P a g e
Figure 5:1. The testing environment: the subject is walking diagonally towards the Kinect camera while his body joints are being tracked
The Kinect sensor was setup at different angles ranging from 0 to 45 (0, 10, 22
and 45) degrees to the ground and at different heights 0.65, 1 and 1.57 meters in
order to identify any possible differentiation in results based on the camera angle
and height factors.
For further evaluation of the system, its outputs had to be compared for accuracy
to a system considered as a golden standard. A series of eight synchronised Vicon
T10 motion capture cameras providing full room coverage were used alongside
the Kinect v2 camera. The test subjects were asked to walk in a pre-determined
path while their skeletal joints were being monitored by both the Kinect v2 and
Vicon cameras. Subjects also performed upper-body rotation while being in a
stand still position for the Kinect’s horizontal angle calculation.
Figure 5:2a shows the process of collaborating virtual markers attached to a
subject for Vicon cameras where a subject in a T-pose for her ankles height, as
well as her joints’ position to be calculated by both Vicon and Kinect systems. The
Vicon cameras and Kinect v2 captured each session simultaneously while the
frame rate of the recorded data from the Vicon cameras was lowered down to
match the Kinect v2 at approximately 30 frames per second.
Figure 5:2b and Figure 5:2c show real-time 3D data representation of both the
Vicon cameras and Kinect v2, respectively.
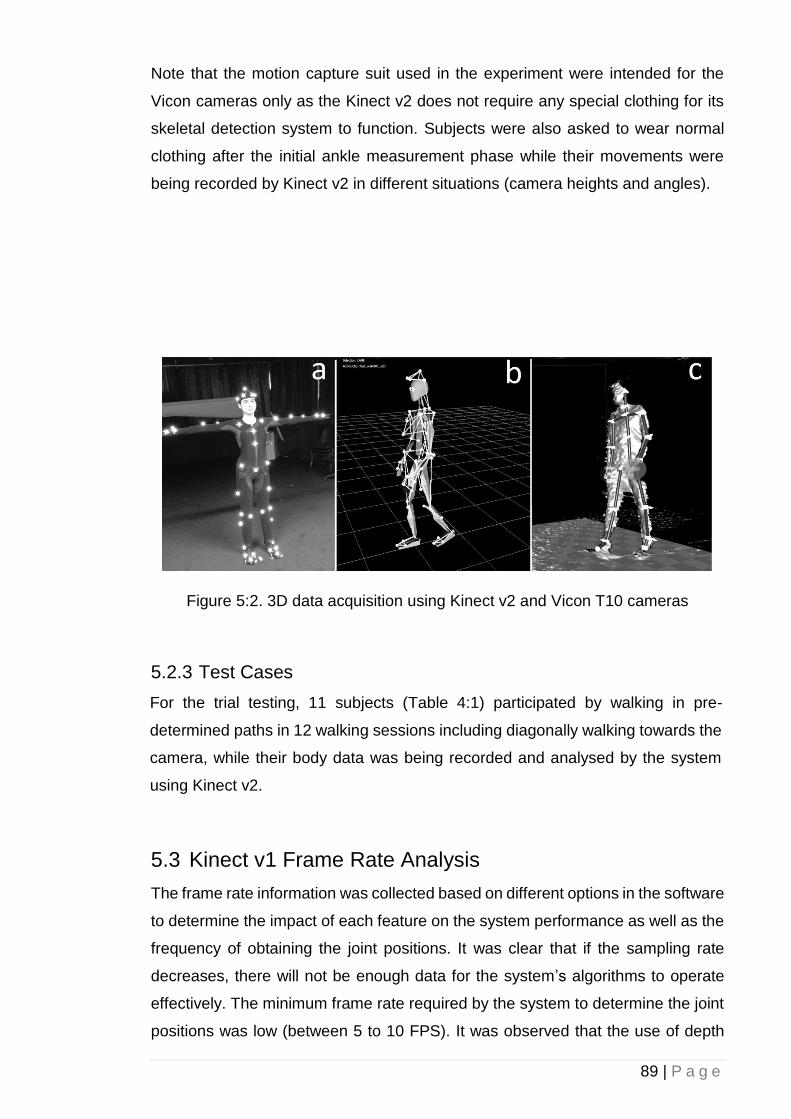
89 | P a g e
Note that the motion capture suit used in the experiment were intended for the
Vicon cameras only as the Kinect v2 does not require any special clothing for its
skeletal detection system to function. Subjects were also asked to wear normal
clothing after the initial ankle measurement phase while their movements were
being recorded by Kinect v2 in different situations (camera heights and angles).
Figure 5:2. 3D data acquisition using Kinect v2 and Vicon T10 cameras
5.2.3 Test Cases
For the trial testing, 11 subjects (Table 4:1) participated by walking in pre-
determined paths in 12 walking sessions including diagonally walking towards the
camera, while their body data was being recorded and analysed by the system
using Kinect v2.
5.3 Kinect v1 Frame Rate Analysis
The frame rate information was collected based on different options in the software
to determine the impact of each feature on the system performance as well as the
frequency of obtaining the joint positions. It was clear that if the sampling rate
decreases, there will not be enough data for the system’s algorithms to operate
effectively. The minimum frame rate required by the system to determine the joint
positions was low (between 5 to 10 FPS). It was observed that the use of depth
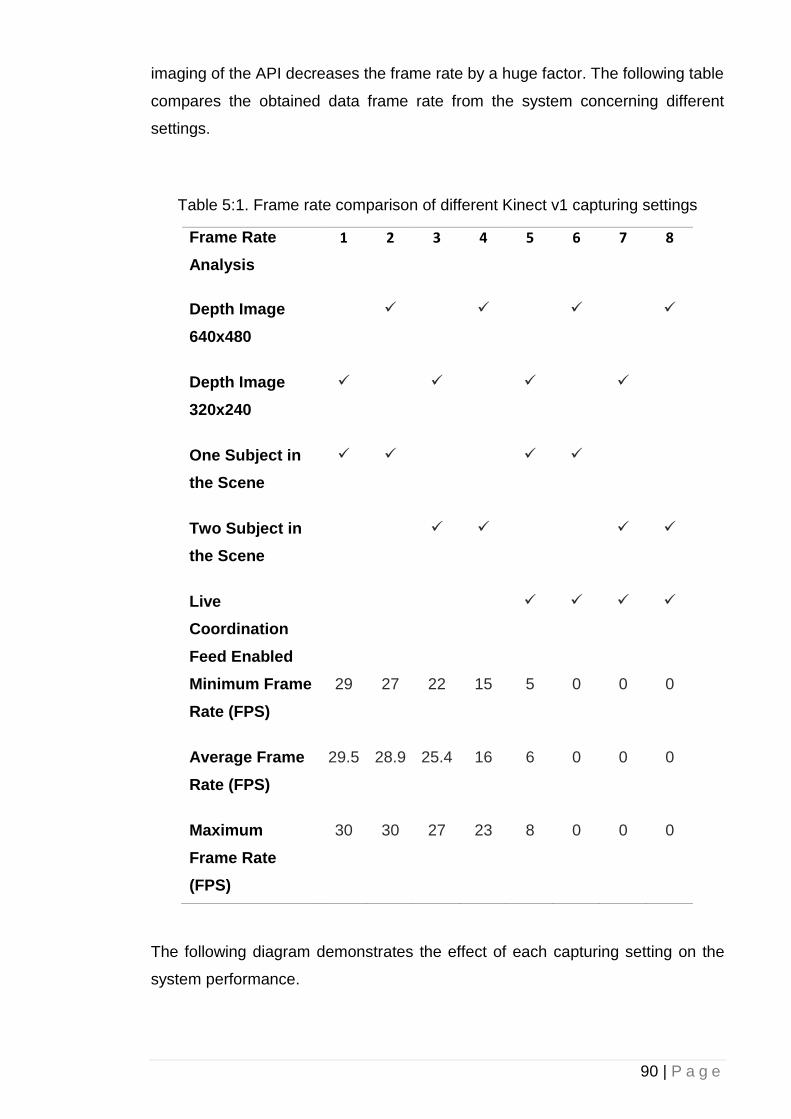
90 | P a g e
imaging of the API decreases the frame rate by a huge factor. The following table
compares the obtained data frame rate from the system concerning different
settings.
Table 5:1. Frame rate comparison of different Kinect v1 capturing settings
Frame Rate
Analysis
1 2 3 4 5 6 7 8
Depth Image
640x480
✓
✓
✓
✓
Depth Image
320x240
✓
✓
✓
✓
One Subject in
the Scene
✓ ✓
✓ ✓
Two Subject in
the Scene
✓ ✓
✓ ✓
Live
Coordination
Feed Enabled
✓ ✓ ✓ ✓
Minimum Frame
Rate (FPS)
29 27 22 15 5 0 0 0
Average Frame
Rate (FPS)
29.5 28.9 25.4 16 6 0 0 0
Maximum
Frame Rate
(FPS)
30 30 27 23 8 0 0 0
The following diagram demonstrates the effect of each capturing setting on the
system performance.
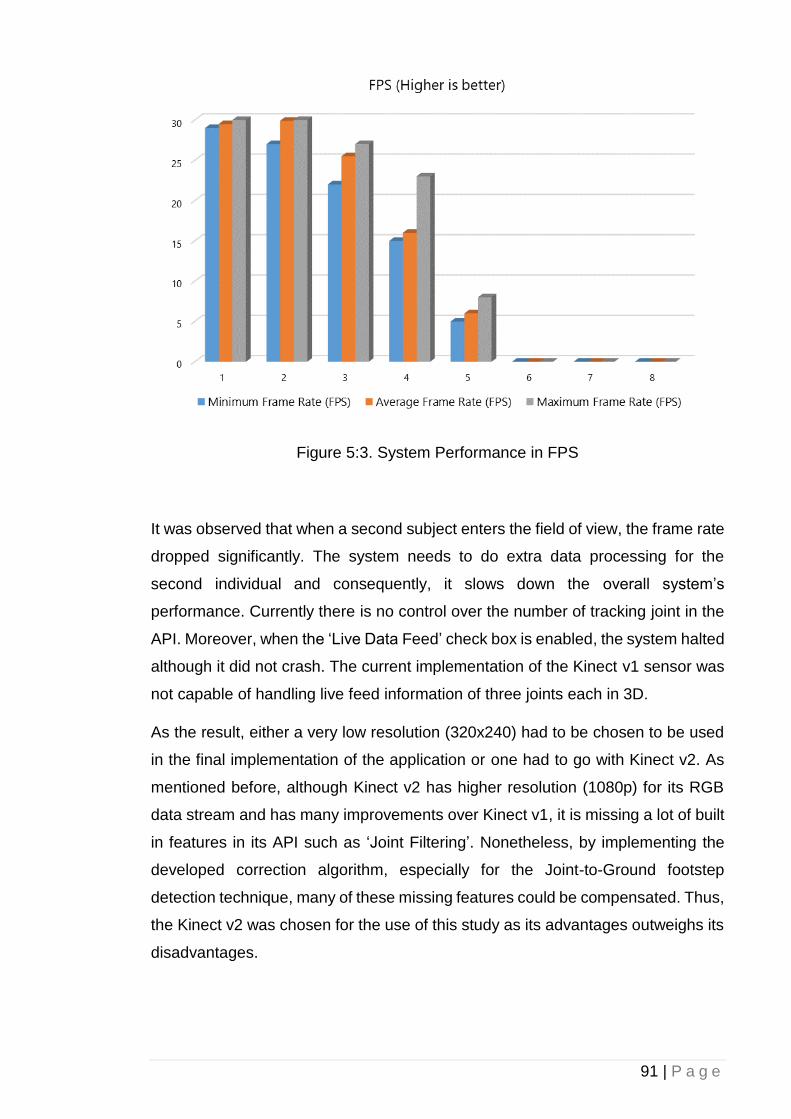
91 | P a g e
Figure 5:3. System Performance in FPS
It was observed that when a second subject enters the field of view, the frame rate
dropped significantly. The system needs to do extra data processing for the
second individual and consequently, it slows down the overall system’s
performance. Currently there is no control over the number of tracking joint in the
API. Moreover, when the ‘Live Data Feed’ check box is enabled, the system halted
although it did not crash. The current implementation of the Kinect v1 sensor was
not capable of handling live feed information of three joints each in 3D.
As the result, either a very low resolution (320x240) had to be chosen to be used
in the final implementation of the application or one had to go with Kinect v2. As
mentioned before, although Kinect v2 has higher resolution (1080p) for its RGB
data stream and has many improvements over Kinect v1, it is missing a lot of built
in features in its API such as ‘Joint Filtering’. Nonetheless, by implementing the
developed correction algorithm, especially for the Joint-to-Ground footstep
detection technique, many of these missing features could be compensated. Thus,
the Kinect v2 was chosen for the use of this study as its advantages outweighs its
disadvantages.
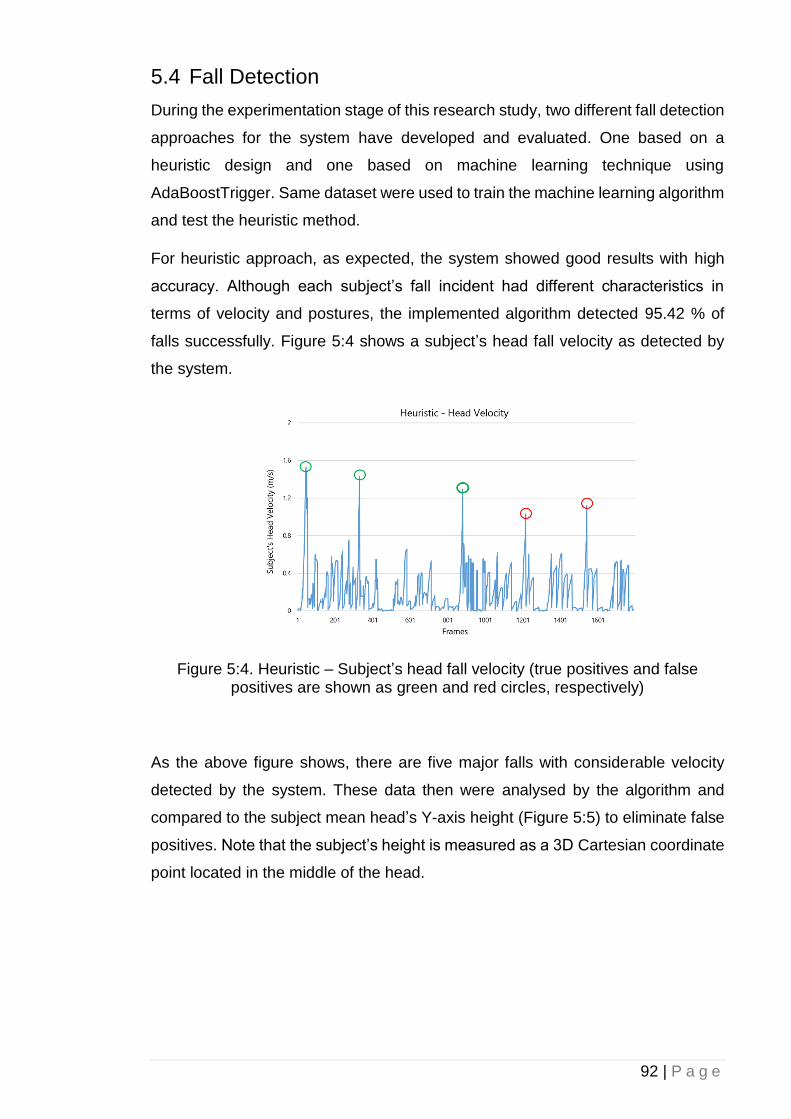
92 | P a g e
5.4 Fall Detection
During the experimentation stage of this research study, two different fall detection
approaches for the system have developed and evaluated. One based on a
heuristic design and one based on machine learning technique using
AdaBoostTrigger. Same dataset were used to train the machine learning algorithm
and test the heuristic method.
For heuristic approach, as expected, the system showed good results with high
accuracy. Although each subject’s fall incident had different characteristics in
terms of velocity and postures, the implemented algorithm detected 95.42 % of
falls successfully. Figure 5:4 shows a subject’s head fall velocity as detected by
the system.
Figure 5:4. Heuristic – Subject’s head fall velocity (true positives and false positives are shown as green and red circles, respectively)
As the above figure shows, there are five major falls with considerable velocity
detected by the system. These data then were analysed by the algorithm and
compared to the subject mean head’s Y-axis height (Figure 5:5) to eliminate false
positives. Note that the subject’s height is measured as a 3D Cartesian coordinate
point located in the middle of the head.
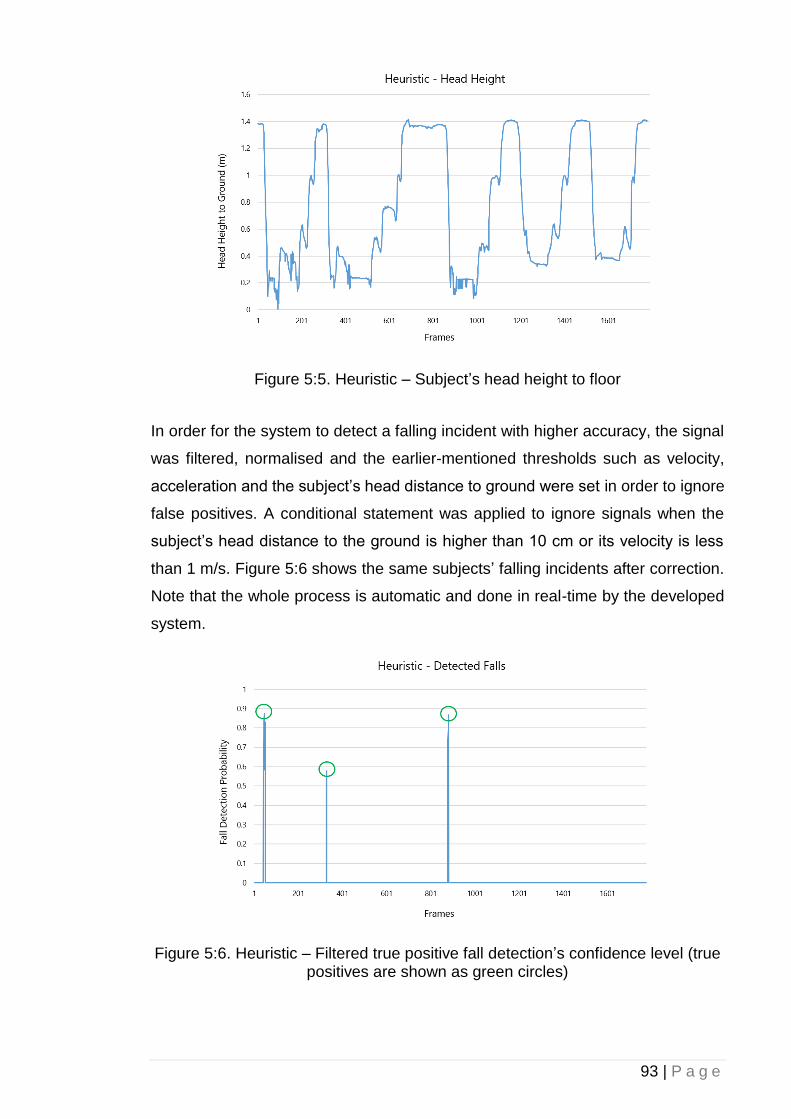
93 | P a g e
Figure 5:5. Heuristic – Subject’s head height to floor
In order for the system to detect a falling incident with higher accuracy, the signal
was filtered, normalised and the earlier-mentioned thresholds such as velocity,
acceleration and the subject’s head distance to ground were set in order to ignore
false positives. A conditional statement was applied to ignore signals when the
subject’s head distance to the ground is higher than 10 cm or its velocity is less
than 1 m/s. Figure 5:6 shows the same subjects’ falling incidents after correction.
Note that the whole process is automatic and done in real-time by the developed
system.
Figure 5:6. Heuristic – Filtered true positive fall detection’s confidence level (true positives are shown as green circles)
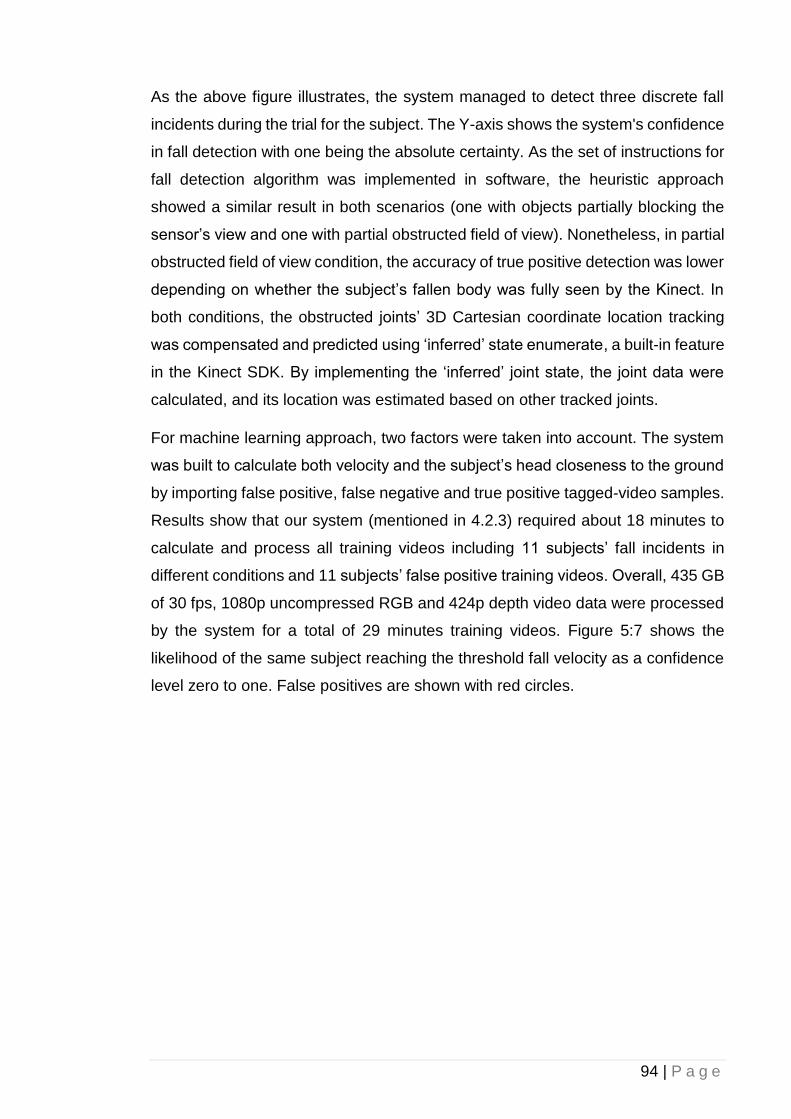
94 | P a g e
As the above figure illustrates, the system managed to detect three discrete fall
incidents during the trial for the subject. The Y-axis shows the system's confidence
in fall detection with one being the absolute certainty. As the set of instructions for
fall detection algorithm was implemented in software, the heuristic approach
showed a similar result in both scenarios (one with objects partially blocking the
sensor’s view and one with partial obstructed field of view). Nonetheless, in partial
obstructed field of view condition, the accuracy of true positive detection was lower
depending on whether the subject’s fallen body was fully seen by the Kinect. In
both conditions, the obstructed joints’ 3D Cartesian coordinate location tracking
was compensated and predicted using ‘inferred’ state enumerate, a built-in feature
in the Kinect SDK. By implementing the ‘inferred’ joint state, the joint data were
calculated, and its location was estimated based on other tracked joints.
For machine learning approach, two factors were taken into account. The system
was built to calculate both velocity and the subject’s head closeness to the ground
by importing false positive, false negative and true positive tagged-video samples.
Results show that our system (mentioned in 4.2.3) required about 18 minutes to
calculate and process all training videos including 11 subjects’ fall incidents in
different conditions and 11 subjects’ false positive training videos. Overall, 435 GB
of 30 fps, 1080p uncompressed RGB and 424p depth video data were processed
by the system for a total of 29 minutes training videos. Figure 5:7 shows the
likelihood of the same subject reaching the threshold fall velocity as a confidence
level zero to one. False positives are shown with red circles.
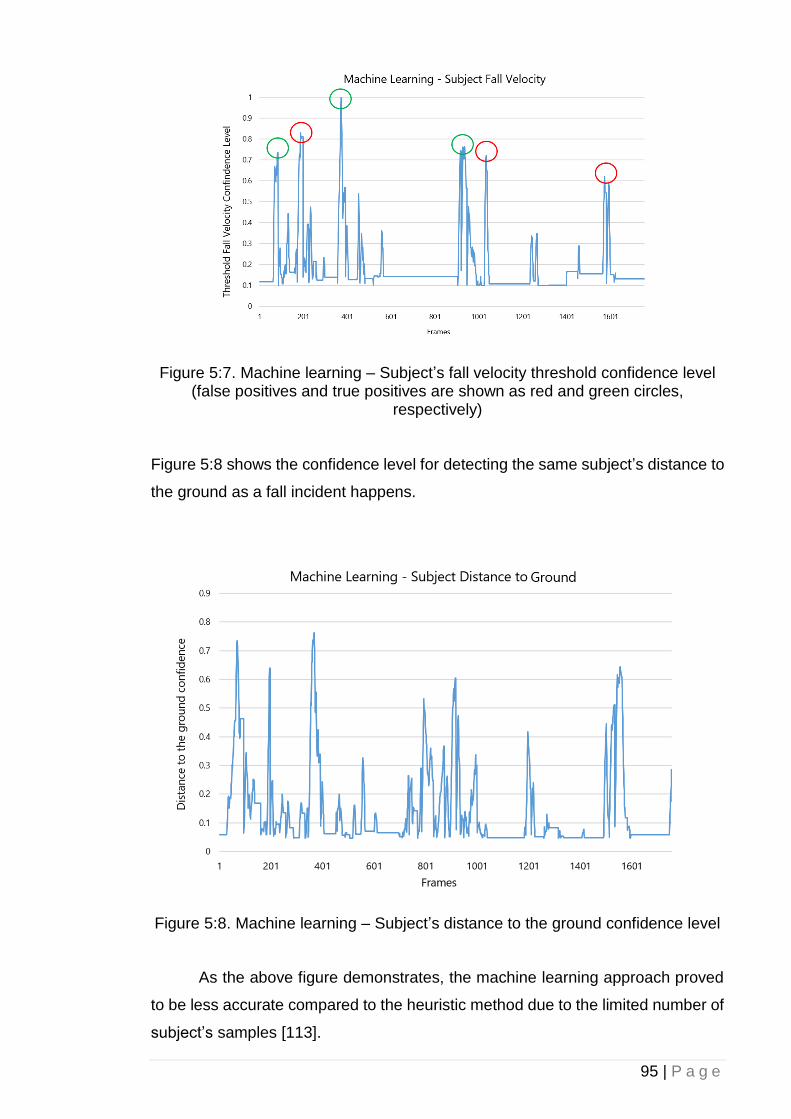
95 | P a g e
Figure 5:7. Machine learning – Subject’s fall velocity threshold confidence level (false positives and true positives are shown as red and green circles,
respectively)
Figure 5:8 shows the confidence level for detecting the same subject’s distance to
the ground as a fall incident happens.
Figure 5:8. Machine learning – Subject’s distance to the ground confidence level
As the above figure demonstrates, the machine learning approach proved
to be less accurate compared to the heuristic method due to the limited number of
subject’s samples [113].
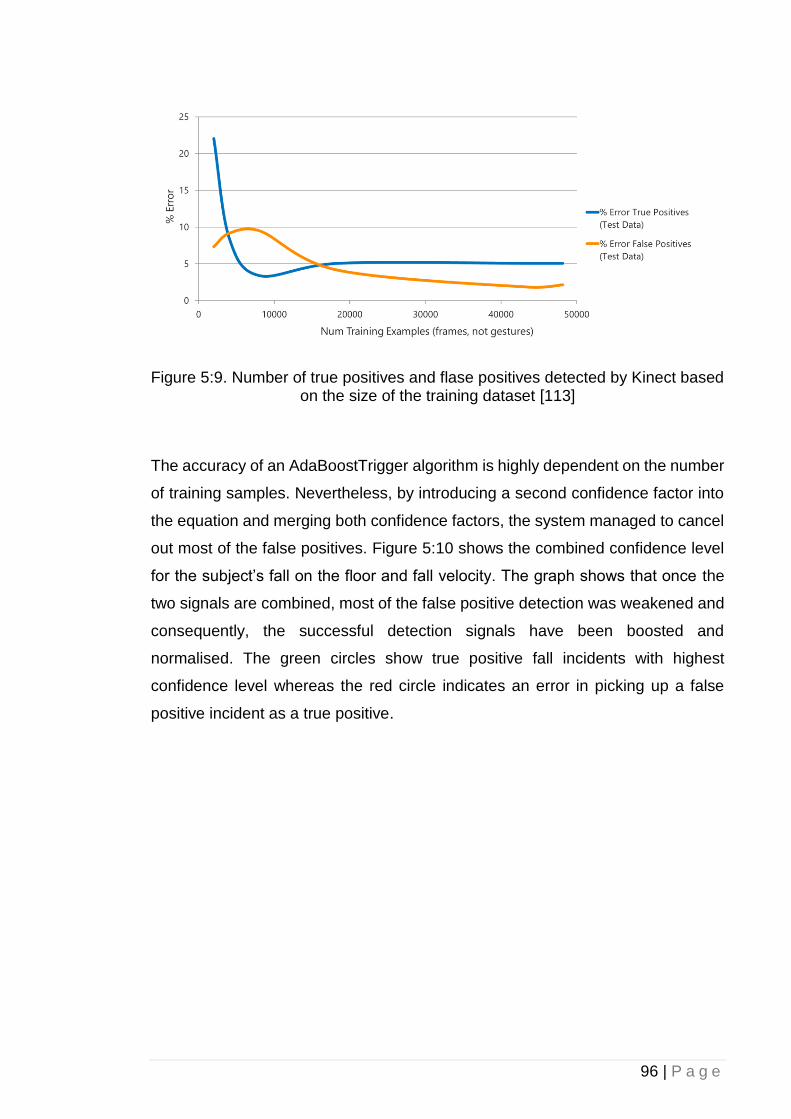
96 | P a g e
Figure 5:9. Number of true positives and flase positives detected by Kinect based on the size of the training dataset [113]
The accuracy of an AdaBoostTrigger algorithm is highly dependent on the number
of training samples. Nevertheless, by introducing a second confidence factor into
the equation and merging both confidence factors, the system managed to cancel
out most of the false positives. Figure 5:10 shows the combined confidence level
for the subject’s fall on the floor and fall velocity. The graph shows that once the
two signals are combined, most of the false positive detection was weakened and
consequently, the successful detection signals have been boosted and
normalised. The green circles show true positive fall incidents with highest
confidence level whereas the red circle indicates an error in picking up a false
positive incident as a true positive.
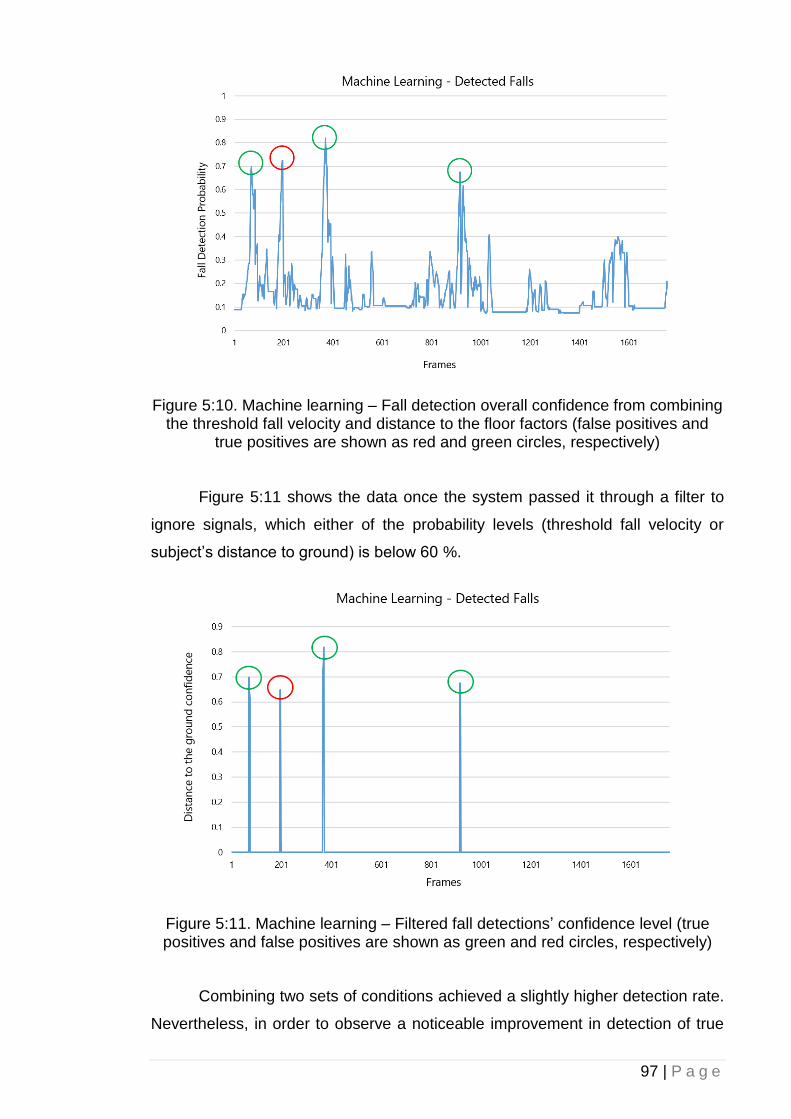
97 | P a g e
Figure 5:10. Machine learning – Fall detection overall confidence from combining the threshold fall velocity and distance to the floor factors (false positives and
true positives are shown as red and green circles, respectively)
Figure 5:11 shows the data once the system passed it through a filter to
ignore signals, which either of the probability levels (threshold fall velocity or
subject’s distance to ground) is below 60 %.
Figure 5:11. Machine learning – Filtered fall detections’ confidence level (true positives and false positives are shown as green and red circles, respectively)
Combining two sets of conditions achieved a slightly higher detection rate.
Nevertheless, in order to observe a noticeable improvement in detection of true
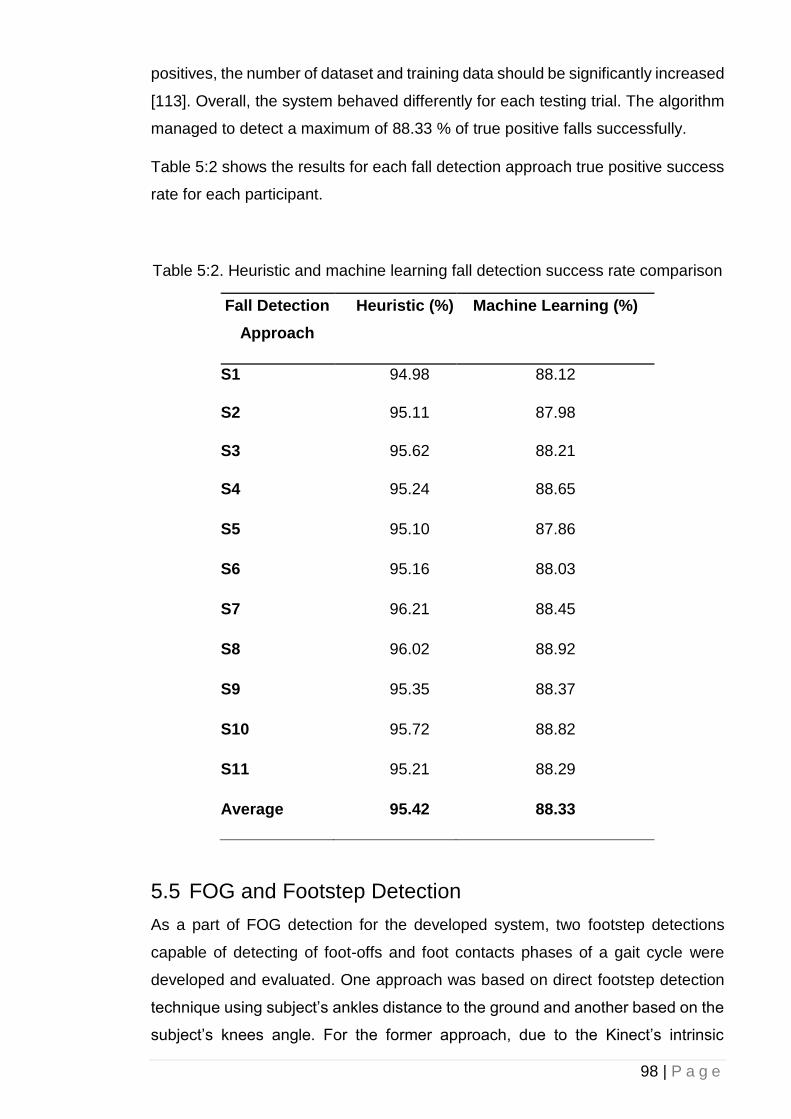
98 | P a g e
positives, the number of dataset and training data should be significantly increased
[113]. Overall, the system behaved differently for each testing trial. The algorithm
managed to detect a maximum of 88.33 % of true positive falls successfully.
Table 5:2 shows the results for each fall detection approach true positive success
rate for each participant.
Table 5:2. Heuristic and machine learning fall detection success rate comparison
Fall Detection
Approach
Heuristic (%) Machine Learning (%)
S1 94.98 88.12
S2 95.11 87.98
S3 95.62 88.21
S4 95.24 88.65
S5 95.10 87.86
S6 95.16 88.03
S7 96.21 88.45
S8 96.02 88.92
S9 95.35 88.37
S10 95.72 88.82
S11 95.21 88.29
Average 95.42 88.33
5.5 FOG and Footstep Detection
As a part of FOG detection for the developed system, two footstep detections
capable of detecting of foot-offs and foot contacts phases of a gait cycle were
developed and evaluated. One approach was based on direct footstep detection
technique using subject’s ankles distance to the ground and another based on the
subject’s knees angle. For the former approach, due to the Kinect’s intrinsic
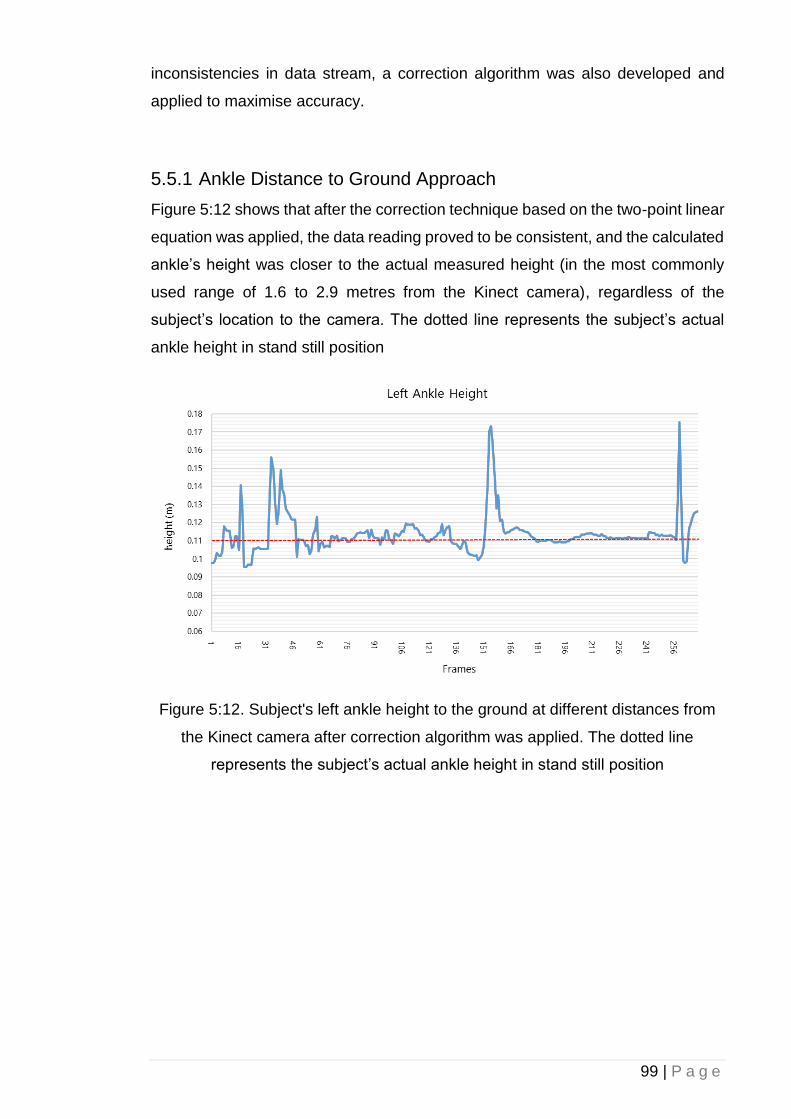
99 | P a g e
inconsistencies in data stream, a correction algorithm was also developed and
applied to maximise accuracy.
5.5.1 Ankle Distance to Ground Approach
Figure 5:12 shows that after the correction technique based on the two-point linear
equation was applied, the data reading proved to be consistent, and the calculated
ankle’s height was closer to the actual measured height (in the most commonly
used range of 1.6 to 2.9 metres from the Kinect camera), regardless of the
subject’s location to the camera. The dotted line represents the subject’s actual
ankle height in stand still position
Figure 5:12. Subject's left ankle height to the ground at different distances from
the Kinect camera after correction algorithm was applied. The dotted line
represents the subject’s actual ankle height in stand still position
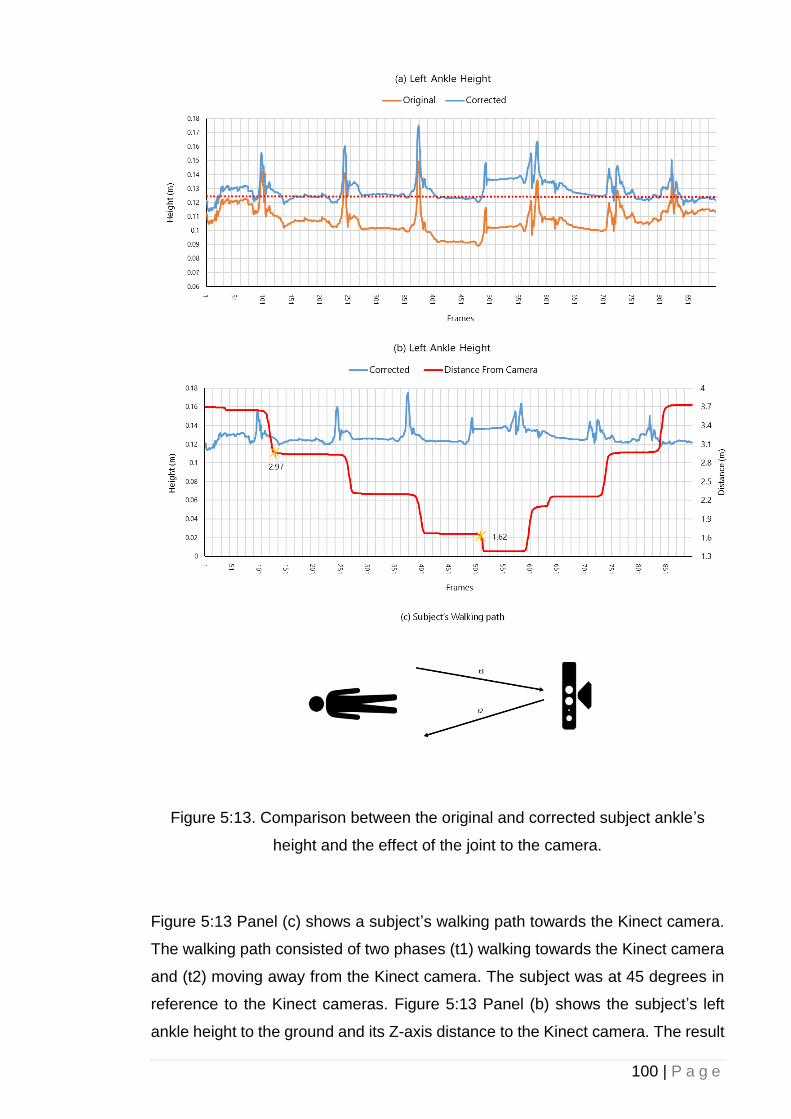
100 | P a g e
Figure 5:13. Comparison between the original and corrected subject ankle’s
height and the effect of the joint to the camera.
Figure 5:13 Panel (c) shows a subject’s walking path towards the Kinect camera.
The walking path consisted of two phases (t1) walking towards the Kinect camera
and (t2) moving away from the Kinect camera. The subject was at 45 degrees in
reference to the Kinect cameras. Figure 5:13 Panel (b) shows the subject’s left
ankle height to the ground and its Z-axis distance to the Kinect camera. The result
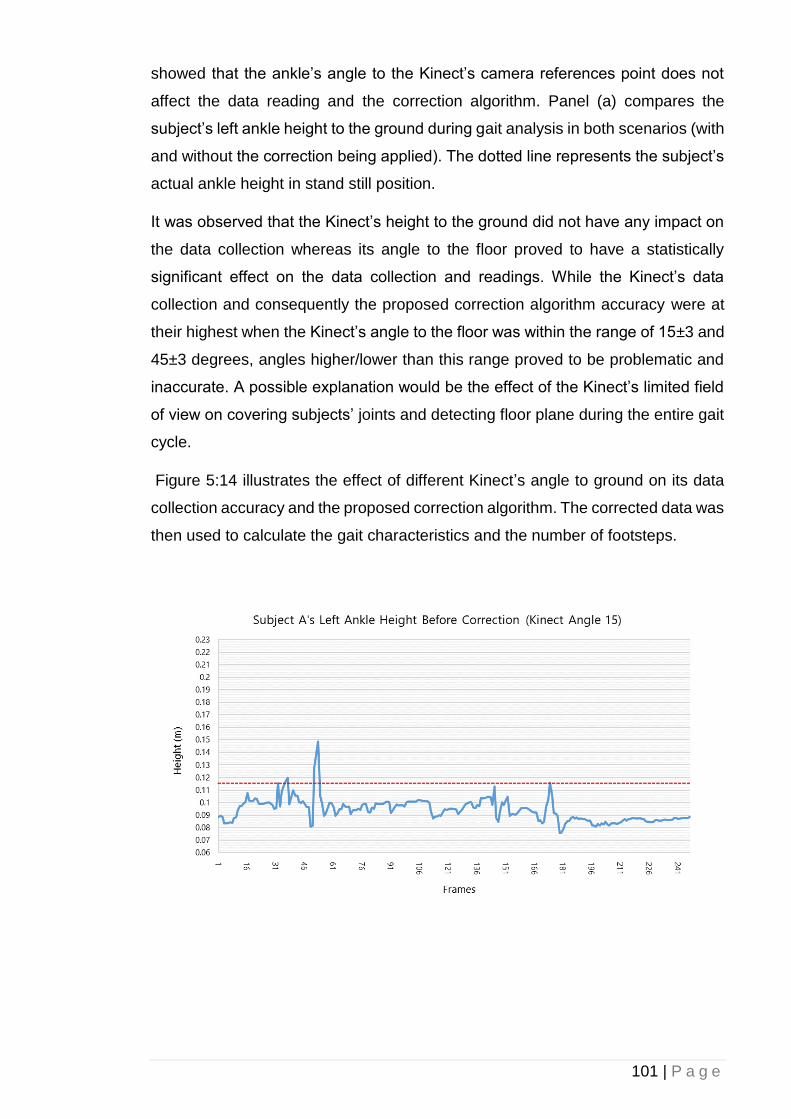
101 | P a g e
showed that the ankle’s angle to the Kinect’s camera references point does not
affect the data reading and the correction algorithm. Panel (a) compares the
subject’s left ankle height to the ground during gait analysis in both scenarios (with
and without the correction being applied). The dotted line represents the subject’s
actual ankle height in stand still position.
It was observed that the Kinect’s height to the ground did not have any impact on
the data collection whereas its angle to the floor proved to have a statistically
significant effect on the data collection and readings. While the Kinect’s data
collection and consequently the proposed correction algorithm accuracy were at
their highest when the Kinect’s angle to the floor was within the range of 15±3 and
45±3 degrees, angles higher/lower than this range proved to be problematic and
inaccurate. A possible explanation would be the effect of the Kinect’s limited field
of view on covering subjects’ joints and detecting floor plane during the entire gait
cycle.
Figure 5:14 illustrates the effect of different Kinect’s angle to ground on its data
collection accuracy and the proposed correction algorithm. The corrected data was
then used to calculate the gait characteristics and the number of footsteps.
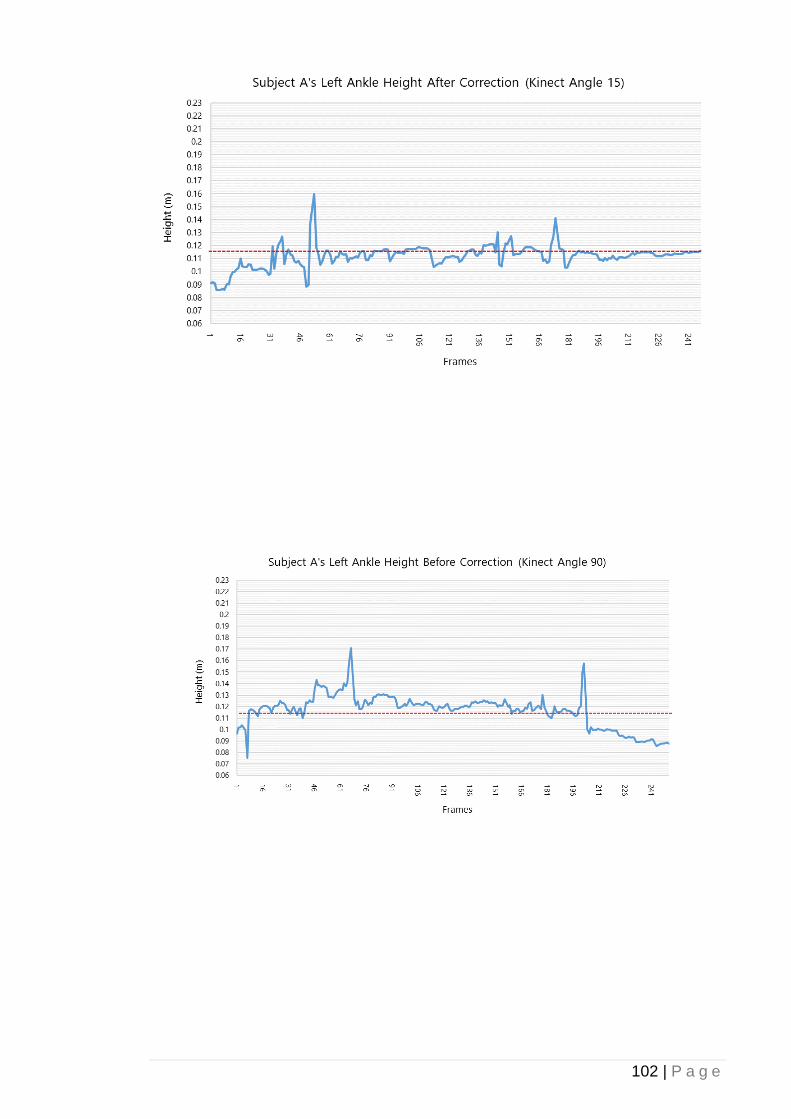
102 | P a g e
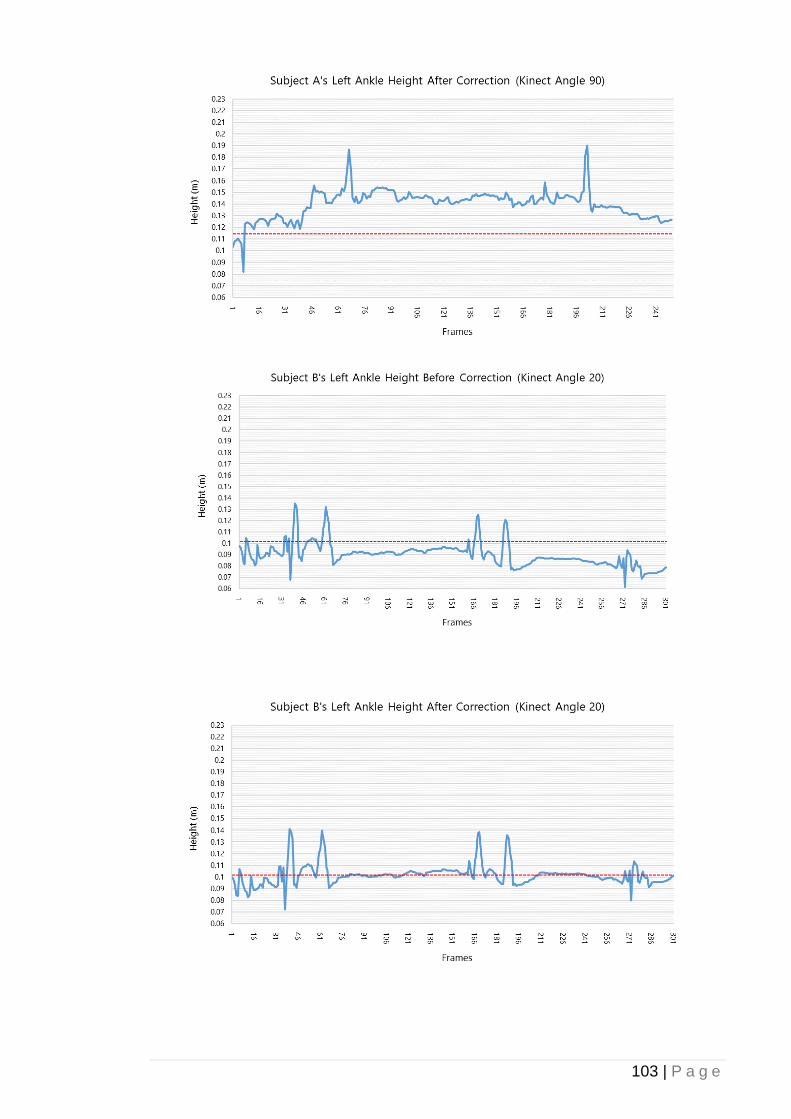
103 | P a g e
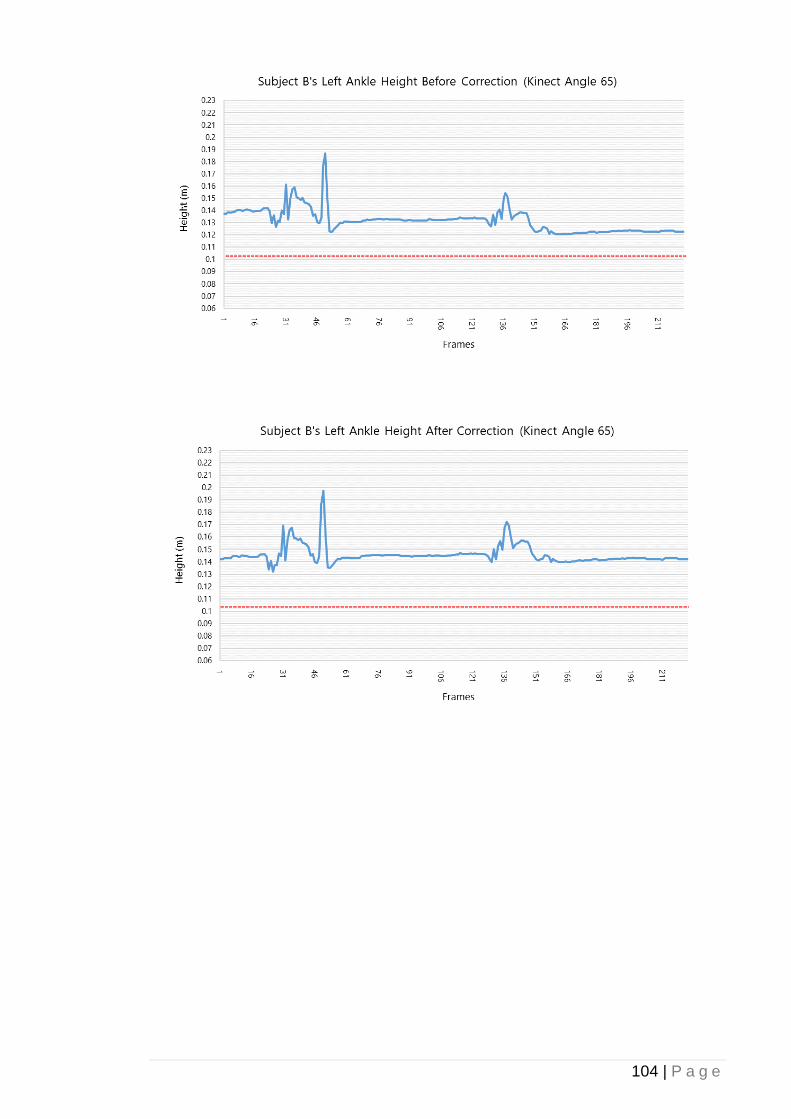
104 | P a g e
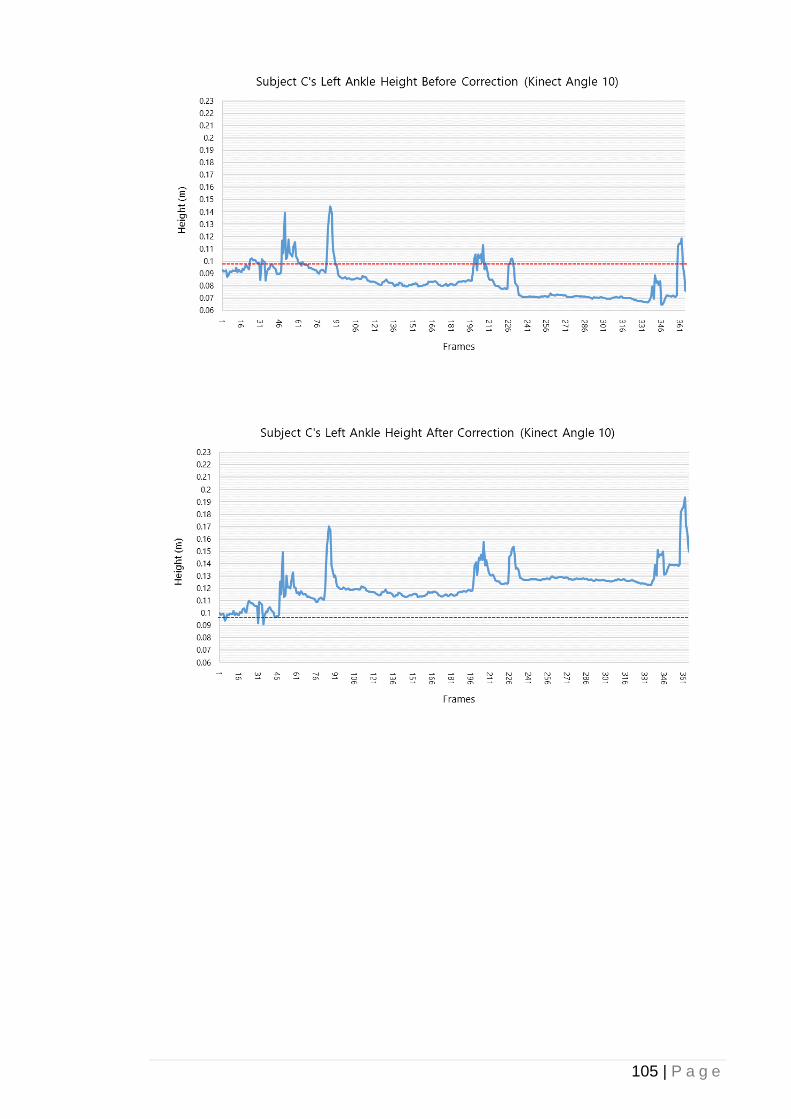
105 | P a g e
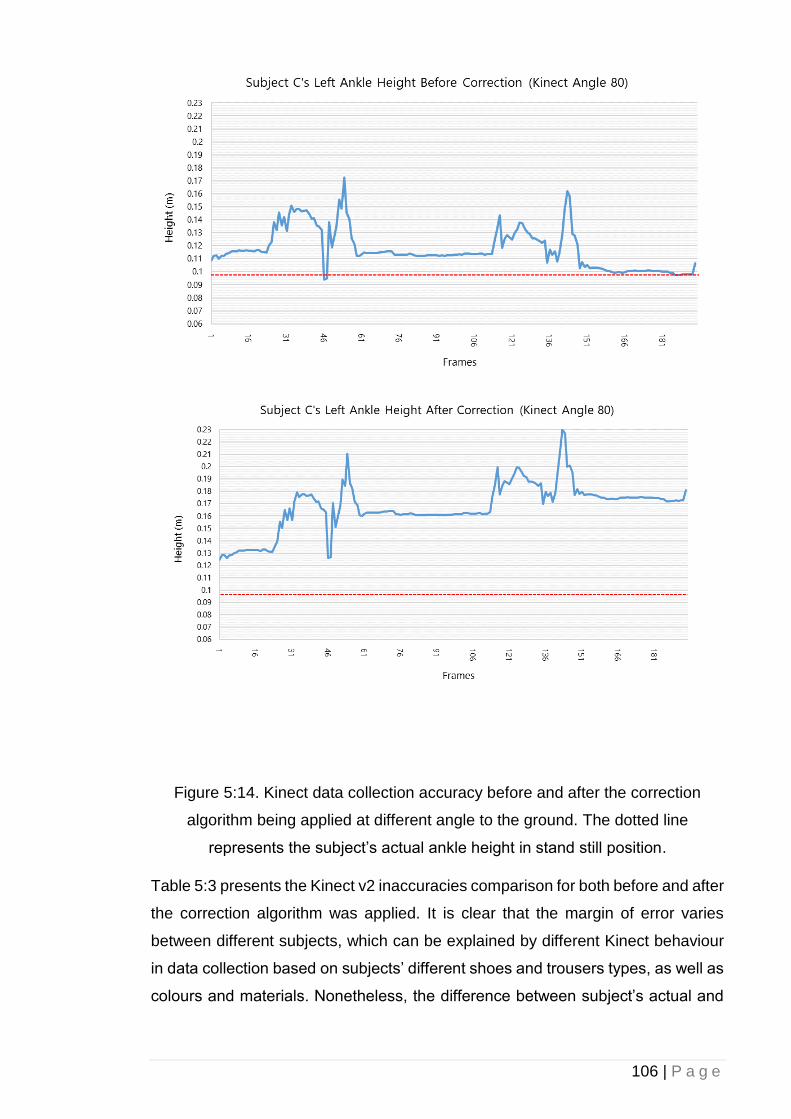
106 | P a g e
Figure 5:14. Kinect data collection accuracy before and after the correction
algorithm being applied at different angle to the ground. The dotted line
represents the subject’s actual ankle height in stand still position.
Table 5:3 presents the Kinect v2 inaccuracies comparison for both before and after
the correction algorithm was applied. It is clear that the margin of error varies
between different subjects, which can be explained by different Kinect behaviour
in data collection based on subjects’ different shoes and trousers types, as well as
colours and materials. Nonetheless, the difference between subject’s actual and
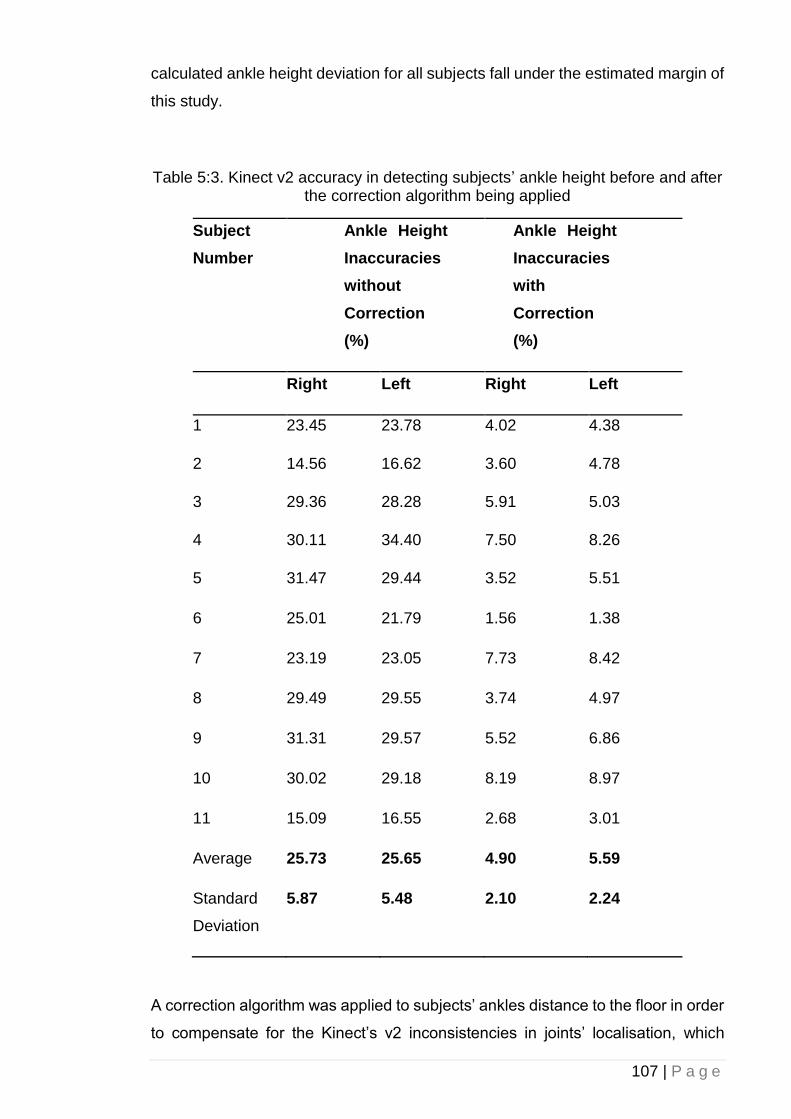
107 | P a g e
calculated ankle height deviation for all subjects fall under the estimated margin of
this study.
Table 5:3. Kinect v2 accuracy in detecting subjects’ ankle height before and after the correction algorithm being applied
Subject
Number
Ankle Height
Inaccuracies
without
Correction
(%)
Ankle Height
Inaccuracies
with
Correction
(%)
Right Left Right Left
1 23.45 23.78 4.02 4.38
2 14.56 16.62 3.60 4.78
3 29.36 28.28 5.91 5.03
4 30.11 34.40 7.50 8.26
5 31.47 29.44 3.52 5.51
6 25.01 21.79 1.56 1.38
7 23.19 23.05 7.73 8.42
8 29.49 29.55 3.74 4.97
9 31.31 29.57 5.52 6.86
10 30.02 29.18 8.19 8.97
11 15.09 16.55 2.68 3.01
Average 25.73 25.65 4.90 5.59
Standard
Deviation
5.87 5.48 2.10 2.24
A correction algorithm was applied to subjects’ ankles distance to the floor in order
to compensate for the Kinect’s v2 inconsistencies in joints’ localisation, which
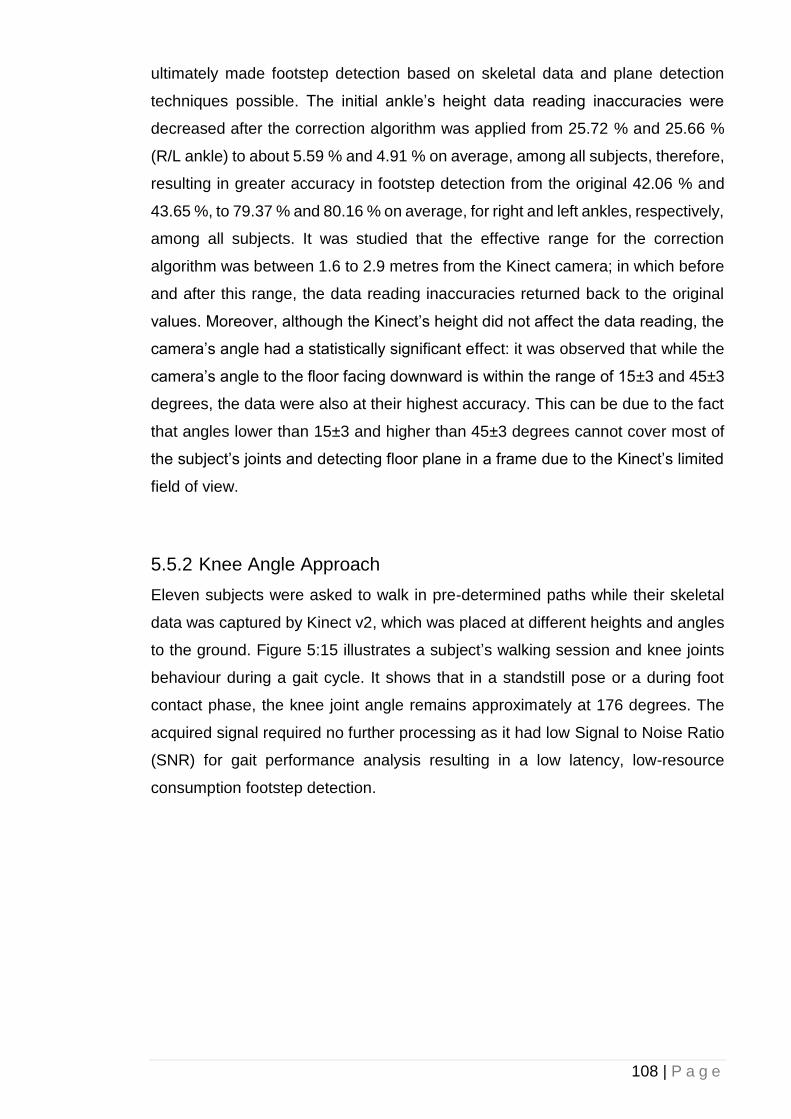
108 | P a g e
ultimately made footstep detection based on skeletal data and plane detection
techniques possible. The initial ankle’s height data reading inaccuracies were
decreased after the correction algorithm was applied from 25.72 % and 25.66 %
(R/L ankle) to about 5.59 % and 4.91 % on average, among all subjects, therefore,
resulting in greater accuracy in footstep detection from the original 42.06 % and
43.65 %, to 79.37 % and 80.16 % on average, for right and left ankles, respectively,
among all subjects. It was studied that the effective range for the correction
algorithm was between 1.6 to 2.9 metres from the Kinect camera; in which before
and after this range, the data reading inaccuracies returned back to the original
values. Moreover, although the Kinect’s height did not affect the data reading, the
camera’s angle had a statistically significant effect: it was observed that while the
camera’s angle to the floor facing downward is within the range of 15±3 and 45±3
degrees, the data were also at their highest accuracy. This can be due to the fact
that angles lower than 15±3 and higher than 45±3 degrees cannot cover most of
the subject’s joints and detecting floor plane in a frame due to the Kinect’s limited
field of view.
5.5.2 Knee Angle Approach
Eleven subjects were asked to walk in pre-determined paths while their skeletal
data was captured by Kinect v2, which was placed at different heights and angles
to the ground. Figure 5:15 illustrates a subject’s walking session and knee joints
behaviour during a gait cycle. It shows that in a standstill pose or a during foot
contact phase, the knee joint angle remains approximately at 176 degrees. The
acquired signal required no further processing as it had low Signal to Noise Ratio
(SNR) for gait performance analysis resulting in a low latency, low-resource
consumption footstep detection.
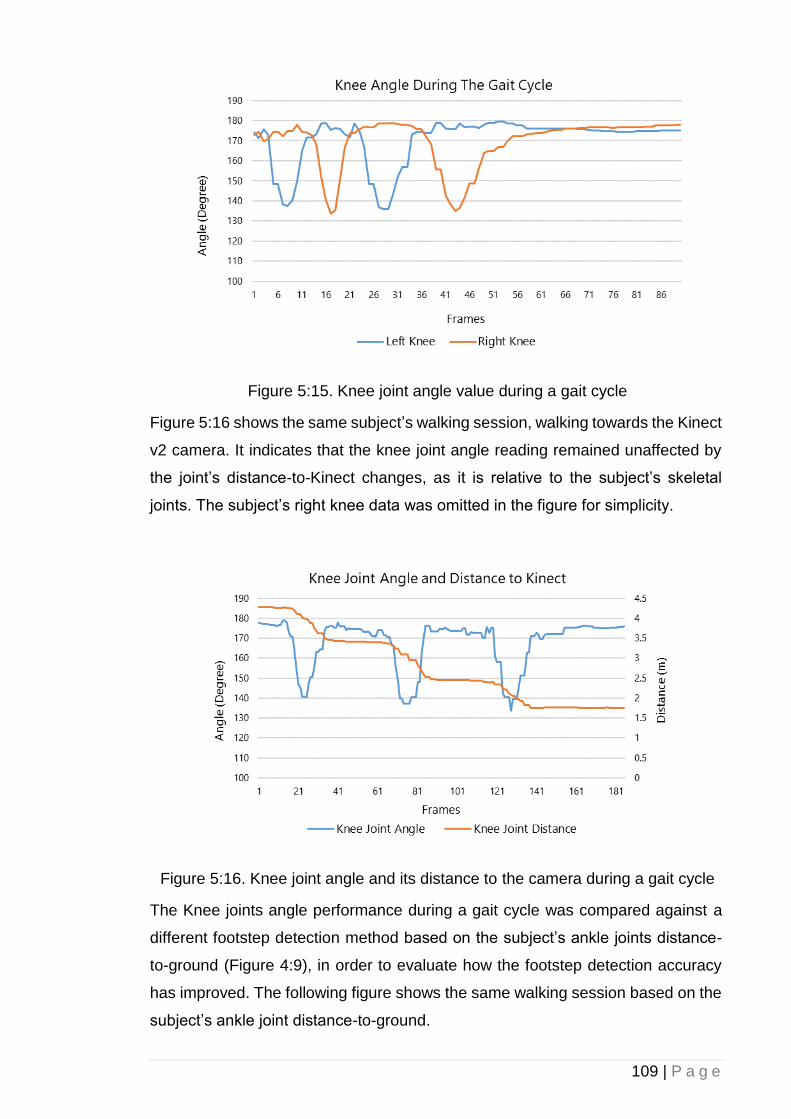
109 | P a g e
Figure 5:15. Knee joint angle value during a gait cycle
Figure 5:16 shows the same subject’s walking session, walking towards the Kinect
v2 camera. It indicates that the knee joint angle reading remained unaffected by
the joint’s distance-to-Kinect changes, as it is relative to the subject’s skeletal
joints. The subject’s right knee data was omitted in the figure for simplicity.
Figure 5:16. Knee joint angle and its distance to the camera during a gait cycle
The Knee joints angle performance during a gait cycle was compared against a
different footstep detection method based on the subject’s ankle joints distance-
to-ground (Figure 4:9), in order to evaluate how the footstep detection accuracy
has improved. The following figure shows the same walking session based on the
subject’s ankle joint distance-to-ground.
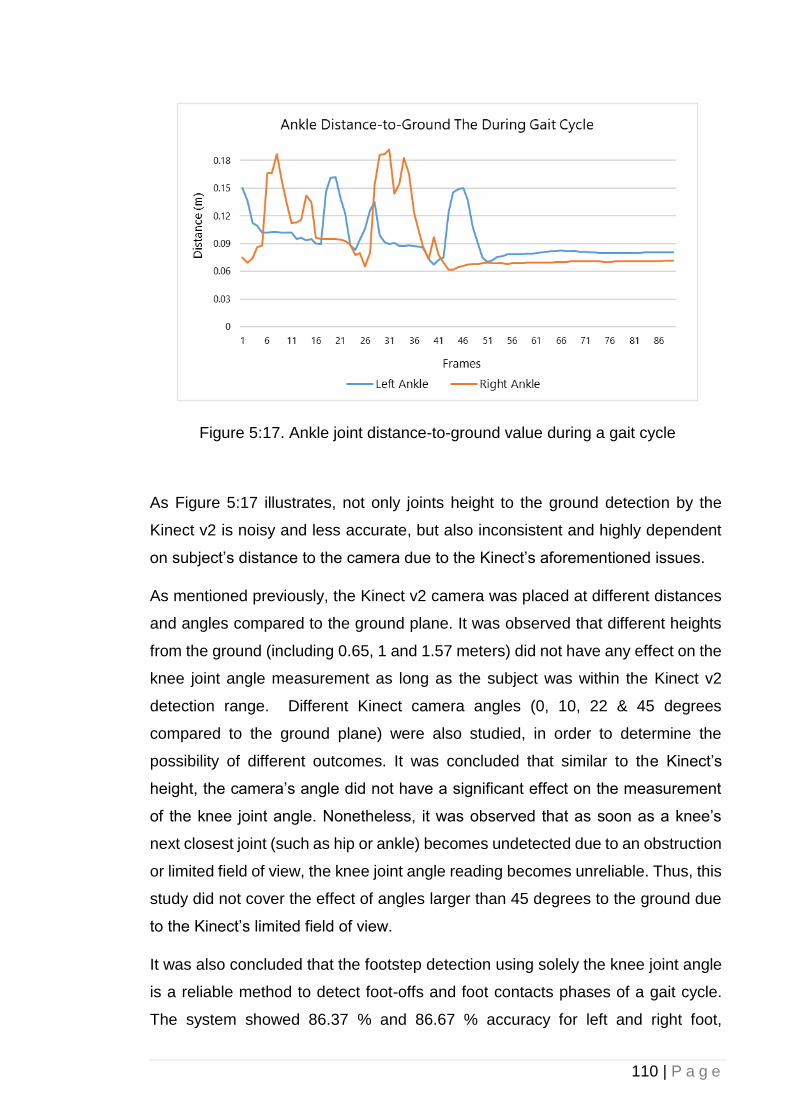
110 | P a g e
Figure 5:17. Ankle joint distance-to-ground value during a gait cycle
As Figure 5:17 illustrates, not only joints height to the ground detection by the
Kinect v2 is noisy and less accurate, but also inconsistent and highly dependent
on subject’s distance to the camera due to the Kinect’s aforementioned issues.
As mentioned previously, the Kinect v2 camera was placed at different distances
and angles compared to the ground plane. It was observed that different heights
from the ground (including 0.65, 1 and 1.57 meters) did not have any effect on the
knee joint angle measurement as long as the subject was within the Kinect v2
detection range. Different Kinect camera angles (0, 10, 22 & 45 degrees
compared to the ground plane) were also studied, in order to determine the
possibility of different outcomes. It was concluded that similar to the Kinect’s
height, the camera’s angle did not have a significant effect on the measurement
of the knee joint angle. Nonetheless, it was observed that as soon as a knee’s
next closest joint (such as hip or ankle) becomes undetected due to an obstruction
or limited field of view, the knee joint angle reading becomes unreliable. Thus, this
study did not cover the effect of angles larger than 45 degrees to the ground due
to the Kinect’s limited field of view.
It was also concluded that the footstep detection using solely the knee joint angle
is a reliable method to detect foot-offs and foot contacts phases of a gait cycle.
The system showed 86.37 % and 86.67 % accuracy for left and right foot,
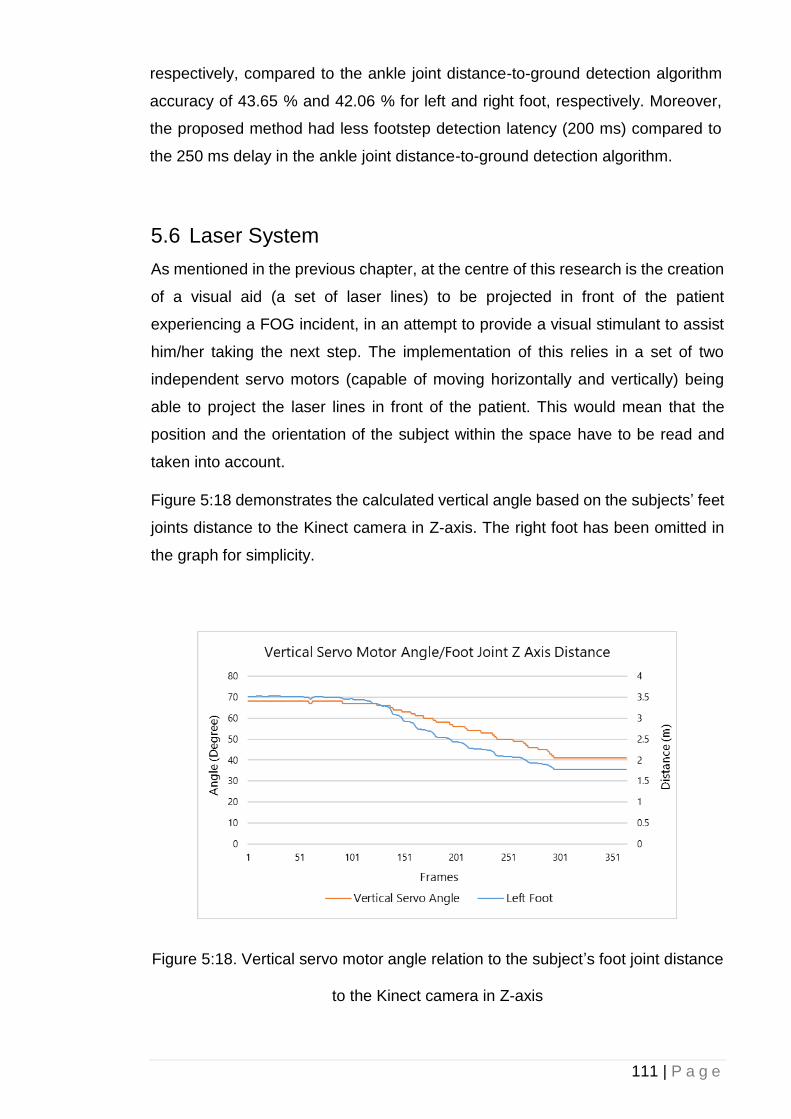
111 | P a g e
respectively, compared to the ankle joint distance-to-ground detection algorithm
accuracy of 43.65 % and 42.06 % for left and right foot, respectively. Moreover,
the proposed method had less footstep detection latency (200 ms) compared to
the 250 ms delay in the ankle joint distance-to-ground detection algorithm.
5.6 Laser System
As mentioned in the previous chapter, at the centre of this research is the creation
of a visual aid (a set of laser lines) to be projected in front of the patient
experiencing a FOG incident, in an attempt to provide a visual stimulant to assist
him/her taking the next step. The implementation of this relies in a set of two
independent servo motors (capable of moving horizontally and vertically) being
able to project the laser lines in front of the patient. This would mean that the
position and the orientation of the subject within the space have to be read and
taken into account.
Figure 5:18 demonstrates the calculated vertical angle based on the subjects’ feet
joints distance to the Kinect camera in Z-axis. The right foot has been omitted in
the graph for simplicity.
Figure 5:18. Vertical servo motor angle relation to the subject’s foot joint distance
to the Kinect camera in Z-axis
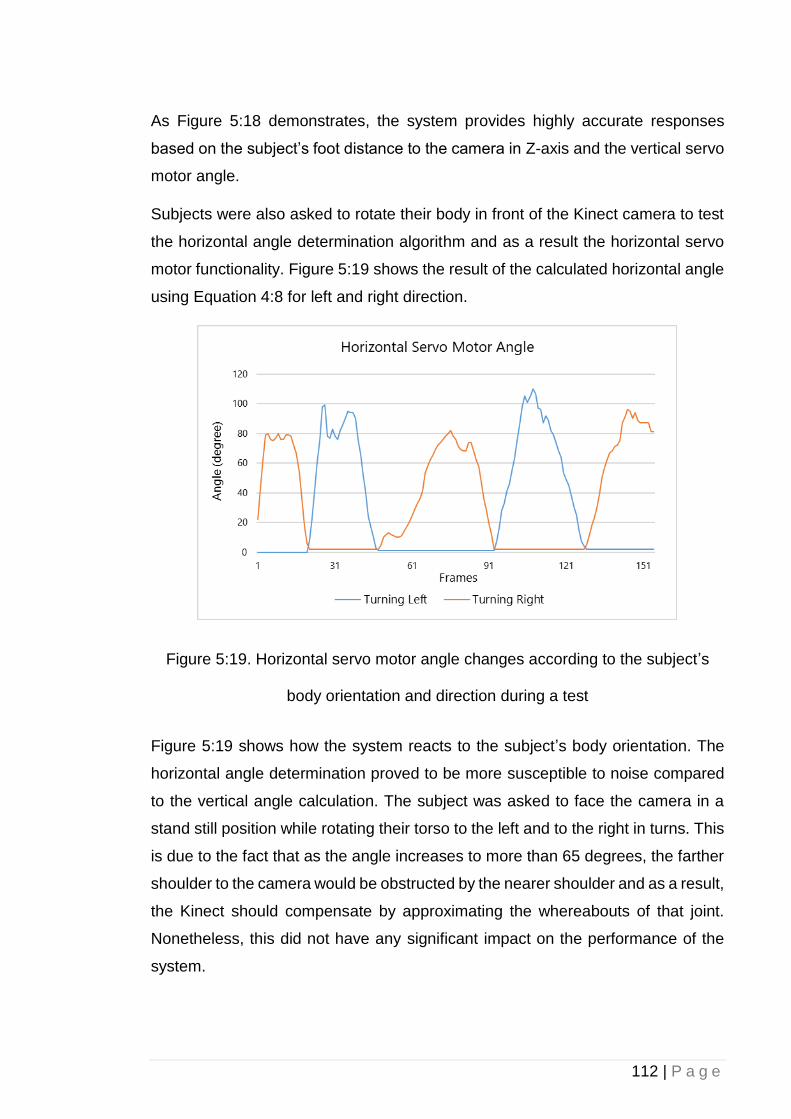
112 | P a g e
As Figure 5:18 demonstrates, the system provides highly accurate responses
based on the subject’s foot distance to the camera in Z-axis and the vertical servo
motor angle.
Subjects were also asked to rotate their body in front of the Kinect camera to test
the horizontal angle determination algorithm and as a result the horizontal servo
motor functionality. Figure 5:19 shows the result of the calculated horizontal angle
using Equation 4:8 for left and right direction.
Figure 5:19. Horizontal servo motor angle changes according to the subject’s
body orientation and direction during a test
Figure 5:19 shows how the system reacts to the subject’s body orientation. The
horizontal angle determination proved to be more susceptible to noise compared
to the vertical angle calculation. The subject was asked to face the camera in a
stand still position while rotating their torso to the left and to the right in turns. This
is due to the fact that as the angle increases to more than 65 degrees, the farther
shoulder to the camera would be obstructed by the nearer shoulder and as a result,
the Kinect should compensate by approximating the whereabouts of that joint.
Nonetheless, this did not have any significant impact on the performance of the
system.
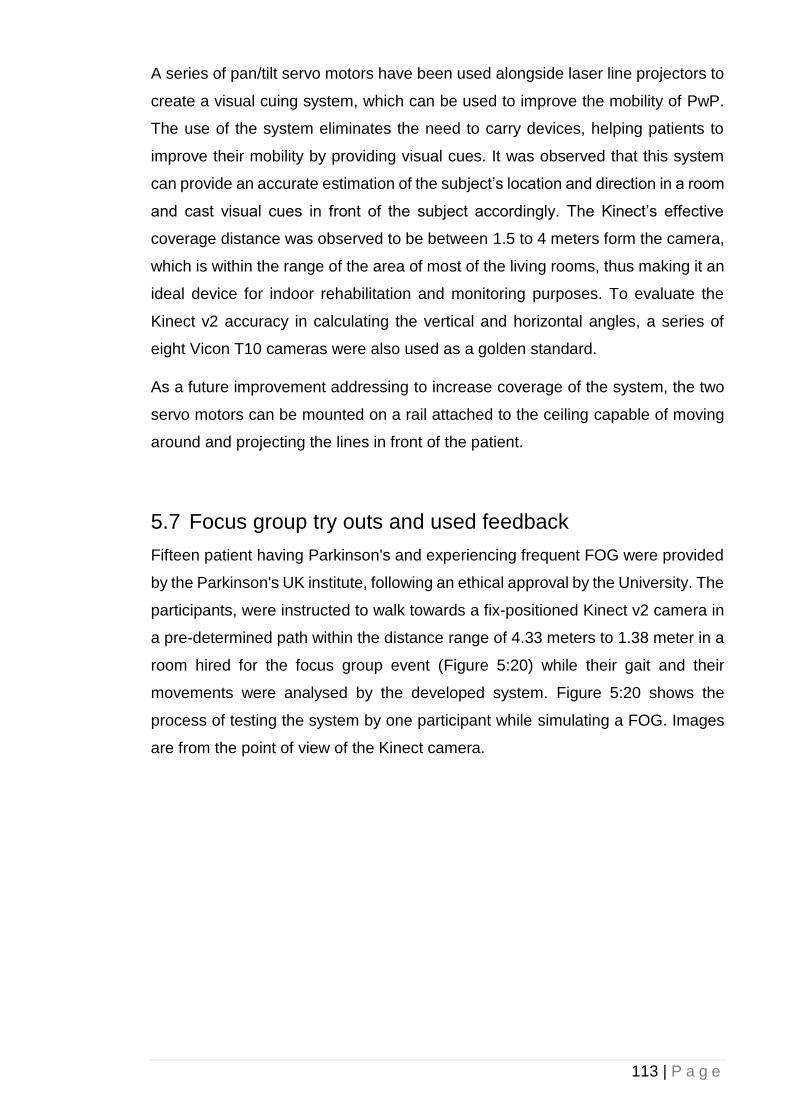
113 | P a g e
A series of pan/tilt servo motors have been used alongside laser line projectors to
create a visual cuing system, which can be used to improve the mobility of PwP.
The use of the system eliminates the need to carry devices, helping patients to
improve their mobility by providing visual cues. It was observed that this system
can provide an accurate estimation of the subject’s location and direction in a room
and cast visual cues in front of the subject accordingly. The Kinect’s effective
coverage distance was observed to be between 1.5 to 4 meters form the camera,
which is within the range of the area of most of the living rooms, thus making it an
ideal device for indoor rehabilitation and monitoring purposes. To evaluate the
Kinect v2 accuracy in calculating the vertical and horizontal angles, a series of
eight Vicon T10 cameras were also used as a golden standard.
As a future improvement addressing to increase coverage of the system, the two
servo motors can be mounted on a rail attached to the ceiling capable of moving
around and projecting the lines in front of the patient.
5.7 Focus group try outs and used feedback
Fifteen patient having Parkinson's and experiencing frequent FOG were provided
by the Parkinson's UK institute, following an ethical approval by the University. The
participants, were instructed to walk towards a fix-positioned Kinect v2 camera in
a pre-determined path within the distance range of 4.33 meters to 1.38 meter in a
room hired for the focus group event (Figure 5:20) while their gait and their
movements were analysed by the developed system. Figure 5:20 shows the
process of testing the system by one participant while simulating a FOG. Images
are from the point of view of the Kinect camera.
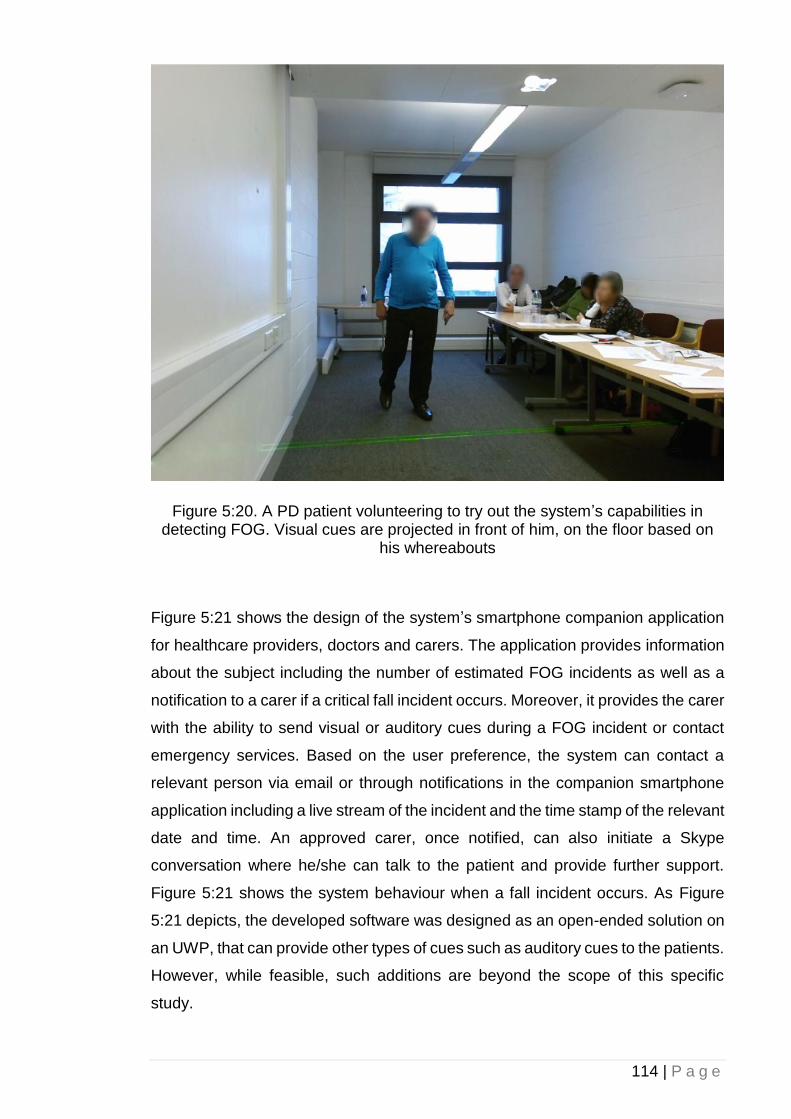
114 | P a g e
Figure 5:20. A PD patient volunteering to try out the system’s capabilities in detecting FOG. Visual cues are projected in front of him, on the floor based on
his whereabouts
Figure 5:21 shows the design of the system’s smartphone companion application
for healthcare providers, doctors and carers. The application provides information
about the subject including the number of estimated FOG incidents as well as a
notification to a carer if a critical fall incident occurs. Moreover, it provides the carer
with the ability to send visual or auditory cues during a FOG incident or contact
emergency services. Based on the user preference, the system can contact a
relevant person via email or through notifications in the companion smartphone
application including a live stream of the incident and the time stamp of the relevant
date and time. An approved carer, once notified, can also initiate a Skype
conversation where he/she can talk to the patient and provide further support.
Figure 5:21 shows the system behaviour when a fall incident occurs. As Figure
5:21 depicts, the developed software was designed as an open-ended solution on
an UWP, that can provide other types of cues such as auditory cues to the patients.
However, while feasible, such additions are beyond the scope of this specific
study.
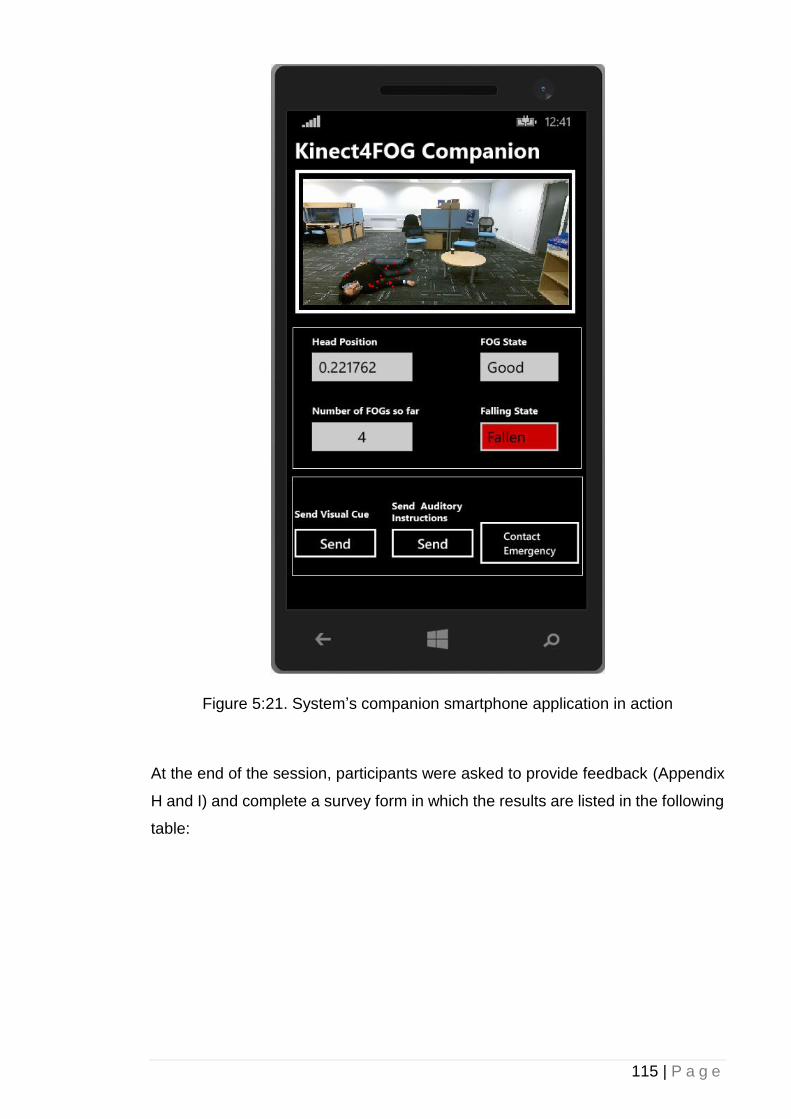
115 | P a g e
Figure 5:21. System’s companion smartphone application in action
At the end of the session, participants were asked to provide feedback (Appendix
H and I) and complete a survey form in which the results are listed in the following
table:

116 | P a g e
Table 5:4. Focus Group Questioner Feedback
Question Strongly agree (%)
Agree (%) Neither agree nor disagree
(%)
Disagree (%)
Strongly disagree
(%)
The system would be easy to use. 33.3 46.6 13.3 6.6 0
The system FOG detection was
accurate.
20 66.6 13.3 0 0
Auditory cue would also be
beneficial to be implemented.
20 46.6 20 13.3 0
The system fall detection was
accurate.
53.5 47 0 0 0
I am concerned about my privacy
when I use the system at home.
0 0 20 40 40
The overall system was helpful in
improving my mobility, especially
during a FOG.
26.6 53.3 20 0 0
The visual aid was helpful in
increasing my mobility and
walking performance.
13.3 86.6 0 0 0
I would use the system in my
house.
40 40 20 0 0
The results obtained in the above table related to fall detection are based on
demonstration made by a healthy participant not the volunteers. When asked
about the healthcare provider remote communication method with the patient
during a critical fall incident, eight patients suggested a telephone call while six
suggested a Skype video call and one remained neutral. While the prototype
system cost £137.69 to build excluding the controlling PC, patients suggested that
they would be willing to pay between £150-500 to have the system installed in their
homes. Nevertheless, if the prototype is released as a commercial device, other
economic factors including insurance, maintenance, and the necessity to install
multiple systems in different rooms would inevitably escalate the price. Finally,
117 | P a g e
when asked about possible improvements to the final product, eight of the patients
suggested that a hybrid/portable method that can also provide outdoor visual cues,
would be very beneficial while seven wanted it to be as simple as possible to keep
the cost down and have a separate device for outdoor purposes.
The QR code (Appendix K) demonstrates the use of our system in action upon
detection of a FOG event by providing visual cues and notifications to doctors and
carers.
5.8 Summary
This chapter provided the empirical results and findings for the research verifying
the hypothesise provided in the previous chapter. After an in-depth analysis of the
Kinect v1 capabilities and its performance, it was concluded the Kinect v2
introduces more advantages over its predecessor including higher frame rate and
resolution. Despite the fact that the Kinect v2 SDK was in beta phase and missing
a lot of built-in features, as the advantages of using it, outweighed its
shortcomings, thus, the Kinect v2 was chosen for this project. Moreover, for fall
detection, as mentioned before, due to the limited training dataset, and also due
to the relative simplicity of the detection (fall), heuristic approach was proven to be
more accurate in detecting true positive falls compared to the machine learning
counterpart. Additionally, as discussed, for footstep detection and consequently
the FOG tracking for patients, the knee angle method was chosen as the preferred
method for this study due to the fact that it lacks the inaccuracies and limitation of
the other method, which was based on the subject’s ankle height to the ground.
Combined with the developed hardware and software interface, the chosen
methods yielded promising results when the system was demonstrated to the
focus group and tested by some of the volunteers, based on their feedback.
118 | P a g e
6 Chapter 6: Conclusions and Future Work
The aim of this study was to Introduce two new footstep detection techniques one
based on the subject’s knee angle and one based on the subject’s ankle vertical
height to the ground; Reducing the Microsoft Kinect’s intrinsic inaccuracies in
skeletal data reading for the subject’s ankle vertical height to the ground footstep
detection technique; resulting in the increase in accuracy for the footstep detection
algorithm by introducing a new correction algorithm. Moreover, this research
aimed to provide an automatic and remotely manageable monitoring system for
PwP gait analysis and fall detection. The results of which would lead to the
development and evaluation of an integrated system capable of detecting falls and
FOG, providing visual cues orientated to a user’s position, and providing a range
of communication options. Based on the patients’ feedback, and in accordance
with previous research studies, it was concluded that our system can indeed be
helpful and used as a replacement to alternative, potentially less-capable
technologies such as laser canes and laser-mounted shoes. Due to the system
being an open-ended, proof of concept, the system’s coverage is limited to only
one axis. Nonetheless, future improvements can eliminate this constraint by
mounting the laser pointer, servo motors and the Kinect camera on a circular rail
attached to the ceiling capable of moving/rotating in accordance to the subject
position and direction in a room. Although this research was focused solely on the
automatic projection of dynamic visual cues, the system was designed to
accommodate additional features in future developments, such as auditory cues.
6.1 Conclusion
Overall, based on the patients’ feedback, the system represents a viable solution
for detecting fall incidents and providing help during a critical fall when the patient
is unattended. Furthermore, the system has the capacity to provide an unobtrusive
and automatic visual cue projection when needed at home during a FOG episode.
This study set out to explore the possibility of implementing an integrated system
based on Microsoft Kinect v2 capable of unobtrusively detecting falls and FOG
while providing remote support to the patients using developed applications. The
system was designed to provide visual cues in a form of laser lines in front of the
119 | P a g e
patient upon the detection of FOG in order to improve locomotion. Additionally, this
research set out to conduct a comparison between different Kinect’s open source
APIs such as OpenNI/NITE against the official Microsoft Kinect SDK for Windows
and investigated advantages and disadvantages for each SDK. It was concluded
that that the Microsoft official SDK for Windows was ideal for the implementation
of our project, as it does not require calibration before the joint tracking process
can take place. Nevertheless, OpenNI/NITE implementation proved to have a
reliable and more consistent joint tracking capabilities as well as a built-in support
for streamed image saving to the local disk for further analysis.
As mentioned before, the project’s researchers gathered joint coordination data
from our test subjects (male and female) with different heights, body builds, and
walking styles. During our analysis, it was found that our developed system was
able to identify the movement phases (e.g. moving, standing, sitting, etc.). Our
evaluations suggested that the consistency and stability of joint position tracking
data using Kinect v1 were acceptable when only one subject was present in the
field of view. However, the system efficiency, performance and consequently the
sampling rate dropped exponentially when an additional subject appeared in the
field.
Moreover, the ideal testing environment for such a project was investigated. By
studying the past projects reports and our experimental results it was concluded
that the increase in the subject’s distance from the sensor helped the consistency
of the joint tracking process. However, a distance further than 3.5 meters proved
to be problematic where the system was no longer able to identify different joint
positions. As mentioned earlier, the optimal subject’s distance from the Kinect v1
sensor was in the range of 2 to 2.5 meters. The ideal location of the camera was
proved to be at the height of 2.2 meters facing downward.
The rotation of the subject in different angles caused a huge decrease in the
system consistency to track joints. It was observed that having two or three Kinect
sensors interconnected to each other might solve the issue, as there would be a
360-degree coverage of the testing environment. Nevertheless, this approach
would require extra computation and preparations in terms of calibration between
the cameras as well as time synchronisation between data feeds from each
camera.
120 | P a g e
The type and the colour of the subject’s clothes did not appear to make a significant
impact on the joint tracking quality. Nevertheless, more investigation is required
towards the effect of clothing on the Kinect’s recognition capabilities.
The aforementioned limitations of the Kinect v1 and the hardware enhancements
and improvements including a wider field of view, farther coverage, and higher
resolution in depth and colour data of the Kinect v2 proved it to be a better
candidate for the use on this project. Consequently, , a Kinect v2 has been used
for gait performance analysis and evaluation due to its higher accuracy.
For fall detection, two different approaches including heuristic and machine
learning (using AdaBoostTrigger algorithm) based on Microsoft Kinect v2 sensor
were implemented and evaluated. The efficiency and accuracy of both were
compared against one another in similar conditions.
Heuristic approach showed higher accuracy in terms of detection of true positive
falls as it works independent to the number of pre-operation training videos.
Heuristic algorithms are very efficient for discrete detections such as falls, as long
as the detection case is simple enough to be implemented algorithmically. On the
other hand, AdaBoostTrigger machine learning approach effectiveness is greatly
dependent on the number of training samples. Correct and accurate sample
tagging plays a significant role in reducing latency and increasing accuracy.
Nevertheless, the overall success rate of a machine learning algorithm with a small
training dataset can be increased by implementing and combining more
confidence factors.
Overall, the machine learning approach is ideal for detections that are more
sophisticated in terms of body movements and require a lot of thresholding and
variables such as complex and continues body gestures or gait disorders, but for
simpler cases such as fall detection, its disadvantages outweigh its benefits;
mainly due to its increased needs for system resources (i.e. CPU and memory) to
process information beforehand. Moreover, video tagging is a painstaking task and
requires a lot of time and training data.
Thus, it is concluded that for fall detection with a small number of training samples
(11), the heuristic approach provides results that are more accurate. Nonetheless,
by increasing the number of training data, the accuracy of the machine learning
algorithm would also be increased. Machine learning approach accuracy would be
121 | P a g e
significantly higher in complex scenarios where a continuous and sophisticated
gesture needs to be detected.
Although the attempts undertaken on this research helped improving the accuracy
of footstep detection and joint 3D localisation at different distances, using only a
single Kinect v2 sensor and based on the ankle joint distance-to-ground, which
can be used in various gait analysis projects. It was concluded that for FOG
symptom detection in PwP, which requiring a higher accuracy in data reading for
footstep detection due to the nature of the symptoms, a more accurate technique
is needed, hence the implementation of a knee angle footstep detection.
In this thesis, a novel low-latency and low-resource approach in detecting
footsteps including foot-offs and foot contacts phases of a gait cycle based on a
subject’s knee joint angle was also introduced. It was concluded that neither the
camera’s height nor its angle to the ground has a significant impact on the data
acquisition of the subject’s knee joint angle, and as a result, on the footstep
detection process. Nonetheless, the detection of the proposed system was limited
to the Kinect v2 practical skeletal distance coverage (1.6 to 4 meters). Moreover,
the system showed a consistent measurement, as long as none of the knee’s
neighbouring joints (joints that are needed to be calculated for knee joint angle
determination) is obstructed or undetected by the Kinect v2 camera.
Overall, due to the low latency and high accuracy of this technique and the fact
that the system’s accuracy is unaffected by the Kinect v2 intrinsic inaccuracies or
its height or angle, the proposed system can be used for gait assessment
scenarios that require a high level of accuracy as it is capable of detecting subtle
movements.
The results of this research also verified that it is possible to implement an
automatic and unobtrusive FOG monitoring and mobility improvement system
while being reliable and accurate at the same time. Nonetheless, there are many
limitations to this approach including the indoor aspect of it and the fact that it
requires the whole setup including the Kinect, servos, and laser projectors to be
included in the most communed areas of a house such as the living room and the
kitchen. Having said that, the affordability (the entire setup except the controlling
PC will cost £137.69), and ease of installation would still make it a desirable
solution should more than one setup need to be placed in a house. Nevertheless,
the system’s main advantages such as real-time patient’s monitoring, improved
122 | P a g e
locomotion and patient’s mobility, unobtrusive and intelligent visual cue projection,
make it in overall, a desirable solution that can be further enhanced for future
implementations.
Additionally, the results of this research demonstrate the viability of using an
automatic and unobtrusive system for monitoring and improving the mobility of
PwP based on the Microsoft Kinect camera. The implementation of a visual cuing
system based on laser lines for improving FOG incidents in PwP has been
developed and reviewed by 15 PwP. Feedback provided regarding the usability of
the system showed promising results. All the participants either ‘agreed’ or
‘strongly agreed’ with the fact that the system’s visual cues are helpful in increasing
their mobility and walking performance. 86.6 % of those who tested the system,
were satisfied with the system’s FOG detection whereas 13.3 % neither agreed or
disagreed about the system’s competency in detecting FOG incidents.
Overall, compared to current commercially available alternative devices, this
system provides a broadly affordable solution while, theoretically, providing a
means of improving patients’ mobility unobtrusively. Moreover, this solution is one
of the few that can function in an automated fashion, both in terms of event
detection, cue provision and when establishing communication with third parties.
The user does not need to wear something, charge a device, carry anything or
switch it on or off. The ease of use and simple installation process compared to
other available solutions can make the system a desirable solution for indoor
assisting purposes as suggested by participants in the current study.
6.2 Future Work
This research laid the foundation to explore the feasibility of commercially available
apparatuses such as Microsoft Kinect sensor as a home monitoring service for
PwP as a rehabilitation fall detection tool. It also provided the possibility of using
an automatic and unobtrusive system to deliver on-demand visual cues based on
laser lines in front of a patient regardless of one’s position and orientation in a
room to improve one’s locomotion and gait performance during a FOG incident.
As a next step, one could improve the system’s coverage with a series of this
implemented system to be installed in PwP houses to cover most of the communal
areas or areas where the patient experiences the FOG the most. One could also
investigate the possibility of using such systems attached to a circular rail on a
123 | P a g e
ceiling that can rotate and move according to the patient’s location, this removes
the need for extra setup in each room as the system can cover one direction at the
current stage. As mentioned before, this system was designed as an open-ended
platform to provide variety of supports for PwP in the future including auditory cues.
The system’s capabilities in providing such cues and the effect of them on PwP
can also be explored. Moreover, by coupling the system with other available
solutions such as laser-mounted canes or shoes, patients can use the
implemented system when they are at home while using other methods for outdoor
purposes. This requires integration at different levels such as smartphone
application and visual cues in order for these systems to work as intended.
Additionally, with the introduction of augmented reality apparatuses such as
Microsoft HoloLens, one could use Microsoft Kinect and the developed algorithms
to detect FOG in PwP while using the HoloLens to provide visual/auditory cues to
the patient. The implemented algorithms used in this research study can also be
improved, especially for machine learning fall detection. As mentioned before, by
having larger training dataset, the accuracy of the machine learning algorithm in
detecting true positive falls can be significantly improved. One could also use the
principal of Kinect-based machine learning tools including VGB, to implement
complex detection systems such as machine learning based FOG detection.
124 | P a g e
References
[1] A. Yarnall, N. Archibald, and D. Brun, “Parkinson’s disease,” Lancet, vol.
386, no. 9996, pp. 896–912, 2015.
[2] M. F. Dirkx, H. E. M. den Ouden, E. Aarts, M. H. M. Timmer, B. R. Bloem, I.
Toni, and R. C. Helmich, “Dopamine controls Parkinson’s tremor by
inhibiting the cerebellar thalamus,” Brain, p. aww331, 2017.
[3] W. R. Young, L. Shreve, E. J. Quinn, C. Craig, and H. Bronte-Stewart,
“Auditory cueing in Parkinson’s patients with freezing of gait. What matters
most: Action-relevance or cue-continuity?,” Neuropsychologia, vol. 87, pp.
54–62, 2016.
[4] R. M. Pickering, Y. A. M. Grimbergen, U. Rigney, A. Ashburn, G. Mazibrada,
B. Wood, P. Gray, G. Kerr, and B. R. Bloem, “A meta-analysis of six
prospective studies of falling in Parkinson’s disease,” Mov. Disord., vol. 22,
no. 13, pp. 1892–1900, 2007.
[5] L. Johnson, I. James, J. Rodrigues, R. Stell, G. Thickbroom, and F.
Mastaglia, “Clinical and posturographic correlates of falling in Parkinson’s
disease,” Mov. Disord., vol. 28, no. 9, pp. 1250–1256, 2013.
[6] B. R. Bloem, J. M. Hausdorff, J. E. Visser, and N. Giladi, “Falls and freezing
of Gait in Parkinson’s disease: A review of two interconnected, episodic
phenomena,” Mov. Disord., vol. 19, no. 8, pp. 871–884, 2004.
[7] Y. Okuma, “Freezing of gait in Parkinson’s disease,” J. Neurol., vol. 253, no.
SUPPL. 7, pp. 27–32, 2006.
[8] E. N. Beck, K. A. Ehgoetz Martens, and Q. J. Almeida, “Freezing of Gait in
Parkinson’s Disease: An Overload Problem?,” PLoS One, vol. 10, no. 12, p.
e0144986, 2015.
[9] “Brain Cell Destruction Blocked in Parkinson’s Disease Models with SR-
3306,” Neuroscience News, 2011. [Online]. Available:
http://neurosciencenews.com/brain-cell-destruction-blocked-parkinsons-
disease-models-sr-3306/. [Accessed: 23-Oct-2017].
[10] S. Donovan, C. Lim, N. Diaz, N. Browner, P. Rose, L. R. Sudarsky, D. Tarsy,

125 | P a g e
S. Fahn, and D. K. Simon, “Laserlight cues for gait freezing in Parkinson’s
disease: An open-label study,” Park. Relat. Disord., vol. 17, no. 4, pp. 240–
245, 2011.
[11] J. G. Nutt, B. R. Bloem, N. Giladi, M. Hallett, F. B. Horak, and A. Nieuwboer,
“Freezing of gait: Moving forward on a mysterious clinical phenomenon,”
Lancet Neurol., vol. 10, no. 8, pp. 734–744, 2011.
[12] University of Rochester, “Laser Pointer Helps Parkinson’s Patients Take
Next Step,” 1999. [Online]. Available:
https://www.rochester.edu/news/show.php?id=1175. [Accessed: 24-May-
2017].
[13] S. A. Factor and W. J. Weiner, Parkinson’s Disease: Diagnosis and Clinical
Management, 2nd ed. 2007.
[14] “Parkinson’s disease - Treatment,” NHS, 2016. [Online]. Available:
https://www.nhs.uk/Conditions/Parkinsons-disease/Pages/Treatment.aspx.
[Accessed: 23-Oct-2017].
[15] N. Galvez-Jimenez, Scientific Basis for the Treatment of Parkinson’s
Disease, 2nd ed. CRC Press, 2013.
[16] W. J. Marks, Deep Brain Stimulation Management. Cambridge Medicine,
2010.
[17] L. Rochester, V. Hetherington, D. Jones, A. Nieuwboer, A. M. Willems, G.
Kwakkel, and E. Van Wegen, “The effect of external rhythmic cues (auditory
and visual) on walking during a functional task in homes of people with
Parkinson’s disease,” Arch. Phys. Med. Rehabil., vol. 86, no. 5, pp. 999–
1006, 2005.
[18] Ali Asad Khan, “Detecting Freezing of Gait in Parkinson ’ s Disease for
Automatic Application of Rhythmic Auditory Stimuli,” University of Reading,
2013.
[19] M. Suteerawattananon, G. S. Morris, B. R. Etnyre, J. Jankovic, and E. J.
Protas, “Effects of visual and auditory cues on gait in individuals with
Parkinson’s disease,” J. Neurol. Sci., vol. 219, no. 1–2, pp. 63–69, 2004.
[20] T. C. Rubinstein, N. Giladi, and J. M. Hausdorff, “The power of cueing to
circumvent dopamine deficits: A review of physical therapy treatment of gait

126 | P a g e
disturbances in Parkinson’s disease,” Mov. Disord., vol. 17, no. 6, pp. 1148–
1160, 2002.
[21] J. Azulay, S. Mesure, B. Amblard, O. Blin, I. Sangla, and J. Pouget, “Visual
control of locomotion in Parkinson ’ s disease,” Analysis, pp. 111–120, 1999.
[22] T. a Kaminsky, B. J. Dudgeon, F. F. Billingsley, P. H. Mitchell, and S. J.
Weghorst, “Virtual cues and functional mobility of people with Parkinson’s
disease: a single-subject pilot study.,” J. Rehabil. Res. Dev., vol. 44, no. 3,
pp. 437–448, 2007.
[23] J. H. McAuley, P. M. Daly, and C. R. Curtis, “A preliminary investigation of a
novel design of visual cue glasses that aid gait in Parkinson’s disease.,” Clin.
Rehabil., vol. 23, no. 8, pp. 687–695, 2009.
[24] C. A. Lebold and Q. J. Almeida, “An evaluation of mechanisms underlying
the influence of step cues on gait in Parkinson’s disease,” J. Clin. Neurosci.,
vol. 18, no. 6, pp. 798–802, 2011.
[25] A. J. Carrel, “The effects of cueing on walking stability in people with
Parkinson’s disease,” Iowa State University, 2007.
[26] Y. Jiang and K. E. Norman, “Effects of visual and auditory cues on gait
initiation in people with Parkinson’s disease.,” Clin. Rehabil., vol. 20, no. 1,
pp. 36–45, 2006.
[27] R. Velik, “Effect of On-Demand Cueing on Freezing of Gait in Parkinson ’ s
Patients,” Int. J. Medical, Pharm. Sci. Eng., vol. 6, no. 6, pp. 10–15, 2012.
[28] J. P. Azulay, S. Mesure, and O. Blin, “Influence of visual cues on gait in
Parkinson’s disease: Contribution to attention or sensory dependence?,” J.
Neurol. Sci., vol. 248, no. 1–2, pp. 192–195, 2006.
[29] B. P. Dvorsky, S. Elgelid, and C. W. Chau, “The Effectiveness of Utilizing a
Combination of External Visual and Auditory Cues as a Gait Training
Strategy in a Pharmaceutically Untreated Patient with Parkinson’s Disease:
A Case Report,” Phys. Occup. Ther. Geriatr., vol. 29, no. 4, pp. 320–326,
2011.
[30] H. J. Griffin, R. Greenlaw, P. Limousin, K. Bhatia, N. P. Quinn, and M.
Jahanshahi, “The effect of real and virtual visual cues on walking in
Parkinson’s disease,” J. Neurol., vol. 258, no. 6, pp. 991–1000, 2011.
127 | P a g e
[31] R. Velik, U. Hoffmann, H. Zabaleta, J. Félix, M. Massó, and T. Keller, “The
Effect of Visual Cues on the Number and Duration of Freezing Episodes in
Parkinson’s Patients,” 2012, no. 1, pp. 4656–4659.
[32] T. C. Rubinstein, N. Giladi, and J. M. Hausdorff, “The power of cueing to
circumvent dopamine deficits: A review of physical therapy treatment of gait
disturbances in Parkinson’s disease,” Mov. Disord., vol. 17, no. 6, pp. 1148–
1160, Nov. 2002.
[33] B. Takač, W. Chen, and M. Rauterberg, “Toward a domestic system to assist
people with Parkinson’s,” SPIE Newsroom, vol. 19, no. 8, pp. 871–884, Jun.
2013.
[34] J. Azulay, S. Mesure, B. Amblard, O. Blin, I. Sangla, and J. Pouget, “Visual
control of locomotion in Parkinson ’ s disease,” Analysis, no. November, pp.
111–120, 1999.
[35] Y. Zhao, S. Ramesberger, U. M. Fietzek, L. T. D’Angelo, and T. C. Luth, “A
novel wearable laser device to regulate stride length in Parkinson’s disease,”
Proc. Annu. Int. Conf. IEEE Eng. Med. Biol. Soc. EMBS, pp. 5895–5898,
2013.
[36] G. N. Lewis, W. D. Byblow, and S. E. Walt, “Stride length regulation in
Parkinson’s disease: the use of extrinsic, visual cues.,” Brain, vol. 123 ( Pt
1, pp. 2077–2090, 2000.
[37] E. E. Tripoliti, A. T. Tzallas, M. G. Tsipouras, G. Rigas, P. Bougia, M.
Leontiou, S. Konitsiotis, M. Chondrogiorgi, S. Tsouli, and D. I. Fotiadis,
“Automatic detection of freezing of gait events in patients with Parkinson’s
disease,” Comput. Methods Programs Biomed., vol. 110, no. 1, pp. 12–26,
2013.
[38] L. Pepa, L. Ciabattoni, F. Verdini, M. Capecci, and M. G. Ceravolo,
“Smartphone based Fuzzy Logic freezing of gait detection in Parkinson’s
Disease,” 2014 IEEE/ASME 10th Int. Conf. Mechatron. Embed. Syst. Appl.,
pp. 1–6, 2014.
[39] S. Mazilu, M. Hardegger, Z. Zhu, D. Roggen, G. Tröster, M. Plotnik, J. M.
Hausdorff, and G. Troester, “Online Detection of Freezing of Gait with
Smartphones and Machine Learning Techniques,” Proc. 6th Int. ICST Conf.
Pervasive Comput. Technol. Healthc., no. 3, pp. 123–130, 2012.
128 | P a g e
[40] E. Jovanov, E. Wang, L. Verhagen, M. Fredrickson, and R. Fratangelo,
“deFOG–A real time system for detection and unfreezing of gait of
Parkinson’s patients,” Conf. Proc. ... Annu. Int. Conf. IEEE Eng. Med. Biol.
Soc. IEEE Eng. Med. Biol. Soc. Conf., vol. 2009, pp. 5151–5154, 2009.
[41] S. Mazilu, U. Blanke, A. Calatroni, E. Gazit, J. M. Hausdorff, and G. Tröster,
“The role of wrist-mounted inertial sensors in detecting gait freeze episodes
in Parkinson’s disease,” Pervasive Mob. Comput., 2016.
[42] K. Niazmand, K. Tonn, Y. Zhao, U. M. Fietzek, F. Schroeteler, K. Ziegler, a.
O. Ceballos-Baumann, and T. C. Lueth, “Freezing of Gait detection in
Parkinson’s disease using accelerometer based smart clothes,” 2011 IEEE
Biomed. Circuits Syst. Conf., pp. 201–204, 2011.
[43] a M. A. Handojoseno, J. M. Shine, T. N. Nguyen, Y. Tran, S. J. G. Lewis,
and H. T. Nguyen, “The detection of Freezing of Gait in Parkinson’s disease
patients using EEG signals based on Wavelet decomposition,” 2012 Annu.
Int. Conf. IEEE Eng. Med. Biol. Soc., vol. 2012, no. February, pp. 69–72,
2012.
[44] B. Galna, D. Jackson, G. Schofield, R. McNaney, M. Webster, G. Barry, D.
Mhiripiri, M. Balaam, P. Olivier, and L. Rochester, “Retraining function in
people with Parkinson’s disease using the Microsoft kinect: Game design
and pilot testing,” J. Neuroeng. Rehabil., vol. 11, no. 1, p. no pagination,
2014.
[45] G. Palacios-Navarro, I. García-Magariño, and P. Ramos-Lorente, “A Kinect-
Based System for Lower Limb Rehabilitation in Parkinson’s Disease
Patients: a Pilot Study,” J. Med. Syst., vol. 39, no. 9, 2015.
[46] A. P. Rocha, H. Choupina, J. M. Fernandes, M. J. Rosas, R. Vaz, and J. P.
Silva Cunha, “Kinect v2 based system for Parkinson’s disease assessment,”
in 2015 37th Annual International Conference of the IEEE Engineering in
Medicine and Biology Society (EMBC), 2015, pp. 1279–1282.
[47] S. Ghoussayni, C. Stevens, S. Durham, and D. Ewins, “Assessment and
validation of a simple automated method for the detection of gait events and
intervals,” Gait Posture, vol. 20, no. 3, pp. 266–272, 2004.
[48] A. Hreljac and R. N. Marshall, “Algorithms to determine event timing during
normal walking using kinematic data,” J. Biomech., vol. 33, no. 6, pp. 783–
129 | P a g e
786, 2000.
[49] K. Ben Mansour, N. Rezzoug, and P. Gorce, “Analysis of several methods
and inertial sensors locations to assess gait parameters in able-bodied
subjects,” Gait Posture, vol. 42, no. 4, pp. 409–414, 2015.
[50] K. Bötzel, F. M. Marti, M. Á. C. Rodríguez, A. Plate, and A. O. Vicente, “Gait
recording with inertial sensors - How to determine initial and terminal
contact,” J. Biomech., vol. 49, no. 3, pp. 332–337, 2015.
[51] S. C. Wearing, L. F. Reed, and S. R. Urry, “Agreement between temporal
and spatial gait parameters from an instrumented walkway and treadmill
system at matched walking speed,” Gait Posture, vol. 38, no. 3, pp. 380–
384, 2013.
[52] M. W. Bundle, M. O. Powell, and L. J. Ryan, “Design and testing of a high-
speed treadmill to measure ground reaction forces at the limit of human gait,”
Med. Eng. Phys., vol. 37, no. 9, pp. 892–897, 2015.
[53] J. F. Item-Glatthorn, N. C. Casartelli, and N. A. Maffiuletti, “Reproducibility
of gait parameters at different surface inclinations and speeds using an
instrumented treadmill system,” Gait {&} Posture, vol. 44, pp. 259–264,
2016.
[54] B. Kwolek, T. Krzeszowski, and A. Michalczuk, “3D Gait Recognition Using
Spatio-Temporal,” Intell. Inf. Database Syst. 6th Asian Conf., pp. 595–604,
2014.
[55] A. Ijaz, S. Gibbs, R. Abboud, W. Wang, D. Ming, and B. Wan, “Analysis of
knee joint kinematics during walking in patients with cerebral palsy through
human motion capture and gait model-based measurement,” Proc. IEEE Int.
Conf. Virtual Environ. Human-Computer Interfaces, Meas. Syst., pp. 196–
199, 2012.
[56] Q. Wang, Q. Wang, G. Kurillo, F. Ofli, and R. Bajcsy, “Evaluation of Pose
Tracking Accuracy in the First and Second Generations of Microsoft Kinect,”
in International Conference on Healthcare Informatics, 2015, pp. 380–389.
[57] A. Amini, K. Banitsas, and S. Hosseinzadeh, “A new technique for foot-off
and foot contact detection in a gait cycle based on the knee joint angle using
microsoft kinect v2,” in 2017 IEEE EMBS International Conference on
130 | P a g e
Biomedical & Health Informatics (BHI), 2017, pp. 153–156.
[58] A. Amini, K. Banitsas, A. Badii, and J. Cosmas, “Recognition of postures and
Freezing of Gait in Parkinson’s disease patients using Microsoft Kinect
sensor,” 2015 7th Int. IEEE/EMBS Conf. Neural Eng., pp. 731–734, 2015.
[59] R. A. Clark, K. J. Bower, B. F. Mentiplay, K. Paterson, and Y. H. Pua,
“Concurrent validity of the Microsoft Kinect for assessment of spatiotemporal
gait variables,” J. Biomech., vol. 46, no. 15, pp. 2722–2725, 2013.
[60] M. Gabel, R. Gilad-Bachrach, E. Renshaw, and A. Schuster, “Full Body Gait
Analysis with Kinect *,” in 2012 Annual International Conference of the IEEE
Engineering in Medicine and Biology Society, 2012, pp. 1964–1967.
[61] B. Galna, G. Barry, D. Jackson, D. Mhiripiri, P. Olivier, and L. Rochester,
“Accuracy of the Microsoft Kinect sensor for measuring movement in people
with Parkinson’s disease.,” Gait {&} posture, vol. 39, no. 4, pp. 1062–1068,
2014.
[62] A. Procházka, O. Vyšata, M. Vališ, O. ˇTupa, M. Schätz, and V. Maˇrík, “Use
of the image and depth sensors of the Microsoft Kinect for the detection of
gait disorders,” Neural Comput. Appl., vol. 26, no. 7, pp. 1621–1629, 2015.
[63] E. E. Stone and M. Skubic, “Unobtrusive, continuous, in-home gait
measurement using the microsoft kinect,” IEEE Trans. Biomed. Eng., vol.
60, no. 10, pp. 2925–2932, 2013.
[64] A. Amini, K. Banitsas, and J. Cosmas, “A comparison between heuristic and
machine learning techniques in fall detection using Kinect v2,” 2016 IEEE
Int. Symp. Med. Meas. Appl., pp. 1–6, 2016.
[65] F. Ahmed, P. P. Paul, and M. L. Gavrilova, “Kinect-Based Gait Recognition
Using Sequences of the Most Relevant Joint Relative Angles,” vol. 23, no.
2, pp. 147–156, 2015.
[66] A. Corti, S. Giancola, G. Mainetti, and R. Sala, “A metrological
characterization of the Kinect V2 time-of-flight camera,” Rob. Auton. Syst.,
vol. 75, pp. 584–594, 2016.
[67] E. Stone and M. Skubic, “Evaluation of an inexpensive depth camera for in-
home gait assessment,” J. Ambient Intell. Smart Environ., vol. 3, no. 4, pp.
349–361, 2011.
131 | P a g e
[68] L. Yang, L. Zhang, H. Dong, A. Alelaiwi, and A. Saddik, “Evaluating and
improving the depth accuracy of Kinect for Windows v2,” IEEE Sens. J., vol.
15, no. 8, pp. 4275–4285, 2015.
[69] E. Auvinet, F. Multon, C. E. Aubin, J. Meunier, and M. Raison, “Detection of
gait cycles in treadmill walking using a Kinect,” Gait Posture, vol. 41, no. 2,
pp. 722–725, 2015.
[70] D. J. Geerse, B. H. Coolen, and M. Roerdink, “Kinematic validation of a
multi-Kinect v2 instrumented 10-meter walkway for quantitative gait
assessments,” PLoS One, vol. 10, no. 10, pp. 1–15, 2015.
[71] X. Xu, R. W. McGorry, L. S. Chou, J. hua Lin, and C. chi Chang, “Accuracy
of the Microsoft KinectTM for measuring gait parameters during treadmill
walking,” Gait Posture, vol. 42, no. 2, pp. 145–151, 2015.
[72] B. Sun, X. Liu, X. Wu, and H. Wang, “Human gait modeling and gait analysis
based on Kinect,” Proc. - IEEE Int. Conf. Robot. Autom., pp. 3173–3178,
2014.
[73] J. M. Kang, T. Yoo, and H. C. Kim, “A wrist-worn integrated health monitoring
instrument with a tele-reporting device for telemedicine and telecare,” IEEE
Trans. Instrum. Meas., vol. 55, no. 5, pp. 1655–1661, 2006.
[74] M. N. Nyan, F. E. H. Tay, and E. Murugasu, “A wearable system for pre-
impact fall detection,” J. Biomech., vol. 41, no. 16, pp. 3475–3481, 2008.
[75] P. Pierleoni, A. Belli, L. Palma, M. Pellegrini, L. Pernini, and S. Valenti, “A
High Reliability Wearable Device for Elderly Fall Detection,” IEEE Sens. J.,
vol. 15, no. 8, pp. 4544–4553, 2015.
[76] T. T. Nguyen, M. C. Cho, and T. S. Lee, “Automatic fall detection using
wearable biomedical signal measurement terminal,” Proc. 31st Annu. Int.
Conf. IEEE Eng. Med. Biol. Soc. Eng. Futur. Biomed. EMBC 2009, pp.
5203–5206, 2009.
[77] S. Ee and S. M, “Fall detection in homes of older adults using the Microsoft
Kinect.,” IEEE J Biomed Heal. Inf., vol. 19, no. 1, pp. 290–301, 2015.
[78] G. Mastorakis and D. Makris, “Fall detection system using Kinect???s
infrared sensor,” J. Real-Time Image Process., vol. 9, no. 4, pp. 635–646,
2012.
132 | P a g e
[79] S. Gasparrini, E. Cippitelli, S. Spinsante, and E. Gambi, “A Depth-Based Fall
Detection System Using a Kinect Sensor,” Sensors, vol. 14, no. 2, pp. 2756–
2775, 2014.
[80] Scienceofparkinsons.com, “2017 – Year in Review: A good vintage,” 2017.
[Online]. Available: https://scienceofparkinsons.com/2017/12/31/2017-
vintage/. [Accessed: 13-May-2018].
[81] G. Mastorakis and D. Makris, “Fall detection system using Kinect’s infrared
sensor,” J. Real-Time Image Process., vol. 9, no. 4, pp. 635–646, 2012.
[82] M. Rusko and A. Korauš, “Faculty of Materials Science and Technology in
Trnava,” Mater. Sci. Technol., vol. 22, no. 28, pp. 157–162, 2010.
[83] “What’s New.” [Online]. Available: https://msdn.microsoft.com/en-
us/library/jj663803.aspx. [Accessed: 04-Oct-2017].
[84] J. Webb and J. Ashley, Beginning Kinect Programming with the Microsoft
Kinect SDK. Apress, 2012.
[85] “Kinect for Windows Sensor Components and Specifications.” [Online].
Available: https://msdn.microsoft.com/library/jj131033.aspx. [Accessed: 04-
Oct-2017].
[86] K. Labelle, “Evaluation Of Kinect Joint Tracking for Clinical and In-Home
Stroke Rehabilitation Tools,” University of Notre Dame, 2011.
[87] B. Freedman, A. Shpunt, M. Machline, and Y. Arieli, “( 12 ) Unlted States
Patent Apparatus for mapping an object includes an illumination,” US
8,493,496 B2, 2013.
[88] K. Khoshelham and S. O. Elberink, “Accuracy and resolution of kinect depth
data for indoor mapping applications,” Sensors, vol. 12, no. 2, pp. 1437–
1454, 2012.
[89] M. R. Andersen, T. Jensen, P. Lisouski, A. K. Mortensen, M. K. Hansen, T.
Gregersen, and P. Ahrendt, “Kinect Depth Sensor Evaluation for Computer
Vision Applications,” Electr. Comput. Eng., vol. Technical, p. 37, 2012.
[90] W. Wong, “How Microsoft’s PrimeSense-based Kinect Really Works,”
Electronic Design, 2011. [Online]. Available:
http://www.electronicdesign.com/embedded/how-microsoft-s-primesense-
133 | P a g e
based-kinect-really-works. [Accessed: 07-Oct-2017].
[91] “Welcome to the OpenKinect project,” Open Kinect, 2012. [Online].
Available: https://openkinect.org/wiki/Main_Page. [Accessed: 07-Oct-2017].
[92] “CL NUI Platform,” Code Laboratories, 2010. [Online]. Available:
https://codelaboratories.com/kb/nui. [Accessed: 07-Oct-2017].
[93] “kinect,” ROS.org, 2013. [Online]. Available: http://wiki.ros.org/kinect.
[Accessed: 07-Oct-2017].
[94] “PrimeSense NITE Algorithms 1.5,” OpenNi, 2011. [Online]. Available:
http://openni.ru/wp-content/uploads/2013/02/NITE-Algorithms.pdf.
[Accessed: 07-Oct-2017].
[95] J. St. Jean, Kinect Hacks: Tips & Tools for Motion and Pattern Detection, 1st
ed. O’Reilly Media, 2012.
[96] S. Falahati, OpenNI Cookbook. Birmingham: Packt Publishing, 2013.
[97] A. Puri, “Kinect for Windows SDK – NUI – SDK Architecture,” Microsoft
Blogs, 2012. [Online]. Available:
https://blogs.msdn.microsoft.com/ampuri/2012/02/09/kinect-for-windows-
sdk-nui-sdk-architecture/. [Accessed: 07-Oct-2017].
[98] “Color Stream,” Microsoft Developer Network (MSDN), 2017. [Online].
Available: https://msdn.microsoft.com/en-us/library/jj131027.aspx.
[Accessed: 10-Oct-2017].
[99] J. Shotton, A. Fitzgibbon, M. Cook, T. Sharp, M. Finocchio, R. Moore, A.
Kipman, and A. Blake, “Real-time human pose recognition in parts from
single depth images,” Comput. Vis. Pattern Recognit., vol. 2, p. 7, 2011.
[100] “JointType Enumeration,” Microsoft Developer Network (MSDN), 2017.
[Online]. Available: https://msdn.microsoft.com/en-
us/library/microsoft.kinect.jointtype.a. [Accessed: 10-Oct-2017].
[101] “Near Mode: What it is (and isn’t),” Kinect for Windows Product Blog, 2012.
[Online]. Available:
https://blogs.msdn.microsoft.com/kinectforwindows/2012/01/20/near-mode-
what-it-is-and-isnt/. [Accessed: 10-Oct-2017].
[102] “Tracking Modes (Seated and Default),” Microsoft Developer Network
134 | P a g e
(MSDN), 2017. [Online]. Available: https://msdn.microsoft.com/en-
us/library/hh973077.aspx. [Accessed: 10-Oct-2017].
[103] J. Duffy, “Exclusive: Inside Project Natal’s Brain,” 2010. [Online]. Available:
https://www.popsci.com/gadgets/article/2010-01/exclusive-inside-
microsofts-project-natal. [Accessed: 07-Oct-2017].
[104] “Kinect hardware.” [Online]. Available: https://developer.microsoft.com/en-
us/windows/kinect/hardware. [Accessed: 04-Oct-2017].
[105] J. Callaham, “Kinect for Windows v2 sensor sales end, developers can use
Xbox One version instead,” Windows Central, 2015. [Online]. Available:
https://www.windowscentral.com/kinect-windows-v2-sensor-sales-end-
developers-can-use-xbox-one-version. [Accessed: 16-Oct-2017].
[106] L. Yang, Y. Ren, H. Hu, and B. Tian, “New Fast Fall Detection Method Based
on Spatio-Temporal Context Tracking of Head by Using Depth Images,”
Sensors, vol. 15, no. 9, pp. 23004–23019, 2015.
[107] C. Rougier, J. Meunier, A. St-Arnaud, and J. Rousseau, “3D head tracking
for fall detection using a single calibrated camera,” Image Vis. Comput., vol.
31, no. 3, pp. 246–254, 2013.
[108] P. Kankanala, S. Das, and A. Pahwa, “AdaBoost+: An Ensemble Learning
Approach for Estimating Weather-Related Outages in Distribution Systems,”
IEEE Trans. Power Syst., vol. 29, no. 1, pp. 359–367, 2014.
[109] “Visual Gesture Builder: Overview,” Microsoft Developer Network (MSDN),
2017. [Online]. Available: https://msdn.microsoft.com/en-
us/library/dn785529.aspx. [Accessed: 31-Oct-2017].
[110] A. Amini, K. Banitsas, and J. Cosmas, “A comparison between heuristic and
mAmini, A., Banitsas, K., & Cosmas, J. (2016). A comparison between
heuristic and machine learning techniques in fall detection using Kinect v2.
In 2016 IEEE International Symposium on Medical Measurements and
Applicatio,” in 2016 IEEE International Symposium on Medical
Measurements and Applications (MeMeA), 2016, pp. 1–6.
[111] B. Evans, Beginning Arduino Programming. Berkeley, CA: Apress, 2011.
[112] L. Bunting-Perry, M. Spindler, K. M. Robinson, J. Noorigian, H. J. Cianci,
and J. E. Duda, “Laser light visual cueing for freezing of gait in Parkinson

135 | P a g e
disease: A pilot study with male participants,” J. Rehabil. Res. Dev., vol. 50,
no. 2, pp. 223–230, 2013.
[113] C. Marais and D. Quinn, “Visual Gesture Builder: A Data-Driven Solution to
Gesture Detection,” 2013.

136 | P a g e
Appendices
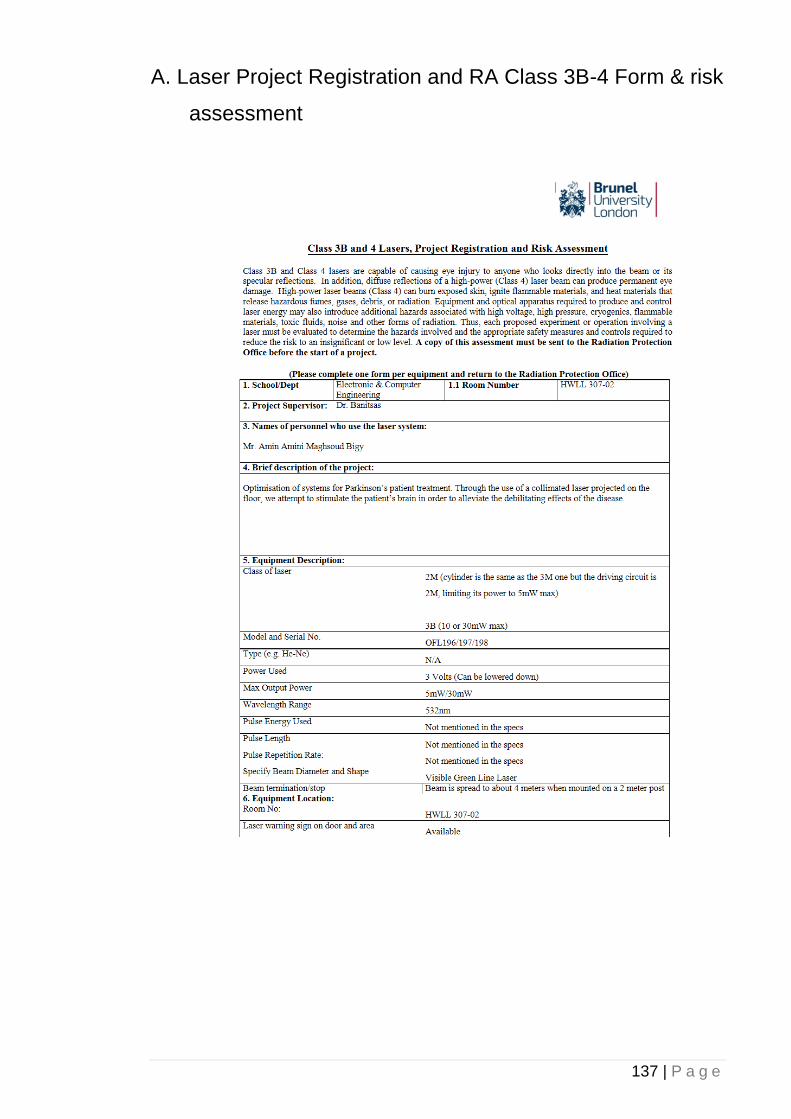
137 | P a g e
A. Laser Project Registration and RA Class 3B-4 Form & risk
assessment

138 | P a g e

139 | P a g e

140 | P a g e
141 | P a g e
B. Approval Letter from Brunel for inviting Parkinson's
patients

142 | P a g e
C. Consent Form for Focus Group participation
D. Approval of collaboration with Parkinson’s UK

143 | P a g e

144 | P a g e
145 | P a g e
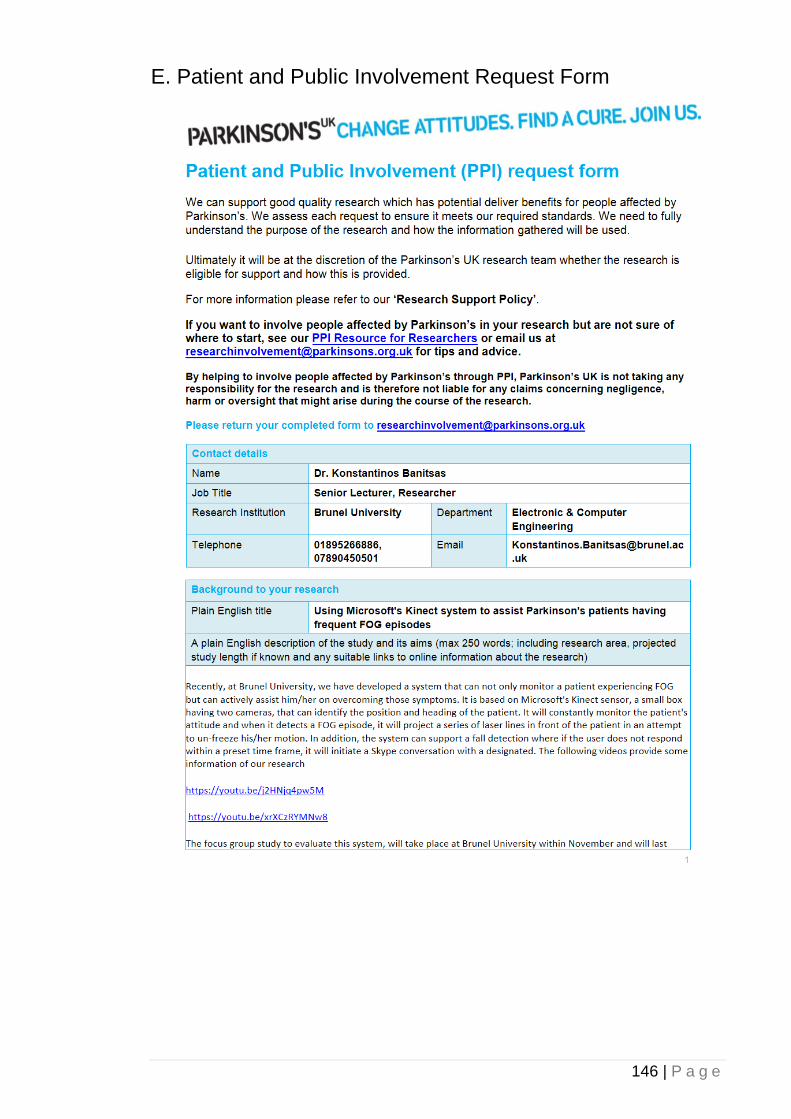
146 | P a g e
E. Patient and Public Involvement Request Form

147 | P a g e
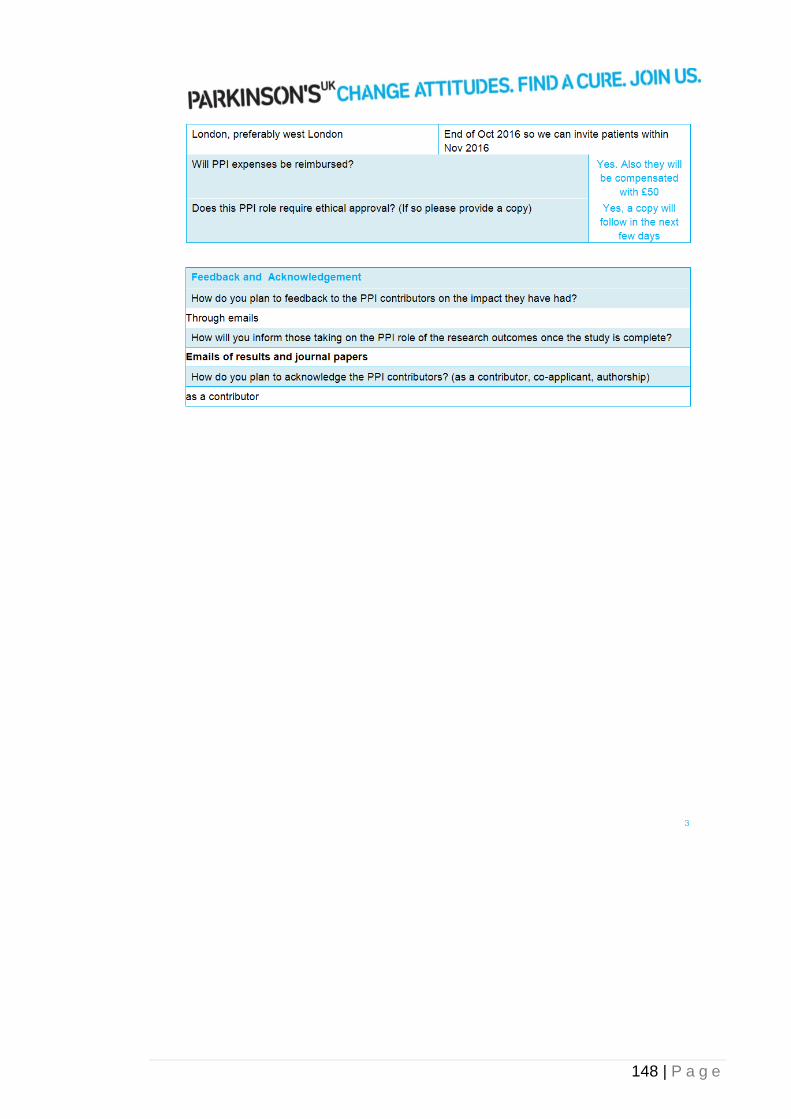
148 | P a g e

149 | P a g e
F. Invitation to Focus Group Days
150 | P a g e

151 | P a g e

152 | P a g e
G. Invitation to Participate to the focus groups
153 | P a g e
H. Participant Information Sheet

154 | P a g e
155 | P a g e

156 | P a g e

157 | P a g e

158 | P a g e
I. Participant Feedback Form

159 | P a g e

160 | P a g e

161 | P a g e
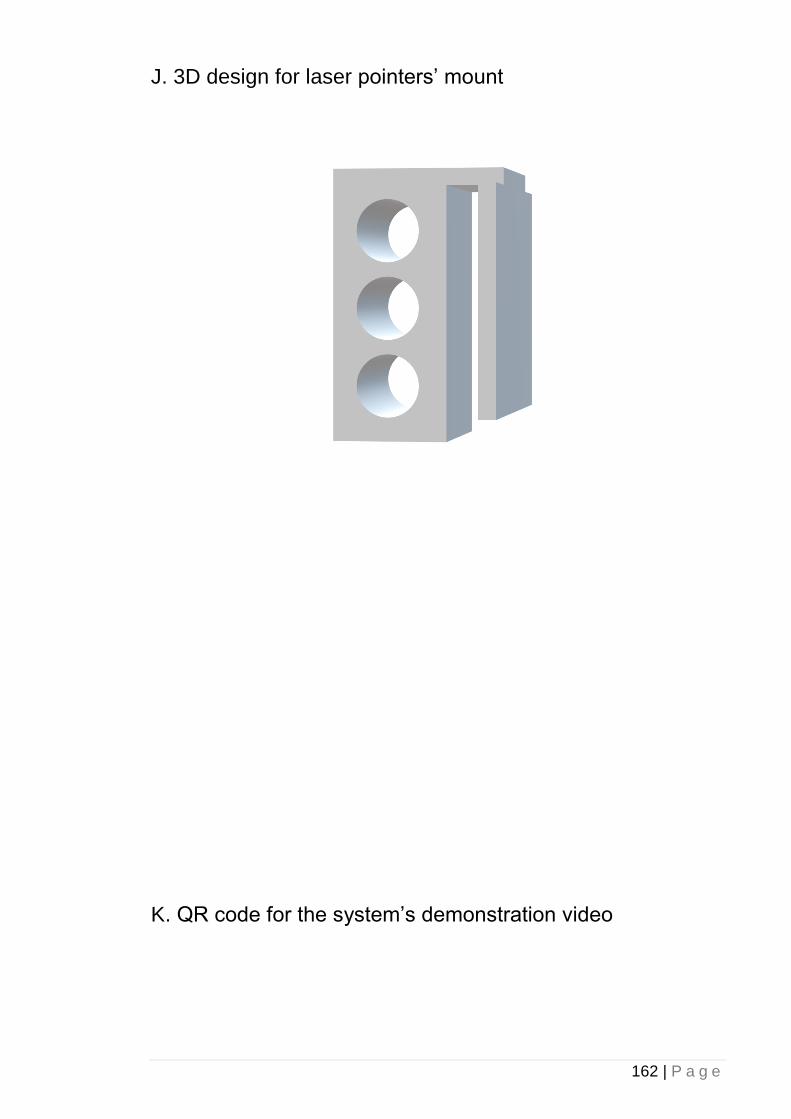
162 | P a g e
J. 3D design for laser pointers’ mount
K. QR code for the system’s demonstration video
163 | P a g e
https://tinyurl.com/kinect4pwp