Embed Size (px)
Citation preview
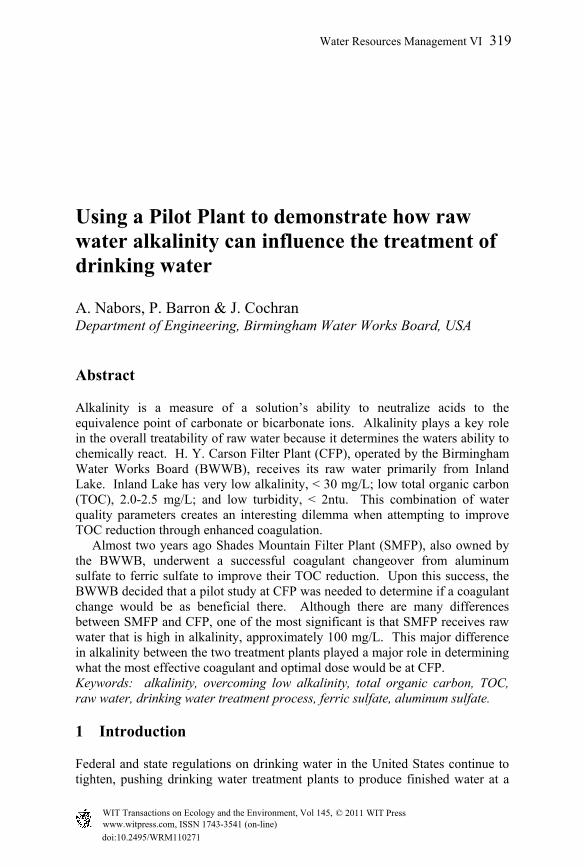
Using a Pilot Plant to demonstrate how raw water alkalinity can influence the treatment of drinking water
A. Nabors, P. Barron & J. Cochran Department of Engineering, Birmingham Water Works Board, USA
Abstract
Alkalinity is a measure of a solution’s ability to neutralize acids to the equivalence point of carbonate or bicarbonate ions. Alkalinity plays a key role in the overall treatability of raw water because it determines the waters ability to chemically react. H. Y. Carson Filter Plant (CFP), operated by the Birmingham Water Works Board (BWWB), receives its raw water primarily from Inland Lake. Inland Lake has very low alkalinity, < 30 mg/L; low total organic carbon (TOC), 2.0-2.5 mg/L; and low turbidity, < 2ntu. This combination of water quality parameters creates an interesting dilemma when attempting to improve TOC reduction through enhanced coagulation. Almost two years ago Shades Mountain Filter Plant (SMFP), also owned by the BWWB, underwent a successful coagulant changeover from aluminum sulfate to ferric sulfate to improve their TOC reduction. Upon this success, the BWWB decided that a pilot study at CFP was needed to determine if a coagulant change would be as beneficial there. Although there are many differences between SMFP and CFP, one of the most significant is that SMFP receives raw water that is high in alkalinity, approximately 100 mg/L. This major difference in alkalinity between the two treatment plants played a major role in determining what the most effective coagulant and optimal dose would be at CFP. Keywords: alkalinity, overcoming low alkalinity, total organic carbon, TOC, raw water, drinking water treatment process, ferric sulfate, aluminum sulfate.
1 Introduction
Federal and state regulations on drinking water in the United States continue to tighten, pushing drinking water treatment plants to produce finished water at a
Water Resources Management VI 319
www.witpress.com, ISSN 1743-3541 (on-line) WIT Transactions on Ecology and the Environment, Vol 145, © 2011 WIT Press
doi:10.2495/WRM110271
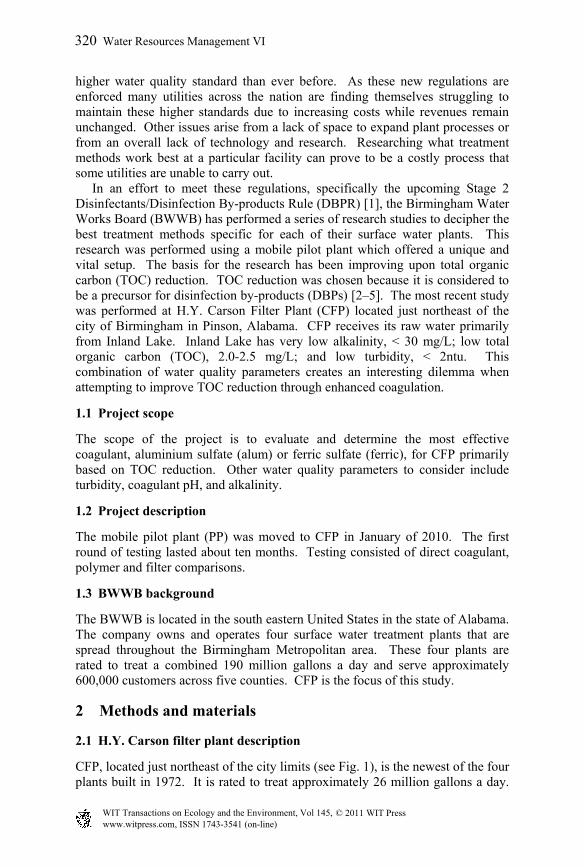
higher water quality standard than ever before. As these new regulations are enforced many utilities across the nation are finding themselves struggling to maintain these higher standards due to increasing costs while revenues remain unchanged. Other issues arise from a lack of space to expand plant processes or from an overall lack of technology and research. Researching what treatment methods work best at a particular facility can prove to be a costly process that some utilities are unable to carry out. In an effort to meet these regulations, specifically the upcoming Stage 2 Disinfectants/Disinfection By-products Rule (DBPR) [1], the Birmingham Water Works Board (BWWB) has performed a series of research studies to decipher the best treatment methods specific for each of their surface water plants. This research was performed using a mobile pilot plant which offered a unique and vital setup. The basis for the research has been improving upon total organic carbon (TOC) reduction. TOC reduction was chosen because it is considered to be a precursor for disinfection by-products (DBPs) [2–5]. The most recent study was performed at H.Y. Carson Filter Plant (CFP) located just northeast of the city of Birmingham in Pinson, Alabama. CFP receives its raw water primarily from Inland Lake. Inland Lake has very low alkalinity, < 30 mg/L; low total organic carbon (TOC), 2.0-2.5 mg/L; and low turbidity, < 2ntu. This combination of water quality parameters creates an interesting dilemma when attempting to improve TOC reduction through enhanced coagulation.
1.1 Project scope
The scope of the project is to evaluate and determine the most effective coagulant, aluminium sulfate (alum) or ferric sulfate (ferric), for CFP primarily based on TOC reduction. Other water quality parameters to consider include turbidity, coagulant pH, and alkalinity.
1.2 Project description
The mobile pilot plant (PP) was moved to CFP in January of 2010. The first round of testing lasted about ten months. Testing consisted of direct coagulant, polymer and filter comparisons.
1.3 BWWB background
The BWWB is located in the south eastern United States in the state of Alabama. The company owns and operates four surface water treatment plants that are spread throughout the Birmingham Metropolitan area. These four plants are rated to treat a combined 190 million gallons a day and serve approximately 600,000 customers across five counties. CFP is the focus of this study.
2 Methods and materials
2.1 H.Y. Carson filter plant description
CFP, located just northeast of the city limits (see Fig. 1), is the newest of the four plants built in 1972. It is rated to treat approximately 26 million gallons a day.
320 Water Resources Management VI
www.witpress.com, ISSN 1743-3541 (on-line) WIT Transactions on Ecology and the Environment, Vol 145, © 2011 WIT Press
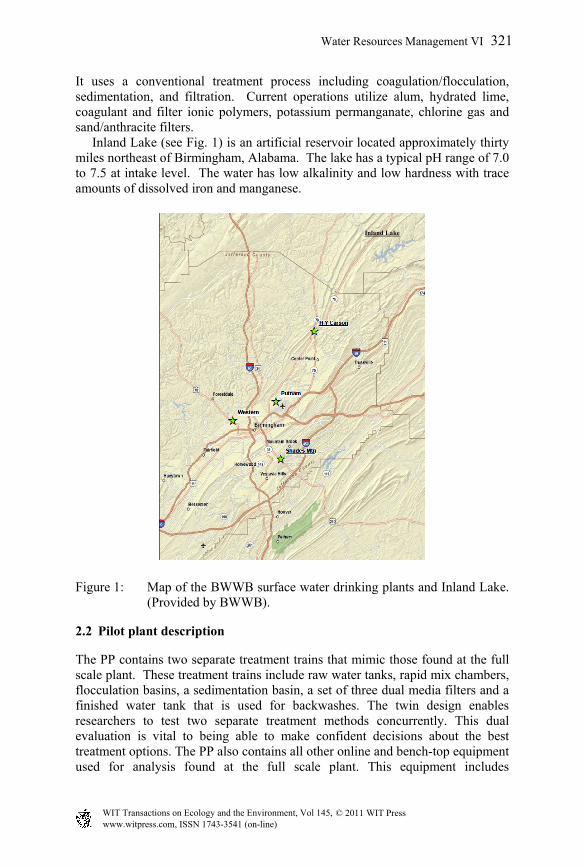
It uses a conventional treatment process including coagulation/flocculation, sedimentation, and filtration. Current operations utilize alum, hydrated lime, coagulant and filter ionic polymers, potassium permanganate, chlorine gas and sand/anthracite filters. Inland Lake (see Fig. 1) is an artificial reservoir located approximately thirty miles northeast of Birmingham, Alabama. The lake has a typical pH range of 7.0 to 7.5 at intake level. The water has low alkalinity and low hardness with trace amounts of dissolved iron and manganese.
Figure 1: Map of the BWWB surface water drinking plants and Inland Lake. (Provided by BWWB).
2.2 Pilot plant description
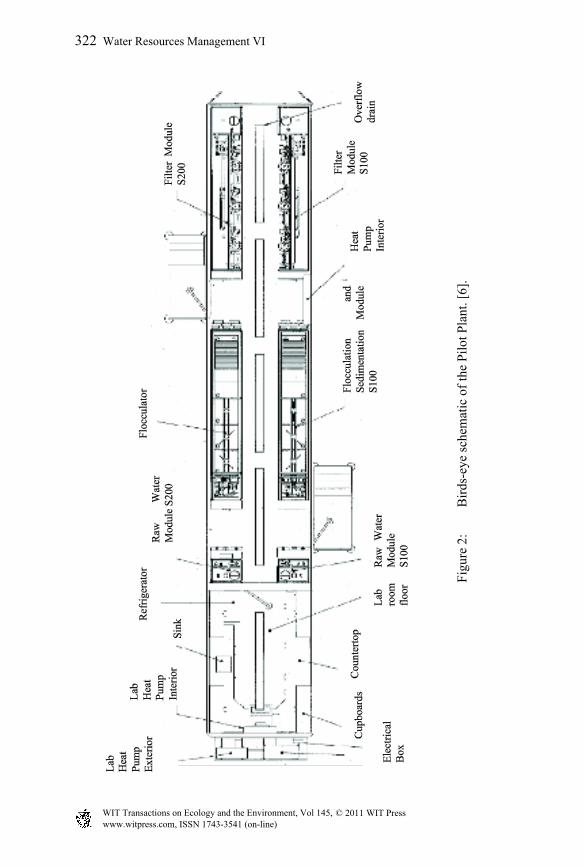
The PP contains two separate treatment trains that mimic those found at the full scale plant. These treatment trains include raw water tanks, rapid mix chambers, flocculation basins, a sedimentation basin, a set of three dual media filters and a finished water tank that is used for backwashes. The twin design enables researchers to test two separate treatment methods concurrently. This dual evaluation is vital to being able to make confident decisions about the best treatment options. The PP also contains all other online and bench-top equipment used for analysis found at the full scale plant. This equipment includes
Inland Lake
Water Resources Management VI 321
www.witpress.com, ISSN 1743-3541 (on-line) WIT Transactions on Ecology and the Environment, Vol 145, © 2011 WIT Press
Fig
ure
2:
Bir
ds-e
ye s
chem
atic
of
the
Pilo
t Pla
nt. [
6].
322 Water Resources Management VI
www.witpress.com, ISSN 1743-3541 (on-line) WIT Transactions on Ecology and the Environment, Vol 145, © 2011 WIT Press
turbidimeters, pH and temperature meters, streaming current monitors, particle counters, conductivity meters, TOC analyzers and spectrophotometers.
2.3 Sample procedures
Meticulous measures are taken to ensure that every step of the process at CFP is mimicked in the PP to the best of its physical ability. The raw water supplied to the PP is coming directly off the same line as the plants. The PP also has built-in overflows so that the raw water is always the same as raw water to CFP. Rapid mix and sedimentation basin detention times are calculated so that the flow rates will match. All chemicals that are fed full scale are fed at the same mg/L dose in the PP. And lastly, all filters in the PP are set up to match media depths, run times, and backwashes. This intense matching process provides confidence in the results obtained through the pilot testing. Online equipment continuously records data and daily grab samples are pulled for verification.
3 Results and discussion
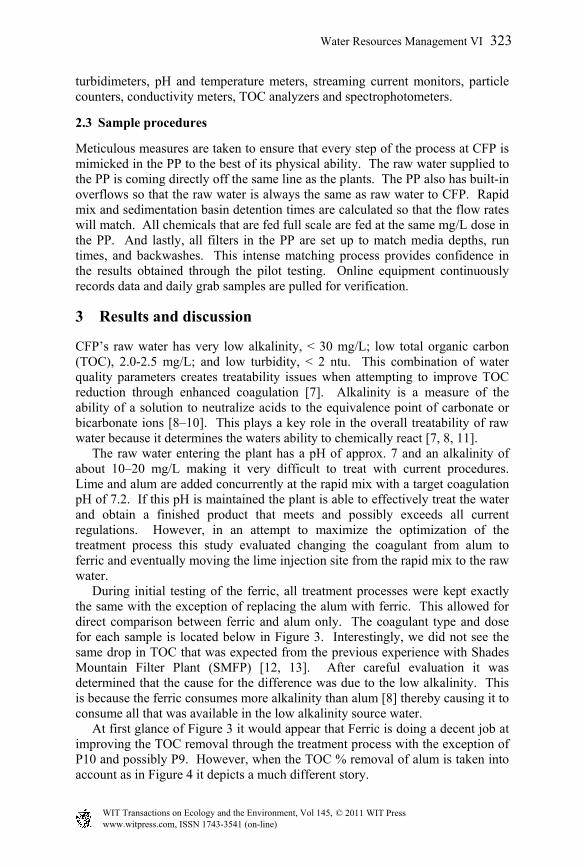
CFP’s raw water has very low alkalinity, < 30 mg/L; low total organic carbon (TOC), 2.0-2.5 mg/L; and low turbidity, < 2 ntu. This combination of water quality parameters creates treatability issues when attempting to improve TOC reduction through enhanced coagulation [7]. Alkalinity is a measure of the ability of a solution to neutralize acids to the equivalence point of carbonate or bicarbonate ions [8–10]. This plays a key role in the overall treatability of raw water because it determines the waters ability to chemically react [7, 8, 11]. The raw water entering the plant has a pH of approx. 7 and an alkalinity of about 10–20 mg/L making it very difficult to treat with current procedures. Lime and alum are added concurrently at the rapid mix with a target coagulation pH of 7.2. If this pH is maintained the plant is able to effectively treat the water and obtain a finished product that meets and possibly exceeds all current regulations. However, in an attempt to maximize the optimization of the treatment process this study evaluated changing the coagulant from alum to ferric and eventually moving the lime injection site from the rapid mix to the raw water. During initial testing of the ferric, all treatment processes were kept exactly the same with the exception of replacing the alum with ferric. This allowed for direct comparison between ferric and alum only. The coagulant type and dose for each sample is located below in Figure 3. Interestingly, we did not see the same drop in TOC that was expected from the previous experience with Shades Mountain Filter Plant (SMFP) [12, 13]. After careful evaluation it was determined that the cause for the difference was due to the low alkalinity. This is because the ferric consumes more alkalinity than alum [8] thereby causing it to consume all that was available in the low alkalinity source water. At first glance of Figure 3 it would appear that Ferric is doing a decent job at improving the TOC removal through the treatment process with the exception of P10 and possibly P9. However, when the TOC % removal of alum is taken into account as in Figure 4 it depicts a much different story.
Water Resources Management VI 323
www.witpress.com, ISSN 1743-3541 (on-line) WIT Transactions on Ecology and the Environment, Vol 145, © 2011 WIT Press
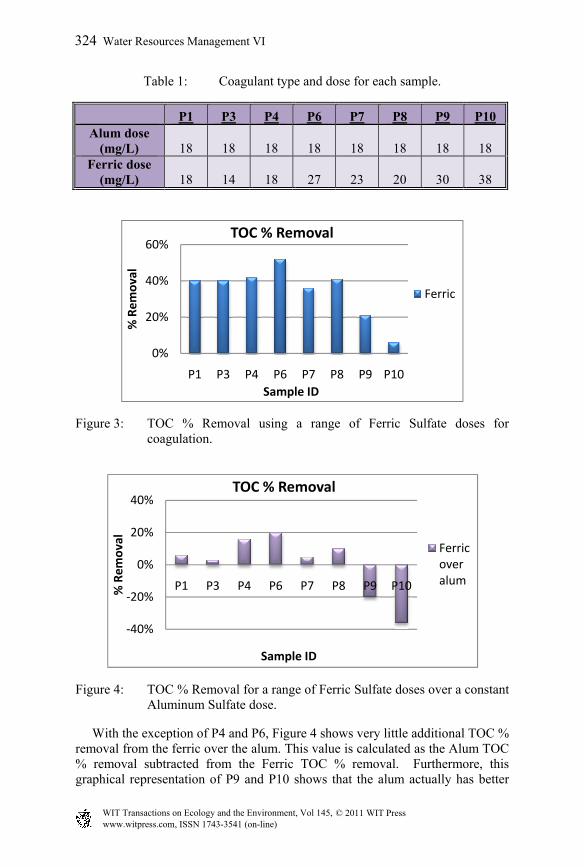
Table 1: Coagulant type and dose for each sample.
P1 P3 P4 P6 P7 P8 P9 P10 Alum dose
(mg/L) 18 18 18 18 18 18 18 18 Ferric dose
(mg/L) 18 14 18 27 23 20 30 38
Figure 3: TOC % Removal using a range of Ferric Sulfate doses for coagulation.
Figure 4: TOC % Removal for a range of Ferric Sulfate doses over a constant Aluminum Sulfate dose.
With the exception of P4 and P6, Figure 4 shows very little additional TOC % removal from the ferric over the alum. This value is calculated as the Alum TOC % removal subtracted from the Ferric TOC % removal. Furthermore, this graphical representation of P9 and P10 shows that the alum actually has better
0%
20%
40%
60%
P1 P3 P4 P6 P7 P8 P9 P10
% Removal
Sample ID
TOC % Removal
Ferric
‐40%
‐20%
0%
20%
40%
P1 P3 P4 P6 P7 P8 P9 P10% Removal
Sample ID
TOC % Removal
Ferric over alum
324 Water Resources Management VI
www.witpress.com, ISSN 1743-3541 (on-line) WIT Transactions on Ecology and the Environment, Vol 145, © 2011 WIT Press
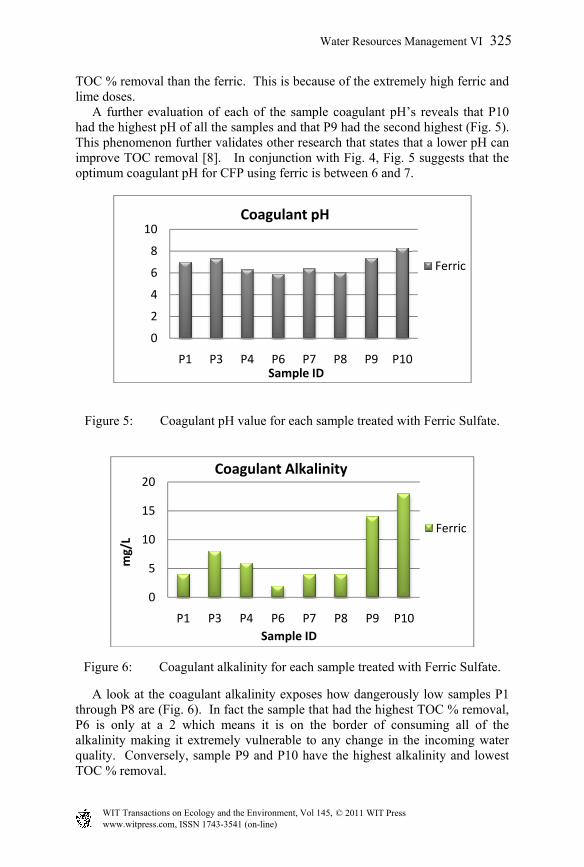
TOC % removal than the ferric. This is because of the extremely high ferric and lime doses. A further evaluation of each of the sample coagulant pH’s reveals that P10 had the highest pH of all the samples and that P9 had the second highest (Fig. 5). This phenomenon further validates other research that states that a lower pH can improve TOC removal [8]. In conjunction with Fig. 4, Fig. 5 suggests that the optimum coagulant pH for CFP using ferric is between 6 and 7.
Figure 5: Coagulant pH value for each sample treated with Ferric Sulfate.
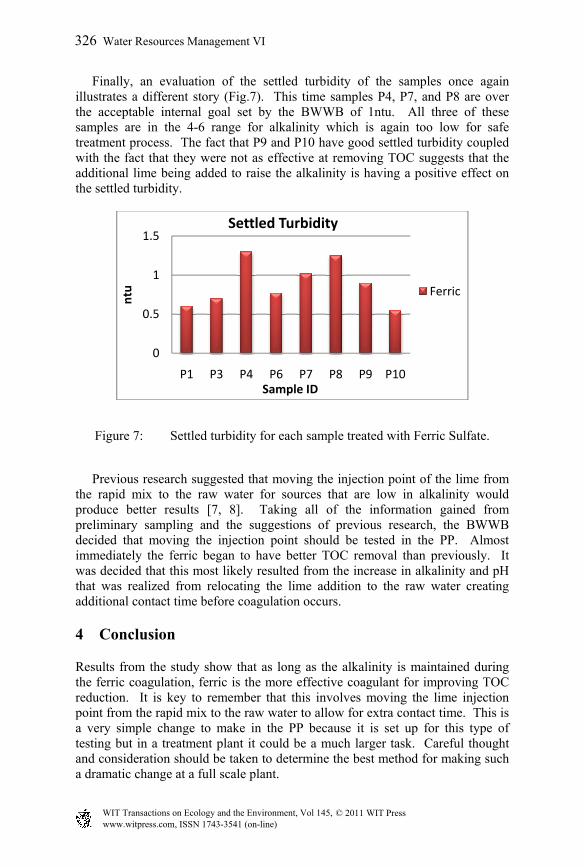
Figure 6: Coagulant alkalinity for each sample treated with Ferric Sulfate.
A look at the coagulant alkalinity exposes how dangerously low samples P1 through P8 are (Fig. 6). In fact the sample that had the highest TOC % removal, P6 is only at a 2 which means it is on the border of consuming all of the alkalinity making it extremely vulnerable to any change in the incoming water quality. Conversely, sample P9 and P10 have the highest alkalinity and lowest TOC % removal.
0
2
4
6
8
10
P1 P3 P4 P6 P7 P8 P9 P10Sample ID
Coagulant pH
Ferric
0
5
10
15
20
P1 P3 P4 P6 P7 P8 P9 P10
mg/L
Sample ID
Coagulant Alkalinity
Ferric
Water Resources Management VI 325
www.witpress.com, ISSN 1743-3541 (on-line) WIT Transactions on Ecology and the Environment, Vol 145, © 2011 WIT Press
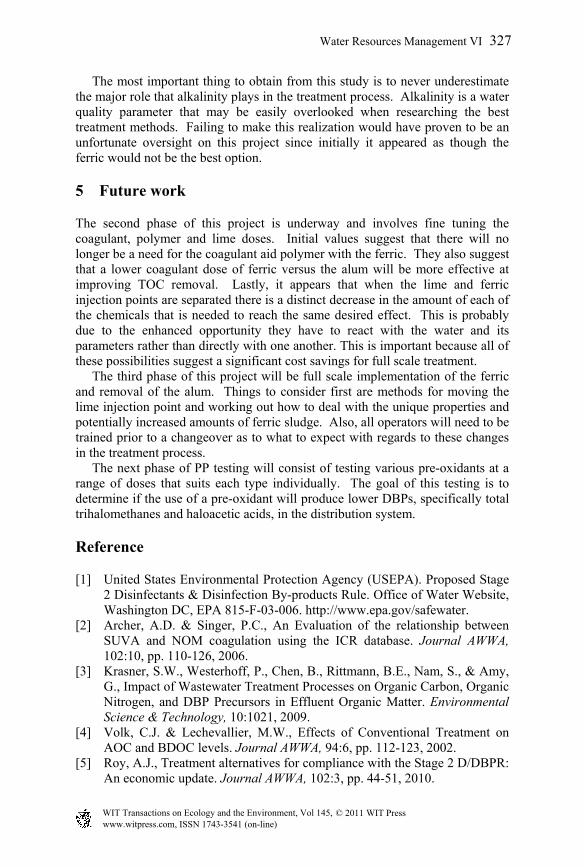
Finally, an evaluation of the settled turbidity of the samples once again illustrates a different story (Fig.7). This time samples P4, P7, and P8 are over the acceptable internal goal set by the BWWB of 1ntu. All three of these samples are in the 4-6 range for alkalinity which is again too low for safe treatment process. The fact that P9 and P10 have good settled turbidity coupled with the fact that they were not as effective at removing TOC suggests that the additional lime being added to raise the alkalinity is having a positive effect on the settled turbidity.
Figure 7: Settled turbidity for each sample treated with Ferric Sulfate.
Previous research suggested that moving the injection point of the lime from the rapid mix to the raw water for sources that are low in alkalinity would produce better results [7, 8]. Taking all of the information gained from preliminary sampling and the suggestions of previous research, the BWWB decided that moving the injection point should be tested in the PP. Almost immediately the ferric began to have better TOC removal than previously. It was decided that this most likely resulted from the increase in alkalinity and pH that was realized from relocating the lime addition to the raw water creating additional contact time before coagulation occurs.
4 Conclusion
Results from the study show that as long as the alkalinity is maintained during the ferric coagulation, ferric is the more effective coagulant for improving TOC reduction. It is key to remember that this involves moving the lime injection point from the rapid mix to the raw water to allow for extra contact time. This is a very simple change to make in the PP because it is set up for this type of testing but in a treatment plant it could be a much larger task. Careful thought and consideration should be taken to determine the best method for making such a dramatic change at a full scale plant.
0
0.5
1
1.5
P1 P3 P4 P6 P7 P8 P9 P10
ntu
Sample ID
Settled Turbidity
Ferric
326 Water Resources Management VI
www.witpress.com, ISSN 1743-3541 (on-line) WIT Transactions on Ecology and the Environment, Vol 145, © 2011 WIT Press
The most important thing to obtain from this study is to never underestimate the major role that alkalinity plays in the treatment process. Alkalinity is a water quality parameter that may be easily overlooked when researching the best treatment methods. Failing to make this realization would have proven to be an unfortunate oversight on this project since initially it appeared as though the ferric would not be the best option.
5 Future work
The second phase of this project is underway and involves fine tuning the coagulant, polymer and lime doses. Initial values suggest that there will no longer be a need for the coagulant aid polymer with the ferric. They also suggest that a lower coagulant dose of ferric versus the alum will be more effective at improving TOC removal. Lastly, it appears that when the lime and ferric injection points are separated there is a distinct decrease in the amount of each of the chemicals that is needed to reach the same desired effect. This is probably due to the enhanced opportunity they have to react with the water and its parameters rather than directly with one another. This is important because all of these possibilities suggest a significant cost savings for full scale treatment. The third phase of this project will be full scale implementation of the ferric and removal of the alum. Things to consider first are methods for moving the lime injection point and working out how to deal with the unique properties and potentially increased amounts of ferric sludge. Also, all operators will need to be trained prior to a changeover as to what to expect with regards to these changes in the treatment process. The next phase of PP testing will consist of testing various pre-oxidants at a range of doses that suits each type individually. The goal of this testing is to determine if the use of a pre-oxidant will produce lower DBPs, specifically total trihalomethanes and haloacetic acids, in the distribution system.
Reference
[1] United States Environmental Protection Agency (USEPA). Proposed Stage 2 Disinfectants & Disinfection By-products Rule. Office of Water Website, Washington DC, EPA 815-F-03-006. http://www.epa.gov/safewater.
[2] Archer, A.D. & Singer, P.C., An Evaluation of the relationship between SUVA and NOM coagulation using the ICR database. Journal AWWA, 102:10, pp. 110-126, 2006.
[3] Krasner, S.W., Westerhoff, P., Chen, B., Rittmann, B.E., Nam, S., & Amy, G., Impact of Wastewater Treatment Processes on Organic Carbon, Organic Nitrogen, and DBP Precursors in Effluent Organic Matter. Environmental Science & Technology, 10:1021, 2009.
[4] Volk, C.J. & Lechevallier, M.W., Effects of Conventional Treatment on AOC and BDOC levels. Journal AWWA, 94:6, pp. 112-123, 2002.
[5] Roy, A.J., Treatment alternatives for compliance with the Stage 2 D/DBPR: An economic update. Journal AWWA, 102:3, pp. 44-51, 2010.
Water Resources Management VI 327
www.witpress.com, ISSN 1743-3541 (on-line) WIT Transactions on Ecology and the Environment, Vol 145, © 2011 WIT Press
[6] Cochran, J., Evaluation of Pre and Post Treatment Filtration Performance of Kinetico Macrolite Ceramic Media Compared to Traditional Sand/Anthracite and GAC Filters in Drinking Water Treatment Process. Dissertation-University of Alabama at Birmingham: Alabama, pp. 21-23, 2008.
[7] Tseng, T., Segal, B.D., & Edwards, M., Increasing alkalinity to reduce turbidity. Journal AWWA, 92:6, pp. 44-54, 2000.
[8] Hart, V., Crowley, T. & Samandi, S., Expensive Problem, Inexpensive Solution: Boost Alkalinity With Carbon Dioxide and Lime. AWWA Opflow, pp. 22-25, 2009.
[9] Snoeyink, V.L., & Jenkins, D. as cited by Najm, I. [5], Water Chemistry. John Wiley & Sons: New York, 1980.
[10] Stumm, W. & Morgan, J.J. as cited by Najm, I. [], Aquatic Chemistry. An Introduction Emphasizing Chemical Equilibria in Natural Waters. (Second Ed.) John Wiley & Sons: New York, 1981.
[11] Najm, I., User-friendly Carbonate Chemistry Charts. Journal AWWA, 93:11, pp. 86-93, 2001.
[12] Cochran, J., Barron, P., Cox, W., Nabors, A., Core, I., & Roberson, D., Coagulant Changeover: Overcoming the Trials and Tribulations. Proc. Of the 2009 AWWA Water Quality and Technology Conf. Seattle: Washington, 2009.
[13] Cochran, J, Barron, P, & Nabors, A., Evaluating Changing the Primary Coagulant for a Drinking Water Filter Plant through the use of a Mobile Pilot Plant and Determining the Correct Changeover Protocol. Proc of the 2010 AIChE Spring Meeting & 6th Global Congress on Process Safety. San Antonio: Texas, 2010.
328 Water Resources Management VI
www.witpress.com, ISSN 1743-3541 (on-line) WIT Transactions on Ecology and the Environment, Vol 145, © 2011 WIT Press