Embed Size (px)
Citation preview
Using American Community Survey Summary File Data Webinar
Transcript
January 25, 2017
Gretchen Gooding
American Community Survey Office
This presentation was presented as a webinar to the general public on January 25, 2017 by
Gretchen Gooding of the U.S. Census Bureau’s American Community Survey Office. A link to
the recording is available at
https://census.webex.com/census/lsr.php?RCID=e529fb8e44e0ce309cc24b545d53887c
The transcript of the webinar follows. Slide references and links have been added to the spoken
text as appropriate.
Man: Welcome and thank you for standing by.
At this time all participants are in a listen-only mode until the question and
answer session of today's conference. At that time you may hit star one on
your touch tone phone to ask a question. I would also like to inform all
parties that today's conference is being recorded. If you have any objections
you may disconnect at this time.
I would now like to turn the conference over to Ms. Gretchen Gooding.
Thank you, ma'am, you may begin.
Slide 1: Title Slide
Gretchen Gooding: All right, thank you. Before I get started I just wanted to let everyone know
that we did post the slides for today's presentation on our website. You can
see the URL at the bottom of the screen. That program surveys ACS forward
slash news forward slash events in the Summary File. So if you'd like to
follow along by downloading or printing the slides then you can do that. I
think - I received comments last year that people would find that helpful.
So go ahead and do that and then also after we're done we'll be - post the
recording, the slides, and the transcript from today's presentation on our
website (https://www.census.gov/programs-surveys/acs/guidance/training-
presentations.html). You can also access that later. Hopefully you don't
worry about frantically writing down the all URLs that you see.
So as we mentioned this is the Using American Community Survey Summary
File Data webinar and I'm Gretchen Gooding and I'm from the American
Community Survey Office here at the Census Bureau.
Slide 2: Outline So to talk about - what we're going to talk about today first I'll discuss some
basics of the ACS -- including content, availability of data products and
geographies -- and then I'm going to show you an option called the American
FactFinder Download Center.
I suspect that many of you are on the call today because you're probably
looking for lots of data probably at smaller geographies, and I just want to
show you one option that's kind of a good - a good option to get that data
before going into the Summary File. And then if that's not what you're
looking for I will kind of delve into what is the ACS Summary File and talk
about different ways to access it -- including the retrieval tool, DataFerrett, the
API, the FTP site, the TIGER/Line Shapefiles -- and then I'm going to wrap
up and I'll take questions at the end.
Slide 3: ACS Basics So the ACS. I suspect many of you are familiar with our survey if you're here
for this conference call or here for this presentation. It's an ongoing survey
that's sent to three and half million addresses per year, and it produces the
detailed population and housing estimates. And we also visit group quarter
facilities.
It's designed to produce the critical information on small areas and I'm going
to talk about what some of those small geographies are -- like tracts and block
groups -- in a minute. And also small population groups that were previously
collected on the decennial long form.
So in the past we would have kind of a large update every 10 years of what's
happening in the country, and now with the ACS we're doing this every year.
And now the decennial census is a just short form and the ACS is collecting
detailed information. We cover 35 topics and I'm going to show you more of
what those are. And then we support over 300 known federal uses and also
many, many non-federal uses.
We have two big data releases each year. The one-year estimate based on 12
months of data and the five-year estimates based on 60 months of data. And
I'll also go over that a little bit more in a future slide.
Slide 4: ACS Content So our content, we largely group into four categories -- social, economic,
housing, and demographic. And as an example, today we just released a
report Veterans in Rural America
(https://www.census.gov/library/publications/2017/acs/acs-36.html), so that's
a social characteristic. We collect information about the veteran population
and then -- just as kind of an example for today -- that report covers the
demographic information you see here like age, sex, Hispanic origin, race,
relationship. And then also we're able to kind of cross that by economic
characteristics. Particularly in this report, we're looking at employment,
industry, and occupation what not. And then it also even looked at housing
characteristics like computer and internet use.
And so you've got - you have all this different content that's coming from the
American Community Survey. So that's kind of a snapshot of what we have.
We have over 35 topics, over 1000 tables, and billions and billions of
estimates.
Slide 5: Selected Census Geographic Concepts So what we - I like to say is what puts the community in the American
Community Survey is geography. So our information is definitely interesting
at the national level, but what most people find is that they like to see it for
their community, you know, whether that's something small -- like a tract or
block group, or maybe it's a congressional district, a school district, their city -
- you know, the ACS is often the only source of information for these smaller
geographies.
So you can see on here we have some of the geographies for which ACS data
are produced and the relationship between them. So those lower geographic
areas fit neatly within the larger areas that are connected with the lines. You
can see that block groups nest into tracts, tracts into counties, whatnot. And
again I suspect most of you are looking for that smaller data.
So as a reminder, the Census tracts are divisions of counties and they have an
optimal size of 4000 people or 1600 housing units. And then our smallest
level of geography in the ACS are block groups -- and they're divisions of
tracts -- and they have anywhere between 600 and 3000 people and between
240 to 1200 housing units.
Slide 6: Availability of ACS Data Products
And then the ACS -- I kind of alluded to earlier -- we release information
every year. And so we release it a year after the data is collected and so
generally in September we'll release the one-year estimates, those are for areas
of 65,000 or more. So we plan in this September to release the 2016 ACS
one-year estimate, so that's based on data collected from January to December
of 2016.
And then we have a new product I want to make sure people are aware of
called the one-year supplemental estimates. So it just came out last year for
the first time. And these are a smaller set of Detailed Tables that are available
for geographic areas for of 20,000 or more and they're just simplified versions
of some of our popular tables. So not as much detail as what you would get in
the full one-year or five-year release but they hit on some of the key topics
that people are looking for. And so we plan to release those 2016
supplemental estimates in October.
And then the five-year data set -- five-year estimates -- goes all the way down
to our small geographies, tracts, and block groups and those will come out in
December -- so that'll be the the 2012 to 2016 five-year estimates coming out
in December -- and so if you're looking again for tracts and block groups
you're only going to find them in the five-year estimates.
Slide 7: Outline
Slide 8: AFF Download Center
And now I want to talk about an option for you called the American
FactFinder Download Center and this is a great way to get - it's a lot of tables
for smaller geographies. So if you don't want to go into the Summary File --
maybe you're a new user -- I just want to make you aware of this option and
then we'll go into the Summary File itself.
So the Download Center is available at factfinder.census.gov
(https://factfinder.census.gov/faces/nav/jsf/pages/download_center.xhtml) and
you'll see in that kind of blue ribbon at the top of the page that Download
Center is highlighted there in gold next to Advance Search and it's very easy
it's a guided search.
So you're going to say I know the data center table that I want to download
and click next.
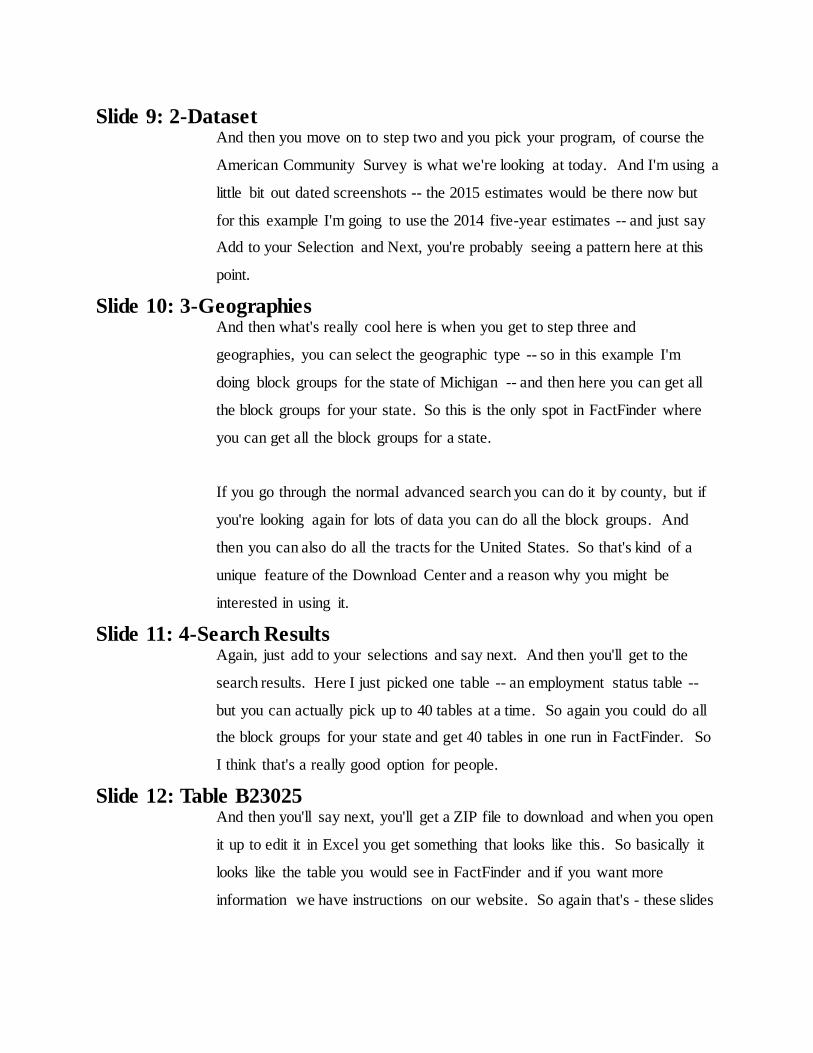
Slide 9: 2-Dataset And then you move on to step two and you pick your program, of course the
American Community Survey is what we're looking at today. And I'm using a
little bit out dated screenshots -- the 2015 estimates would be there now but
for this example I'm going to use the 2014 five-year estimates -- and just say
Add to your Selection and Next, you're probably seeing a pattern here at this
point.
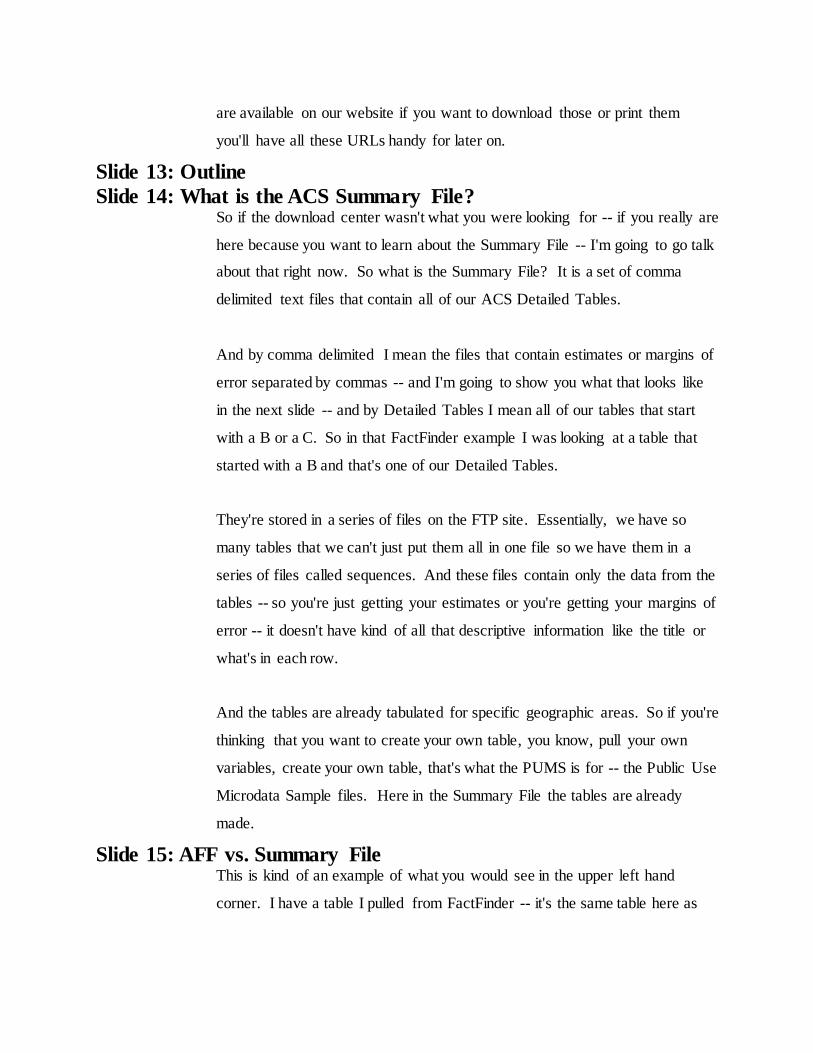
Slide 10: 3-Geographies And then what's really cool here is when you get to step three and
geographies, you can select the geographic type -- so in this example I'm
doing block groups for the state of Michigan -- and then here you can get all
the block groups for your state. So this is the only spot in FactFinder where
you can get all the block groups for a state.
If you go through the normal advanced search you can do it by county, but if
you're looking again for lots of data you can do all the block groups. And
then you can also do all the tracts for the United States. So that's kind of a
unique feature of the Download Center and a reason why you might be
interested in using it.
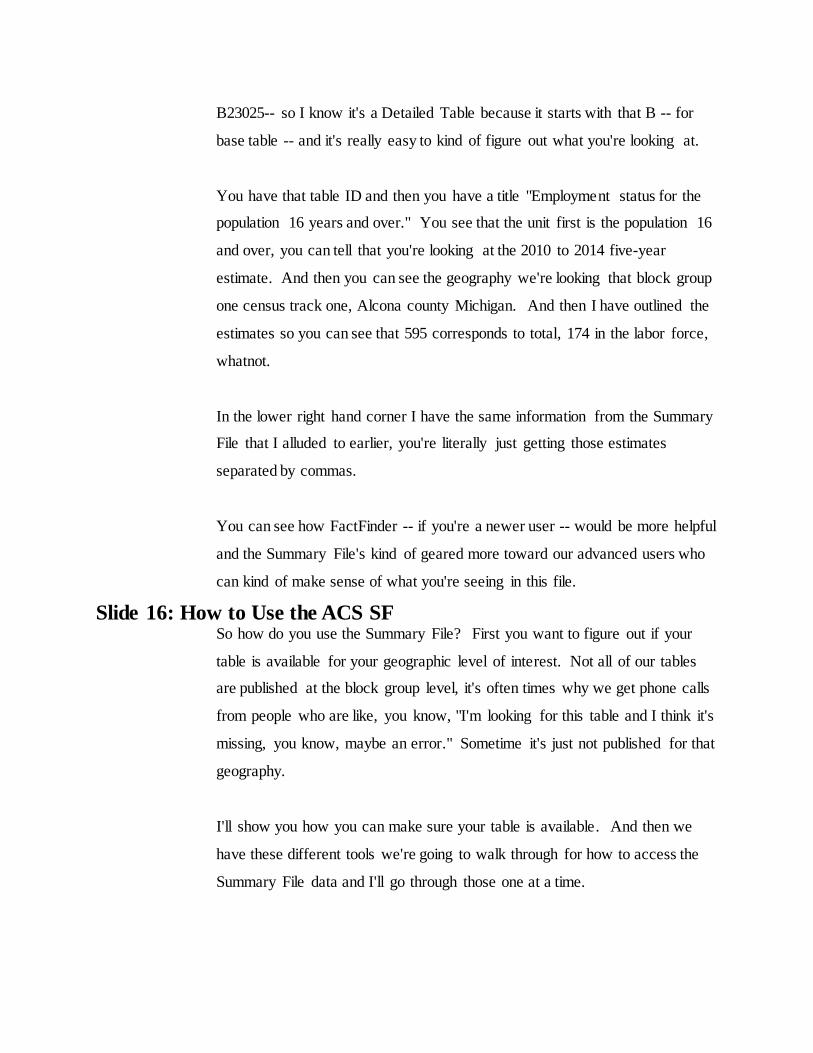
Slide 11: 4-Search Results Again, just add to your selections and say next. And then you'll get to the
search results. Here I just picked one table -- an employment status table --
but you can actually pick up to 40 tables at a time. So again you could do all
the block groups for your state and get 40 tables in one run in FactFinder. So
I think that's a really good option for people.
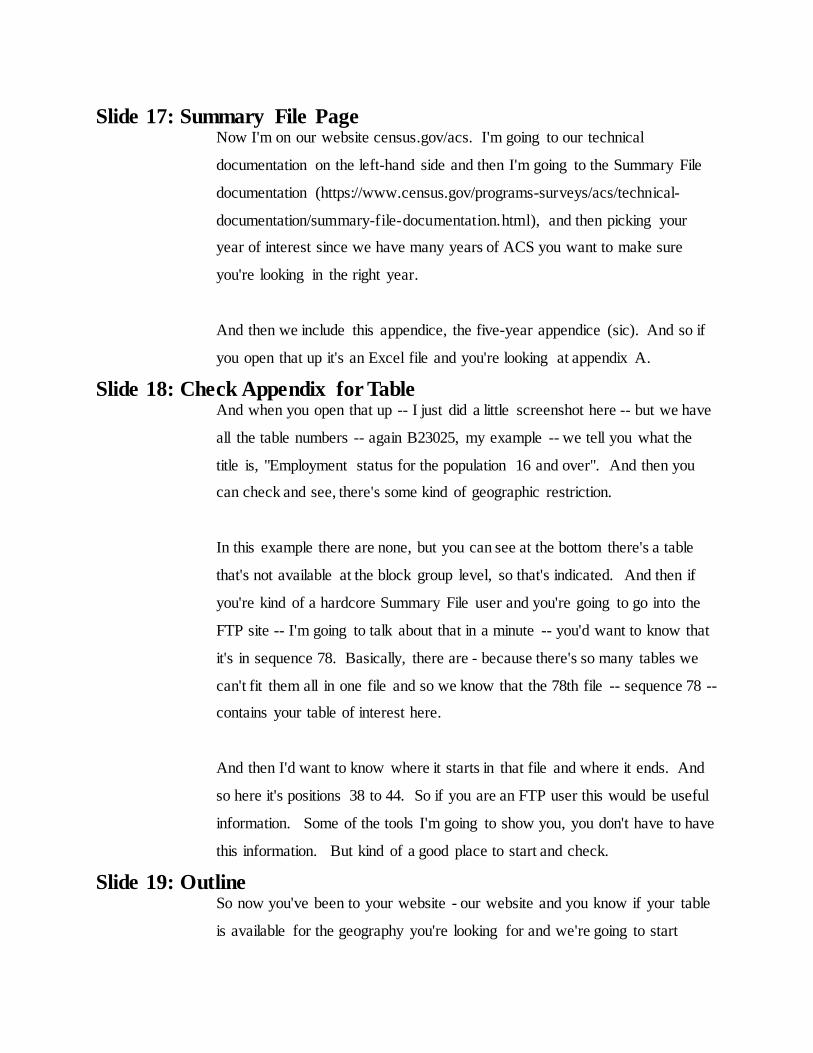
Slide 12: Table B23025 And then you'll say next, you'll get a ZIP file to download and when you open
it up to edit it in Excel you get something that looks like this. So basically it
looks like the table you would see in FactFinder and if you want more
information we have instructions on our website. So again that's - these slides
are available on our website if you want to download those or print them
you'll have all these URLs handy for later on.
Slide 13: Outline
Slide 14: What is the ACS Summary File? So if the download center wasn't what you were looking for -- if you really are
here because you want to learn about the Summary File -- I'm going to go talk
about that right now. So what is the Summary File? It is a set of comma
delimited text files that contain all of our ACS Detailed Tables.
And by comma delimited I mean the files that contain estimates or margins of
error separated by commas -- and I'm going to show you what that looks like
in the next slide -- and by Detailed Tables I mean all of our tables that start
with a B or a C. So in that FactFinder example I was looking at a table that
started with a B and that's one of our Detailed Tables.
They're stored in a series of files on the FTP site. Essentially, we have so
many tables that we can't just put them all in one file so we have them in a
series of files called sequences. And these files contain only the data from the
tables -- so you're just getting your estimates or you're getting your margins of
error -- it doesn't have kind of all that descriptive information like the title or
what's in each row.
And the tables are already tabulated for specific geographic areas. So if you're
thinking that you want to create your own table, you know, pull your own
variables, create your own table, that's what the PUMS is for -- the Public Use
Microdata Sample files. Here in the Summary File the tables are already
made.
Slide 15: AFF vs. Summary File This is kind of an example of what you would see in the upper left hand
corner. I have a table I pulled from FactFinder -- it's the same table here as
B23025-- so I know it's a Detailed Table because it starts with that B -- for
base table -- and it's really easy to kind of figure out what you're looking at.
You have that table ID and then you have a title "Employment status for the
population 16 years and over." You see that the unit first is the population 16
and over, you can tell that you're looking at the 2010 to 2014 five-year
estimate. And then you can see the geography we're looking that block group
one census track one, Alcona county Michigan. And then I have outlined the
estimates so you can see that 595 corresponds to total, 174 in the labor force,
whatnot.
In the lower right hand corner I have the same information from the Summary
File that I alluded to earlier, you're literally just getting those estimates
separated by commas.
You can see how FactFinder -- if you're a newer user -- would be more helpful
and the Summary File's kind of geared more toward our advanced users who
can kind of make sense of what you're seeing in this file.
Slide 16: How to Use the ACS SF So how do you use the Summary File? First you want to figure out if your
table is available for your geographic level of interest. Not all of our tables
are published at the block group level, it's often times why we get phone calls
from people who are like, you know, "I'm looking for this table and I think it's
missing, you know, maybe an error." Sometime it's just not published for that
geography.
I'll show you how you can make sure your table is available. And then we
have these different tools we're going to walk through for how to access the
Summary File data and I'll go through those one at a time.
Slide 17: Summary File Page Now I'm on our website census.gov/acs. I'm going to our technical
documentation on the left-hand side and then I'm going to the Summary File
documentation (https://www.census.gov/programs-surveys/acs/technical-
documentation/summary-file-documentation.html), and then picking your
year of interest since we have many years of ACS you want to make sure
you're looking in the right year.
And then we include this appendice, the five-year appendice (sic). And so if
you open that up it's an Excel file and you're looking at appendix A.
Slide 18: Check Appendix for Table And when you open that up -- I just did a little screenshot here -- but we have
all the table numbers -- again B23025, my example -- we tell you what the
title is, "Employment status for the population 16 and over". And then you
can check and see, there's some kind of geographic restriction.
In this example there are none, but you can see at the bottom there's a table
that's not available at the block group level, so that's indicated. And then if
you're kind of a hardcore Summary File user and you're going to go into the
FTP site -- I'm going to talk about that in a minute -- you'd want to know that
it's in sequence 78. Basically, there are - because there's so many tables we
can't fit them all in one file and so we know that the 78th file -- sequence 78 --
contains your table of interest here.
And then I'd want to know where it starts in that file and where it ends. And
so here it's positions 38 to 44. So if you are an FTP user this would be useful
information. Some of the tools I'm going to show you, you don't have to have
this information. But kind of a good place to start and check.
Slide 19: Outline So now you've been to your website - our website and you know if your table
is available for the geography you're looking for and we're going to start
walking through some of these tools roughly ordered in ease of use, although
of course depends on your background too.
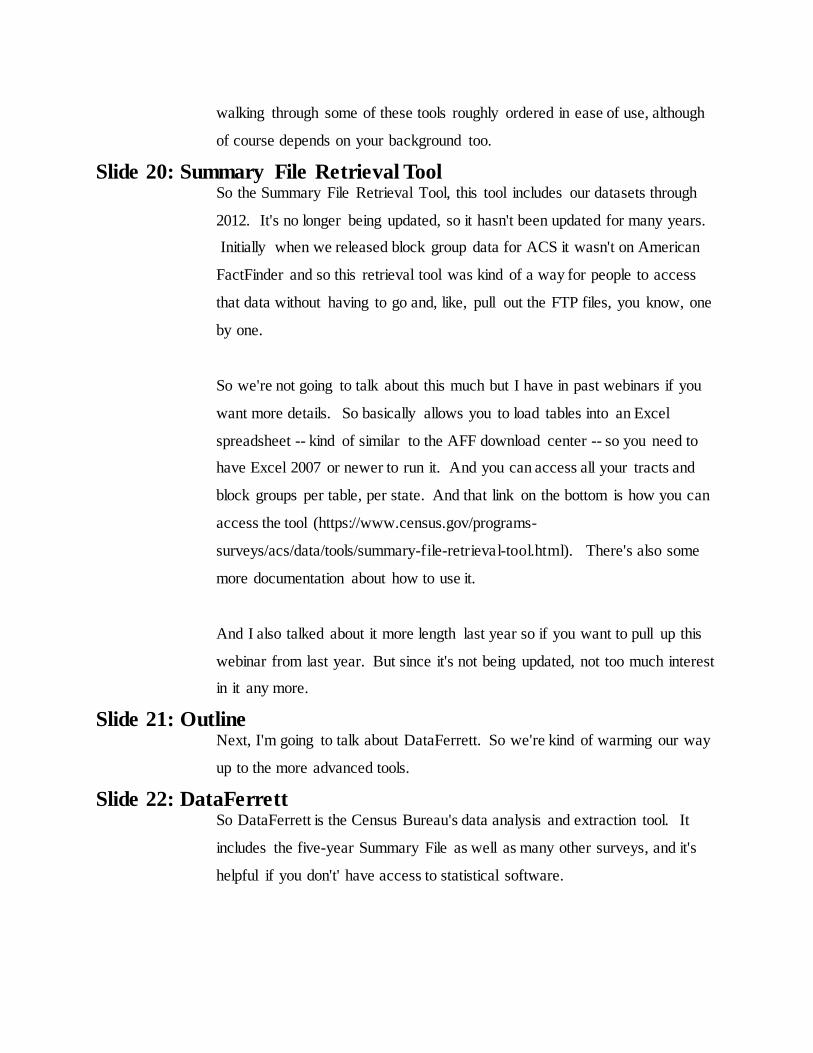
Slide 20: Summary File Retrieval Tool So the Summary File Retrieval Tool, this tool includes our datasets through
2012. It's no longer being updated, so it hasn't been updated for many years.
Initially when we released block group data for ACS it wasn't on American
FactFinder and so this retrieval tool was kind of a way for people to access
that data without having to go and, like, pull out the FTP files, you know, one
by one.
So we're not going to talk about this much but I have in past webinars if you
want more details. So basically allows you to load tables into an Excel
spreadsheet -- kind of similar to the AFF download center -- so you need to
have Excel 2007 or newer to run it. And you can access all your tracts and
block groups per table, per state. And that link on the bottom is how you can
access the tool (https://www.census.gov/programs-
surveys/acs/data/tools/summary-file-retrieval-tool.html). There's also some
more documentation about how to use it.
And I also talked about it more length last year so if you want to pull up this
webinar from last year. But since it's not being updated, not too much interest
in it any more.
Slide 21: Outline Next, I'm going to talk about DataFerrett. So we're kind of warming our way
up to the more advanced tools.
Slide 22: DataFerrett So DataFerrett is the Census Bureau's data analysis and extraction tool. It
includes the five-year Summary File as well as many other surveys, and it's
helpful if you don't' have access to statistical software.
It also includes the ACS PUMS data if you're a PUMS user. So when you get
to dataferrett.census.gov you can click on launch DataFerrett, enter your email
address, and then click Get Data Now (https://dataferrett.census.gov/).
Slide 23: Finding Summary Data So when you get into DataFerrett and you're in step one, on the left hand side
you'll see a number of datasets.
There's more than just the ACS in here -- so you'll collect - you'll click on
search all data sets and then you'll expand the American Community Survey,
summarize data, and then you'll look for your year of interest. I'm being
consistent here and using the 2010 to 2014 and then the five-year Summary
File and when you do that you're going to see all the table IDs.
And these are the same table IDs that you'd see in FactFinder. So again these
B and C tables and once again I'm going to do B23025. And then if you see
on the right side of the page I clicked on that table and I said to add all to data
basket.
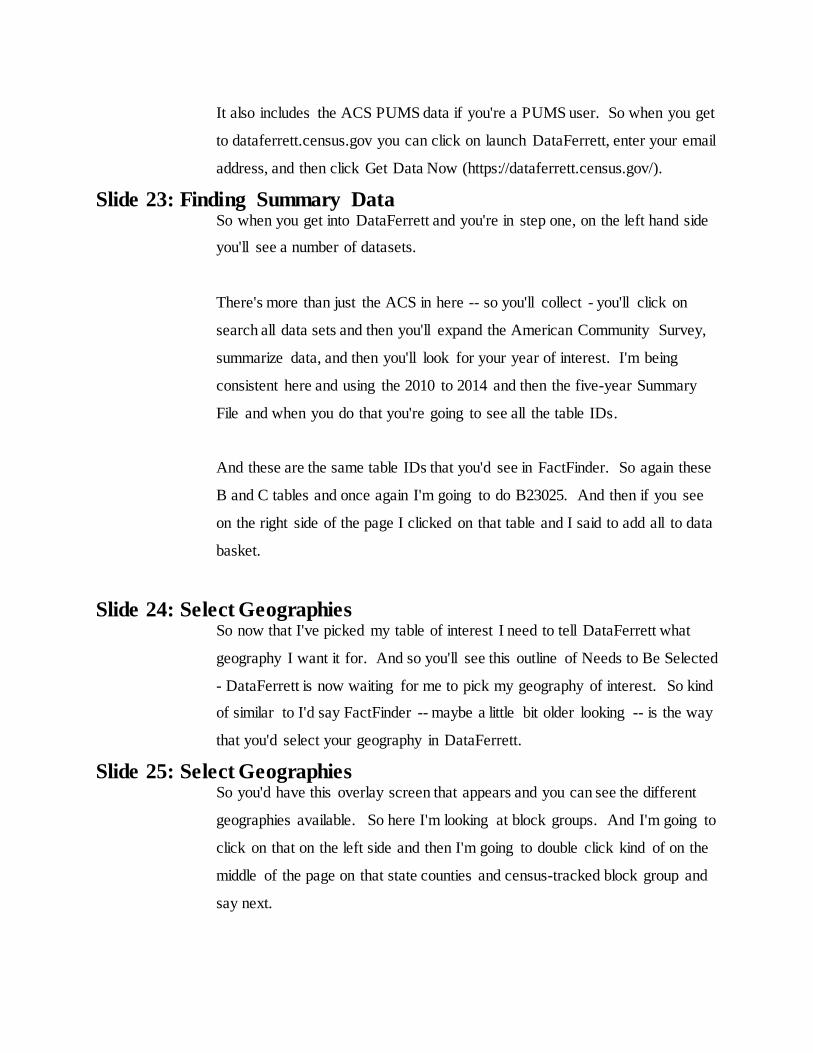
Slide 24: Select Geographies So now that I've picked my table of interest I need to tell DataFerrett what
geography I want it for. And so you'll see this outline of Needs to Be Selected
- DataFerrett is now waiting for me to pick my geography of interest. So kind
of similar to I'd say FactFinder -- maybe a little bit older looking -- is the way
that you'd select your geography in DataFerrett.
Slide 25: Select Geographies So you'd have this overlay screen that appears and you can see the different
geographies available. So here I'm looking at block groups. And I'm going to
click on that on the left side and then I'm going to double click kind of on the
middle of the page on that state counties and census-tracked block group and
say next.
Slide 26: Next Level-State And so now it knows I want block groups. And it's going to say okay well
what state do you want them for? And here I'm picking Michigan, so I'm
either going to drag Michigan from the left box to the middle box or you can
just double click on Michigan. And I'm going to say Next Level so it knows I
want block groups from Michigan.
Slide 27: Next Level-County Now it wants to know what county do I want them for? And here I'm going to
say - I'm going to select all and drag it over and then click next level so I'm
selecting all counties in Michigan. And you can see there's a bit of a
repetitive process here.
Slide 28: Next Level-Census Tract So now I'm at the track - census track level. I'm going to say select all and I'm
going to double click from the left side of the screen and click next level and
then finally we get down to block groups.
Slide 29: Next Level-Block Group So I'm going to click - double click on select all on the left side of the screen
and I'll see all those block groups from Michigan appear on the right side of
the screen and then I'll finish.
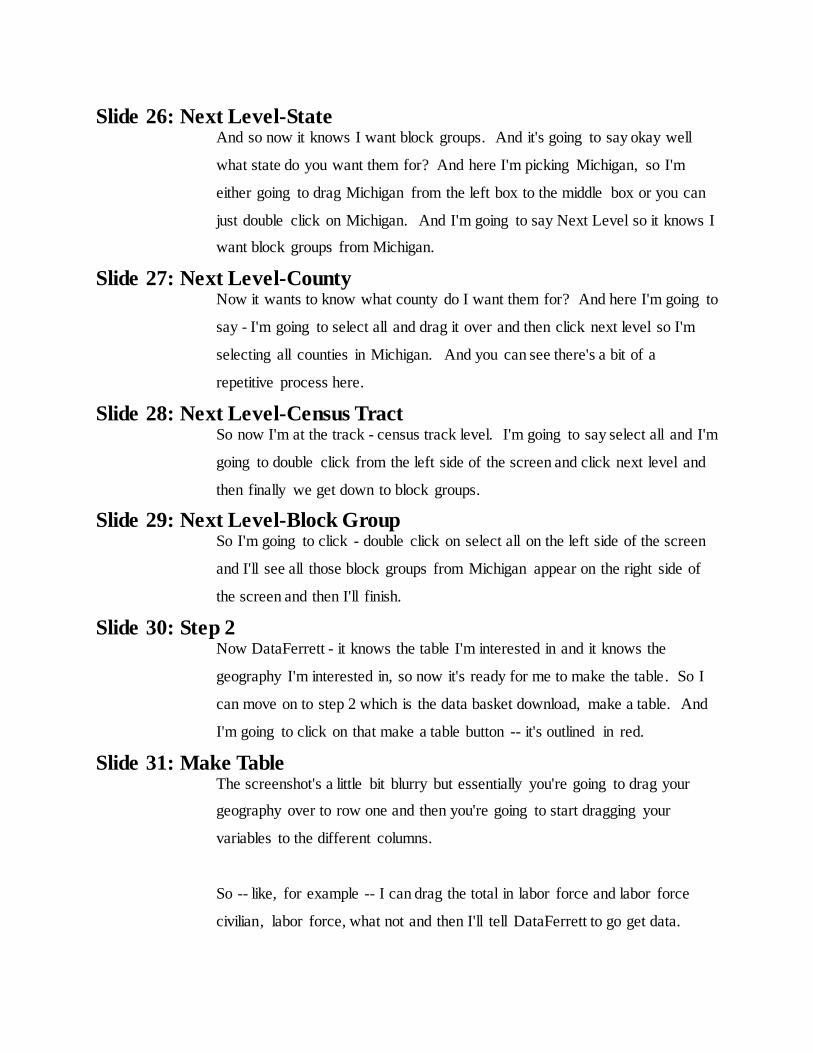
Slide 30: Step 2 Now DataFerrett - it knows the table I'm interested in and it knows the
geography I'm interested in, so now it's ready for me to make the table. So I
can move on to step 2 which is the data basket download, make a table. And
I'm going to click on that make a table button -- it's outlined in red.
Slide 31: Make Table The screenshot's a little bit blurry but essentially you're going to drag your
geography over to row one and then you're going to start dragging your
variables to the different columns.
So -- like, for example -- I can drag the total in labor force and labor force
civilian, labor force, what not and then I'll tell DataFerrett to go get data.
Slide 32: Results And then you see kind of similar to again the other tools that I've showed you,
you'll see the table B23025 for the five-year ACS for tracts and block groups
in Michigan. And so I'm getting the same estimate that's in the DataFerrett -
that's in the FactFinder download center.
Slide 33: Outline The next thing I'm going to talk about the Census API or Application
Programming Interface.
Slide 34: Census API So this is kind of a newer tool for the Census Bureau I didn't talk about it a lot
last year. I feel like it's becoming more and more popular, so I just want to
touch base and expand on that a little more.
So the Census API -- Application Programming Interface -- I have the URL
there on the screen (http://www.census.gov/developers/). And it's really a
source for developers to access data to create software applications. Every
time I look at it or am updating a presentation I feel like they're adding more
data sets to the API.
So it includes the ACS - our Summary File since it first came out and now it's
also including our Subject Tables and our comparison profiles, and also
include their Data Profiles, so more and more data is being added.
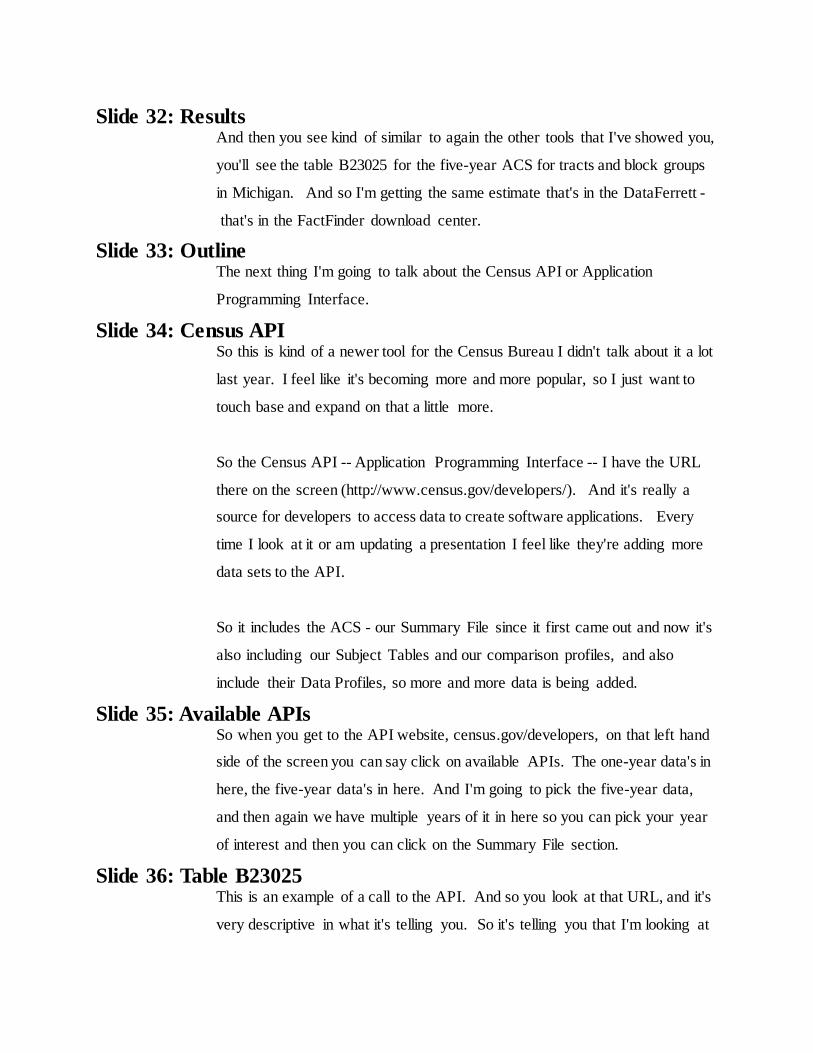
Slide 35: Available APIs So when you get to the API website, census.gov/developers, on that left hand
side of the screen you can say click on available APIs. The one-year data's in
here, the five-year data's in here. And I'm going to pick the five-year data,
and then again we have multiple years of it in here so you can pick your year
of interest and then you can click on the Summary File section.
Slide 36: Table B23025 This is an example of a call to the API. And so you look at that URL, and it's
very descriptive in what it's telling you. So it's telling you that I'm looking at
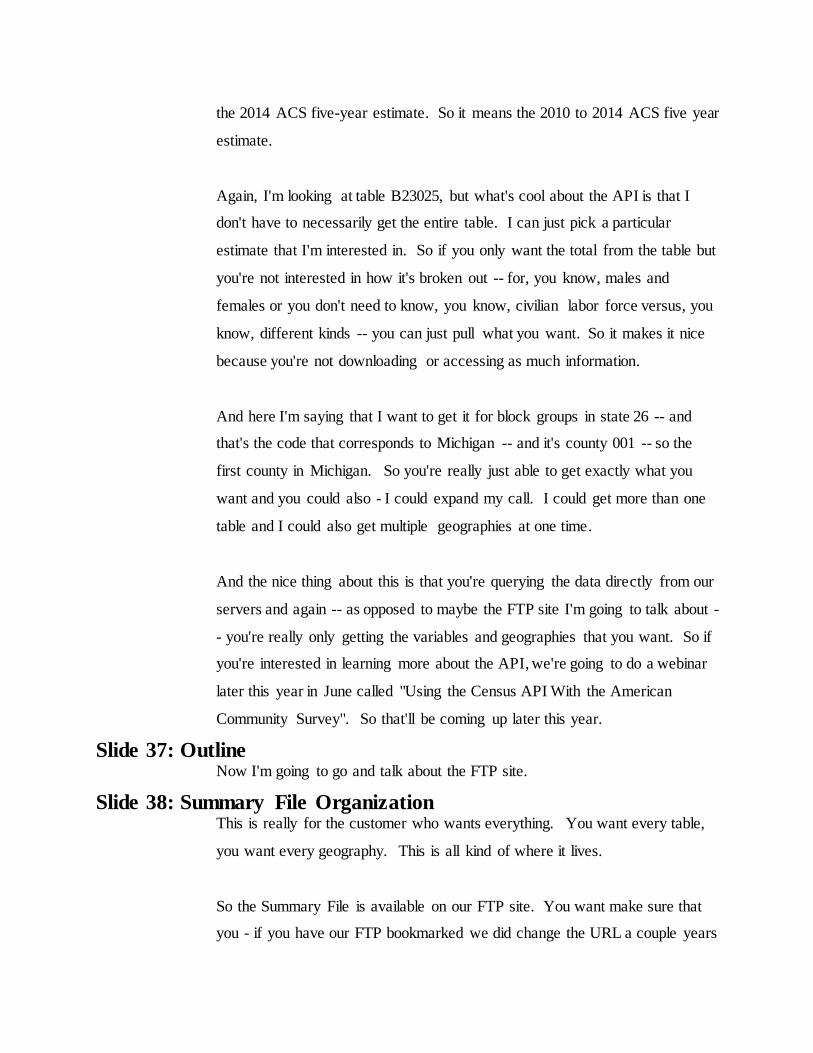
the 2014 ACS five-year estimate. So it means the 2010 to 2014 ACS five year
estimate.
Again, I'm looking at table B23025, but what's cool about the API is that I
don't have to necessarily get the entire table. I can just pick a particular
estimate that I'm interested in. So if you only want the total from the table but
you're not interested in how it's broken out -- for, you know, males and
females or you don't need to know, you know, civilian labor force versus, you
know, different kinds -- you can just pull what you want. So it makes it nice
because you're not downloading or accessing as much information.
And here I'm saying that I want to get it for block groups in state 26 -- and
that's the code that corresponds to Michigan -- and it's county 001 -- so the
first county in Michigan. So you're really just able to get exactly what you
want and you could also - I could expand my call. I could get more than one
table and I could also get multiple geographies at one time.
And the nice thing about this is that you're querying the data directly from our
servers and again -- as opposed to maybe the FTP site I'm going to talk about -
- you're really only getting the variables and geographies that you want. So if
you're interested in learning more about the API, we're going to do a webinar
later this year in June called "Using the Census API With the American
Community Survey". So that'll be coming up later this year.
Slide 37: Outline Now I'm going to go and talk about the FTP site.
Slide 38: Summary File Organization This is really for the customer who wants everything. You want every table,
you want every geography. This is all kind of where it lives.
So the Summary File is available on our FTP site. You want make sure that
you - if you have our FTP bookmarked we did change the URL a couple years
ago. If you go in the old spot you might think we haven't added data for a
couple years. But you want to make sure you're going to that program surveys
forward slash ACS, and once you're there there's lots of information up there
(http://www2.census.gov/programs-surveys/acs/summary_file/).
But you'll want to go to the Summary File, pick your year of interest -- here
I'm doing 2014 -- and then there's a data file and documentation file. And
here you just want to go to the data file. You can see we have the one-year
Summary File and the five-year Summary File. And we have the files three
different ways -- I've outlined in red -- that the five-year Summary File's
organized. It's five-year by state, the entire Summary File, and sequenced by
state. And these are the same combination of files they're just arranged
differently to accommodate different data users.
So here, no surprises, I am picking this by state - sequence by state folder, the
third option. I'm going to pick Michigan and then after I do that I have two
options - two folders. You can see in the lower right hand corner one is the all
geographies, not tracts and block groups. So it's the name would suggest it's
going to have all the other geographies except for those small geographies of
tracts and block groups. And then one called tracts and block groups only and
that only has our tracts and block groups.
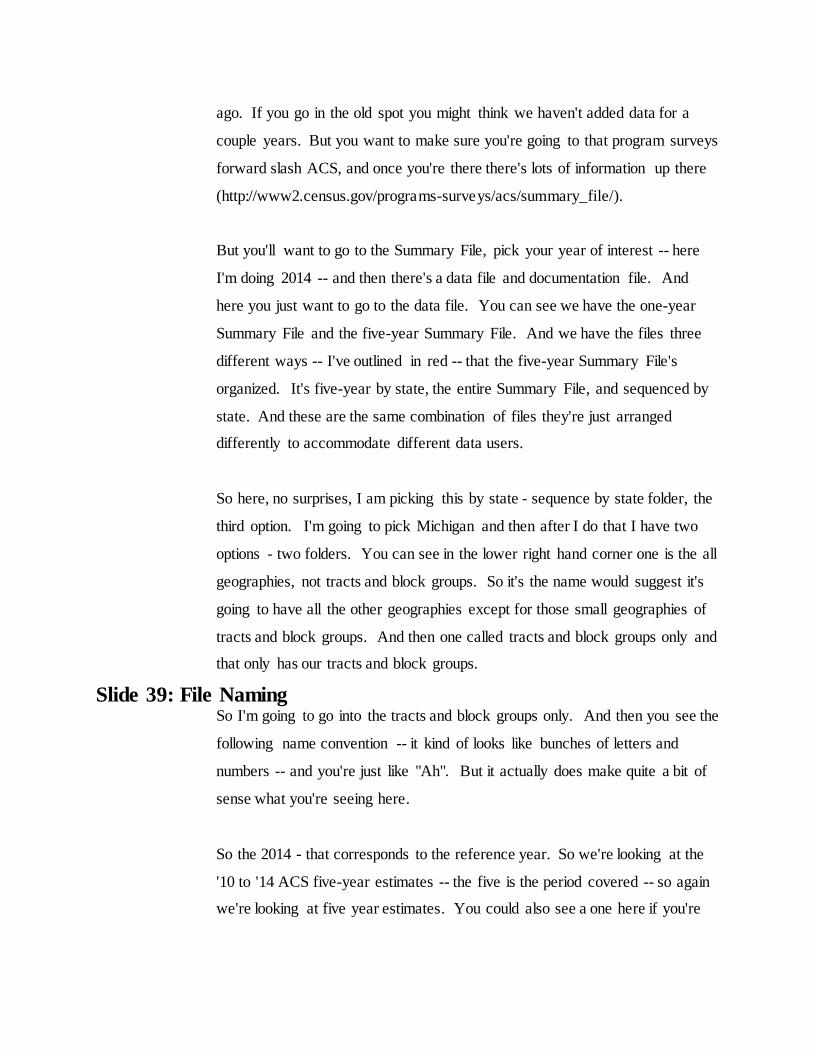
Slide 39: File Naming So I'm going to go into the tracts and block groups only. And then you see the
following name convention -- it kind of looks like bunches of letters and
numbers -- and you're just like "Ah". But it actually does make quite a bit of
sense what you're seeing here.
So the 2014 - that corresponds to the reference year. So we're looking at the
'10 to '14 ACS five-year estimates -- the five is the period covered -- so again
we're looking at five year estimates. You could also see a one here if you're

looking at the one-year estimates. The M-I corresponds to the state so here
I'm looking at Michigan.
Another thing we see a lot with questions is there's a US folder. Sometimes
people think the US folder has, like, everything for the nation in that file. And
that's actually just for geographies that cross state boundaries like ZCTAs or
metropolitan statistical areas. US does not include the entire country.
And then if you remember back when we looked on the website we looked at
a sequence number. And so here we're going to look at sequence 78 -- so kind
of the 78th ZIP file has our table of interest -- along with other tables. We
want to know that because otherwise you'd be clicking through a lot of ZIP
files to find your information.
And then we just have these three zeroes. It's called an iteration ID, they're
always zero for ACS. And it's a standard, they're always there for the one-
and five-year estimates.
Slide 40: Estimate, MOE, Geography Files So I'm going to open up that 78 - the sequence file 78 I have outlined. And
when you open it up, little hard to see but you basically get your estimates that
start with E, margin of error starts with M. So you can see it's all your
estimates separated by commas, all your margins of error separated by
commas, and then also there's the geography file.
So these are kind of the three pieces that you need to stitch together to kind of
get this - replicate kind of that same experience you had in FactFinder, where
you can see the margin of error and the estimates for a particular geography.
Here they're just kind of separated out.
Slide 41: Starting and Ending Position So anyway if we zoom in on one of the estimate files so you can see we have
this number one corresponding to the ACSSF -- which is the ACS Summary
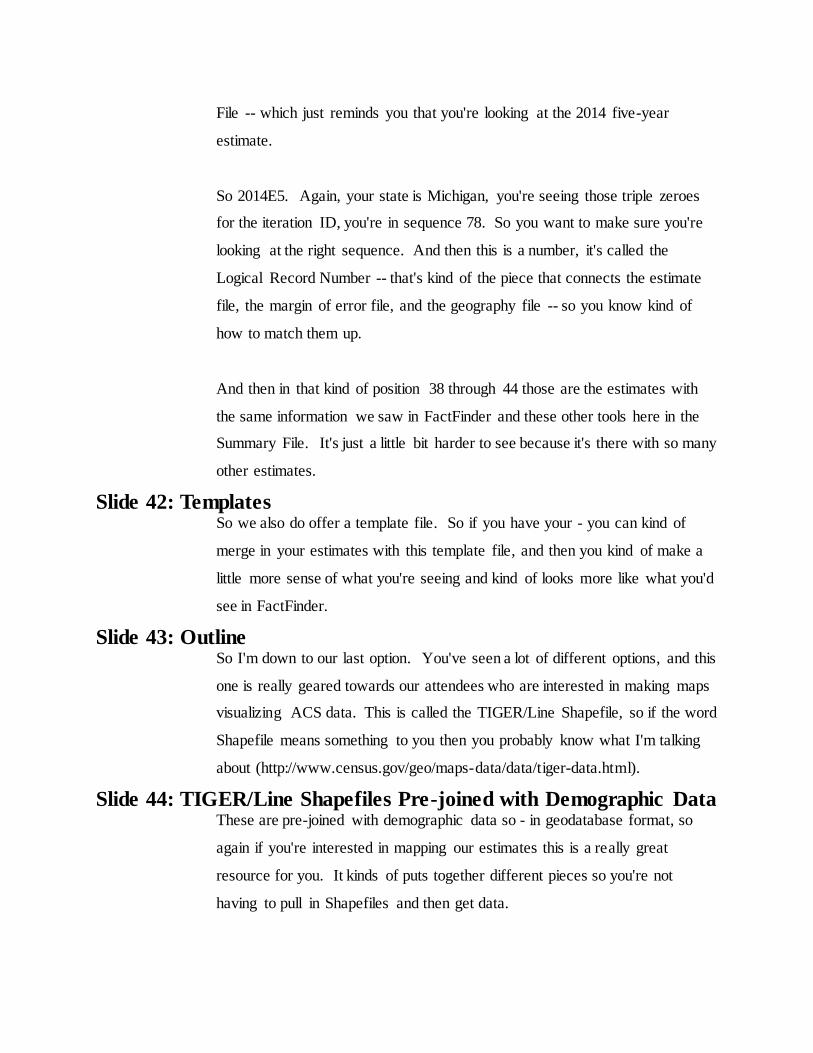
File -- which just reminds you that you're looking at the 2014 five-year
estimate.
So 2014E5. Again, your state is Michigan, you're seeing those triple zeroes
for the iteration ID, you're in sequence 78. So you want to make sure you're
looking at the right sequence. And then this is a number, it's called the
Logical Record Number -- that's kind of the piece that connects the estimate
file, the margin of error file, and the geography file -- so you know kind of
how to match them up.
And then in that kind of position 38 through 44 those are the estimates with
the same information we saw in FactFinder and these other tools here in the
Summary File. It's just a little bit harder to see because it's there with so many
other estimates.
Slide 42: Templates So we also do offer a template file. So if you have your - you can kind of
merge in your estimates with this template file, and then you kind of make a
little more sense of what you're seeing and kind of looks more like what you'd
see in FactFinder.
Slide 43: Outline So I'm down to our last option. You've seen a lot of different options, and this
one is really geared towards our attendees who are interested in making maps
visualizing ACS data. This is called the TIGER/Line Shapefile, so if the word
Shapefile means something to you then you probably know what I'm talking
about (http://www.census.gov/geo/maps-data/data/tiger-data.html).
Slide 44: TIGER/Line Shapefiles Pre-joined with Demographic Data These are pre-joined with demographic data so - in geodatabase format, so
again if you're interested in mapping our estimates this is a really great
resource for you. It kinds of puts together different pieces so you're not
having to pull in Shapefiles and then get data.
I'm told that the newest ACS estimates -- the data that came out in December,
the 2011 to 2015 tables -- should be released by the end of February. So
those'll be coming up soon.
And then also if you're interested in learning more about this product we will
be doing a webinar in mid-May about using the geodatabase files with
ArcMap, so that'll be coming up in a couple months.
Slide 45: Outline So I'm going to wrap up here try to recap what we covered. I know we
covered a lot of different information in half an hour so again, I do have those
slides posted and then also we'll be posting this recording with the transcript
and the slides so you can also look at this later and kind of sit down and play
with it.
Slide 46: Summary File Documentation So just to remind you the Summary File documentation page -- this has all the
technical documentation for the Summary File. You can also access the
appendices here, see, you know, where your tables are located in the
Summary File. That's on our website under technical documentation and then
Summary File documentation. And there's tabs for each year of the Summary
File (https://www.census.gov/programs-surveys/acs/technical-
documentation/summary-file-documentation.html).
Slide 47: Options for Accessing Bulk Data And to try to recap kind of why you would want to use each tool. There's not
necessarily a discrete use for each thing -- there's kind of overlap in why you
would want to use one or other -- but in general the download center in
FactFinder - American FactFinder - one of the advantages of that tool I guess
is that it's probably the easiest to use
(https://factfinder.census.gov/faces/nav/jsf/pages/download_center.xhtml).
So if you're a new user it's a great place to go. You can download one
geographic type -- but that kind of has a generous definition -- so you could be
getting all the block groups in your state or all the tracts in the nation. And
you can do that for a table - for 40 tables at a time, so it's a good option
particularly if you're interested in kind of minimal geographies but you want
more tables.
The Summary File Retrieval Tool -- I talked about that briefly -- it's
particularly useful if you're looking for block group data from the older ACS
data sets. Again, it's not being updated any more, but if you are looking for
some of the earlier years of Summary File block group data this is the tool that
helps you.
DataFerrett - we talked about - it's good if you want a large number of
geographic areas or a small number of tables.
The Census API, or Application Programming Interface. If you're a developer
this is likely where you'd be going. But even if you're not a developer it's
fairly easy to make calls to it if you understand how we, you know, name our
tables and you understand a little bit about how the geography is coded.
And what's nice about this is that you can pick only the variables you want --
you don't have to get the entire table -- and you can also pick the geographies
you want. You can do kind of multiple tables and geographies in your call.
And then if you are kind of a hardcore Summary File user and you want
everything, it's likely you're going to go to our FTP site that has all the tables
for every geography.
And then if you're interested in mapping, visualizing ACS data, you'd likely
want to see those Shapefiles that are already pre-joined with our ACS
estimates.
Slide 48: Questions?
Slide 49: Continue the Conversation #ACSdata Gretchen Gooding: Right so while you do that I'll give you some of the ACS infomercials
here. We are on social media using the hashtag ACS data (#ACSdata) and
we'd like to know how you're using our data. So feel free to use that, Twitter,
Facebook, YouTube, Instagram, Pinterest, LinkedIn. We're on all those
different channels.
Also, we have a way that you can sign up to get a monthly alert as to what
events we're going to, what webinars we're doing. You can see the URL there
on the screen
(https://public.govdelivery.com/accounts/USCENSUS/subscriber/new). And I
talked a lot about our website census.gov/acs, and then we also have
contact information if you have a question you can contact us at 1-800-923-
8282 or 301-763-1405.
Man: Thank you and we do have a question. Our first question comes from
(Camille Kohler). Ma'am, your line is open.
(Camille Kohler): Hi there, thanks for the presentation by the way. To start, we have a set of
users who generally download their data using the FactFinder but are looking
for us to pull that data directly into our database using the API and we've
noticed that in the Excel export from the FactFinder there's this alphanumeric
reference above each column that looks like HD oh one underscore BD oh one
or something like that.
But when you look in the API documentation it lists the variables by a table
name -- like I don't know, B two zero two five or whatever it is. So we're
wondering, is there a piece of documentation that would help us cross
reference the variables that they're pulling from the FactFinder to the variables
that we're seeing in the API?
Gretchen Gooding: That's a good question. Off the top of my head I don't have an answer for
that but you can email that one in and we can take a look and connect you
with the right staff and figure that out.
(Camille Kohler): Oh perfect.
Gretchen Gooding: And the email is - it's [email protected]. We can take a
look at that.
(Camille Kohler): And was that ACSO...
Gretchen Gooding: Yes
(Camille Kohler): ... at users.gov?
Gretchen Gooding: Yes, the O is for office.
(Camille Kohler): Oh, okay, and what was the rest of it? ACSO.users.gov at...?
Gretchen Gooding: ACSO.users.support...
(Camille Kohler): .port...
Gretchen Gooding: ...support at census.gov
(Camille Kohler): Perfect. Thank you so much.
Gretchen Gooding: I don't have that one…
Man: Thank you. Our next question comes from (Alicia Ellster). Ma'am, your line
is open.
(Alicia Ellster): Okay, thank you very much. Very helpful webinar. I'm a grant writer and our
agency serves an age range of 18 to 24, and I only am able to get data for that
specific range it seems like happenstance. Is there any way I can zero in on
the 18 to 24 age range at the beginning of my search so that I can get right to
that demographic information?
Gretchen Gooding: One of the products I didn't discuss at this webinar it's called PUMS -
public use microdata sample. What geography are you looking for, are you
looking for like a state, county, city...?
(Alicia Ellster): City, urban city Detroit in fact, in specific.
Gretchen Gooding: PUMS may be an option for you it's kind of where you can have - create
your own tables pulling the variables. So you could probably do the ages -
you could do 18 to 24. That's also another one where if you wanted to send in
an email we can look more in FactFinder to see if there's tables that already
have that age range. I'm not sure that there are many that have that.
(Alicia Ellster): Right. So can you give that - you said it's PUMS?
Gretchen Gooding: Yes, the project is called PUMS. But let's see if I can - is there a way I
can add the email address? Let's see... It's the
[email protected]. We're going to see if we can just add that
to the screen since...
(Alicia Ellster): Oh, great.
Gretchen Gooding: …you guys are asking some tough but good questions. So we're going to
pause sharing and then we'll add that up there.
Man: And if we're ready for our next question, our next question comes from
(Eileen Hobbs). Ma'am, your line is open.
(Eileen Hobbs): Hi, I - my question was about the age range search, so I did get that answered.
However, I do not see anything now online that can give us that - those email
addresses and I didn't - I thought you said ACSO users support. So if that's
something that can - we can get again? I don't know if there's a way that it can
be - is there a chat box it can be posted on here that I just don't' see?
Gretchen Gooding: So I think we just added it...
(Eileen Hobbs): Oh.
Gretchen Gooding: ...can you see the email address?
(Eileen Hobbs): Yes.
Gretchen Gooding: Yes, so that is it.
(Eileen Hobbs): So, okay, and so then I'm just learning that there is no age sort in this data
through ACS…
Gretchen Gooding: No, because the tables are...
(Eileen Hobbs): Can you confirm that?
Gretchen Gooding: ...premade and so there may be some tables that include 18 to 24 year-
olds. They're likely not crossed by a lot of other variables that you'd be
interested in. If you email us we can look closer.
(Eileen Hobbs): All right, and then what was that other website - what was it called the public
use -- the P-U-M-S -- can you put that on?
Gretchen Gooding: It's on our website the census.gov/acs. Again, if you email us we can send
you more information about that.
(Eileen Hobbs): Thank you.
Man: Thank you. Our next question comes from (Allison). Ma'am, your line is
open.
(Allison): Hi, thanks, yes, I'm one of those people that know with -what Shapefiles are
and I'm looking at the data set. And I just wanted to understand, it looks like
there's a TIGER/Line Shapefile that has an extensive rather than limited list of
descriptive attributes. Is that the same as what we would get on the Summary
File information -- you know all those B and C tables -- or is that different?
Gretchen Gooding: So you're looking at the Shapefiles that are pre-joined with our data?
(Allison): I don't know - there's two options. One TIGER/Line Shapefiles that says it
has an extensive list of attributes and then there's another one that says
TIGER/Line with selected demographic and economic data. And that's what
I've used before but that's a limited set of it -- so it doesn't seem to be all of the
Summary File -- so I'm just wondering what the best source of data is that's
the most comprehensive?
Gretchen Gooding: So if you want to have the Shapefiles that are already joined with
our information you have to go to the - hopefully you can see that on the
screen the ones that are with the selected demographic and economic data...
(Allison): Okay.
Gretchen Gooding: And they should have all the tables that start with the B and the C all the
detail tables.
(Allison): It does?
Gretchen Gooding: I believe so, but if you're seeing something different and you email us I
can connect you with the geography area they can look into it.
(Allison): Okay, yes, it just says limited but it doesn't tell me what it's limited to for the
descriptive attributes -- whereas other things say extensive -- so I'm not sure
what that involves. So yes, I would love to email you, thank you.
Gretchen Gooding: Yes, I think the limited might be in the number of geography, like,
summary levels available. I believe it has all of our tables just not for every
single geography level.
(Allison): Got you.
Gretchen Gooding: But I'll look into that.
(Allison): Okay, thanks. And then I have one other question. Is it possible when you
use American FactFinder Download Center to exclude the margin of error
columns from your download?
Gretchen Gooding: You can it- I think you can either uncheck the boxes in FactFinder or
when you download it you could just delete those columns or rows.
(Allison): Yes. I just done it manually in the past and was looking for a shortcut so I'll
look for that. Thank you so much.
Gretchen Gooding: Yes.
Man: Thank you. Our next question comes from (Abankra Boulya), your line is
open.
(Abankra Boulya): Yes, I have a question. You were talking about the API, and I'm a new
user and I came across this City SDK. Can you talk about it a little bit, like
what is advantages? I know it's in the beta but how it can help me to query
the API?
Gretchen Gooding: (Abankra) are you talking about this city SDK?
(Abankra Boulya): Yes, correct, first.
Gretchen Gooding: So I don't know much more about that other than it is available. Again -- I
feel like I'm saying this over and over again -- email us. We can connect you
with the staff who works on the API. I do think there's a video about how to
use it on the API website. That might get you started but then we can connect
you with the API staff.
(Abankra Boulya): Okay and who do I email to this?
Gretchen Gooding: To be what you see on the screen it's that ACSO.users.support
(Abankra Boulya): Oh, okay.
Gretchen Gooding: ...at census.gov.
(Abankra Boulya): All right, thank you.
Man: Thank you. Our next question comes from (Cathy Hartzog). Ma'am, your
line is open.
(Cathy Hartzog): Hi, thank you. I have a question about documentation for MOEs.
I've noticed over the years that when there's a zero estimate the value for the
MOE has changed from a fixed value for every geographic unit to a variable
value depending on the population in that geographic unit. And I've had
difficulty finding documentation to tell me what the MOE should be for any
given geographic unit for particular ACS data year.
Gretchen Gooding: So I thought that the zero MOEs - I thought that zero estimates - I thought
that the margin of error was the same across the state. That may have
changed. We do have our statistical support area. Once again -- usually I'm
good at answering questions -- but that ACSO.users.support - we can connect
you with the staff that works on the statistical support and they can help you
out.
(Cathy Hartzog): Okay, thank you.
Man: Thank you. Our next question comes from (Ms. Griswald). Ma'am your line
is open.
(Griswald): Hi. I've - have been trying to resolve a situation that an age and disability data
that I have found in the CMS website with the American Community
Survey for a specific rural county in my state. And I was just wondering if
there was someone who might be able to guide me better through the types of
data that I'm using?
And I know that you've been giving an email address and I've - and as you
were doing that I've actually been exploring a download that I had put
together. And I guess probably what my situation is, is that it looks like
according to CMS 50% of my population is disabled or on Medicare and their
numbers - I'm trying to find information from the American Community
Survey.
I guess my real question is if I am mixing apples and oranges and if there
would be somebody who could help work me through this? Thank you.
Gretchen Gooding: Yep, so you can probably guess what I'm going to say. We have email --
the ACSO.users.support and we do have subject matter areas that would know
more about disability, would be able to help you and we can connect you with
that staff.
(Griswald): Okay, all right, thank you.
Man: And our last question in queue is from (Mr. Greg Jareau). Sir, your line is
open.
(Greg Jareau): Thank you. (Greg Jareau) with Bloomberg News. I frequently use ACS data
at the congressional district level of geography and I'm wondering if the
bureau was still planning to release ACS data for the 115th Congress
reflecting new district lines in North Carolina, Virginia, and Florida?
Gretchen Gooding: Is this fall? I'm conferring with a colleague, just a sec. All right, we sit
right by the redistricting office here at Census and so if you email us that
question we can connect you with them and ask what's going on with that.
(Greg Jareau): Okay, great, thank you.
Man: And as a reminder if you need to ask a question it is star one. Otherwise -- at
this time -- I am showing no further questions in queue.
Slide 50: ACS Data Users Group Gretchen Gooding: And while we're waiting for any additional questions I'll just give you a
plug for the ACS data user group. It's - you can see the URL there at the
bottom of the screen (https://acsdatacommunity.prb.org/).
It's there to promote the understanding of the value and utility of ACS data.
Membership is free. We have about 1700 members online and what's
exciting for us is that we have a data user conference coming up in May. It'll
be at the Patent and Trademark Office in Alexandria, Virginia. So hopefully
you can come and join us.
We also do some other webinars -- special sessions -- and also a great place -
we have a Summary File group on the online community so if you want to
connect with other Summary File users, it's there.
Slide 51: Need Local Stats? And then also another option -- this might be helpful for my caller from
Detroit -- we also have data dissemination specialists. And these are staff who
are located across the country -- I think there are about 40 some of them,
they're everywhere from, like, Seattle to Miami -- and they're available to help
you access statistics. They can come do a training, a webinar, a workshop,
whatnot, and their contact information is on the screen. So they're a great
resource for localized data.
And then we'll see if there's any more questions.
Man: We did have one more question come in. Sir, your line is open.
Man 2: What would be the best way to download a few statistics a few statistics…
(unintelligible).
Gretchen Gooding: So I think that got cut off. I couldn't hear...
Man: I think...
Gretchen Gooding: ...your question.
Man: Yes, can you pick up your handset maybe that might help out?
Man 2: What would be the best way to download a few statistics for every
(unintelligible) in the whole United States?
Gretchen Gooding: I think you're still cutting out but I'm going to put up the user support
email address and that's - you can email that in - your question in and we can
take a look.
Man2: Okay.
Gretchen Gooding: And then before we cut off we do have an evaluation that we're going to
post. We really appreciate your feedback. We have a number of upcoming
webinars later this year, so if you can give us some feedback now hopefully
we can improve the webinars later this year, and we're going to be sharing
that.
We really appreciate you taking the time to look at that. Otherwise thank you
so much for joining us. Thank you for your difficult questions, these were
good ones but we will - if you email us, we'll get back to you and we'll
connect you with the right resources here at Census.
Man: Thank you. This concludes then today's conference, and thank you for
participating. You may disconnect at this time.

END