Embed Size (px)
Citation preview
Using Archived Data to Measure Using Archived Data to Measure Operational Benefits of a System-wide Operational Benefits of a System-wide
Adaptive Ramp Metering (SWARM) Adaptive Ramp Metering (SWARM) SystemSystem
TAC MeetingTAC Meeting
December 13, 2006December 13, 2006
Robert BertiniRobert Bertini
Sue AhnSue Ahn
Oren EshelOren Eshel
Meeting OutlineMeeting Outline
IntroductionsIntroductions Work PlanWork Plan
Progress ReportProgress Report Pilot StudyPilot Study
Remaining TasksRemaining Tasks Regional StudyRegional Study
Next StepsNext Steps DiscussionDiscussion
Work Plan – Progress ReportWork Plan – Progress Report Task 1: Literature ReviewTask 1: Literature Review
Revision will be posted next weekRevision will be posted next week Update: Caltrans I-210 StudyUpdate: Caltrans I-210 Study
Tasks 2-3: Corridor Selection and Data Tasks 2-3: Corridor Selection and Data Collection PlanCollection Plan Complete – TAC comments incorporatedComplete – TAC comments incorporated
Task 4: Pilot StudyTask 4: Pilot Study TRB Paper – Revision submitted and on WikiTRB Paper – Revision submitted and on Wiki Additional analysis suggestedAdditional analysis suggested Poster to be presented in JanuaryPoster to be presented in January
Task 5: Regional StudyTask 5: Regional Study
Task 1 – Report CommentsTask 1 – Report Comments
TAC literature review comments to be addressed:TAC literature review comments to be addressed: Balancing congestion on freeways and alternate routes Balancing congestion on freeways and alternate routes
(i) (i) Evaluation design strategies (ii) Evaluation design strategies (ii) Detection at off-ramps (iii)Detection at off-ramps (iii) Revision will be posted next weekRevision will be posted next week
Complete:Complete: Added discussion of SWARM 2c (iii)Added discussion of SWARM 2c (iii) Moved figure to better introduce it (iv)Moved figure to better introduce it (iv)
Task 1 – Update: I-210 Task 1 – Update: I-210 StudyStudy
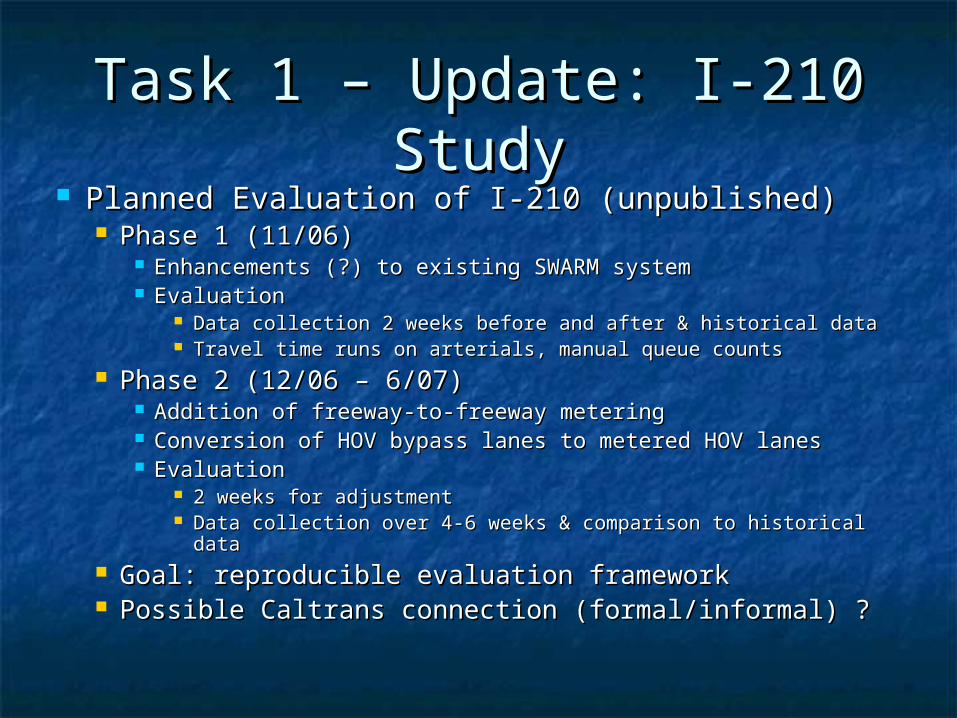
Planned Evaluation of I-210 (unpublished)Planned Evaluation of I-210 (unpublished) Phase 1 (11/06)Phase 1 (11/06)
Enhancements (?) to existing SWARM systemEnhancements (?) to existing SWARM system EvaluationEvaluation
Data collection 2 weeks before and after & historical dataData collection 2 weeks before and after & historical data Travel time runs on arterials, manual queue countsTravel time runs on arterials, manual queue counts
Phase 2 (12/06 – 6/07)Phase 2 (12/06 – 6/07) Addition of freeway-to-freeway meteringAddition of freeway-to-freeway metering Conversion of HOV bypass lanes to metered HOV lanesConversion of HOV bypass lanes to metered HOV lanes EvaluationEvaluation
2 weeks for adjustment2 weeks for adjustment Data collection over 4-6 weeks & comparison to historical Data collection over 4-6 weeks & comparison to historical
datadata Goal: reproducible evaluation frameworkGoal: reproducible evaluation framework Possible Caltrans connection (formal/informal) ?Possible Caltrans connection (formal/informal) ?
Task 4: OR-217 SB Pilot Task 4: OR-217 SB Pilot StudyStudy
TRB presentation in JanuaryTRB presentation in January Paper revised 11/2006Paper revised 11/2006
Additional analysis suggested by Additional analysis suggested by TACTAC
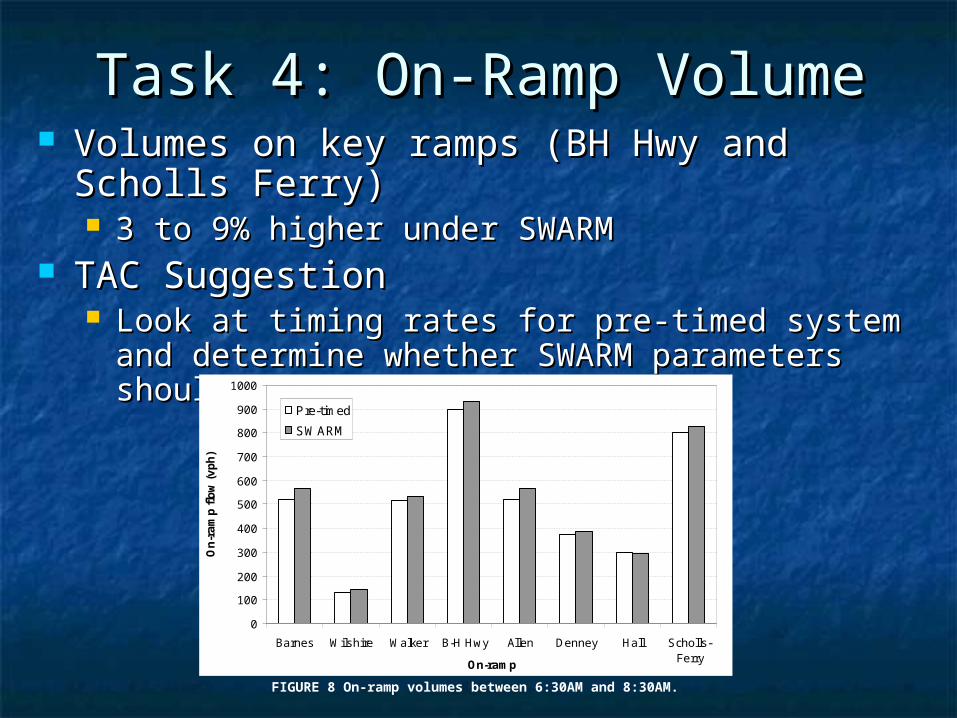
Task 4: On-Ramp VolumeTask 4: On-Ramp Volume Volumes on key ramps (BH Hwy and Scholls Volumes on key ramps (BH Hwy and Scholls
Ferry)Ferry) 3 to 9% higher under SWARM3 to 9% higher under SWARM
TAC SuggestionTAC Suggestion Look at timing rates for pre-timed system and Look at timing rates for pre-timed system and
determine whether SWARM parameters should be determine whether SWARM parameters should be modified.modified.
0
100
200
300
400
500
600
700
800
900
1000
Barnes Wilshire Walker B-H Hwy Allen Denney Hall Scholls-Ferry
On-ramp
On
-ra
mp
flo
w (
vp
h)
Pre-timed
SWARM
FIGURE 8 On-ramp volumes between 6:30AM and 8:30AM.
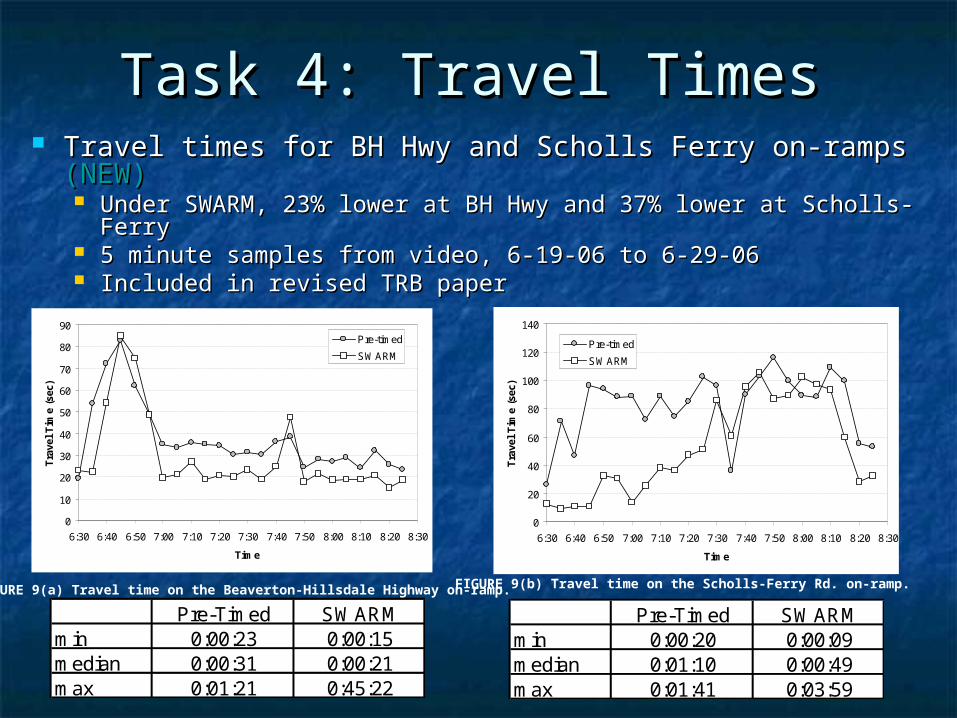
Task 4: Travel TimesTask 4: Travel Times Travel times for BH Hwy and Scholls Ferry on-ramps Travel times for BH Hwy and Scholls Ferry on-ramps (NEW)(NEW)
Under SWARM, 23% lower at BH Hwy and 37% lower at Scholls-FerryUnder SWARM, 23% lower at BH Hwy and 37% lower at Scholls-Ferry 5 minute samples from video, 6-19-06 to 6-29-065 minute samples from video, 6-19-06 to 6-29-06 Included in revised TRB paperIncluded in revised TRB paper
0
10
20
30
40
50
60
70
80
90
6:30 6:40 6:50 7:00 7:10 7:20 7:30 7:40 7:50 8:00 8:10 8:20 8:30
Time
Tra
vel
Tim
e (s
ec)
Pre-timed
SWARM
0
20
40
60
80
100
120
140
6:30 6:40 6:50 7:00 7:10 7:20 7:30 7:40 7:50 8:00 8:10 8:20 8:30
Time
Tra
vel
Tim
e (s
ec)
Pre-timed
SWARM
FIGURE 9(a) Travel time on the Beaverton-Hillsdale Highway on-ramp. FIGURE 9(b) Travel time on the Scholls-Ferry Rd. on-ramp.
Pre-Timed SWARMmin 0:00:20 0:00:09median 0:01:10 0:00:49max 0:01:41 0:03:59
Pre-Timed SWARMmin 0:00:23 0:00:15median 0:00:31 0:00:21max 0:01:21 0:45:22
Task 4: Additional AnalysisTask 4: Additional Analysis
Basic analysis for last two months of pre-timed Basic analysis for last two months of pre-timed and first two months of SWARMand first two months of SWARM So farSo far
pre-timed: 10/3/05 – 10/7/05pre-timed: 10/3/05 – 10/7/05 SWARM: 12/5/05 – 12/9/05SWARM: 12/5/05 – 12/9/05
Results preliminaryResults preliminary – significant data issues – significant data issues e.g. 10/3: 1.5 hour communications failuree.g. 10/3: 1.5 hour communications failure
Used as an opportunity to refine, streamline data Used as an opportunity to refine, streamline data processing tools (75% complete)processing tools (75% complete)
Once complete, will be able to easily process additional Once complete, will be able to easily process additional daysdays
Did we mention that the results are preliminary?Did we mention that the results are preliminary?

VMTVMT
0
10000
20000
30000
40000
50000
60000
70000
80000
90000
Mon Tue Wed Thu Fri Average
PreSWARM
PostSWARM
6/06 Pre-timed and SWARM10/05 Pre-timed, 12/05 SWARM(Preliminary)
0
10000
20000
30000
40000
50000
60000
70000
80000
90000
Mon Tue Wed Thu Fri Average
PreSWARM
PostSWARM
VHTVHT
6/06 Pre-timed and SWARM10/05 Pre-timed, 12/05 SWARM(Preliminary)
0
200
400
600
800
1000
1200
1400
1600
1800
2000
Mon Tue Wed Thu Fri
PreSWARM
PostSWARM
0
200
400
600
800
1000
1200
1400
1600
1800
2000
Mon Tue Wed Thu Fri
PreSWARM
PostSWARM
DelayDelay
6/06 Pre-timed and SWARM10/05 Pre-timed, 12/05 SWARM(Preliminary)
0
10
20
30
40
50
60
70
Barne
s
Wils
hire
Walke
r
Bhhwy
Allen
Denne
yHal
l
Schol
ls
Gre
enbur
g99
W
Pre-timed
SWARM
0
10
20
30
40
50
60
70
Barne
s
Wils
hire
Walke
r
Bhhwy
Allen
Denne
yHal
l
Schol
ls
Gre
enbur
g99
W
Pre-timed
SWARM
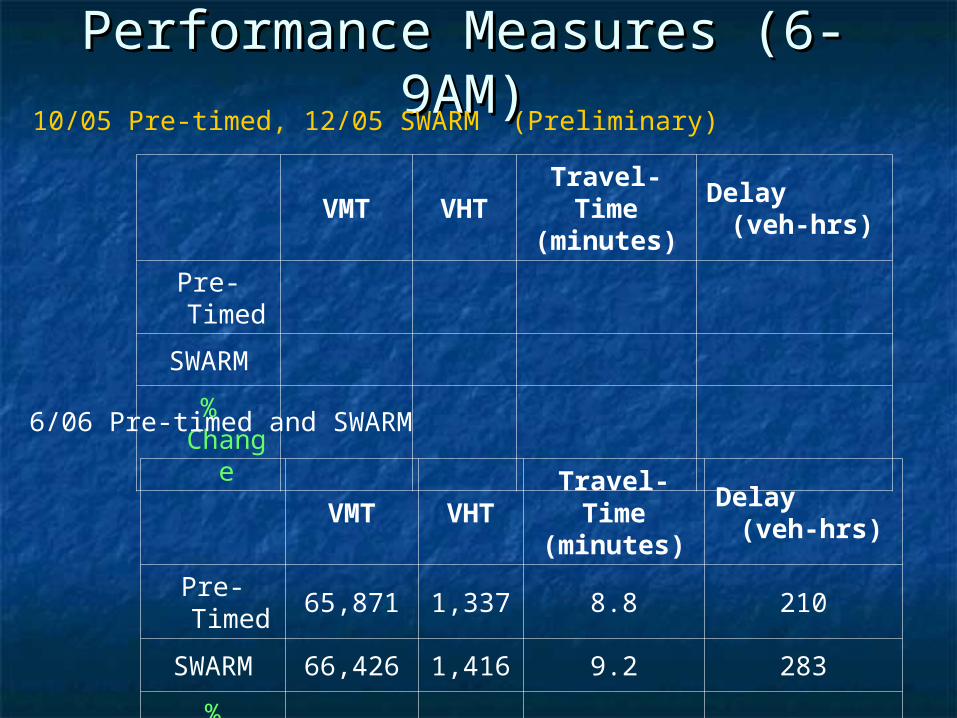
Performance Measures (6-9AM)Performance Measures (6-9AM)
VMT VHTTravel-Time
(minutes)
Delay (veh-hrs)
Pre-Timed
SWARM
% Chang
e
VMT VHTTravel-Time
(minutes)
Delay (veh-hrs)
Pre-Timed
65,871 1,337 8.8 210
SWARM 66,426 1,416 9.2 283
% Chang
e0.8% 6.0% 5.1% 34.7%
10/05 Pre-timed, 12/05 SWARM (Preliminary)
6/06 Pre-timed and SWARM
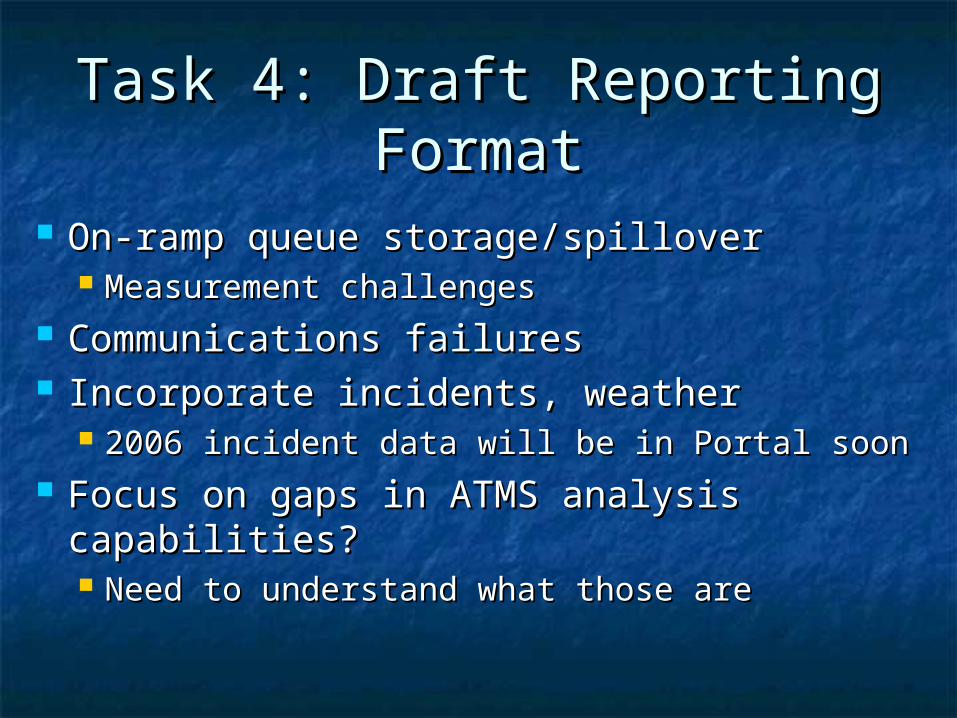
Task 4: Draft Reporting Task 4: Draft Reporting FormatFormat
On-ramp queue storage/spilloverOn-ramp queue storage/spillover Measurement challengesMeasurement challenges
Communications failuresCommunications failures Incorporate incidents, weatherIncorporate incidents, weather
2006 incident data will be in Portal soon2006 incident data will be in Portal soon Focus on gaps in ATMS analysis Focus on gaps in ATMS analysis
capabilities?capabilities? Need to understand what those are Need to understand what those are
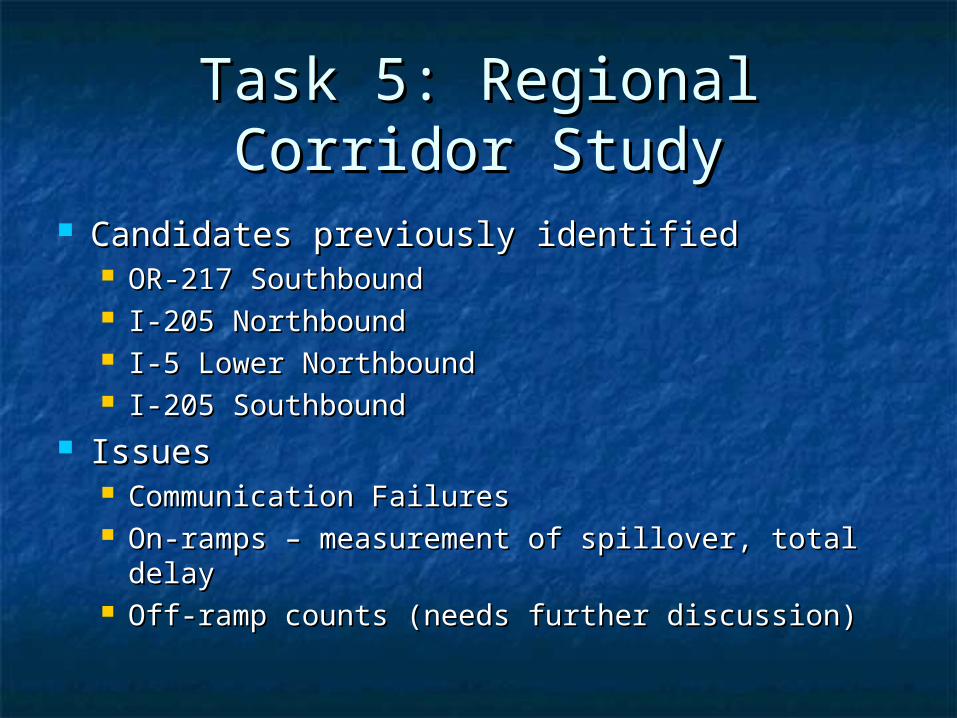
Task 5: Regional Corridor Task 5: Regional Corridor StudyStudy
Candidates previously identifiedCandidates previously identified OR-217 SouthboundOR-217 Southbound I-205 NorthboundI-205 Northbound I-5 Lower NorthboundI-5 Lower Northbound I-205 SouthboundI-205 Southbound
IssuesIssues Communication FailuresCommunication Failures On-ramps – measurement of spillover, total delayOn-ramps – measurement of spillover, total delay Off-ramp counts (needs further discussion)Off-ramp counts (needs further discussion)
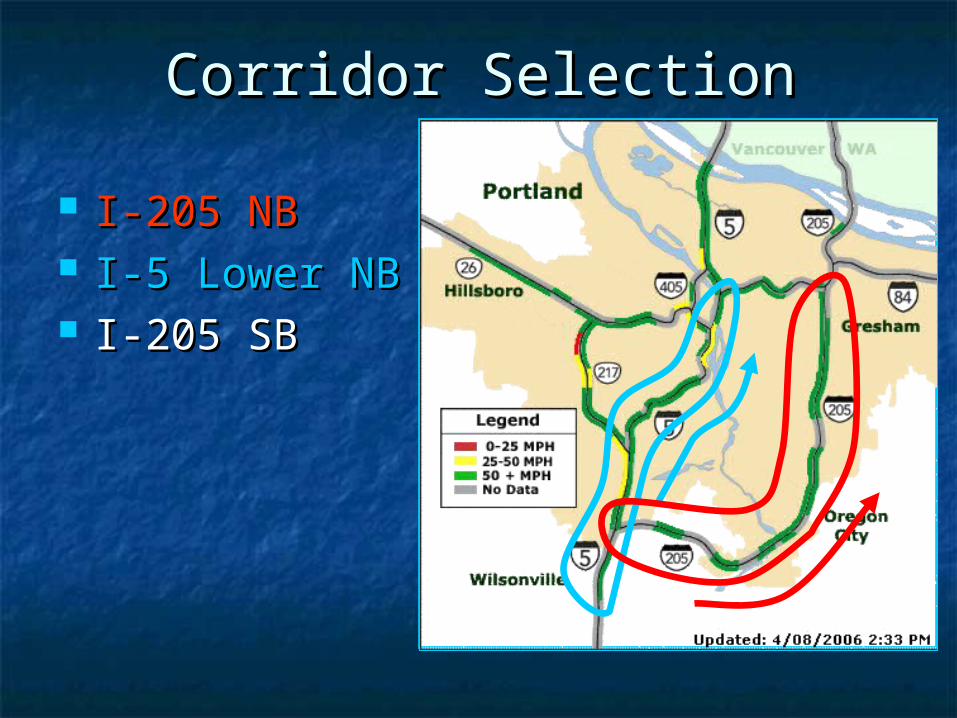
Corridor SelectionCorridor Selection
I-205 NBI-205 NB I-5 Lower NBI-5 Lower NB I-205 SBI-205 SB
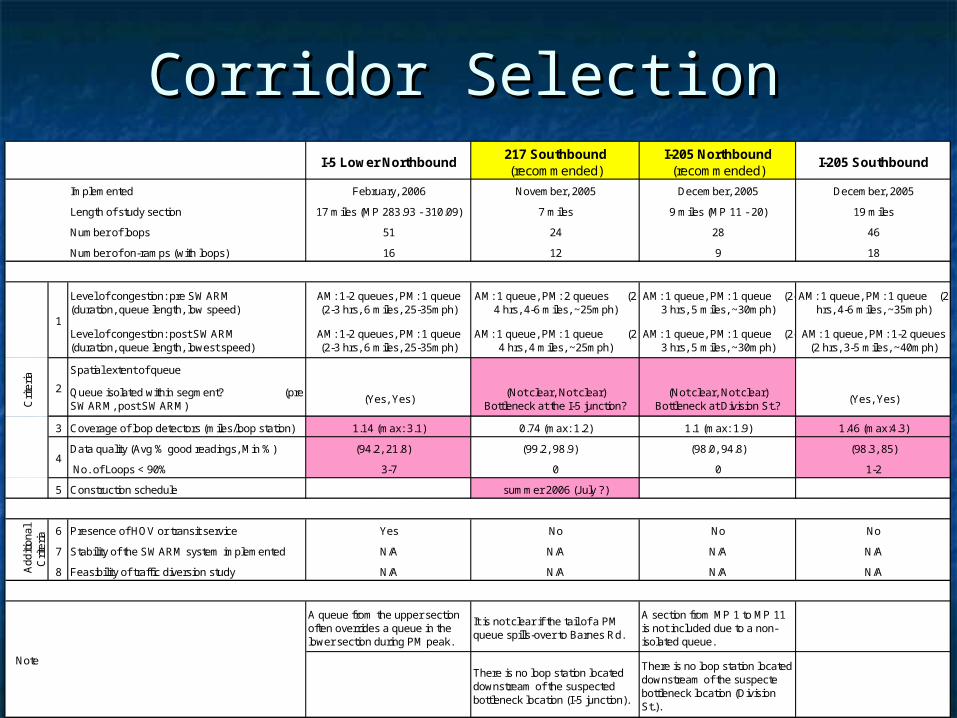
Corridor SelectionCorridor SelectionI-5 Lower Northbound
217 Southbound (recommended)
I-205 Northbound (recommended)
I-205 Southbound
Implemented February, 2006 November, 2005 December, 2005 December, 2005
Length of study section 17 miles (MP 283.93 - 310.09) 7 miles 9 miles (MP 11 - 20) 19 miles
Number of loops 51 24 28 46
Number of on-ramps (with loops) 16 12 9 18
Level of congestion: pre SWARM (duration, queue length, low speed)
AM: 1-2 queues, PM: 1 queue (2-3 hrs, 6 miles, 25-35mph)
AM: 1 queue, PM: 2 queues (2-4 hrs, 4-6 miles, ~25mph)
AM: 1 queue, PM: 1 queue (2-3 hrs, 5 miles, ~30mph)
AM: 1 queue, PM: 1 queue (2 hrs, 4-6 miles, ~35mph)
Level of congestion: post SWARM (duration, queue length, lowest speed)
AM: 1-2 queues, PM: 1 queue (2-3 hrs, 6 miles, 25-35mph)
AM: 1 queue, PM: 1 queue (2-4 hrs, 4 miles, ~25mph)
AM: 1 queue, PM: 1 queue (2-3 hrs, 5 miles, ~30mph)
AM: 1 queue, PM: 1-2 queues (2 hrs, 3-5 miles, ~40mph)
Spatial extent of queue
Queue isolated within segment? (pre SWARM, post SWARM)
(Yes, Yes)(Not clear, Not clear)
Bottleneck at the I-5 junction?(Not clear, Not clear)
Bottleneck at Division St.?(Yes, Yes)
3 Coverage of loop detectors (miles/loop station) 1.14 (max: 3.1) 0.74 (max: 1.2) 1.1 (max: 1.9) 1.46 (max:4.3)
Data quality (Avg % good readings, Min %) (94.2, 21.8) (99.2, 98.9) (98.0, 94.8) (98.3, 85)
No. of Loops < 90% 3-7 0 0 1-2
5 Construction schedule summer 2006 (July ?)
6 Presence of HOV or transit service Yes No No No
7 Stability of the SWARM system implemented N/A N/A N/A N/A
8 Feasibility of traffic diversion study N/A N/A N/A N/A
A queue from the upper section often overrides a queue in the lower section during PM peak.
It is not clear if the tail of a PM queue spills-over to Barnes Rd.
A section from MP 1 to MP 11 is not included due to a non-isolated queue.
There is no loop station located downstream of the suspected bottleneck location (I-5 junction).
There is no loop station located downstream of the suspecte bottleneck location (Division St.).
Note
Crit
eria
Add
ition
al
Crit
eria
1
2
4
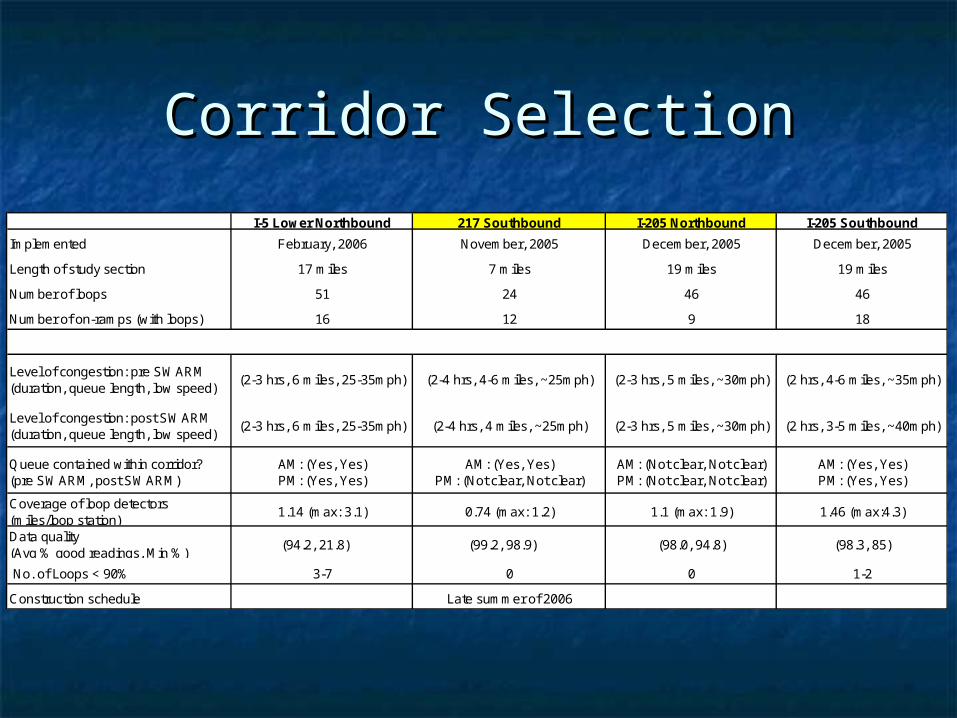
Corridor SelectionCorridor Selection
I-5 Lower Northbound 217 Southbound I-205 Northbound I-205 Southbound
Implemented February, 2006 November, 2005 December, 2005 December, 2005
Length of study section 17 miles 7 miles 19 miles 19 miles
Number of loops 51 24 46 46
Number of on-ramps (with loops) 16 12 9 18
Level of congestion: pre SWARM (duration, queue length, low speed)
(2-3 hrs, 6 miles, 25-35mph) (2-4 hrs, 4-6 miles, ~25mph) (2-3 hrs, 5 miles, ~30mph) (2 hrs, 4-6 miles, ~35mph)
Level of congestion: post SWARM (duration, queue length, low speed)
(2-3 hrs, 6 miles, 25-35mph) (2-4 hrs, 4 miles, ~25mph) (2-3 hrs, 5 miles, ~30mph) (2 hrs, 3-5 miles, ~40mph)
Queue contained within corridor? (pre SWARM, post SWARM)
AM: (Yes, Yes) PM: (Yes, Yes)
AM: (Yes, Yes) PM: (Not clear, Not clear)
AM: (Not clear, Not clear) PM: (Not clear, Not clear)
AM: (Yes, Yes) PM: (Yes, Yes)
Coverage of loop detectors (miles/loop station)
1.14 (max: 3.1) 0.74 (max: 1.2) 1.1 (max: 1.9) 1.46 (max:4.3)
Data quality (Avg % good readings, Min %)
(94.2, 21.8) (99.2, 98.9) (98.0, 94.8) (98.3, 85)
No. of Loops < 90% 3-7 0 0 1-2
Construction schedule Late summer of 2006
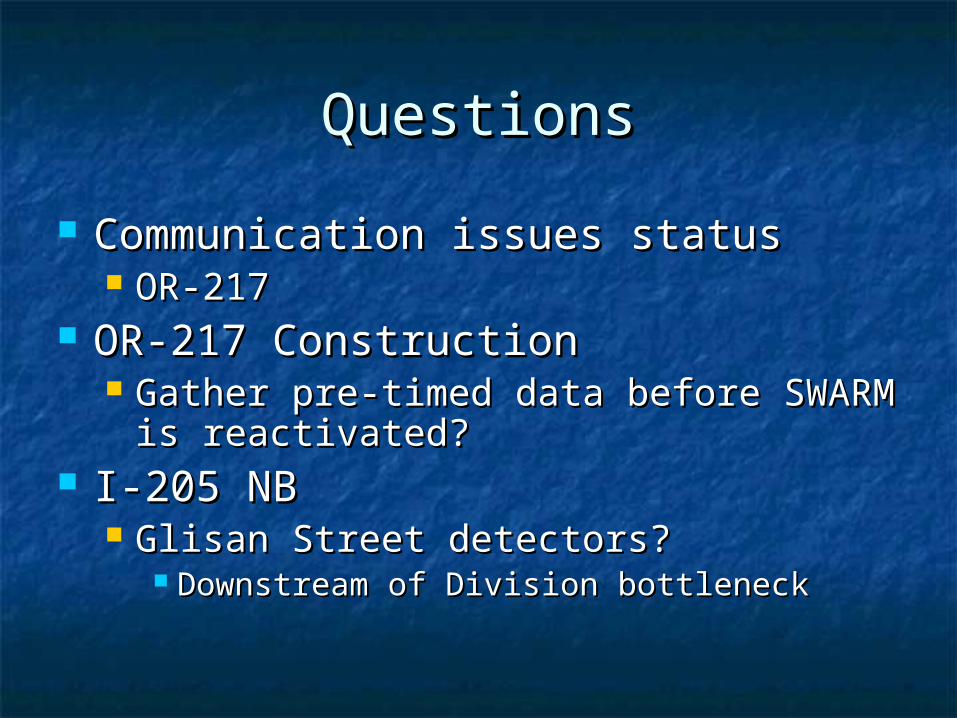
QuestionsQuestions
Communication issues statusCommunication issues status OR-217OR-217
OR-217 ConstructionOR-217 Construction Gather pre-timed data before SWARM is Gather pre-timed data before SWARM is
reactivated?reactivated? I-205 NBI-205 NB
Glisan Street detectors?Glisan Street detectors? Downstream of Division bottleneckDownstream of Division bottleneck
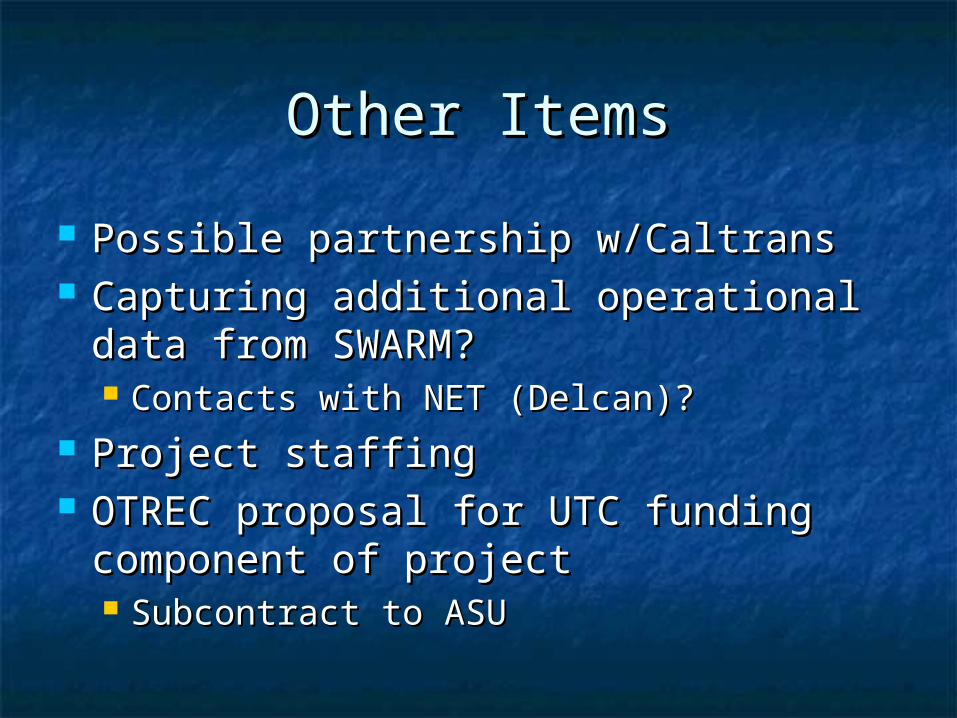
Other ItemsOther Items
Possible partnership w/CaltransPossible partnership w/Caltrans Capturing additional operational data Capturing additional operational data
from SWARM?from SWARM? Contacts with NET (Delcan)?Contacts with NET (Delcan)?
Project staffing Project staffing OTREC proposal for UTC funding OTREC proposal for UTC funding
component of projectcomponent of project Subcontract to ASUSubcontract to ASU
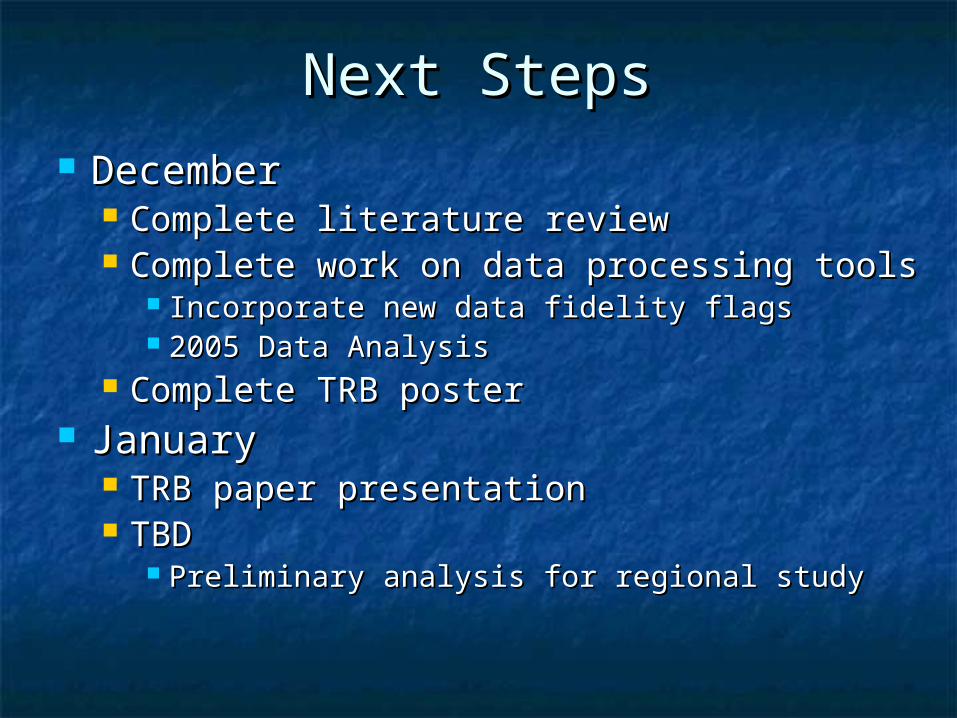
Next StepsNext Steps DecemberDecember
Complete literature reviewComplete literature review Complete work on data processing toolsComplete work on data processing tools
Incorporate new data fidelity flagsIncorporate new data fidelity flags 2005 Data Analysis2005 Data Analysis
Complete TRB posterComplete TRB poster JanuaryJanuary
TRB paper presentationTRB paper presentation TBDTBD
Preliminary analysis for regional studyPreliminary analysis for regional study
Next StepsNext Steps(from 7/06 meeting, for (from 7/06 meeting, for
reference)reference) Reasons for the increase in delayReasons for the increase in delay More analysis on on-rampsMore analysis on on-ramps
Total delay? – require counts at metersTotal delay? – require counts at meters Travel time (sampling frequency)Travel time (sampling frequency)
ReportReport
RecommendationsRecommendations (from 7/06, for reference) (from 7/06, for reference)
Data near bottleneck to measure Data near bottleneck to measure bottleneck discharge flowbottleneck discharge flow Video?Video?
Agree on performance measure for on-Agree on performance measure for on-rampsramps Total delay, queue length, queue spill-overTotal delay, queue length, queue spill-over All or selected on-rampsAll or selected on-ramps
Data collection method for on-rampsData collection method for on-ramps Video: time-consuming for total delayVideo: time-consuming for total delay